

Highlights
-
•
Breath analysis by mass spectrometry can distinguish patients with COPD from healthy controls.
-
•
From >3000 features, 1441 were further processed for data analysis and 43 markers were most discriminative.
-
•
Identified markers are metabolites from oxidative stress processes like fatty acids, aldehydes and amino acid-related compounds.
-
•
Selected breath features correlated with disease severity (FEV1 %predicted and FEV1/FVC ratio).
Abstract
Background
New mass spectrometry (MS) techniques analysing exhaled breath have the potential to better define airway diseases. Here, we present our work to profile the volatile organic compounds (VOCs) in exhaled breath from patients with chronic obstructive pulmonary disease (COPD), using real-time MS, and relate this disease-specific breath profile to functional disease markers.
Methods
In a matched cohort study, patients with COPD, according to GOLD criteria, were recruited. Exhaled breath analysis by untargeted MS was performed using secondary electrospray ionization – high-resolution MS (SESI-HRMS).
Results
Exhaled breath from 22 patients with COPD (mean age 58.6 ± 6.9 years, FEV1 58.5 ± 19.9% predicted, 32.4 ± 19.2 pack years smoking) and 14 controls (mean age 58.1 ± 8.1 years, FEV1 102.5 ± 11.3% predicted, 23.6 ± 12.5 pack years smoking) was analysed using SESI-HRMS. From 1441 different features, 43 markers were identified that allowed discrimination between the two groups with an accuracy of 89% (CI 74–97%), a sensitivity of 93%, and a specificity of 86%. The markers were determined to be metabolites of oxidative stress processes, such as fatty acids, aldehydes and amino acids, resulting from lung muscle degradation.
Conclusion
Real-time breath analysis by SESI-MS allows molecular profiling of exhaled breath, can distinguish patients with COPD from matched healthy controls and provides insights into the disease pathogenesis.
1. Introduction
Chronic obstructive pulmonary disease (COPD) is a leading cause of morbidity and mortality worldwide [1]. Diagnosis is currently based on fixed airflow limitation as measured by a combination of spirometry, respiratory symptoms and an appropriate history of exposure to risk factors [2]. However, COPD is a complex illness and establishing a diagnosis is sometimes difficult especially considering the numerous different presentations of the disease. Spirometry is effort-dependent and continuous training is required to ensure accurate disease assessment. Given these limitations, a diagnostic instrument other than spirometry would be desirable.
Apart from inorganic and non-volatile compounds, exhaled breath contains organic volatile compounds (VOCs). VOCs are produced either locally, within the respiratory tract, or systemically and then released through the blood-gas barrier during gas exchange. Studies analysing exhaled breath from COPD patients using gas chromatography-mass spectrometry [3], [4] or electronic noses [5], [6] have demonstrated that VOCs may be useful indicators for internal biochemical processes and serve as fast, non-invasive and easily accessible biomarkers in the diagnosis and monitoring of pulmonary diseases, in particular. The traditional analysis of gaseous-based metabolites, besides being time-consuming and labour-intensive, requires sample storage and pre-concentration. An alternative are chemical sensors, although, their poor chemical specificity does not allow for structural elucidation of the molecules imparting COPD-specific breath prints, thereby limiting their usefulness. In a recent exploratory study, we found a panel of discriminating mass-spectral features in a heterogeneous, non-matched COPD population using novel real-time mass spectrometry (MS) technology [7]. This technique, called secondary electrospray ionization MS (SESI-MS) [8], [9], [10], [11], has shown potential in the detection of an unprecedented number of metabolites in breath [12], [13], [14] and is expected to be a promising clinical diagnostic tool [15], [7], [16], [17], [18]. The aims of our current study were to validate our previous, exploratory findings regarding the detection and analysis of altered COPD metabolites exhaled in breath [19], to test the hypothesis that metabolites correlate with functional disease parameters, and to gain insight into biochemical processes in a well-characterized COPD population.
2. Methods
2.1. Design and subjects
This was a prospective, cross-sectional, matched cohort study. Study measurements encompassed a lung function test, a questionnaire survey and MS breath analysis. Patients aged 40–80 years with COPD were enrolled. A diagnosis of COPD was based on a fixed airway obstruction with a post-bronchodilator FEV1/FVC ratio <0.7 and appropriate symptoms, such as chronic cough, chronic sputum production or dyspnoea. Only non-frequent COPD patients (i.e., with <2 exacerbations during the last 12 months) were eligible. COPD patients with an exacerbation within the last 6 weeks were excluded. Subjects without chest symptoms, a pre-bronchodilator FEV1 > 80% predicted, a FEV1/FVC ratio >0.70 in spirometry and a negative history of any lung disease (i.e., asthma, sarcoidosis, history of lung cancer or any other active cancer) were eligible as controls. Ex-smokers were classified as having stopped smoking for at least 6 months before study participation. Participants filled out the COPD assessment test (CAT) and rated their dyspnoea on the modified Medical Research Council dyspnoea scale (mMRC). Participants were randomly assigned to measurement slots in order to prevent any bias due to instrument drift or circadian alterations in exhaled breath patterns. Exclusion criteria encompassed any renal replacement therapy or severe liver dysfunction. In case of a respiratory infection in control subjects, a 4-week recovery period was required. The study protocol was approved by the cantonal ethic committee of Zurich (KEK-ZH-Nr.2014-0088). The trial was conducted according to the Declaration of Helsinki and registered at ClinicalTrials.gov (NCT02186639). Written informed consent was obtained from all individuals.
2.2. Breath analysis
Before measurement, subjects were required to abstain from food, beverages (except water), tobacco, chewing-gum, and dental cleaning for at least one hour, and from inhalation therapy for at least 12 h if taken twice per day or 24 h if taken once per day. After a deep inspiration, subjects exhaled slowly with a pressure of 10 mbar into a heated sampling tube. This was repeated 6 times for 20 to 30 s each. The breath sample was analysed using a setup consisting of a heated sampling tube (stainless steel, length 50 cm, id 3 mm and 90 °C core temperature) that delivered the exhaled breath towards the analyzer, which was a purpose-built secondary electrospray ionization source coupled to a commercial, high-resolution quadrupole time-of-flight mass spectrometer (TripleTOF 5600+, AB Sciex, Concord, ON, Canada). The ion source and its method of connection to the analyzer have been previously described in detail [20], but, briefly, it consisted primarily of a nano electrospray system, a stainless steel reaction chamber and a backpressure vent. Study participants delivered 3 to 4 breath exhalations with a 10 to 15 s duration by maintaining a sample line pressure of approximately 10 to 12 mbar through a mouthpiece. The measurements were performed once in positive- and once in negative-ionization mode at +3.6 kV and −3.4 kV, respectively. The MS acquired the TOF mass spectra from m/z 40 to 450 with an accumulation time of 1 s. This setup allowed the measurement of breath in real-time without sample pre-treatment.
2.3. Molecule identification by mass spectrometry
Exhaled breath condensate (EBC) was sampled at random from selected subjects and used to perform compound identification according to the ERS/ATS statement [21]. In summary, subjects were required to exhale for 10 min during tidal breathing into a cooled glass trap (−78.5 °C) to sample 1 to 2 mL of EBC. The samples were analysed by UHPLC-HRMS and retention times were compared with those obtained from standards, where available. For analysis, EBC samples were thawed and kept at 5 °C. Ten microliters were transferred to chromatographic vials without dilution, or any other sample preparation procedure, and were injected into the ACQUITY UPLC system (Waters, Boston, MA, USA) where separation took place on a C18 ACQUITY column 2.1 mm × 100 mm, 1.7 μm, Waters, MA, USA). Chromatographic conditions were as follows: a 10 min gradient was set from 95/5% to 10/90% of a water/acetonitrile mixture modified with 0.1% formic acid. The chromatographic flow was set to 0.4 mL min−1 and the column was thermostatized at 25 °C.
The eluent from the column was introduced into an ION MAX electrospray ionization source (+4 kV). Nitrogen was used as sheath, auxiliary, and sweep gas at flow rates of 30, 10, and 2 (arbitrary units), respectively. The capillary temperature was set to 275 °C. Ions were introduced into a LTQ Orbitrap mass spectrometer (Thermo Fisher Scientific, Boston, MA, USA) working at a resolution of 30,000 at m/z 400. Spectra from m/z 50 to 2 000 were recorded. For MSn analyses, an isolation window of 1 μ was selected. The peak at 149.0233 (protonated phtalic anhydride) was used as internal lock mass, resulting in a working mass accuracy below 1 ppm.
In a second experimental series, the eluent from the column was introduced into the electrospray ionization probe of a DuoSpray ionization source (+5.5 kV/−4.5 kV). Nitrogen was used as Gas1, Gas2, and curtain gas at flow rates of 60, 40, and 30 (arbitrary units), respectively. The ion source temperature was set to 450 °C. Ions were introduced into a TripleTOF 5600+ (AB Sciex, Concord, Canada) mass spectrometer working at a resolution of 30000 at m/z 400. TOF MS spectra were recorded in positive and negative ion mode from m/z 40 to 600. Plasticizers present in room air were used for mass calibration, resulting in a working mass accuracy below 5 ppm. In addition, TOF-MS/MS spectra were recorded with an isolation window of 1 μ and collision energy of 30 V and a collision energy spread of ±15 V (starting condition). High sensitivity TOF-MS/MS mode was used for the fragmentation experiments.
2.4. Data analysis
The acquired data was pre-processed, including mass calibration and normalization (see online supplementary file for more details). A non-parametric Whitney-Mann U test was used to identify between-group differences in the subject’s breath pattern. P values were corrected by estimating false discovery rates and calculating q-values with Storey’s procedure [22]. The statistical significance level was set to q < 0.05. Breath signal correlations to the FEV1 (% predicted) and FEV1/FVC ratio were analysed using a linear fit model with robust bisquare weighting, and calculating Pearson’s correlation coefficients and their related 95% confidence intervals (5000 bootstrap samples). The correlation significance level was set to q < 0.05. The most discriminant features were selected with relaxed elastic net classification within a leave-one-out cross-validation. Furthermore, the common resulting features from the four tests were subjected to a principal component analysis for visual inspection. Data was analysed with PeakView 2.2 (AB Sciex, Concord, Canada), Matlab 2015a (MathWorks, Natick, MA, USA) and RStudio 0.99.486 (RStudio Inc., Boston, MA, USA) (see online supplementary file for more details).
3. Results
3.1. Trial profile and patient characteristics
In total, 22 patients with COPD and 22 controls were included in the study, although 8 of the controls were eliminated due to ion suppression caused by the presence of cosmetics (i.e., lip stick). Following the interference from cosmetics the protocol was adapted to restrict their use during measurement. Baseline characteristics of the two groups are shown in Table 1. The two groups were balanced according to age, smoking state, pack-years and body mass index (BMI). Unexpectedly, there were more women in the control group compared to the COPD group. In the COPD group, FEV1 and FVC were lower and patients had a higher CAT and higher mMRC score (p < 0.005). Concerning COPD severity, 4 patients suffered from COPD GOLD stage 1, 10 from stage 2, 7 from stage 3 and 1 from stage 4. More patients with COPD suffered from arterial hypertension (n = 8) compared to controls (n = 3); all were on antihypertensive medication (Table 2).
Table 1.
Characteristics of participants.
| COPD, n = 22 | Controls, n = 14 | p-value | |
|---|---|---|---|
| Age, years | 58.6 ± 6.9 | 58.1 ± 8.1 | 0.82 |
| Male/female | 17/5 | 5/9 | |
| Smoking state: non/ex/current |
1/11/10 | 1/8/5 | |
| Pack years | 32.4 ± 19.2 | 23.6 ± 12.5 | 0.14 |
| FEV1* (L) | 1.84 ± 0.62 | 3.1 ± 0.7 | <0.001 |
| FEV1% predicted | 58.5 ± 19.9 | 102.5 ± 11.3 | <0.001 |
| FVC (L) | 3.5 ± 0.8 | 3.96 ± 0.76 | 0.03 |
| FVC% predicted | 88.8 ± 19.7 | 107.7 ± 16.8 | 0.001 |
| FEV1/FVC ratio | 51.8 ± 10.9 | 77.8 ± 3.8 | <0.001 |
| GOLD grade 1/2/3/4 | 4/10/7/1 | NA | |
| BMI (kg/m2) | 27.7 ± 6 | 25.8 ± 4.5 | 0.32 |
| mMRC | 1.1 ± 1 | 0 | 0.001 |
| CAT | 12.7 ± 6.1 | 3.1 ± 3 | <0.001 |
Mean ± SD. mMRC = modified Medical Research Council scale. Ex-smokers were required to have quit smoking at least 6 months before study entry. * post-bronchodilation in patients with COPD.
Table 2.
Regular medication intake.
| COPD N = 22 |
controls N = 14 |
|
|---|---|---|
| Short-acting β2-agonist (SABA) | – | – |
| Long-acting β2-agonist (LABA) | 9 | – |
| Long-acting anti-muscarinic-agent (LAMA) | 14 | – |
| Inhaled corticosteroid (ICS) | 10 | – |
| Antihypertensive medication | 8 | 3 |
| β-blocker | 3 | 1 |
| calcium channel blocker | 2 | – |
| ACE-inhibitor | 4 | 1 |
| AT-2-antagonist | 4 | 1 |
| Antidiabetic medication | 1 | – |
| Lipid-lowering therapy (statin) | 5 | 1 |
| Long-term oxygen | 1 | – |
3.2. Breath analysis
3.2.1. COPD-specific breath pattern and association with disease severity
Exhaled breath patterns from healthy controls and COPD patients showed distinct differences. From 1441 analysed features, 301 statistically significant features were discovered in a between-group comparison, among which 159 features showed an increase and 142 a decrease in patients’ breath (see online supplementary Table E1 for statistical detail). Fig. 1 shows breath exhalations and a between-group comparison for one selected molecule (i.e., 2-hydroxyisobutyric acid) that is enhanced in COPD patients (see online supplementary Fig. E1 for more examples). Furthermore, selected breath features were found to be associated with disease severity based on a correlation analysis with two standard lung function parameters. 128 and 266 features significantly correlated with the subject’s FEV1 (% predicted) and FEV1/FVC ratio values, respectively, with correlation coefficients ranging from −0.65 to 0.61 and −0.70 to 0.67, respectively (see online supplementary Tables E2 and E3 for more statistical details). The correlation plots for one molecule (i.e., 11-hydroxyundecanoic acid) are presented in Fig. 2. Additional examples are shown in online supplementary Figs. E2 and E3. The presence of COPD was predicted by performing a leave-one-out cross-validation, based on the 43 most discriminating features selected by a relaxed-elastic net classification, and demonstrated an accuracy of 89% (CI: 74% to 97%), a sensitivity of 93% and a specificity of 87% (Table 3 and online supplementary Table E4). The receiver operating characteristics are shown in Fig. 3 and resulted in an area under the ROC curve of 0.92.
Fig. 1.

Real-time breath analysis (left boxes): breath signal time traces of 2-hydroxyisubutyric acid for a healthy control and a COPD Patient. Signal intensity from patient was enhanced in comparison to the ones from the healthy control. Between-group comparison (right box): the plot shows 2-Hydroxyisubutyric acid breath intensities (mean) for all study participants, highlighting a distinct difference between groups (q = 0.02). Per group, the breath signal mean (white, middle line) with 95% confidence interval (white, inner boxes) and one standard deviation (grey, outer boxes) are presented.
Fig. 2.

11-hydroxyundecanoic acid breath signal correlations with the two lung function parameters FEV1 (% predicted) respectively FEV1/FVC ratio from all study participants. The breath signal intensities show a significant correlation (q = 0.04 respectively q = 0.02) with positive correlation coefficients r = 0.48 resp. 0.48. 11-hydroxyundecanoic acid is in COPD patients less abundant than in healthy controls.
Table 3.
Diagnostic accuracy of exhaled breath analysis in COPD. Summary of the leave-one-out cross-validation performance: accuracy 89% (CI 74–97%), sensitivity 93%. specificity 87%, positive predictive value 81%, negative predictive value 95%.
| Prediction | ||||
| COPD | No COPD | total | ||
| Condition | COPD | 19 | 3 | 22 |
| No COPD | 1 | 13 | 14 | |
| total | 20 | 16 | 36 | |
Fig. 3.
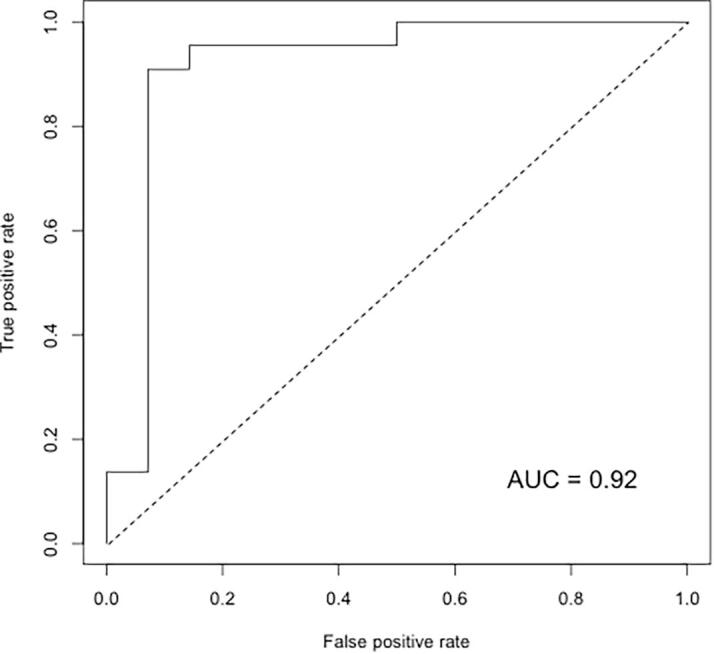
Plot of the receiver operating characteristics of the prediction power from a subset of 43 compounds selected by relaxed elastic net classification within a leave-one-out cross-validation. The area under the curve shows a coverage rate of 0.92.
3.2.2. Chemical identification of COPD-specific breath compounds
The features considered to be most important in assembling a predictive model were selected by correlating differential breath pattern features with two lung function parameters. From this analysis, 14 features were found in common among the four sub-groups and were subjected to further compound identification (Fig. 4 and supplementary Table E5). 10 of the 14 features were chemically identified and are shown in Table 4; most of the compounds are associated with chemical families (i.e., aldehydes and fatty acids). All 14 features were subjected to a principal component analysis to better visualize their predictive value. Fig. 5 shows the first two principal components with a clear separation between healthy controls and COPD patients, except for one negative control outlier that localized to the COPD space.
Fig. 4.

Venn diagram summarizing the statistical analysis of 1441 features received from raw data. 301 features were significantly different between patients and controls. 128 respectively 266 features show a significant correlation with FEV1 (% predicted) resp. FEV1/FVC ratio. 43 features were identified as classifiers for the prediction based on relaxed elastic net selection. 14 compounds were found to represent significant characteristics from all four tests.
Table 4.
Identified exhaled metabolites that change with the presence of COPD. Summary of the chemical identify of the most relevant biomarkers with key statistical information from between-group comparisons, correlation with two lung function biomarkers and their selection rate during leave-one-out cross-validation (LOOCV).
| Breath signal features |
Between-groups changes (n = 36) |
Correlation with FEV1 (% predicted) |
Correlation with FEV1/FVC ratio |
Classifi-cation/LOOCV |
|||||||
|---|---|---|---|---|---|---|---|---|---|---|---|
| Molecular formula | Tentative ID | Mean difference | 95% CI | q | r | 95% CI | q | r | 95% CI | q | Selection rate (eff./max.) |
| C5H5N | Pyridine | -0.333 | −0.560/−0.105 | 0.020 | 0.46 | 0.11/0.67 | 0.049 | 0.54 | 0.24/0.70 | 0.014 | 21/36 |
| C4H8O3 | 2-hydroxyisobutyric acid | 0.031 | 0.010/0.052 | 0.021 | −0.47 | −0.78/−0.22 | 0.043 | −0.46 | −0.66/−0.2 | 0.025 | 20/36 |
| C4H7NO3 | Aspartic acid semialdehyde | 0.010 | 0.003/0.016 | 0.029 | −0.43 | −0.67/−0.02 | 0.049 | −0.48 | −0.71/−0.17 | 0.022 | 20/36 |
| C6H10O4 | Acetohydroxybutanoic acid | 0.005 | 0.002/0.009 | 0.023 | −0.51 | −0.76/0.12 | 0.038 | −0.52 | −0.76/−0.22 | 0.015 | 34/36 |
| C11H22O3 | 11-hydroxyundecanoic acid | −0.005 | −0.008/−0.002 | 0.023 | 0.48 | 0.22/0.72 | 0.043 | 0.48 | 0.16/0.69 | 0.023 | 22/36 |
| C7H16N4O3 | (+)-γ-hydroxy-L-homoarginine | −0.003 | −0.004/−0.001 | 0.033 | 0.48 | 0.17/0.71 | 0.048 | 0.45 | 0.15/0.65 | 0.035 | 35/36 |
| C14H24O3 | Oxo-tetradecenoic acid | −0.003 | −0.006/−0.001 | 0.037 | 0.42 | 0.13/0.68 | 0.049 | 0.40 | −0.02/0.63 | 0.041 | 24/36 |
| C16H26O2 | Hexadecatrienoic acid | −0.012 | −0.016/−0.007 | 0.017 | 0.51 | 0.15/0.74 | 0.037 | 0.64 | 0.36/0.80 | < 0.001 | 36/36 |
| C17H32O3 | Oxo-heptadecanoic acid | −0.012 | −0.017/−0.006 | 0.017 | 0.45 | 0.28/0.63 | 0.044 | 0.47 | 0.25/0.66 | 0.023 | 33/36 |
| C5H4O3 | 2-oxoglutaric acid semialdehyde | 0.014 | 0.006/0.023 | 0.017 | −0.46 | −0.68/−0.18 | 0.044 | −0.45 | −0.66/−0.12 | 0.027 | 20/36 |
Fig. 5.
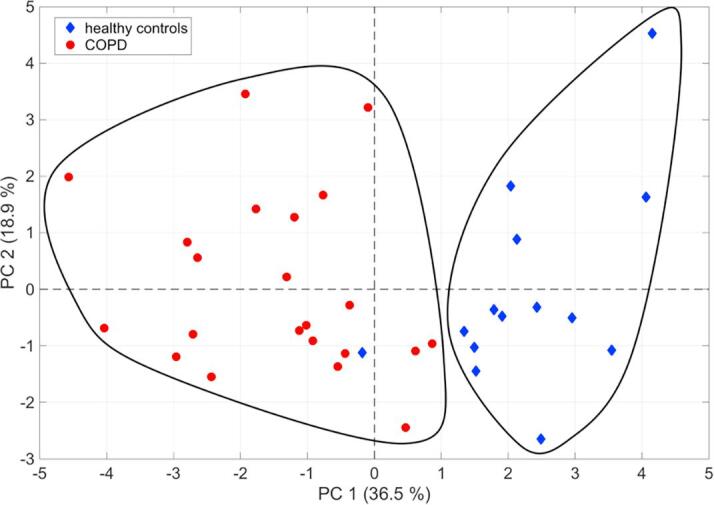
Plot showing the first two principal components of a principal component analysis based on the breath signal intensities from the 14 highest scoring compounds found during statistical analysis. About 55.4% of the variance can be explained with the first two principal components. The two black-lined areas show the separation of healthy controls and COPD subjects, the last one incorporating one healthy control.
4. Discussion and conclusions
Here, we utilize SESI-HRMS and SESI-HRMS/MS to explore COPD-related VOCs in exhaled breath by comparing metabolite patterns from the breath of healthy controls and COPD patients. Our technique additionally provided information about breath metabolite concentrations, which were found to correlate with the FEV1 (% predicted) and FEV1/FVC ratio.
Lung function testing is the current gold standard for COPD diagnosis. This testing modality provides information on the lung's physical properties (e.g., flow restrictions), but it does not deliver information to help gain insight into the biochemical processes that are responsible for, or associated with, COPD. In addition, the technique requires a demanding exhalation procedure that can be challenging for children and the elderly. In contrast, SESI-HRMS provides biochemical information in combination with an easy-to-maintain exhaled breath sampling procedure that is suitable even for people with a severe lung impairment.
We found here that metabolites associated with the breath of COPD patients, which we identified, are grouped in chemical classes (i.e., fatty acids, aldehydes and amino acid-related compounds). In addition, 30 features were identified to have the same mass overlap as those found to be significant in our previous COPD study [7]. This fact support the method’s robustness and quality provided by the analysis of this study cohort.
Fatty acids are metabolites that have been suggested to be altered in lung disease [23], and which are efficiently captured by SESI-MS [24]. We found here that the levels of a number of fatty acids decreased in the breath of patient’s with COPD. These compounds (i.e., 11-hydroxyundecanoic acid, oxoheptadecanoic acid and dodecanedioic acid) are associated with oxidative, nitrosative and carbonyl stress processes produced by inflammatory processes in COPD diseased lungs [25]. Additionally, aspartic acid semialdehyde and 2-oxoglutaric acid semi-aldehyde, which are also related to oxidative stress processes, were significantly elevated. The decreased presence of the fatty acids and increased presence of aldehydes could be explained by the process of lipid peroxidation occurring secondary to oxidative stress and inflammation, which has been shown to be characteristic of COPD [26].
We also found amino acids and related compounds (i.e., 2-hydroxyisobutyric acid and (+)-γ-hydroxy-L-homoarginine) to be important in predicting breath as being from a COPD patient. Studies examining the biochemical processes in COPD have revealed a degradation of lung pulmonic muscles and increased levels of muscle-building molecules, like amino acids. This degradation has been correlated to advanced disease severity [27], [28], [29].
To minimize the influence of exhaled biomarkers not related to COPD, patients were asked to refrain from smoking, eating, drinking (except water) and tooth brushing prior to breath analysis. Furthermore, they were not allowed to take inhalation therapy before the measurement. These efforts were intended to minimize signals, unrelated to the disease state, from outside sources. Although we cannot exclude the effect of concomitant medications (e.g., antihypertensive or anti-diabetic therapy) or co-existing disorders on exhaled breath pattern [30], patients with other respiratory disorders (e.g., acute respiratory infection, lung fibrosis or sarcoidosis) were excluded, as well as patients suffering from active cancer [31], [32].
A limitation of our study was the small sample size. We believe this deficiency was ameliorated by using matched controls and applying a leave-one-out cross-validation procedure for the determination of the predictive power. Only infrequent exacerbators were included and 77% of all COPD patients were assessed as GOLD class 2 or 3; hence, the study covered primarily moderate to severe COPD cases. We recommend that future studies address the phenotypic complexity of the disease and pursue stratification of disease severity. Additionally, biomarkers we report here should be validated in a cohort of patients suffering from symptoms of obstructive lung disease with the goal of differentiating COPD from asthma or other obstructive lung disorders.
In summary, we have shown SESI-HRMS to be a powerful diagnostic tool for exploration of COPD-specific compounds in exhaled breath. and that the results from these studies can be used, to obtain insights into some of the biochemical processes that are involved in COPD pathogenesis.
Summary of the “take home message”
In this case-control study we analysed exhaled breath in patients with chronic obstructive pulmonary disease (CODP) and healthy controls using an untargeted metabolomics approach. Over 3’000 compounds were measured in real-time with an ambient mass spectrometric technique and the most discriminating features were identified. We were able to predict COPD with an accuracy of 89% (CI 74–97%). In addition, it was possible to elucidate compounds which intensities correlate with the subjects’ FEV1 (% predicted) and FEV1/FVC ratio. The ambient MS approach enables fast analysis of COPD related compounds in exhaled breath and could support the existing diagnostic tools in the future.
Ethics approval
Cantonal Ethics Committee of Zurich.
Acknowledgment
We are indebted to Dr. Juan Zhang (Novartis) for the donation of the LTQ Orbitrap mass spectrometer. This work is part of the Zurich Exhalomics project under the umbrella of University Medicine Zurich/Hochschulmedizin Zürich.
Contributors
Conception and design: MK, YNO, LB, PMLS, RZ. Data acquisition: LB, YN, TG, DGG and NS. Analysis and interpretation of data: LB, YN, PMLS, YS and DGG. Drafting the article: LB, YN, PMLS, MK and RZ. Revising the article for important intellectual content and final approval: All authors.
Competing Interests
None.
Funding
This research was supported by the Swiss National Science Foundation (LB/149617) and a Marie Curie European Reintegration Grant (PMLS) within the 7th European Community Framework Program (276860).
Glossary
- COPD
chronic obstructive lung disease
- FEV1
forced expiratory volume in 1 second
- FVC
forced vital capacity
- GOLD
Global Initiative for Obstructive Lung Disorders
- SESI-HRMS
secondary electrospray ionization – high-resolution mass spectrometry
Footnotes
Supplementary data associated with this article can be found, in the online version, at https://doi.org/10.1016/j.clinms.2018.02.003.
Appendix A. Supplementary data
Supplementary Figure 1.

Supplementary Figure 2.

Supplementary Figure 3.

References
- 1.The World Health Report 2000. The World Health Organization 2000.
- 2.Pauwels R.A., Buist A.S., Calverley P.M., Jenkins C.R., Hurd S.S. GOLD Scientific Committee. Global strategy for the diagnosis, management, and prevention of chronic obstructive pulmonary disease. NHLBI/WHO Global Initiative for Chronic Obstructive Lung Disease (GOLD) Workshop summary. Am. J. Respir. Crit. Care Med. 2001:1256–1276. doi: 10.1164/ajrccm.163.5.2101039. American Thoracic SocietyNew York, NY. [DOI] [PubMed] [Google Scholar]
- 3.Phillips C.O., Syed Y., Mac Parthaláin N., Zwiggelaar R., Claypole T.C., Lewis K.E. Machine learning methods on exhaled volatile organic compounds for distinguishing COPD patients from healthy controls. J. Breath Res. 2012;6:036003. doi: 10.1088/1752-7155/6/3/036003. [DOI] [PubMed] [Google Scholar]
- 4.Van Berkel J.J.B.N., Dallinga J.W., Möller G.M., Godschalk R.W.L., Moonen E.J., Wouters E.F.M., Van Schooten F.J. A profile of volatile organic compounds in breath discriminates COPD patients from controls. Respir. Med. 2010;104:557–563. doi: 10.1016/j.rmed.2009.10.018. [DOI] [PubMed] [Google Scholar]
- 5.Fens N., Roldaan A.C., Van der Schee M.P., Boksem R.J., Zwinderman A.H., Bel E.H., Sterk P.J. External validation of exhaled breath profiling using an electronic nose in the discrimination of asthma with fixed airways obstruction and chronic obstructive pulmonary disease. Clin. Exp. Allergy. 2011;41:1371–1378. doi: 10.1111/j.1365-2222.2011.03800.x. [DOI] [PubMed] [Google Scholar]
- 6.Fens N., de Nijs S.B., Peters S., Dekker T., Knobel H.H., Vink T.J., Willard N.P., Zwinderman A.H., Krouwels F.H., Janssen H.-G., Lutter R., Sterk P.J. Exhaled air molecular profiling in relation to inflammatory subtype and activity in COPD. Eur. Respir. J. 2011;38:1301–1309. doi: 10.1183/09031936.00032911. [DOI] [PubMed] [Google Scholar]
- 7.Schwarz E.I., Martinez-Lozano Sinues P., Bregy L., Gaisl T., Garcia Gomez D., Gaugg M.T., Suter Y., Stebler N., Nussbaumer-Ochsner Y., Bloch K.E., Stradling J.R., Zenobi R., Kohler M. Effects of CPAP therapy withdrawal on exhaled breath pattern in obstructive sleep apnoea. Thorax. 2016;71:110–117. doi: 10.1136/thoraxjnl-2015-207597. [DOI] [PubMed] [Google Scholar]
- 8.Wu C., Siems W.F., Hill H.H. Secondary electrospray ionization ion mobility spectrometry/mass spectrometry of illicit drugs. Anal. Chem. 2000;72:396–403. doi: 10.1021/ac9907235. [DOI] [PubMed] [Google Scholar]
- 9.Barrios-Collado C., Vidal-de-Miguel G., Martinez-Lozano Sinues P. Numerical modeling and experimental validation of a universal secondary electrospray ionization source for mass spectrometric gas analysis in real-time. Sens. Actuat. B. 2016;223:217–225. [Google Scholar]
- 10.Dillon L.A., Stone V.N., Croasdell L.A., Fielden P.R., Goddard N.J., Thomas C.L.P. Optimisation of secondary electrospray ionisation (SESI) for the trace determination of gas-phase volatile organic compounds. Analyst. 2010;135:306–314. doi: 10.1039/b918899a. [DOI] [PubMed] [Google Scholar]
- 11.Aernecke M.J., Mendum T., Geurtsen G., Ostrinskaya A., Kunz R.R. Vapor Pressure of Hexamethylene Triperoxide Diamine (HMTD) estimated using secondary electrospray ionization mass spectrometry. J. Phys. Chem. A. 2015;119:11514–11522. doi: 10.1021/acs.jpca.5b08929. [DOI] [PubMed] [Google Scholar]
- 12.Gaugg M.T., Gomez D.G., Barrios-Collado C., Vidal-de-Miguel G., Kohler M., Zenobi R., Sinues P.M.-L. Expanding metabolite coverage of real-time breath analysis by coupling a universal secondary electrospray ionization source and high resolution mass spectrometry—a pilot study on tobacco smokers. J. Breath Res. 2016;10 doi: 10.1088/1752-7155/10/1/016010. 016010. [DOI] [PubMed] [Google Scholar]
- 13.Martínez-Lozano P., la Mora de JF Electrospray ionization of volatiles in breath. Int. J. Mass Spectrom. 2007;265:68–72. [Google Scholar]
- 14.Reynolds J.C., Jimoh M.A., Guallar-Hoyas C., Creaser C.S., Siddiqui S., Thomas C.L.P. Analysis of human breath samples using a modified thermal desorption: gas chromatography electrospray ionization interface. J. Breath Res. 2014;8:037105. doi: 10.1088/1752-7155/8/3/037105. [DOI] [PubMed] [Google Scholar]
- 15.Sinues P.M.-L., Landoni E., Miceli R., Dibari V.F., Dugo M., Agresti R., Tagliabue E., Cristoni S., Orlandi R. Secondary electrospray ionization-mass spectrometry and a novel statistical bioinformatic approach identifies a cancer-related profile in exhaled breath of breast cancer patients: a pilot study. J. Breath Res. 2015;9 doi: 10.1088/1752-7155/9/3/031001. 031001. [DOI] [PubMed] [Google Scholar]
- 16.Zhu J., Hill J.E. Detection of Escherichia coli via VOC profiling using secondary electrospray ionization-mass spectrometry (SESI-MS) Food Microbiol. 2013;34:412–417. doi: 10.1016/j.fm.2012.12.008. [DOI] [PMC free article] [PubMed] [Google Scholar]
- 17.Zhu J., Bean H.D., Jiménez-Díaz J., Hill J.E. Secondary electrospray ionization-mass spectrometry (SESI-MS) breathprinting of multiple bacterial lung pathogens, a mouse model study. J. Appl. Physiol. 2013;114:1544–1549. doi: 10.1152/japplphysiol.00099.2013. [DOI] [PMC free article] [PubMed] [Google Scholar]
- 18.Ballabio C., Cristoni S., Puccio G., Kohler M., Sala M.R., Brambilla P., Sinues P.M.-L. Rapid identification of bacteria in blood cultures by mass-spectrometric analysis of volatiles. J. Clin. Pathol. 2014;67 doi: 10.1136/jclinpath-2014-202301. jclinpath–2014–202301–746. [DOI] [PubMed] [Google Scholar]
- 19.Martinez-Lozano Sinues P., Meier L., Berchtold C., Ivanov M., Sievi N., Camen G., Kohler M., Zenobi R. Breath analysis in real time by mass spectrometry in chronic obstructive pulmonary disease. Respiration. 2014;87:301–310. doi: 10.1159/000357785. [DOI] [PubMed] [Google Scholar]
- 20.Bregy L., Müggler A.R., Martinez-Lozano Sinues P., Garcia Gomez D., Suter Y., Belibasakis G.N., Kohler M., Schmidlin P.R., Zenobi R. Differentiation of oral bacteria in in vitro cultures and human saliva by secondary electrospray ionization – mass spectrometry. Sci. Rep. 2015;5:15163. doi: 10.1038/srep15163. [DOI] [PMC free article] [PubMed] [Google Scholar]
- 21.Horváth I., Hunt J., Barnes P.J., Alving K., Antczak A., Baraldi E., Becher G., van Beurden W.J.C., Corradi M., Dekhuijzen R., Dweik R.A., Dwyer T., Effros R., Erzurum S., Gaston B., Gessner C., Greening A., Ho L.P., Hohlfeld J., Jöbsis Q., Laskowski D., Loukides S., Marlin D., Montuschi P., Olin A.C., Redington A.E., Reinhold P., van Rensen E.L.J., Rubinstein I., et al. Exhaled breath condensate: methodological recommendations and unresolved questions. Eur. Respir. J. 2005 doi: 10.1183/09031936.05.00029705. [DOI] [PubMed] [Google Scholar]
- 22.Storey J.D. A direct approach to false discovery rates. J. R. Stat. Soc.: Series B (Statist. Methodol.) 2002;64:479–498. [Google Scholar]
- 23.Smith D., Sovová K., Dryahina K., Doušová T., Dřevínek P., Španěl P. Breath concentration of acetic acid vapour is elevated in patients with cystic fibrosis. J. Breath Res. 2016;10:021002. doi: 10.1088/1752-7155/10/2/021002. [DOI] [PubMed] [Google Scholar]
- 24.Martínez-Lozano P., la Mora de J.F. Direct analysis of fatty acid vapors in breath by electrospray ionization and atmospheric pressure ionization-mass spectrometry. Anal. Chem. 2008;80:8210–8215. doi: 10.1021/ac801185e. [DOI] [PubMed] [Google Scholar]
- 25.Kirkham P.A., Barnes P.J. Oxidative stress in COPD. Chest. 2013;144:266–273. doi: 10.1378/chest.12-2664. [DOI] [PubMed] [Google Scholar]
- 26.Rahman I. Oxidative stress in pathogenesis of chronic obstructive pulmonary disease: cellular and molecular mechanisms. Cell Biochem Biophys. 2005;43(1):167–188. doi: 10.1385/CBB:43:1:167. [DOI] [PubMed] [Google Scholar]
- 27.Engelen M.P.K.J., Schols A.M.W.J. Altered amino acid metabolism in chronic obstructive pulmonary disease: new therapeutic perspective? Curr. Opin. Clin. Nutr. Metab. Care. 2003;6:73. doi: 10.1097/00075197-200301000-00011. [DOI] [PubMed] [Google Scholar]
- 28.Ubhi B.K., Cheng K.K., Dong J., Janowitz T., Jodrell D., Tal-Singer R., MacNee W., Lomas D.A., Riley J.H., Griffin J.L., Connor S.C. Targeted metabolomics identifies perturbations in amino acid metabolism that sub-classify patients with COPD. Mol. BioSyst. 2012;8:3125–3133. doi: 10.1039/c2mb25194a. [DOI] [PubMed] [Google Scholar]
- 29.Ubhi B.K., Riley J.H., Shaw P.A., Lomas D.A., Tal-Singer R., MacNee W., Griffin J.L., Connor S.C. Metabolic profiling detects biomarkers of protein degradation in COPD patients. Eur. Respir. J. 2012;40:345–355. doi: 10.1183/09031936.00112411. [DOI] [PubMed] [Google Scholar]
- 30.Greiter M.B., Keck L., Siegmund T., Hoeschen C., Oeh U., Paretzke H.G. Differences in exhaled gas profiles between patients with type 2 diabetes and healthy controls. Diab. Technol. Ther. 2010;12:455–463. doi: 10.1089/dia.2009.0181. [DOI] [PubMed] [Google Scholar]
- 31.Patterson S.G., Bayer C.W., Hendry R.J., Sellers N., Lee K.S., Vidakovic B., Mizaikoff B., Gabram-Mendola S.G.A. Breath analysis by mass spectrometry: a new tool for breast cancer detection? Am. Surg. 2011;77:747–751. [PubMed] [Google Scholar]
- 32.Song G., Qin T., Liu H., Xu G.-B., Pan Y.-Y., Xiong F.-X., Gu K.-S., Sun G.-P., Chen Z.-D. Quantitative breath analysis of volatile organic compounds of lung cancer patients. Lung Cancer. 2010;67:227–231. doi: 10.1016/j.lungcan.2009.03.029. [DOI] [PubMed] [Google Scholar]
Associated Data
This section collects any data citations, data availability statements, or supplementary materials included in this article.