Abstract
α-Glucosidase enzyme inhibition is a legitimate approach to combat type 2 diabetes mellitus as it manages to control postprandial hyperglycemia. In this pursuit, a literature search identified quinoline-based molecules as potential α-glucosidase inhibitors. Thus our intended approach is to identify pharmacophoric features responsible for the α-glucosidase inhibition. This was achieved by performing, ligand-based pharmacophore modeling, 3D QSAR model development, pharmacophore-based screening of a rationally designed quinoline-based benzohydrazide Schiff base library, identifying, synthesizing and characterizing molecules (6a–6j) by IR, (1H and 13C) NMR, and mass studies. Further, these molecules were evaluated for α-glucosidase and α-amylase inhibitory potential. Compound 6c was found to inhibit α-glucosidase enzyme with an IC50 value of 12.95 ± 2.35 μM. Similarly, compound 6b was found to have an IC50 value of 19.37 ± 0.96 μM as compared to acarbose (IC50: 32.63 ± 1.07 μM); the inhibitory kinetics of compounds 6b and 6c revealed a competitive type of inhibition; the inhibitory effect can be attributed to its mapped pharmacophoric feature and model validation with a survival score of 5.0697 and vector score of 0.9552. The QSAR model showed a strong correlation with an R2 value of 0.96. All the compounds (6a–6j) showed no toxicity in L929 cell lines by the MTT assay method. Further, the binding orientation and stability of the molecules were assessed using molecular docking studies and MD trajectory analysis. The energy profile of the molecules with protein as a complex and molecules alone was evaluated using MM/GBSA and DFT calculations, respectively; finally, the pharmacokinetic profile was computed using ADMET analysis.
α-Glucosidase enzyme inhibition is a legitimate approach to combat type 2 diabetes mellitus as it manages to control postprandial hyperglycemia.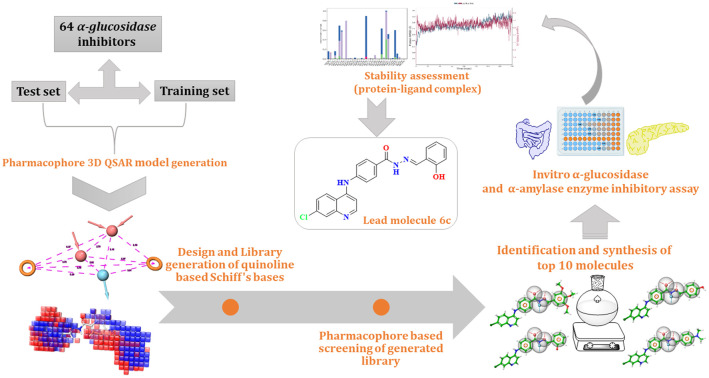
Introduction
Diabetes mellitus type 2 (T2DM) is a chronic metabolic condition characterized by high blood glucose levels caused by insulin resistance and insufficient insulin production. It is a major global health concern, with a rising incidence globally.
T2DM is frequently linked to lifestyle variables such as sedentary lifestyle, obesity, and poor diet, making it a complicated and multifaceted illness.1–3 Therapeutic targets involved in managing T2DM are the peroxisome proliferator-activated receptor (PPAR-γ), dipeptidyl peptidase-4 inhibitors (DPP-4), protein tyrosine phosphatase inhibitors (PTP1B), sodium-glucose transport protein 2 (SGLT-2) and α-glucosidase and α-amylase inhibitors.4
The α-glucosidase enzyme present in the brush border of the small intestine regulates the conversion of oligosaccharides, trisaccharides, and disaccharides into simple monosaccharides like glucose.5 Similarly, α-amylase present in epithelial cells catalyzes the breaking of oligosaccharides into simple sugars which are then spiked into the bloodstream indicating postprandial hyperglycemia.6 Thus, targeting these two enzymes provides a therapeutic approach to managing elevated blood glucose levels by delaying digestion and glucose uptake. Presently marketed inhibitors are N-heterocyclic carbasugars such as acarbose, miglitol, and voglibose. These molecules at the binding site act as a competitive inhibitor for the substrate. Furthermore, these molecules have been reported to possess gastrointestinal adverse effects such as flatulence, diarrhoea, abdominal discomfort, and sub-optimal efficacy. Thus, to address any of the above conditions there exists a need to develop new α-amylase and α-glucosidase inhibitors.7–9
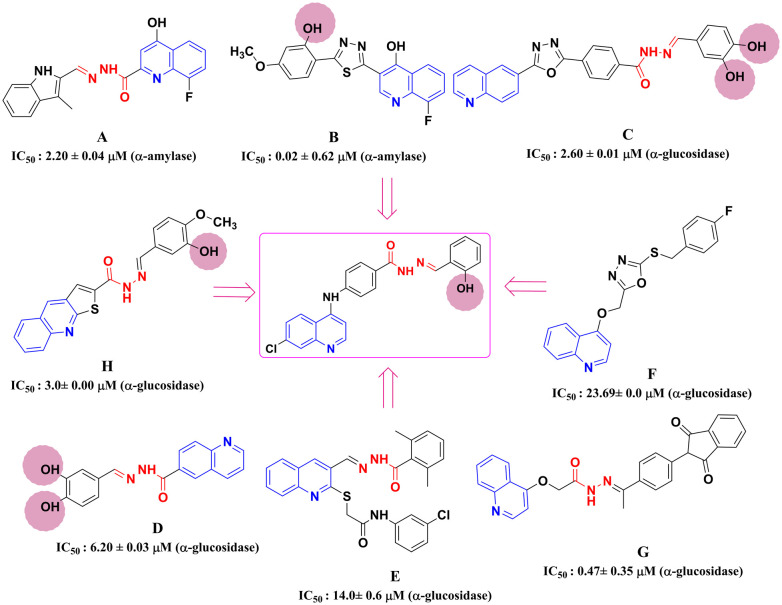
The quinoline scaffold is well-known as a building block in medicinal chemistry for its reported broad spectrum of activities which include antimalarial, antitubercular, anticancer, anti-leishmanial, antibacterial, antifungal, antiviral, anti-inflammatory, and antioxidant properties.10–14 Recently, reported studies also suggest that quinoline-containing scaffolds were evaluated for their antidiabetic properties targeting α-amylase and α-glucosidase. Some examples include, compounds A and B showing α-amylase inhibitory activity as compared to acarbose with IC50 values of 2.20 ± 0.04 μM and 0.02 ± 0.62 μM, respectively.15,16 Other compounds like compounds C, D, E, F, G, and H displayed α-glucosidase inhibitory activity as compared to standard acarbose with IC50 values of 2.60 ± 0.01 μM, 6.20 ± 0.03 μM, 14.01 ± 0.6 μM, 26.69 ± 0.6 μM, 0.47 ± 0.35 μM, and 3.0 ± 0.0 μM, respectively.17–22 It is observed that most of these reported compounds have common structural features, a quinoline scaffold, an imine (C N) linkage, hydrazone linkage forming a Schiff base, and also the substitutions were focused by varying the position of hydroxy (OH) groups on the phenyl ring. Considering the above-reported studies, we designed quinoline-based benzohydrazide Schiff bases (Chart 1).
Chart 1. Design of the quinoline-based Schiff base molecule.
Thus, to expand the inhibitory potential of quinoline as α-glucosidase and α-amylase inhibitors, we have designed and synthesized quinoline-based benzohydrazide Schiff bases.
Results and discussion
Pharmacophore and 3D QSAR
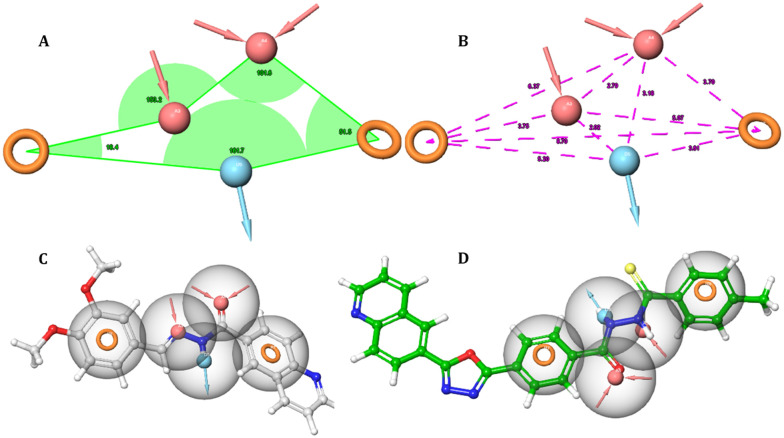
The data set of 66 molecules obtained from the literature survey was classified into active and inactive sets; the pharmacophoric sites were identified for all the molecules, and a total of 12 hypotheses were generated based on different features namely hydrogen bond acceptor (A), hydrogen bond donor (D), hydrophobic group (H), ring aromatic group (R), positively charged group (P) and negatively charged group (N). The model with the highest inactive score can differentiate between actives and inactive; a higher value of survival score means better mapping of actives with the developed model. The hypotheses were ranked corresponding to their statistical parameters such as survival score, inactive score, and vector score, and the top 5 hypotheses are detailed in Table 1 and S1.† Hypothesis AADRR_1 emerged as the best fit with a favorable survival score of 5.0697, a survival inactive score of 2.3579, and a vector score of 0.9552 and was selected for further validation. The selected model (AADRR_1) has a five-point hypothesis (Fig. 1) which includes two hydrogen bond acceptors; this feature is related to the nitrogen atom of the (–N CH) Schiff base and oxygen atom of the carbonyl group (C O); one hydrogen bond donor corresponds to an amino group (NH), and two ring aromatic features are related to the phenyl rings. These chemical features are essential for the α-glucosidase inhibitory activity among the data sets of the reported molecules.
Score of different hypothesis models.
| Sr. no | Hypothesis | Survival score | Inactive score | Vector score | Volume score |
|---|---|---|---|---|---|
| 1 | AADRR_1 | 5.069738 | 2.357928 | 0.955287 | 0.73662 |
| 2 | AADRR_3 | 4.905304 | 1.982363 | 0.8755 | 0.715986 |
| 3 | ADRR_2 | 4.84413 | 2.246359 | 0.941394 | 0.735339 |
| 4 | AADRR_5 | 4.711901 | 2.127412 | 0.815888 | 0.631069 |
| 5 | AAARR_2 | 4.739191 | 2.172076 | 0.8424 | 0.635954 |
| 6 | AADRR_1 | 5.069738 | 2.357928 | 0.955287 | 0.73662 |
Fig. 1. Representation of pharmacophore model AADRR_1 with respect to (A) angles between pharmacophore sites and (B) intersite distance in Å. Mapping of pharmacophore sites with the (C) active compound and (D) inactive compound from the data set.
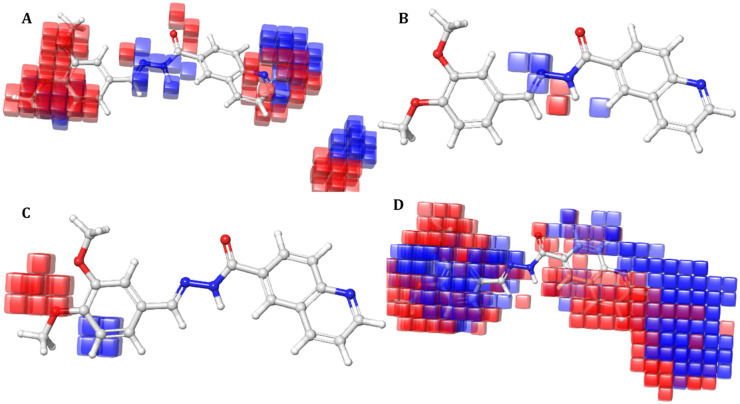
The AADRR_1 pharmacophoric model was validated by performing atom based 3D QSAR study, using partial least squares (PLS) regression analysis with a grid spacing of 1.5 Å. The data set was divided randomly with uniform structural diversity into test (19 molecules) and training (8 molecules); the best QSAR model was considered as with factor four, based on the parameters such as strong correlation coefficient (R2), i.e. 0.96, cross-correlation coefficient (Q2), i.e. 0.92; the stability of the model was found to be 0.55 and it has the highest F value of 99.8. Pearson's r is 0.9759 indicating the degree of confidence of the model. Moreover, the standard deviation (SD) is 0.229 and RMSE is found to be 0.29 indicating the stability of the model as presented in Table 2. The contour plots of 3D QSAR for the active compound are presented in Fig. 2. Here the blue cubes indicate the positive contributing effects and the red cubes indicate the negative contribution of molecular features for the requirement of the pharmacophore responsible for α-glucosidase inhibitory activity.
Atom-based 3D quantitative structural activity relationship (QSAR) results for selected pharmacophore hypothesis.
| ID | PLS factor | SD | R 2 | F | P | RMSE | Q 2 | Pearson's r |
|---|---|---|---|---|---|---|---|---|
| AADRR1 | 1 | 0.067 | 0.712 | 42.0 | 5.62 × 10−06 | 0.43 | 0.8430 | 0.9410 |
| 2 | 0.3727 | 0.8979 | 70.3 | 1.18 × 10−08 | 0.34 | 0.8999 | 0.9577 | |
| 3 | 0.3366 | 0.9219 | 59.0 | 1.55 × 10−08 | 0.35 | 0.8954 | 0.9522 | |
| 4 | 0.2295 | 0.9661 | 99.8 | 3.99 × 10⁻¹⁰ | 0.29 | 0.9294 | 0.9759 |
Fig. 2. Representation of contour plots for the active compound A5 from the data set with respect to (A) electron withdrawing effect, (B) hydrogen bond donor effect, (C) negative ionic effect and (D) positive ionic effect.
Validation of the pharmacophore model
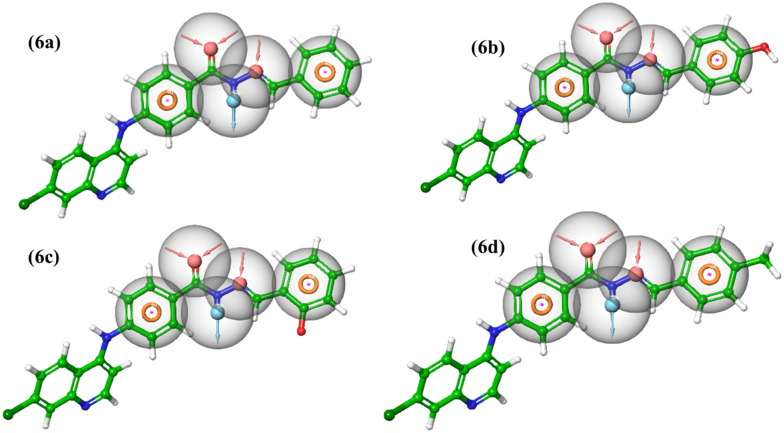
The generated pharmacophoric model AADRR_1 discriminatory ability was further validated by means of screening a set of ten designed molecules of the quinoline-based benzohydrazide Schiff' base along with a decoy set containing 1000 molecules obtained from the Schrödinger suite. The model successfully identified designed molecules from those of the decoy set molecules. The top hits were identified based on the fitness score ranging above 2. It was seen that the decoy set molecules exhibited fitness values less than 1.9. (Table S2†); the performance of the listed hits was analyzed based on the model AADRR_1 RIE value of 18.14. The area under the curve (AUC) of the ROC displayed a favorable metric for model evaluation value 1 for AADRR_1. The enrichment screen plot is provided in the ESI† (Fig. S1). The top hits were found to be mapped with the pharmacophoric sites (Fig. 3). Thus, these obtained hits were further carried for synthesis, in vitro evaluation of α-glucosidase and α-amylase inhibitory assay followed by their binding affinity analysis using molecular docking, MD simulation, and MM/GBSA analysis.
Fig. 3. The top screened actives mapped to the pharmacophoric hypothesis (AADRR_1).
Chemistry
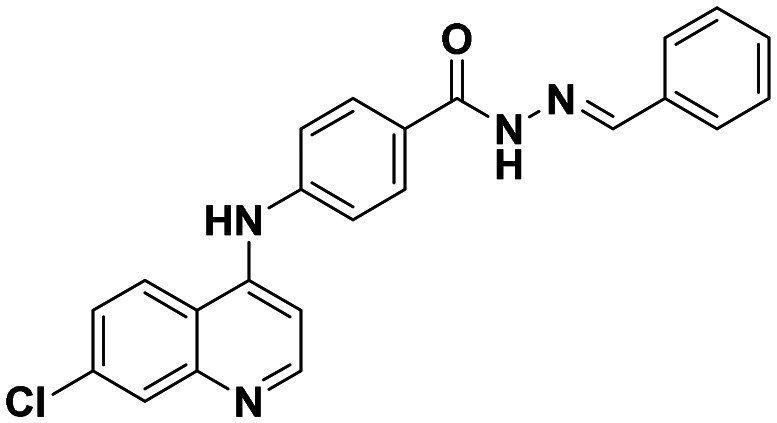
The synthesis of (6a–6j) quinoline-based benzohydrazide Schiff' bases was synthesized as shown in Scheme 1. The compound ethyl 4-((7-chloroquinolin-4-yl) amino) benzoate (3) and compound (4) 4-((7-chloroquinolin-4-yl) amino) benzohydrazide were prepared as per the previously reported method.23 The substituted benzylidene-4-((7-chloroquinolin-4-yl) amino) benzohydrazide compounds (6a–6j) were prepared by using the equimolar ratio of compound (4) refluxed with appropriated aryl aldehydes (5a–5j) using a catalytic amount of glacial acetic acid in methanol. The final crude compounds (6a–6j) were recrystallized and dried.
Scheme 1. Reagents and conditions: (a) 2 N HCl, reflux; (b) hydrazine hydrate (80%), reflux; (c) methanol, glacial acetic acid, reflux.
α-Glucosidase and α-amylase inhibitory assay
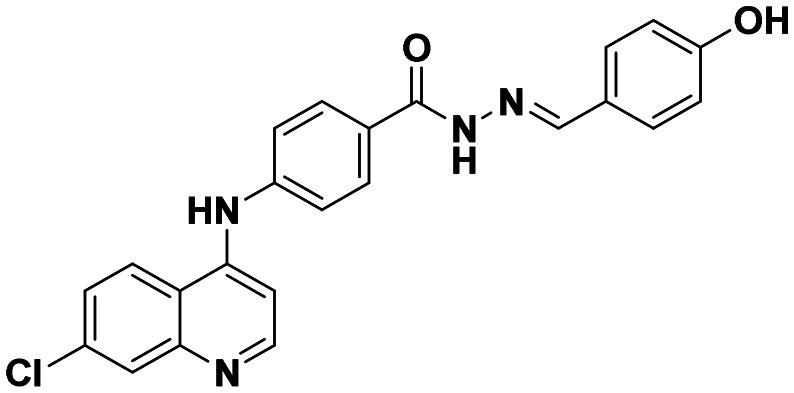
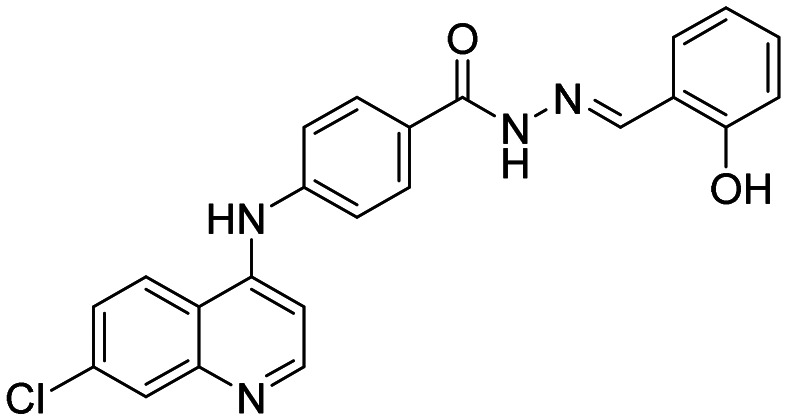
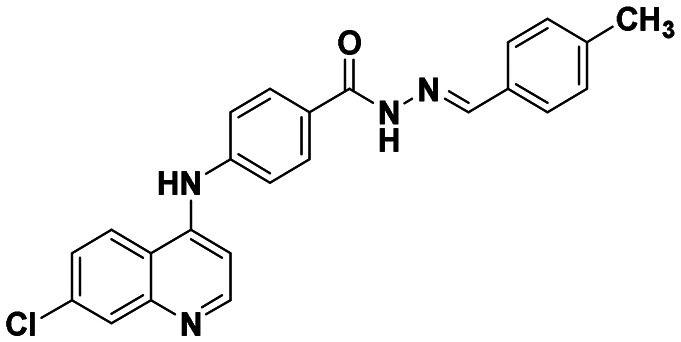
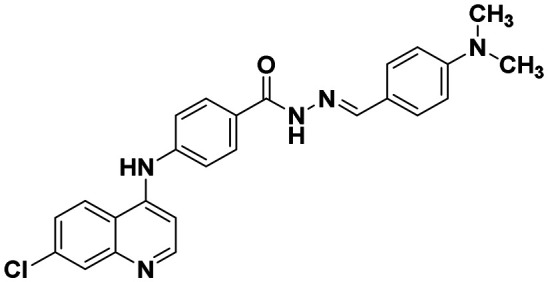
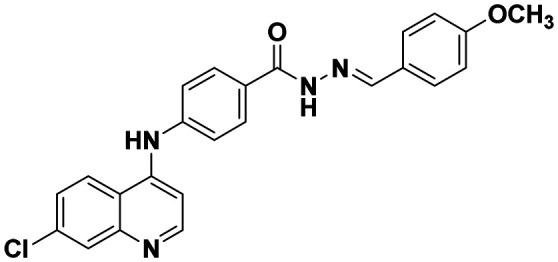
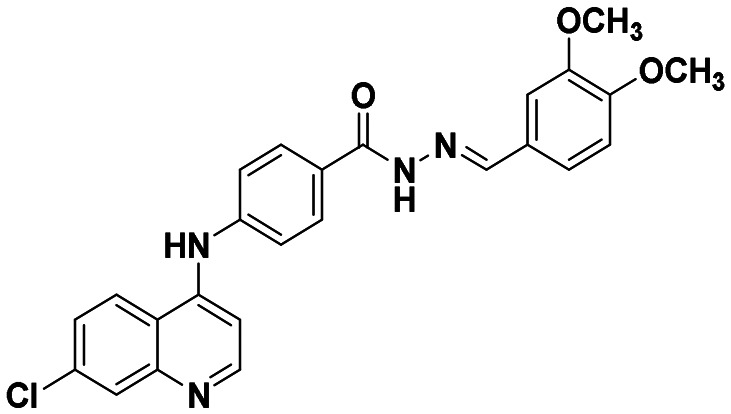
The newly synthesized molecules (6a–6j) were assessed for their inhibition effect on the enzymes responsible for postprandial hyperglycemia. Among the series (6a–6j), analogs showed a varying degree of inhibitory effect on α-glucosidase with IC50 values ranging between (12.95 ± 2.35 μM and 748.35 ± 1.09 μM) compared to standard drug acarbose (25.41 ± 0.16 μM) and α-amylase inhibitory effect in the range of 29.36 ± 3.24 μM and 78.63 ± 1.35 μM as compared to standard drug acarbose (32.63 ± 1.07 μM). The most active inhibitor 6c from the series displayed significant α-glucosidase inhibition (IC50 −12.95 ± 2.35 μM), followed by compound 6b (IC50 −19.37 ± 0.96 μM). The compound 6b inhibited α-amylase enzyme with IC50 −29.36 ± 3.24 μM followed by the compound 6c (IC50 −33.04 ± 1.83 μM). The inhibitory effects of all the compounds are detailed in Table 3.
In vitro α-glucosidase and α-amylase inhibitory activity of the synthesized compounds 4-((7-chloroquinolin-4-yl) amino) benzohydrazide Schiff bases (6a–6j).
| Comp. | Product | IC50 values (μM) ± SEM | |
|---|---|---|---|
| α-Glucosidase | α-Amylase assay | ||
| 6a |
|
27.43 ± 1.42 | 45.62 ± 2.01 |
| 6b |
|
19.37 ± 0.96 | 29.36 ± 3.24 |
| 6c |
|
12.95 ± 2.35 | 33.04 ± 1.83 |
| 6d |
|
43.76 ± 4.31 | 58.74 ± 3.01 |
| 6e |
|
31.42 ± 1.67 | 53. 06 ± 2.06 |
| 6f |
|
143.52 ± 2.98 | 78.63 ± 1.35 |
| 6g |
|
302.51 ± 2.12 | No inhibition |
| 6h |
|
748.35 ± 1.09 | No inhibition |
| 6i |
|
108.56 ± 3.16 | 65.48 ± 1.16 |
| 6j |
|
63.25 ± 0. 23 | 56.32 ± 3.14 |
| Acarbose | — | 25.41 ± 0.16 | 32.63 ± 1.07 |
Enzyme kinetic study
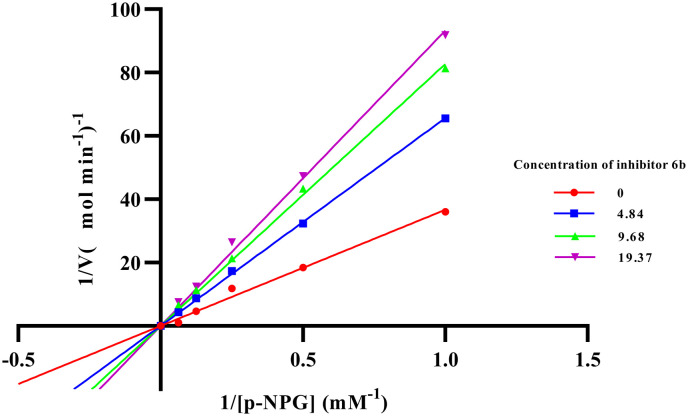
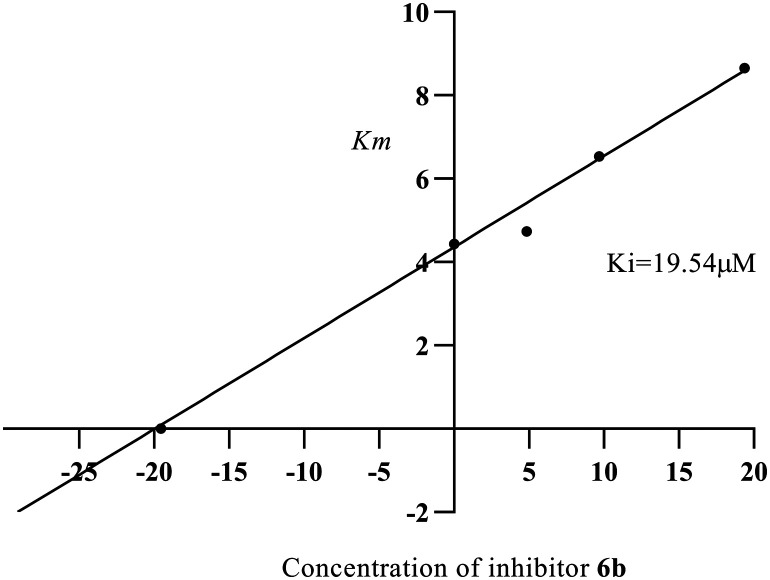
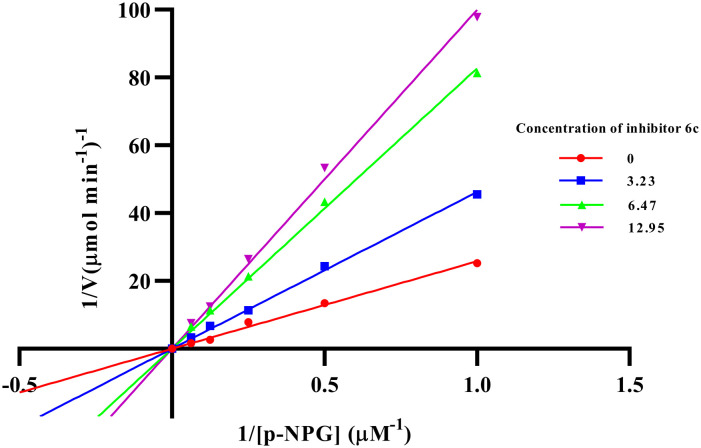
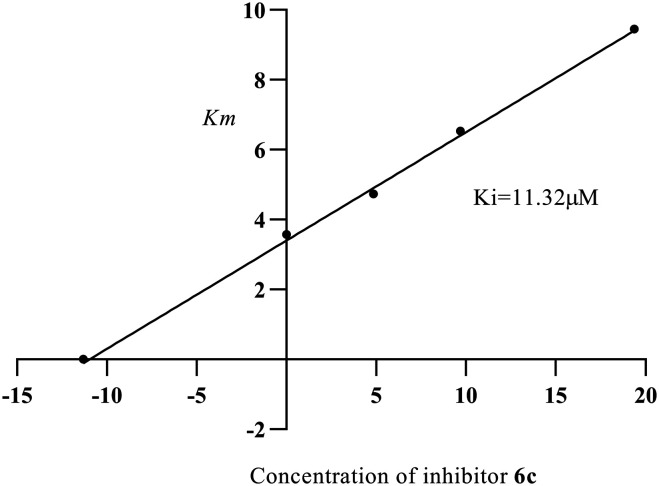
The most potent compounds among the series (6a–6j) were compounds 6b and 6c which were analyzed for their α-glucosidase inhibitory mechanism by enzyme kinetic study. Compound 6b was found to be competing with the substrate for the enzyme as evidenced by the Lineweaver–Burk plot, where the Vmax value was unchanged and increased in the Km value; the inhibitory constant (Ki) was found to be 19.54 μM and the plot is depicted in Fig. 4 and 5. Similarly, from the Lineweaver–Burk plot, it was observed that the compound 6c followed a competitive inhibitory pattern; the inhibitory constant (Ki) value was found to be 11.32 μM, as shown in Fig. 6 and 7.
Fig. 4. Lineweaver–Burk plot in the presence and absence of various concentrations of compound 6b.
Fig. 5. Secondary replot between Km and different concentrations of inhibitor 6b.
Fig. 6. Lineweaver–Burk plot in the presence and absence of various concentrations of compound 6c.
Fig. 7. Secondary replot between Km and different concentrations of inhibitor 6c.
Structural activity relationship
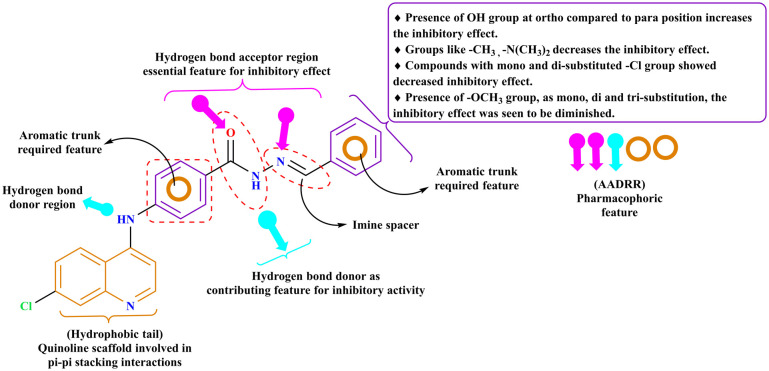
As per the literature search, a number of quinoline-based compounds have been reported to exhibit α-glucosidase and α-amylase inhibitory activity, such as quinoline clubbed with a dihydropyrano[3,2-c] system,24 dihydropyridines,25 1,3,4 oxadiazole and a 1,2,3-triazole,20 quinoline based Schiff base.15 From the pharmacophore model it was evident that the (CH N) Schiff base linkage scored as a contributing feature for the biological activity, as it is evident from the selected hypothesis model, the two aromatic rings, one hydrogen donor group, and two hydrogen acceptor group are contributing factors for inhibitory activity of the α-glucosidase enzyme. Compounds (6a–6j) were found to be mapped on the pharmacophoric feature sites for the validated model, and these features in the molecules 6b and 6c were found to participate in the hydrogen bond interaction in the enzyme's binding site. The active compounds 6b (IC50: 19.37 ± 0.96) and 6c (IC50: 12.95 ± 2.35) among the series (6a–6j) are structurally quinoline-based benzohydrazide Schiff base analogs. It is evident from the molecular docking studies that the quinoline scaffold is important for better binding of molecules within the pocket as it forms a pi–pi stacking interaction with PHE 311, PHE 157 in compound 6b, and TYR 151 in compound 6c. Both the active compounds exhibit hydroxy group substitution but differ with 6b having para hydroxy substitution and 6c with ortho hydroxy substitution, which implicates the importance of the inductive effect on the hydroxy group's electron-withdrawing ability and resonance effect on its electron-donating ability; the effect of hydroxy and polyhydroxy functional groups depends on the position of substitutions over the molecules to exhibit electron donating and withdrawing effects. It was also seen that the electron-donating substituents like 6b, 6c, 6d, and 6e showed better activity compared to electron-withdrawing substituents like 6f, 6g, 6h, 6i, and 6j within the series (6a–6j). Thus from the above findings and previously published literature18 it is evident that the hydroxy group substitutions have a contributing effect on α-glucosidase inhibitory activity as summarized in Fig. 8.
Fig. 8. SAR and pharmacophoric features required for α-glucosidase inhibitory activity.
Cytotoxicity studies
The safety of the synthesized molecules (6a–6j) was assessed on the normal mouse fibroblast (L929) cell lines using MTT (3-(4,5-dimethylthiazo-2-yl)-2,5-diphenyl-tetrazolium bromide) assay. The cell toxicity assay results revealed that the compounds (6a–6j) displayed no cytotoxic effect as shown in Table 4.
Toxicity results on normal mouse fibroblast L929 cell lines.
| Comp | Percent survival | |
|---|---|---|
| L929 cell lines | ||
| 125 μg ml−1 | 250 μg ml−1 | |
| 6a | 90.28 | 83.63 |
| 6b | 89.77 | 86.29 |
| 6c | 83.32 | 79.67 |
| 6d | 78.31 | 78.48 |
| 6e | 92.75 | 86.42 |
| 6f | 91.47 | 85.12 |
| 6g | 89.95 | 83.52 |
| 6h | 87.14 | 83.06 |
| 6i | 83.69 | 75.82 |
| 6j | 88.17 | 85.84 |
Molecular docking
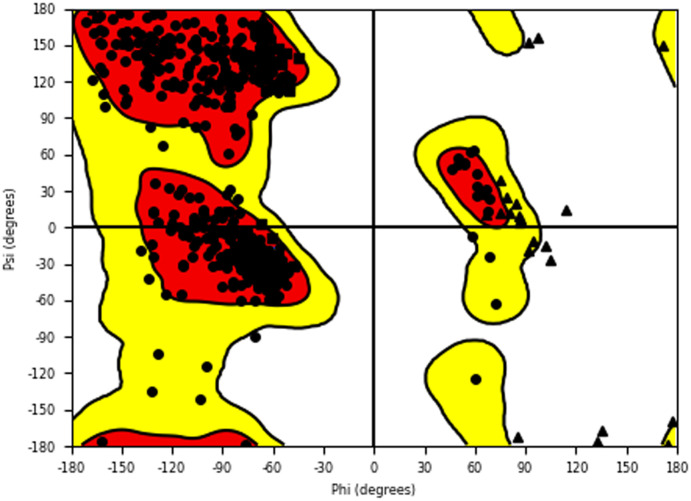
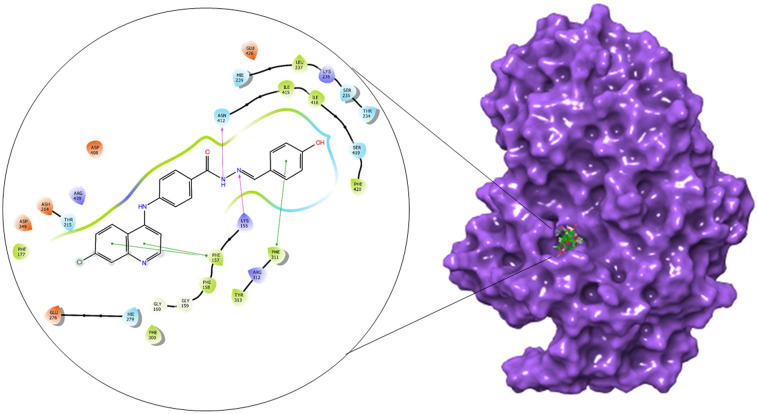
The α-glucosidase and α-amylase inhibitory assay revealed that several compounds showed noticeable inhibitory effects in comparison to standard inhibitor acarbose. Thus to validate these results and to establish the molecular interactions between the synthesized molecules and the receptor of α-glucosidase and α-amylase enzyme, a molecular docking study was performed using the Glide module of the Schrödinger suite. The binding poses of all the molecules were analyzed to understand the binding site affinity of these molecules. The α-glucosidase protein was constructed using homology modeling using the Fasta sequence (access id: P53341); ‘BLAST’ results highlighted ‘crystal structure of isomaltase from Saccharomyces cerevisiae’ (PDB ID: 3A47) as the maximum similarity index protein; this was used as the template protein for construction of the model; finally, protein reliability and the Ramachandran plot were analyzed (Fig. 9). Compounds 6b and 6c possessed the highest binding affinity among the series (6a–6j) in the binding pocket of α-glucosidase enzyme; compound 6b (Fig. 10) showed hydrogen bond interaction between the nitrogen atom of the Schiff base and amino acid residue LYS 155; it also formed a hydrogen bond interaction between the amino (NH) group of the benzohydrazide moiety and ASN 412; furthermore, it displayed three pi–pi stacking interactions with the aromatic rings of the ligand, one with amino acid residue PHE 311 and two bonds with PHE 157; the glide energy was found to be −52.425 kcal mol−1.
Fig. 9. Ramachandran plot of the homology modeled α-glucosidase protein.
Fig. 10. 2D and surface binding orientation of compound 6b in the α-glucosidase binding pocket.
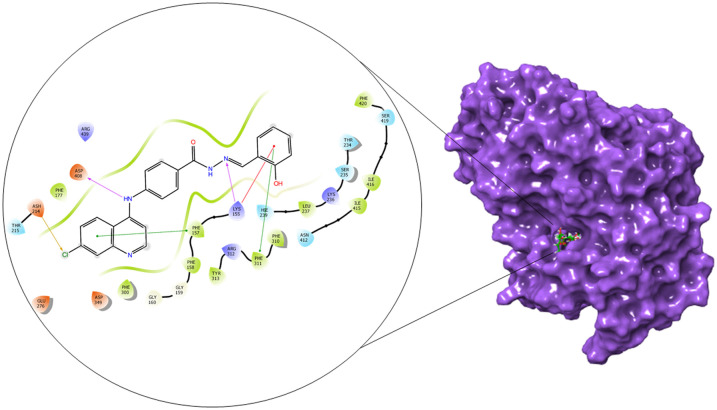
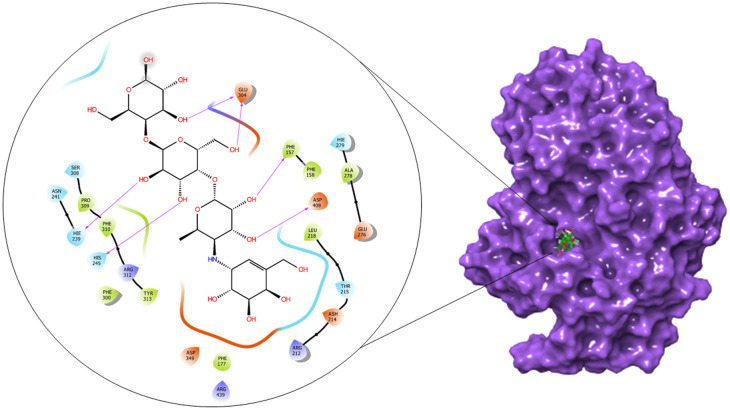
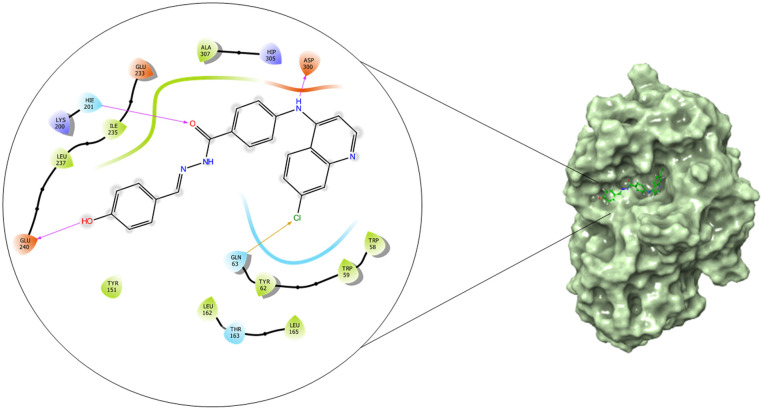
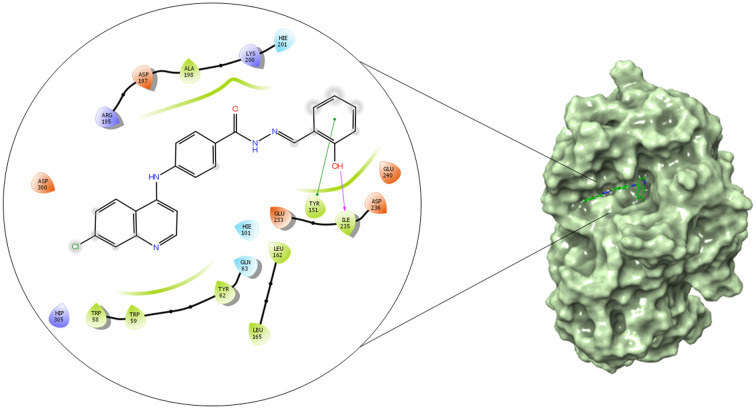
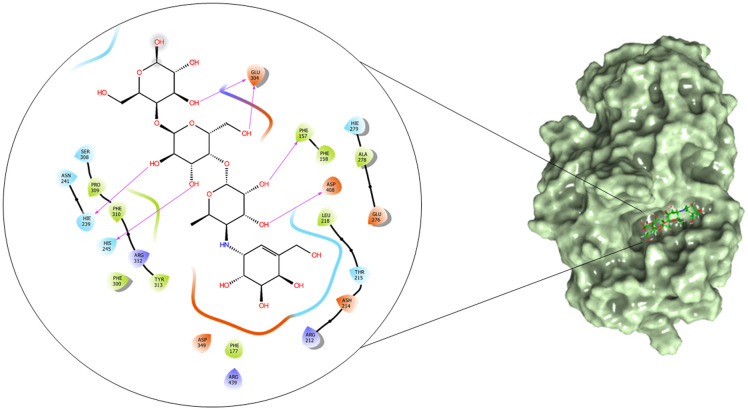
Similarly, compound 6c (Fig. 11) displayed a hydrogen bond interaction between the nitrogen atom of the Schiff base and amino acid residue LYS 155; the same LYS 155 was involved in the formation of a pi–cation interaction with the phenyl ring. Moreover, a pi–pi stacking interaction between the aromatic ring, and amino acid residue PHE 311, and PHE 157 was seen. A halogen bond was formed between the chlorine atom of the quinoline ring and ASH 214 amino acid residue; the glide energy was found to be −45.127 kcal mol−1. Acarbose (Fig. 12) was used as a standard for validating the docking protocol. All the interacting amino acid residues with the ligands matched to the active site key residues obtained from the site map analysis. Similarly, the compounds 6b and 6c showed better binding affinity among the series (6a–6j) in the α-amylase enzyme binding site, where compound 6b (Fig. 13) formed a hydrogen bond interaction between the amino (NH) group and ASP 300 amino acid residue; it also formed a hydrogen bond interaction between the carbonyl group and amino acid HIE 201; the hydroxy (OH) group formed a hydrogen bond interaction with GLU 240; moreover a halogen bond was formed between the chlorine atom of the quinoline nucleus and GLN 63 amino acid residue; the overall glide energy for the obtained pose was found to be −46.006 kcal mol−1. Similarly, compound 6c (Fig. 14) shows a hydrogen bond interaction between the hydroxy (OH) group and amino acid ILE 235; it also formed a pi–pi stacking interaction between the aromatic ring and TYR 151 amino acid residue, with a total glide energy of −49.094 kcal mol−1. Docking validation was carried out using acarbose (Fig. 15) as the standard. Thus the binding affinity of these ligands via hydrogen bonding, pi–pi stacking, halogen bonding, and pi–cation in the binding pocket of α-glucosidase and α-amylase enzyme indicates the putative binding mode, thus supporting the in vitro findings. The detailed binding affinity of compounds 6a–6j in α-glucosidase (Table 5) and α-amylase (Table 6) is presented. The binding pose of compounds 6a, 6d, 6e, 6f, 6g, 6h, 6i, and 6j are presented in the ESI.†
Fig. 11. 2D and surface binding orientation of compound 6c in the α-glucosidase binding pocket.
Fig. 12. 2D and surface binding orientation of compound acarbose in the α-glucosidase binding pocket.
Fig. 13. 2D and surface binding orientation of compound 6b in the α-amylase binding pocket.
Fig. 14. 2D and surface binding orientation of compound 6c in the α-amylase binding pocket.
Fig. 15. Represents 2D and surface binding orientation of compound acarbose in the α-amylase binding pocket.
Binding affinity and interactions of compounds 6a–6j in the α-glucosidase binding pocket using the Glide module of the Schrödinger suite.
| Compound | Docking score | Glide energy (kcal mol−1) | Ligand atom interaction (H-bond) | Amino acid residue | Bond length | π–π stacking |
|---|---|---|---|---|---|---|
| 6a | −5.133 | −53.487 | NH of the ligand to ASP 408 | ASP 408 | 2.23 | — |
| 6b | −6.145 | −53.047 | NH of the ligand to ASN 412 | ASN 412 | 2.01 | PHE 311 |
| N of the ligand to LYS 155 | LYS 155 | 2.46 | PHE 157 | |||
| 6c | −7.029 | −56.784 | NH of the ligand to ASP 408 | ASP 408 | 2.24 | PHE 311 |
| N of the ligand to LYS 155 | LYS220 | 2.27 | PHE 157 | |||
| 6d | −5.423 | −49.918 | N of the ligand to GLN 350 | GLN 350 | 2.78 | PHE 311 |
| C O of the ligand to ASN 412 | ASN 412 | 2.08 | ||||
| 6e | −5.068 | −50.113 | NH of the ligand to ASP 408 | ASP 408 | 2.22 | — |
| 6f | −5.392 | −53.900 | NH of the ligand to ASP 408 | ASP 408 | 2.13 | — |
| 6g | −6.190 | −59.221 | C O of the ligand to LYS 155 | LYS 155 | 2.53 | — |
| N of the ligand to LYS 155 | LYS 155 | 2.48 | ||||
| 6h | −5.347 | −53.043 | NH of the ligand to ASP 408 | ASP 408 | 2.03 | PHE 311 |
| 6i | −5.494 | −56.111 | NH of the ligand to ASP 408 | ASP 408 | 1.80 | HIE 239 |
| C O of the ligand to ARG 312 | ARG 312 | 1.86 | ||||
| 6j | −3.90 | −7.58 | NH of the ligand to ASP 408 | ASP 408 | 1.67 | PHE 311 |
| Acarbose | −7.199 | −51.660 | OH of the ligand to ASP 408 | ASP 408 | 2.78 | |
| OH of the ligand to GLU 304 | GLU 304 | 1.78 | ||||
| OH of the ligand to HIE 239 | HIE 239 | 2.63 | ||||
| OH of the ligand to GLU 304 | GLU 304 | 1.68 | ||||
| OH of the ligand to HIS 245 | HIS 245 | 2.69 | ||||
| OH of the ligand to PHE 157 |
Binding affinity and interactions of compounds 6a–6j in the α-amylase binding pocket using Glide module of the Schrödinger suite.
| Compound | Docking score | Glide energy (kcal mol−1) | Ligand atom interaction (H-bond) | Amino acid residue | Bond length | π–π stacking |
|---|---|---|---|---|---|---|
| 6a | −5.133 | −53.487 | C O of ligand the to HIE 201 | HIE 201 | 2.31 | TYR 151 |
| TRP 58 | ||||||
| 6b | −6.145 | −53.047 | OH of the ligand to GLU 240 | GLU 240 | 1.66 | — |
| C O of the ligand to HIE 201 | HIE 201 | 2.13 | ||||
| NH of the ligand to ASP 300 | ASP 300 | 1.74 | ||||
| 6c | −7.029 | −56.784 | OH of the ligand to ILE 235 | ILE 235 | 2.07 | TYR 151 |
| 6d | −5.423 | −49.918 | C O of the ligand to TYR 151 | TYR 151 | 2.11 | HIE 201 |
| C O of the ligand to HIE 201 | HIE 201 | 2.01 | ||||
| 6e | −5.068 | −50.113 | NH of the ligand to GLU 233 | GLU 233 | 2.12 | |
| C O of the ligand to HIE 201 | HIE 201 | 2.28 | HIE 201 | |||
| C O of the ligand to TYR 151 | TYR 151 | 2.10 | ||||
| 6f | −5.392 | −53.900 | NH of the ligand to ASP 197 | ASP 197 | 2.33 | TRP 58 |
| TRP 59 | ||||||
| HIE 201 | ||||||
| 6g | −6.190 | −59.221 | C O of the ligand to HIE 201 | HIE 201 | 1.88 | — |
| 6h | −5.347 | −53.043 | C O of the ligand to HIE 201 | HIE 201 | 2.02 | TRP 58 |
| 6i | −5.494 | −56.111 | C O of the ligand to HIE 201 | HIE 201 | 1.95 | |
| 6j | −3.90 | −7.58 | N of the ligand to ILE 235 | ILE 235 | 2.40 | HIE 201 |
| TRP 59 | ||||||
| Acarbose | −7.199 | −51.660 | OH of the ligand to ASP 300 | ASP 300 | 2.63 | |
| OH of the ligand to ASP 300 | ASP 300 | 2.37 | ||||
| OH of the ligand to ASP 197 | ASP 197 | 1.71 | ||||
| OH of the ligand to GLU 240 | GLU 240 | 1.74 | ||||
| OH of the ligand to HIP 205 | HIP 205 | 2.17 | ||||
| OH of the ligand to HIE 201 | HIE 201 | 2.33 | ||||
| OH of the ligand to ARG 195 | ARG 195 | 1.80 |
MD simulations
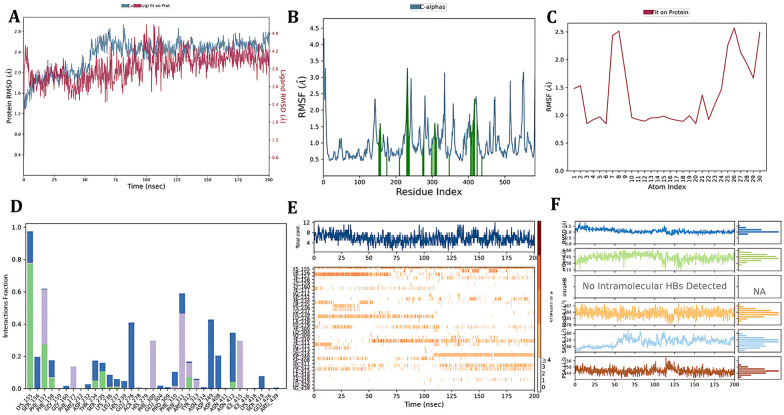
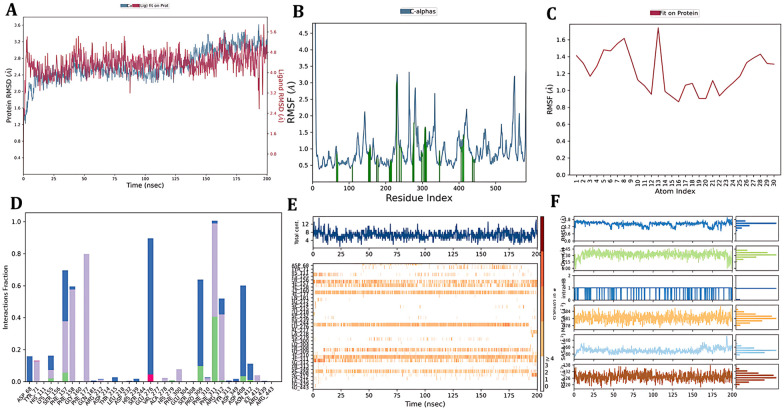
The potential leads 6b and 6c against α-glucosidase among the series (6a–6j) based on enzyme inhibitory activity were selected for an MD simulation run to assess their affinity towards the binding pocket and the predicted stability of the protein–ligand complex throughout an MD run of 200 ns. Simulation interaction analysis was based on the hydrogen bond contacts, RMSD, and RMSF. The RMSD indicates the average deviation of the selection of atoms for individual frames concerning the reference frame throughout the simulation. RMSF helps to identify the local changes in the protein and changes in the atom position of ligands. Frame 0 was considered as the reference structure. The discussion on the protein–ligand complex is described below:
α-Glucosidase–6b complex
The stability of the protein–ligand complex was determined using the protein–ligand RMSD plot, indicating the stable protein structure concerning the C-alpha RMSD and backbone RMSD having a maximum deviation of 2.755 Å and 2.754 Å (frame 977), respectively. The ligand RMSD was determined by identifying the ligand aligned on a protein and the ligand aligned on a ligand showing a maximum deviation of 4.266 Å (frame 989) and 1.185 Å (frame 967), respectively. The protein RMSF plot indicates the stability of binding site amino acid residues when in contact with a ligand; it was observed that the maximum deviation was found to be with the amino acid residue SER 419 with a deviation of 2.340 Å concerning C-alpha and 2.428 Å for the backbone (frame 417); overall the amino acids involved in the contact with a ligand displayed not much protein RMS fluctuation, while the other fluctuating residues were not involved in the protein–ligand contact, indicating the stability of the ligand in the binding site. The ligand RMSF indicates the change in movement of ligand atoms throughout simulation. The ligand aligned on a protein and the ligand aligned on a ligand showed maximum fluctuations of 2.572 Å and 1.225 Å corresponding to a carbon atom of the benzene ring, and there was no fluctuation of the intact functional groups indicating the stability of the ligand inside the binding pocket. To evaluate the hydrogen bond interactions, the protein–ligand contact timeline and histogram plot were analysed; LYS 155 formed a continuous hydrogen bond interaction for a complete MD run of 200 ns; it also formed a water bridge hydrogen bond interaction with ASP 349 and GLU 276, and HIS 239 formed a hydrogen bond interaction for 100 ns. A pi–cation interaction was seen with ARG 312 throughout the simulation. Also, the ligand properties such as the radius of gyration, SASA, PSA, and intramolecular H bonds were calculated. (Fig. 16).
Fig. 16. Simulation interaction diagram of the α-glucosidase–6b complex: A) protein–ligand RMSD plot, B) protein RMSF plot, C) ligand RMSF, D) protein–ligand contact histogram, E) protein–ligand contact timeline and F) ligand properties.
α-Glucosidase–6c complex
The protein ligand RMSD plot of the α-glucosidase–6c complex was presented; the protein structure RMSD concerning the reference C-alpha RMSD and backbone RMSD value showed a maximum deviation of 3.263 Å and 3.254 Å (frame 999), respectively. Ligand stability was evaluated using the ligand RMSD concerning the ligand aligned on a protein and the ligand aligned on a ligand indicating maximum deviations of 4.985 Å and 1.561 Å (frame 15), respectively. ASP 232 showed a fluctuation of 3.023 Å (frame 230), and the rest of the ligand contact residues were found to have less than 1.00 Å RMS fluctuation, indicating stable contact inside the binding pocket. The ligand RMSF plot indicates that compound 6c is stable, but ligand RMS fluctuations of 1.141 Å and 0.695 Å were seen concerning the protein and ligand, respectively, of the chlorine atom. The protein–ligand contact histogram and timeline were assessed, a hydrogen bond interaction was seen with PHE 311, and water bridge hydrogen bonding was seen with PRO 309, ASP 408, and GLU 276. A pi–cation interaction with ARG 312 and pi–pi stacking with PHE 158 were formed. Finally, the ligand properties were identified (Fig. 17).
Fig. 17. Simulation interaction diagram of the α-glucosidase–6c complex: A) protein–ligand RMSD plot, B) protein RMSF plot, C) ligand RMSF, D) protein–ligand contact histogram, E) protein–ligand contact timeline and F) ligand properties.
Density functional theory (DFT)
Optimization of molecular geometries
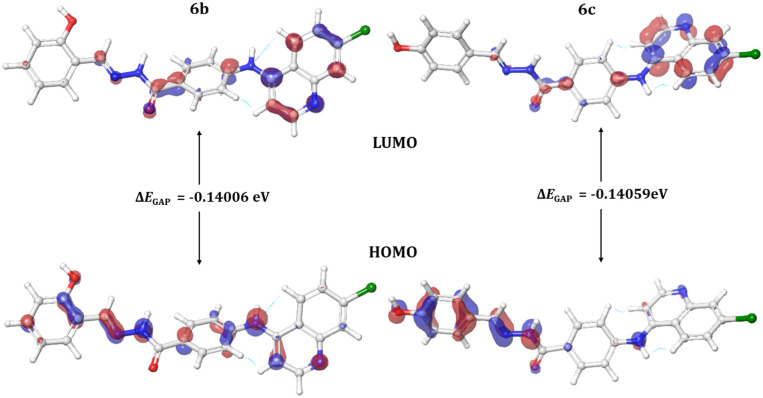
The optimization of synthesized molecular structures having gas-phase energy is shown in Table 7. The study of molecular orbitals (MOs) is crucial in quantum chemistry, as it defines chemical behavior and also highlights the binding affinity and reactivity of molecules. The major molecular orbitals of a compound are the highest occupied molecular orbital (HOMO) and the lowest unoccupied molecular orbital (LUMO). Chemical qualities such as reactivity, stability, and kinetics are explained using them. Softer molecules tend to show better reactivity, and the extent to which a molecule is hard or soft is determined by hardness (η). The chemical reactivity descriptors and energy gap are calculated by the DFT/B3LYP/6-31 G (d,p**) method, and the values are mentioned in Table 8. The (FOMOs) HOMO and LUMO orbitals of compounds 6b and 6c are depicted in (Fig. 18) A smaller HOMO–LUMO energy gap typically indicates molecular reactivity. Compounds 6b and 6c show a ΔEGAP of −0.14006 eV and −0.14059 eV, respectively.
Final energy of geometry optimized structures.
| Compound | Gas phase energy (eV) |
|---|---|
| 6a | −1641.166335 |
| 6b | −1716.392044 |
| 6c | −1716.389529 |
| 6d | −1680.487182 |
| 6e | −1775.142601 |
| 6f | −1755.69537 |
| 6g | −1870.2175 |
| 6h | −1984.736796 |
| 6i | −2560.346418 |
| 6j | −2560.348556 |
Calculated quantum chemical parameters of the synthesized compounds (molecular electrostatic potential surface).
| Quantum chemical parameters | E HOMO (eV) | E LMO (eV) | ΔEGAP (eV) | μ (eV) | σ (eV) | η (eV) | ω (eV) |
|---|---|---|---|---|---|---|---|
| 6a | −0.22342 | −0.08268 | 0.14074 | −0.15305 | 14.21060111 | 0.07037 | 0.000824 |
| 6b | −0.22132 | −0.08126 | 0.14006 | −0.15129 | 14.27959446 | 0.07003 | 0.000801 |
| 6c | −0.22112 | −0.08053 | 0.14059 | −0.150825 | 14.22576286 | 0.070295 | 0.0008 |
| 6d | −0.2222 | −0.08141 | 0.14079 | −0.151805 | 14.20555437 | 0.070395 | 0.000811 |
| 6e | −0.19993 | −0.07859 | 0.12134 | −0.13926 | 16.48261085 | 0.06067 | 0.000588 |
| 6f | −0.22003 | −0.08079 | 0.13924 | −0.15041 | 14.3636886 | 0.06962 | 0.000788 |
| 6g | −0.21566 | −0.08103 | 0.13463 | −0.148345 | 14.85552997 | 0.067315 | 0.000741 |
| 6h | −0.22183 | −0.08283 | 0.139 | −0.15233 | 14.38848921 | 0.0695 | 0.000806 |
| 6i | −0.22507 | −0.08528 | 0.13979 | −0.155175 | 14.30717505 | −0.070096 | 0.000842 |
Fig. 18. The HOMO and LUMO orbitals with energy gaps (ΔEGAP) for compounds 6b and 6c.
Molecular electrostatic potential (MEP)
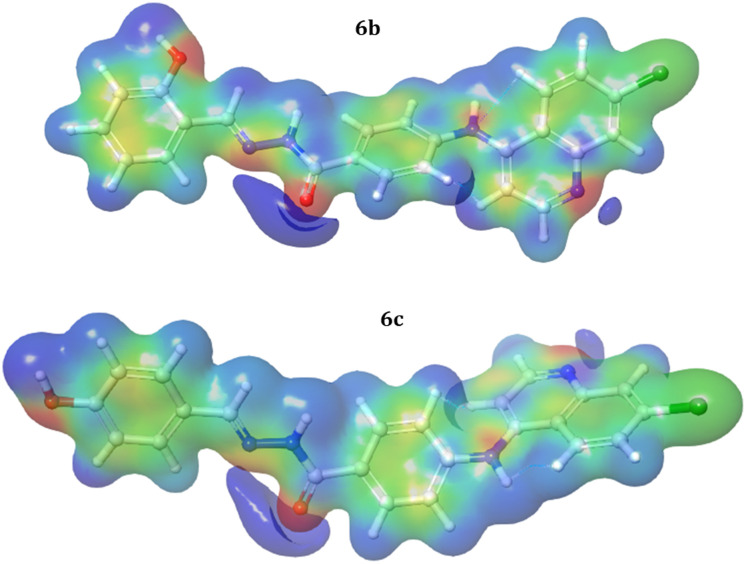
The electrostatic potential is a useful tool for determining how electric charge is distributed in a molecule. This sheds light on the electrostatic interactions that occur within the molecule and with the protein when inside the binding pocket. The MEP on a molecular surface can be used to identify areas of high electron density (negative potential) and low electron density (positive potential). The MEP may be used to anticipate electrophilic and nucleophilic attack sites, as well as to examine molecular interactions. Molecular electrostatic potentials were estimated using the B3LYP technique and a basis set of 6-31G (d,p**) at the optimized geometry. The MEP of potential compounds 6b and 6c is presented in (Fig. 19). From the graph, it is understood that the size, shape, and orientation of the positive (blue color – nucleophilic attack sites), negative (red color – electrophilic attack sites) and neutral (green color) regions depend on the nature of the substituted functional groups. The variation in mapping this electrostatic potential in drug-like substances is primarily responsible for the extent to which drug-receptor binding happens at the targeted receptor's active site.
Fig. 19. The molecular electrostatic potential map for compounds 6b and 6c.
ADMET
ADMET properties, including hydrogen bond donors, hydrogen bond acceptors, hydrophilicity, molecular weight, permeability, and percent human oral absorption, were predicted; furthermore predictions regarding violations of Lipinski's rule of five and Jorgensen's rule of three were identified using the Schrödinger Qikprop module and compared with recommended values, as shown in Table 9. Compounds 6b and 6c obeyed the Lipinski rule of five without any violations of the rule, whereas the rest of the molecules showed at least 1 violation of the rule of five.
Computed ADMET properties of the synthesized molecules (6a–6j).
| Comp. | MW | DHB | AHB | QP log Po/w | QP log BB | QP log HERG | QP PCaco |
|---|---|---|---|---|---|---|---|
| 6a | 400.866 | 2 | 4 | 5.529 | −0.751 | −7.717 | 1069.586 |
| 6b | 416.866 | 3 | 4.75 | 4.743 | −1.413 | −7.632 | 344.65 |
| 6c | 416.866 | 3 | 4.75 | 4.862 | −1.378 | −7.826 | 393.135 |
| 6d | 414.893 | 2 | 4 | 5.751 | −0.785 | −7.585 | 1053.718 |
| 6e | 443.935 | 2 | 5 | 5.969 | −0.915 | −7.672 | 989.702 |
| 6f | 430.893 | 2 | 4.75 | 5.658 | −0.848 | −7.668 | 1068.846 |
| 6g | 460.919 | 2 | 5.5 | 5.855 | −0.813 | −7.665 | 1348.724 |
| 6h | 490.945 | 2 | 6.25 | 6.23 | −1.101 | −8.026 | 1057.152 |
| 6i | 469.757 | 2 | 4 | 6.317 | −0.492 | −7.38 | 1017.054 |
| 6j | 469.757 | 2 | 4 | 6.452 | −0.506 | −7.547 | 1009.507 |
| Comp. | QP PMDCK | QP log Khsa | %HOA | CNS | ROF | ROT |
|---|---|---|---|---|---|---|
| 6a | 1313.383 | 0.927 | 100 | −1 | 1 | 1 |
| 6b | 386.171 | 0.704 | 100 | −2 | 0 | 1 |
| 6c | 444.917 | 0.727 | 100 | −2 | 0 | 1 |
| 6d | 1289.393 | 1.052 | 100 | −1 | 1 | 1 |
| 6e | 1207.45 | 1.105 | 100 | −1 | 1 | 1 |
| 6f | 1311.799 | 0.953 | 100 | −1 | 1 | 1 |
| 6g | 1686.872 | 0.966 | 100 | −1 | 1 | 1 |
| 6h | 1296.419 | 1.106 | 100 | −2 | 1 | 1 |
| 6i | 5992.488 | 1.115 | 100 | 0 | 1 | 1 |
| 6j | 6340.43 | 1.159 | 100 | 0 | 1 | 1 |
MM/GBSA
This approach permits resolving the total binding free energy into different components to understand the ligand–receptor complex binding affinity; the contributions of various parameters in the binding free energy are summarized in Table 10, which include van der Waals, coulumbic, steric, lipophilic, and H bond interactions.
MM/GBSA calculation of the synthesized compounds (6a–6j).
| Comp. | MMGBSA dG bind | MMGBSA dG bind Hbond | MMGBSA dG bind vdW | MMGBSA dG bind coulomb | MMGBSA dG bind covalent | MMGBSA dG bind solv GB |
|---|---|---|---|---|---|---|
| kcal mol−1 | kcal mol−1 | kcal mol−1 | ||||
| Prime MM/GBSA of α-glucosidase | ||||||
| 6a | −40.45 | −5.51 | −40.7 | −44.68 | 1.26 | 69.16 |
| 6b | −36.6 | −0.58 | −48.03 | −9.04 | 3.56 | 41.37 |
| 6c | −44.44 | −2.16 | −34.93 | −17.59 | 7.3 | 34.71 |
| 6d | −43.59 | −1.76 | −47.37 | −22.38 | 3.97 | 49.12 |
| 6e | −37.76 | −0.47 | −49.3 | −10.25 | 3.93 | 45.23 |
| 6f | −41.25 | −1.89 | −51.06 | −11.79 | 9.43 | 40.65 |
| 6g | −43.43 | −0.74 | −54.6 | −9.34 | 15.87 | 42.59 |
| 6h | −45.14 | −0.52 | −53.03 | −9.68 | 4.24 | 43.91 |
| 6i | −48.14 | −0.74 | −50.56 | −23.97 | 5.24 | 47.6 |
| 6j | −37.07 | −0.21 | −50 | −4.32 | 2.64 | 35.97 |
| Prime MM/GBSA of α-amylase | ||||||
|---|---|---|---|---|---|---|
| 6a | −28.72 | −1.24 | −45.53 | −15.34 | 12.2 | 54.16 |
| 6b | −33.41 | −2.23 | −45.94 | −11.64 | 13.69 | 44.7 |
| 6c | −39.65 | −2.18 | −52.01 | −15.84 | 12.38 | 49.89 |
| 6d | −26.24 | −0.75 | −45.96 | −9.03 | 5.21 | 57.21 |
| 6e | −34.14 | −1.26 | −53.79 | −17.22 | 13.73 | 59.35 |
| 6f | −32.82 | −1.27 | −49.86 | −12.3 | 13.1 | 52.02 |
| 6g | −40.7 | −1.16 | −53.72 | −13.61 | 9.08 | 54.89 |
| 6h | −29.17 | −1.37 | −53.58 | −9.01 | 14.66 | 55.01 |
| 6i | −25.96 | −1.34 | −44.3 | −14.74 | 5.87 | 55.39 |
| 6j | −38.29 | −1.39 | −52.41 | −7.47 | 11.79 | 47.26 |
Experimental
Molecular dataset: selection and preparation
A diverse dataset of 64 literature reported α-glucosidase inhibitors were selected for ligand-based pharmacophore model generation.17–22 The reported biological activity IC50 value of inhibitors was converted to the negative logarithm of the molar concentration (pIC50) value required to produce 50% enzyme inhibition. The dataset was considered over a wide range, i.e., (9.000–6.000); the same enzyme inhibitory experiment was carried out for each molecule to determine the activity (Fig. S1†). Molecules were sketched in the “Maestro” workspace (Maestro 13.2) and converted to 3D and optimization of all molecules was performed using the MacroModel minimization program using the “OPLS4” force field. A screening dataset of quinoline-based benzohydrazide Schiff bases was designed; the OPLS4 force field was used for energy minimization and conformations were generated.
Generation of pharmacophore hypotheses
The “PHASE” module of the Schrödinger suite was utilized for pharmacophore modeling using the energy-optimized molecules via the “develop pharmacophore hypothesis” protocol.26 The data set comprised α-glucosidase inhibitors categorized into active (pIC50 > 8.15) and inactive (pIC50 < 8.04) based on the pIC50 value. The 4 to 5-point hypothesis model was generated with a minimum of 4 sites and a maximum of 5 site features. Only one alignment per ligand confirmation was retained and flexible ligand superposition using Phase was carried out. Features like hydrogen bond acceptor (A), hydrogen bond donor (D), hydrophobic group (H), ring aromatic group (R), positively charged group (P), and negatively charged group (N) were assigned to molecules using predefined features. A total of 12 pharmacophore hypotheses were generated.
Validation of the pharmacophore model
The Phase module was utilized for the atom-based 3D QSAR validation of the top-ranked pharmacophore hypothesis via the partial least squares (PLS) method. The hydrogen bond donor, hydrogen bond acceptor, hydrophobic effect, positive ionic effect, and negative ionic effect were determined using an atom-based QSAR technique, and contour maps were obtained for the above parameters.27 Phase (v4.0) was employed for the alignment of α-glucosidase inhibitors from the AADRR_1 hypothesis. The data set was randomly divided into a 30% test set and a 70% training set using default setting parameters. The ranking of the generated 3D QSAR model was based on the statistical parameters which include R2 (training set correlation coefficient), Q2 (test set correlation coefficient), SD (standard deviation), and Pearson r value.
The “hypothesis validation panel” of Phase (v.4.0) was used to perform screening of the designed quinoline-based benzohydrazide Schiff bases along with a decoy set obtained from the Schrödinger suite for the hypothesis AADRR1, and the performance parameters like EF (enrichment factor), BEDROC (Boltzmann enhanced discrimination of receiver operating characteristic), AUC (area under the curve) and ROC (receiver operating characteristics) were calculated to validate the virtual screening accuracy of the developed pharmacophore model.
Chemistry
The melting point was measured in open capillary tubes in the melting point apparatus and was uncorrected. 1H (400 MHz) and 13C NMR (100 MHz) spectra were recorded on Bruker and JEOL spectrometers. All spectra were recorded at room temperature. The chemical shift is quoted in ppm (δ) and coupling constant (J) is reported in Hz. Deuterated dimethyl sulphoxide (DMSO) was used as a solvent for NMR. LCMS spectra were obtained on an LCMS-2010 Shimadzu. IR spectra were recorded on an IR Affinity-1, Shimadzu spectrophotometer. Solvents and chemical reagents that are commercially available were used without further purification. 4,7 Dichloroquinoline was obtained from Acros Organics (New Jersy, USA), and benzocaine and aryl and heteroaryl aldehydes were procured from HiMedia Laboratories Pvt. Ltd. (Mumbai, India). α-Glucosidase assay kit from Biorbyt (Durham, USA) and α-amylase assay kit from Elabscience (USA) were used. Molecular docking and molecular dynamics simulations were performed using Glide, Prime, and Desmond modules of the Schrödinger suite, and Maestro was used for visualizing interactions. GraphPad Prism 8 was used for statistical analysis. Compounds ethyl 4-((7-chloroquinolin-4-yl)amino)benzoate (3) and 4-((7-chloroquinolin-4-yl) amino)benzohydrazide (4) were synthesized as per the previously reported method.23
General procedure for the synthesis of compounds 6a–6j
A mixture of (50 mmol) 4-((7-chloroquinolin-4-yl)amino)benzohydrazide (4), appropriate aryl or heteroaryl aldehydes (5a–5j) (50 mmol), and 100 ml methanol containing a catalytic amount of glacial acetic acid was stirred at 75 °C for 24 h. The reaction was monitored by TLC for completion. The reaction mixture was cooled to room temperature to obtain the crude product; the precipitate formed was filtered, washed with water, and cold alcohol followed by solvent ether, and dried to obtain (E)-N′-substituted methylene benzylidene-4-((7-chloroquinolin-4-yl)amino)benzohydrazides (6a–6j).
(E)-N′-Benzylidene-4-((7-chloroquinolin-4-yl)amino)benzohydrazide (6a)
This compound was prepared according to a general procedure and it was obtained as an off-white solid; yield: 49.2%; MP: 262–265 °C. FTIR (KBr, cm−1), 3179.79 (N–H), 2997.51 (Ar–CH), 1669.50 (C O), 1575.91 (C C), 1558.55 (C N). 1H NMR [400 MHz, δ ppm, DMSO-d6]; 7.22–7.20 (d, 1H, J = 8 Hz, Ar–H), 7.49–7.43 (m, 5H, Ar–H), 7.64–7.61 (m, 1H, J = 9.2 Hz, Ar–H), 7.74–7.72 (d, 2H J = 8 Hz, Ar–H), 7.98–7.95 (m, 3H, Ar–H), 8.47–8.41 (m, 2H, Ar–H). 8.59–8.58 (d, 1H, J = 4 Hz), 9.35 (s, 1H, Ar–NH–Ar), 11.78 (s, 1H, –CONH). 13C NMR [100 MHz, δ ppm, DMSO-d6]; 103.90, 118.98, 119.93, 124.56, 125.31, 126.95, 127.73, 128.77, 129.07, 134.05, 134.38, 146.51, 149.62, 152.03. Molecular weight; calculated: C23H17ClN4O: 400 found, LCMS; m/z 401(M + 1).
(E)-4-((7-Chloroquinolin-4-yl)amino)-N′-(4-hydroxy benzylidene)benzohydrazide (6b)
This compound was prepared according to a general procedure and it was obtained as an off-white solid; yield: 88.79%, MP: 280–282 °C. FTIR (KBr, cm−1); 3530.85 (O–H), 3272.38 (N–H), 2916.49 (Ar–CH), 1653.07 (C O), 1574.95 (C C), 1558.55 (C N). 1H NMR [400 MHz, δ, ppm, DMSO-d6]; 6.84–6.82 (d, 2H, J = 8 Hz, Ar–H), 7.19–7.17 (d, 1H, J = 8 Hz, Ar–H) 7.62–7.43 (m, 5H, Ar–H) 7.95–7.93 (m, 3H, Ar–H), 8.42–8.35 (m, 2H, Ar–H), 8.58–8.56 (d, 1H, J = 8 Hz, Ar–H), 9.32 (s, 1H, Ar–NH–Ar), 9.88 (s, 1H, OH), 11.56 (s, 1H, –CONH). 13C NMR [100 MHz, δ ppm, DMSO-d6]; 103.78, 115.55, 117.45, 119.96, 120.05, 124.57, 125.30, 125.38, 127.74, 128.71, 128.97, 134.05, 146.60, 147.61, 149.63, 152.04. Molecular weight; calculated: C23H17ClN4O2: 416 found, LCMS; m/z 417(M + 1).
(E)-4-((7-Chloroquinolin-4-yl)amino)-N′-(2-hydroxy benzylidene)benzohydrazide (6c)
This compound was prepared according to a general procedure and it was obtained as a white solid; yield: 77.2%, MP: 263–265 °C. FTIR (KBr, cm−1); 3279.13 (N–H), 3312.88 (O–H), 2953.14 (Ar–CH), 1665.60 (C O), 1575.91 (C C), 1532.51 (C N). 1H NMR [400 MHz, δ ppm, DMSO-d6]; 6.97–6.93 (m, 2H, Ar–H), 7.34–7.24 (m,2H, Ar–H), 7.55–7.50 (m, 3H, Ar–H), 7.66–7.64 (m, 1H, Ar–H), 8.00–7.95 (m, 3H, Ar–H), 8.45–8.42 (d, 1H, J = 8.8 Hz, Ar–H), 8.66–8.60 (m, 2H, Ar–H), 9.42 (s, 1H, Ar–NH–Ar), 11.39 (s, 1H, –CONH), 12.06 (s, 1H, –OH). 13C NMR [100 MHz, δ ppm, DMSO-d6]; 104.61, 116.94, 119.87, 120.43, 125.19, 125.97, 129.73, 137.17, 144.91, 146.97, 148.39, 152.64, 154.34, 157.96, 172.52. Molecular weight; calculated: C23H17ClN4O2: 416 found, LCMS; m/z 417(M + 1).
(E)-4-((7-chloroquinolin-4-yl)amino)-N′-(4-methylbenzylidene)benzohydrazide (6d)
This compound was prepared according to a general procedure and it was obtained as a yellow solid; yield: 78.2 MP: 234–237 °C. FTIR (KBr, cm−1); 3298.60 (N–H), 2801.73 (Ar–CH), 1611.59 (C O), 1569.15 (C C), 1525.72 (C N). 1H NMR [400 MHz, δ ppm, DMSO-d6]; 2.99 (s, 6H, N–(CH3)2), 6.78–6.76 (d, 1H, J = 8 Hz, Ar–H), 7.22–7.20 (d, 1H, J = 5.6 Hz, Ar–H), 7.50–7.48 (m, 3H, Ar–H), 7.655–7.651 (m, 2H, Ar–H), 7.98–7.96 (m, 4H, Ar–H), 8.33(s, 1H, Ar–H), 8.45–8.43 (d, 1H, Ar–H), 8.60–8.59 (d, 1H, Ar–H), 9.38 (s, 1H, Ar–NH–Ar), 11.54 (s, 1H, –CO–NH). 13C NMR [100 MHz, δ ppm, DMSO-d6]; 49.13, 104.23, 112.33, 120.64, 125.15, 125.88, 128.31, 128.90, 129.52, 147.17, 148.70, 150.18, 152.63, 162.59. Molecular weight; calculated: C25H22ClN5O: 443 found, LCMS; m/z 444(M + 1).
(E)-4-((7-chloroquinolin-4-yl)amino)-N′-(4-(dimethylamino)benzylidene)benzohydrazide (6e)
This compound was prepared according to a general procedure and it was obtained as a white solid; yield: 66.6%, MP: 241–243 °C. FTIR (KBr, cm−1); 3259.84 (N–H), 2967.34 (Ar–CH), 1679.11 (C O), 1573.98 (C C), 1537.33 (C N). 1H NMR [400 MHz, δ ppm, DMSO-d6]: 2.35 (s, 3H, –CH3), 7.19–7.18 (d, 1H, J = 4 Hz, Ar–H), 7.28–7.26 (d, 2H, J = 8 Hz, Ar–H), 7.47–7.45 (d, 2H, J = 8 Hz, Ar–H), 7.63–7.60 (m, 4H, Ar–H), 7.95–7.94 (m, 4H, Ar–H), 8.43–8.41 (d, 2H, J = 9.2 Hz, Ar–H), 8.58–8.56 (d, 1H, J = 5.2 Hz, Ar–H). 13C NMR [100 MHz, δ ppm, DMSO-d6]: 20.96, 103.77, 118.94, 119.97, 124.60, 125.25, 126.93, 127.66, 129.05, 129.37, 131.75, 134.03, 139.65, 146.67, 149.60, 151.97. Molecular weight; calculated: C24H19ClN4O: 414 found, LCMS; m/z 411(M + 1).
(E)-4-((7-Chloroquinolin-4-yl)amino)-N′-(4-methoxybenzylidene)benzohydrazide (6f)
This compound was prepared according to a general procedure and it was obtained as an off-white solid; yield: 78.8%; MP: 233–250 °C. FTIR (KBr, cm−1); 3179.79 (N–H), 3060.20 (Ar–CH), 1649.21 (C O), 1576.87 (C C), 1529.62 (C N). 1H NMR [400 MHz, δ ppm, DMSO-d6]: 3.80 (s, 3H, –OCH3), 7.03–7.01 (d, 2H, J = 8.4 Hz, Ar–H), 7.19–7.18 (d, 1H, J = 5.2 Hz, Ar–H), 7.47–7.45 (d, 2H, J = 8.4 Hz, Ar–H), 7.69–7.59 (m, 4H, Ar–H), 7.94 (t, 2H, Ar–H), 8.42–8.40 (d, 2H, J = 9.2 Hz, Ar–H), 8.58–8.57 (d, 1H, J = 5.2, Ar–H), 9.32 (s, 1H, Ar–NH–Ar), 11.64 (s, 1H, –CONH). 13C NMR [100 MHz, δ ppm, DMSO-d6]: 55.25, 103.83, 114.30, 118.92, 120.0, 124.57, 125.31, 126.96, 127.73, 128.56, 129.01, 134.05, 146.58, 147.17, 149.63, 152.04, 160.73. Molecular weight; calculated: C24H19ClN4O2: 430 found, LCMS; m/z 431(M + 1).
(E)-4-((7-Chloroquinolin-4-yl)amino)-N′-(3,4-dimethoxy benzylidene)benzohydrazide (6g)
This compound was prepared according to a general procedure and it was obtained as an off-white solid; yield: 72.10%, MP: 165–167 °C. FTIR (KBr, cm−1); 3275.27 (N–H), 3126.74 (Ar–CH), 1670.43 (C O), 1572.05 (C C), 1532.51 (C N). 1H NMR [400 MHz, δ ppm, DMSO-d6]; 3.81–3.80 (d, 6H, J = 4 Hz, –OCH3), 7.03–7.01 (d, 1H, J = 8 Hz, Ar–H), 7.13–7.11 (d, 1H, J = 8 Hz, Ar–H), 7.19–7.18 (d, 1H, J = 4 Hz, Ar–H), 7.40–7.34 (m, 2H, Ar–H), 7.49–7.45 (m, 1H, Ar–H), 7.62–7.59 (m, 1H, Ar–H), 7.86–7.84 (d, 1H, J = 8 Hz, Ar–H), 7.96–7.94 (m, 2H, Ar–H), 8.42–8.40 (m, 2H, Ar–H), 8.58–8.56 (m, 1H, Ar–H), 9.33 (s, 1H, Ar–NH–Ar), 11.65 (s, 1H, –CONH). 13C NMR [100 MHz, δ ppm, DMSO-d6]; 55.56, 103.82, 108.26, 111.51, 118.94, 120.03, 120.24, 121.74, 124.58, 125.33, 127.56, 127.75, 128.31, 129.03, 134.07, 143.94, 146.60, 147.54, 149.06, 149.64, 150.66, 152.04. Molecular weight; calculated: C25H21ClN4O3: 460 found, LCMS; m/z 461(M + 1).
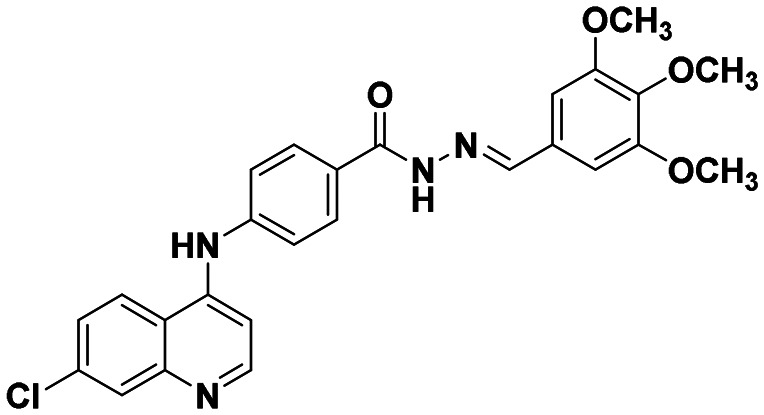
(E)-4-((7-Chloroquinolin-4-yl)amino)-N′-(3,4,5-trimethoxybenzylidene)benzohydrazide (6h)
This compound was prepared according to a general procedure and it was obtained as an off-white solid; yield: 66.2%, MP: 242–245 °C. FTIR (KBr, cm−1); 3179.79 (N–H), 2997.51 (Ar–CH), 1671.39 (C O), 1576.87 (C C), 1534.44 (C N). 1H NMR [400 MHz, δ ppm, DMSO-d6]; 3.70 (s, 3H, –OCH3), 3.84 (s, 6H, −(OCH3)2), 7.01 (S, 1H, Ar–H), 7.20–7.18 (d, 1H, J = 5.2 Hz, Ar–H), 7.48–7.46 (d, 2H, J = 8.4 Hz, Ar–H), 7.62–7.60 (m, 2H, Ar–H), 7.96–7.94 (m, 2H, Ar–H), 8.42–8.40 (m, 2H, Ar–H), 8.58–8.57 (d, 1H, J = 5.2 Hz, Ar–H), 9.33 (s, 1H, Ar–NH–Ar), 11.76 (s, 1H, –CONH). 13C NMR [100 MHz, δ ppm, DMSO-d6]; 103.85, 104.21, 118.92, 119.95, 124.56, 125.31, 127.73, 129.08, 129.90, 146.54, 149.62, 152.02, 153.15. Molecular weight; calculated: C25H21ClN4O3: 490 found, LCMS; m/z 489(M + 1).
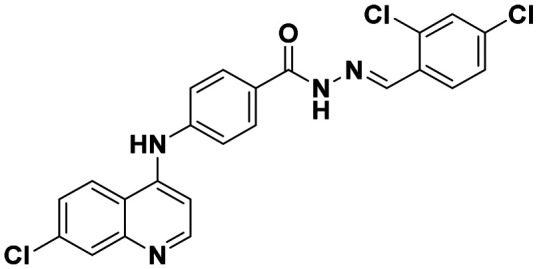
(E)-4-((7-Chloroquinolin-4-yl)amino)-N′-(2,4-dichloro benzylidene)benzohydrazide (6i)
This compound was prepared according to a general procedure and it was obtained as an off-white solid; yield: 86.6%, MP: 247–250 °C. FTIR (KBr, cm−1); 3099.74 (N–H), 3001.37 (Ar–CH), 1678.14 (C O), 1575.91 (C C), 1533.47 (C N). 1H NMR [400 MHz, δ ppm, DMSO-d6]; 7.25–7.24 (d,1H, J = 5.2 Hz, Ar–H), 7.54–7.50 (m, 3H, Ar–H), 7.66–7.63 (m, 1H, Ar–H), 7.756–7.751 (d, 1H, J = 2 Hz, Ar–H), 8.04–7.98 (m, 4H, Ar–H), 8.44–8.42 (d, 1H, J = 9.2 Hz, Ar–H), 8.62–8.60 (d, 1H, J = 9.2 Hz, Ar–H), 8.84 (s, 1H, Ar–H), 9.41 (s, 1H, Ar–NH–Ar), 12.12 (s, 1H, –CONH). 13C NMR [100 MHz, δ ppm, DMSO-d6]; 104.60, 119.53, 120.16, 125.0, 125.96, 127.30, 128.51, 129.68, 131.25, 134.39, 134.55, 135.48, 142.51, 144.91, 146.95, 150.0, 152.52, 162.81. Molecular weight; calculated: C23H15Cl3N4O: 469 found, LCMS; m/z 470(M + 1).
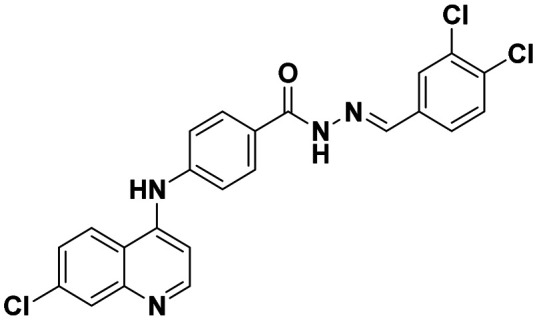
(E)-4-((7-Chloroquinolin-4-yl)amino)-N′-(3,4-dichlorobenzylidene)benzohydrazide (6j)
This compound was prepared according to a general procedure and it was obtained as an off-white solid; yield: 53.3% MP: 253–256 °C. FTIR (KBr, cm−1); 3250.91 (N–H), 3029.34 (Ar–CH), 1663.07 (C O), 1575.91 (C C), 1533.47 (C N). 1H NMR [400 MHz, δ ppm, DMSO-d6]; 7.16–7.14 (d, 1H, J = 8 Hz, Ar–H), 7.52–7.24 (d, 1H, Ar–H), 7.43–7.41 (m, 1H), 7.51–7.49 (d, 1H, J = 8 Hz, Ar–H), 7.68–7.61 (m, 2H, Ar–H), 7.89–7.87 (m, 1H, Ar–H), 7.97–7.95 (m, 1H, Ar–H), 8.44–8.41 (m, 1H, Ar–H), 8.57–8.56 (m, 1H, Ar–H), 8.62–8.60 (m, 1H, Ar–H), 9.31 (s, 1H, Ar–H), 9.41 (s, 1H, Ar–NH–Ar), 9.73 (S, 1H), 12.05 (s, 1H, –CO–NH). 13C NMR [100 MHz, δ ppm, DMSO-d6]; 103.97, 119.35, 120.78, 125.13, 125.83, 128.27, 128.87, 129.79, 134.60, 147.28, 150.15, 152.61, 165.97. Molecular weight; calculated: C23H15Cl3N4O: 469 found, LCMS; m/z 470(M + 1).
α-Glucosidase inhibition assay
The α-glucosidase enzyme inhibitory activity was determined using a previously reported method with little modification.24 An enzyme solution was prepared in potassium phosphate buffer (pH 6.8), and the synthesized compounds (6a–6j) were dissolved in DMSO solution (5 mg mL−1) and were reconstituted in 100 μL of 100 mM potassium phosphate buffer. 10 μL of test sample was added in a 96-well microplate and incubated with 50 μL of α-glucosidase enzyme for 5 min; later a substrate (5 mM, p-nitrophenyl-α-d-glucopyranoside in the same potassium phosphate buffer) was added. The spectrophotometrical measurement of released p-nitrophenol at 405 nm was analyzed after 5 min incubation with the substrate. DMSO was used as the control and acarbose was used as the standard drug for comparison. The percentage inhibition for each test sample was calculated using the formula,% inhibition = [(Abs of control − Abs of the test)/Abs Control]
α-Amylase inhibition assay
The α-amylase enzyme inhibitory activity was determined using a previously reported procedure.15 The reaction mixture consists of the synthesized test compounds 6a–6j dissolved in DMSO and methanol making up %inhibition = [(Abs of control − Abs of the test)/Abs Control]the remaining volume; acarbose was used as a standard comparative drug and methanol as blank. The reaction mixture was pre-incubated for 15 minutes at 37 degrees Celsius. Then, each tube was filled with a (1%) starch solution and incubated for 25 minutes at 37 degrees Celsius. To stop the reaction, 600 μL of DNSA reagent was added to each tube which was incubated at 100 °C for 8 minutes. The tubes were cooled by immersing them in a cold water bath. Finally, a final dilution (1 mL) was made in each tube to make up the volume using Millipore water.
The absorbance was measured using a 549 nm spectrophotometer. The percentage inhibition was calculated using the formula% inhibition = [(Abs of control − Abs of the test)/Abs Control]
α-Glucosidase enzyme kinetic study
The most active compounds among the series, compounds 6b and 6c, were studied for their inhibitory activity by enzyme kinetic studies against α-glucosidase enzyme; p-nitrophenyl-α-d-glucopyranoside with different concentrations (0–16 μM) was used as the substrate in the presence and absence of samples 6b and 6c at different concentrations of 0, 4.84, 9.68 and 19.37 and 0, 3.23, 6.47 and 12.95, respectively. The type of inhibition was recognized by plotting the Lineweaver–Burk plot, and the Michaelis–Menten constant (Km) was obtained using the plot between the reciprocal of (1/[S]) substrate concentrations and reciprocal of the rate of enzyme (1/V) for different concentrations of inhibitors, also the Kmvs. the different concentrations of inhibitors 6b and 6c was plotted.28,29
Cytotoxicity studies
To evaluate the toxicity of a synthesized compound, MTT (3-(4,5-dimethylthiazo-2-yl)-2,5-diphenyl-tetrazolium bromide) assay was performed on a normal mouse L929 cell line as per previously reported literature.30
Molecular docking studies
Ligand preparation
All the structure of the synthesized ligands was sketched using Maestro 13.2 (Schrödinger, 2022-4). The LigPrep panel of the Schrödinger suite was used for preparing ligands by adding polar hydrogens, and adding ionization states using the Epik module; torsional flexibility was given to obtain a better complimentary pose. Finally, the optimized potential for liquid simulation (OPLS4) was used for energy minimization.
Homology modeling and protein preparation
The three-dimensional structure (3D) of α-glucosidase for S. cerevisiae was built using homology modeling via the Prime module of the Schrödinger suite.31,32 The Fasta sequence was queried from the UniProt protein resource database (https://www.uniprot.org/), using the accession code P53341. A similarity search was carried out using BLAST; PDB ID 3A47 was obtained as the template protein structure, and a homology model of α-glucosidase was built and assessed for the protein reliability report and Ramachandran plot. Further, this protein was prepared by adding polar hydrogens, assigning bond orders, creating zero bond orders to metals, creating disulfide bonds, adding terminal oxygen to protein chains, converting selenomethionines to methionines, filling missing loops using Prime, filling missing side chains, and capping terminals of the protein and finally the Epik module was used to generate het states at pH 7.4. Further optimization of the protein structure was carried out using sample water orientations; altered hydrogen species within the protein was minimized and finally optimized using the PROPKA module, and lastly, the whole protein structure was energy minimized using the optimized potential for the liquid simulation (OPLS4) force field.33
Binding site detection and grid generation
A site map tool was utilized for identifying the binding sites for the prepared α-glucosidase protein, site1 was selected as binding sites based on the site score and volume of the binding pocket, the active site residues obtained were found to be ASN 314, ARG 443, TYR 344, ASP 429, ARG 439, TYR 313, ASN 412, ILE 415, GLU 276, VAL 277, ALA 278, HIE 279, ASP 408, LYS 155, SER 156, PHE 157, PHE 158, GLY 159, GLY 160, ILE 416, LYS 418, SER 419, PHE 420, GLN 238, GLU 426, HIE 239, PHE 298, PHE 300, VAL 303, GLU 304, VAL 305, GLY 306, THR 307, SER 308, PRO 309, PHE 310, PHE 311, ARG 312, TRP 57, VAL 316, PRO 317, PHE 318, GLN 322, ASP 68, MET 69, TYR 71, ALA 326, HIE 111, HIS 245, HIE 348, ASH 214, ASN 347, ASP 349, GLN 350, PHE 117, ARG 212, THR 215, ALA 216, GLY 217, LEU 218, SER 228, PRO 229, PHE 231, ASP 232, THR 234, SER 235, LYS 236, LEU 237, PRO 240, ASN 241, TRP 242, ASN 246. Hence the grid was generated by selecting these amino acid residues as the centroid of the grid using the grid generation panel of the Glide module of the Schrödinger suite. Similarly, the α-amylase protein (PDB ID: 4 W93) was prepared and refined using the protein preparation workflow of the Schrödinger suite. The grid was generated at the cocrystal (montbretin A) site, using a grid generation panel, and was further utilised for the molecular docking studies.
Molecular docking
The extra precision mode (XP) from the Glide module was utilized for docking studies.34,35 The Glide XP mode can semi-quantitatively rank the ligands that bind to the specific conformation of protein receptors and helps in scoring these ligands considering the penalties which include steric clashes, solvent exposure, etc. Here we docked the synthesized compounds (6a–6j) into the binding pockets of α-glucosidase and α-amylase. Acarbose was used as a standard for the validation of the docking protocol.
Molecular dynamic (MD) simulations
MD simulation studies were carried out to predict the stability of the overall protein–ligand complex in the binding pocket of α-amylase and α-glucosidase enzyme throughout 200 ns using the Desmond module of the Schrödinger suite.36 Prior to the setting up of a system for simulation, the protein–ligand complex was minimized using the OPLS4 force field, then the TIP3P solvation model was used, and the box boundary was set up as orthorhombic to specify the shape and size of units repeating for the 10 Å buffer region between the complex atoms and box boundary. Na+/Cl− counter ions were used to neutralize the system. Further, the system was subjected to 300 K temperature and pressure of 1.01325 bar for 200 ns using an NPT ensemble. Finally, MD trajectories were recorded and the RMSD, RMSF, hydrogen bonding contacts, and radius of gyration in the protein–ligand complex were analyzed using simulation interaction diagrams.35
MM/GBSA calculations
The binding pose of all (6a–6j) ligands into the binding pocket of α-amylase and α-glucosidase enzyme were evaluated using the molecular mechanics/generalized Born surface area (MM/GBSA) method developed by Kollman et al.;37 here calculations are based on the sum of the gas-phase molecular mechanics interaction energy between the ligand and protein (ΔEMM), the change in conformational entropy associated with ligand binding (–TΔS), and the solvation free energy (ΔGsolv) as shown in following equation.38ΔGbind = ΔEMM + ΔGsolv − TΔS
Density functional theory (DFT) studies
Geometric optimization
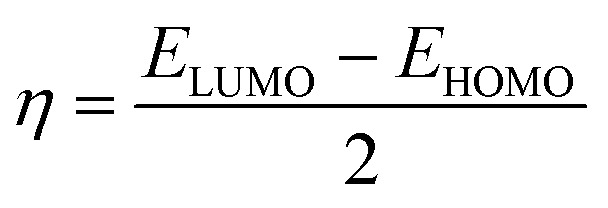
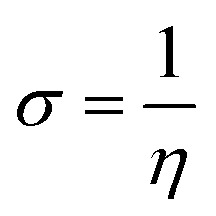
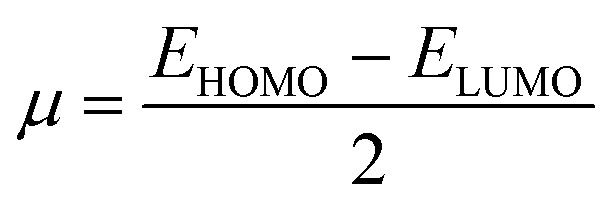
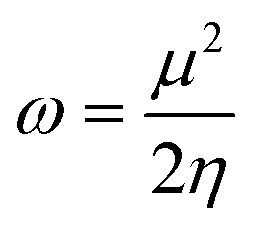
The most stable molecular shape can be anticipated by minimizing the system's energy, allowing the calculation of bond lengths, angles, and dihedral angles. Density functional theory (DFT) is a computerized approach used in quantum chemistry and materials science to investigate the electronic structure and characteristics of molecules. All the synthesized molecules were subjected to geometric optimization through the B3LYP (Becke's three-parameter hybrid functional, Lee–Yang–Parr correlation functional) functional and 6-31 G (d,p) basis set, using the Jaguar module of Schrödinger software. Also, an electrostatic potential map (ESP) was generated for all the synthesized molecules; quantum chemical parameters such as the energy gap (ΔEGAP), dipole moment (μ), hardness (η), and local softness (σ) can be calculated using the (frontier molecular orbitals) highest occupied molecular orbital (EHOMO), lowest unoccupied molecular orbital (ELUMO) and following equations.39,40
| ΔEGAP = ELUMO − EHOMO | 1 |
 |
2 |
 |
3 |
 |
4 |
 |
5 |
ADMET predictions
ADMET i.e. adsorption, distribution, metabolism, excretion, and toxicity parameters are crucial in the early stage of drug discovery. The ADMET parameters of the synthesized hits were predicted using the Qikprop module of the Schrödinger suite.41
Conclusion
This study utilized a combination of computational and rational drug design methods to pinpoint potential α-glucosidase inhibitors for their anti-diabetic properties. Starting with a quinoline-based benzohydrazide Schiff base moiety from the existing literature, we created a molecular library. A pharmacophore model was developed using 64 molecules, split into a training set of 47 and a test set of 17, to identify molecules with defined α-glucosidase inhibitory activity obtained from the literature. Among 12 hypothesis models, the AADRR_1 model was chosen for further screening of our designed ligand library. A 3D QSAR model was then constructed based on the active compounds from the pharmacophore model. The top 10 ligands identified through pharmacophore screening were synthesized and characterized using various spectroscopic methods. These compounds were evaluated for their anti-diabetic effects by inhibiting α-glucosidase and α-amylase enzymes. Compounds 6b and 6c showed significant inhibitory effects on α-glucosidase (IC50 values of 19.37 ± 0.96 μM and 12.95 ± 2.35 μM, respectively) and α-amylase (IC50 values of 29.36 ± 3.24 μM for 6b and 33.04 ± 1.83 μM for 6c). MTT assays on normal mouse fibroblast L929 cell lines revealed no toxicity among synthesized compounds (6a–6j). Molecular docking and MD simulations over 200 ns were conducted to assess binding affinity and stability. Energetics were evaluated using MM/GBSA and DFT methods. Based on these findings, compounds 6b and 6c were identified as lead candidates for further optimization toward developing novel antidiabetic agents.
Data availability
All data are included in the manuscript.
Author contributions
Shankar G. Alegaon: conceptualisation, methodology and supervision; Shriram D. Ranade: synthesis, characterization, computational studies and manuscript writing; Shankar Gharge and Nayeem Khatib: α-amylase and α-glucosidase inhibition assay; Rohini S. Kavalapure: support in biological evaluation.
Conflicts of interest
There are no conflicts to declare.
Supplementary Material
Acknowledgments
This work was supported by the Department of Pharmaceutical Chemistry, KLE College of Pharmacy, KLE Academy of Higher Education and Research, Belagavi. NMR was carried out at the Sophisticated Analytical Instrument Facility (SAIF) Karnataka University Dharwad.
Electronic supplementary information (ESI) available. See DOI: https://doi.org/10.1039/d4md00344f
References
- Galicia-Garcia U. Benito-Vicente A. Jebari S. Larrea-Seba A. Siddiqi H. Uribe K. B. Martin C. Pathophysiology of type 2 diabetes mellitus. Int. J. Mol. Sci. 2020;21(17):6275. doi: 10.3390/ijms21176275. [DOI] [PMC free article] [PubMed] [Google Scholar]
- Diabetes Atlas IDF, International Diabetes Federation, Brussels, Belgium, 10th edn, 2021, https://www.diabetesatlas.org (Accessed 2024) [Google Scholar]
- Padhi S. Nayak A. K. Behera A. Type II diabetes mellitus: a review on recent drug-based therapeutics. Biomed. Pharmacother. 2020;131:110708. doi: 10.1016/j.biopha.2020.110708. [DOI] [PubMed] [Google Scholar]
- Kanwal A. Kanwar N. Bharati S. Srivastava P. Singh S. P. Amar S. Exploring new drug targets for type 2 diabetes: success, challenges and opportunities. Biomedicines. 2022;10(2):331. doi: 10.3390/biomedicines10020331. [DOI] [PMC free article] [PubMed] [Google Scholar]
- Benalla W. Bellahcen S. Bnouham M. Antidiabetic medicinal plants as a source of alpha glucosidase inhibitors. Curr. Diabetes Rev. 2010;6(4):247–254. doi: 10.2174/157339910791658826. [DOI] [PubMed] [Google Scholar]
- Kaur N. Kumar V. Nayak S. K. Wadhwa P. Kaur P. Sahu S. K. Alpha-amylase as a molecular target for the treatment of diabetes mellitus: A comprehensive review. Chem. Biol. Drug Des. 2021;98(4):539–560. doi: 10.1111/cbdd.13909. [DOI] [PubMed] [Google Scholar]
- Dabhi A. S. Bhatt N. R. Shah M. J. Voglibose: an alpha glucosidase inhibitor. J. Clin. Diagn. Res. 2013;7(12):3023. doi: 10.7860/JCDR/2013/6373.3838. [DOI] [PMC free article] [PubMed] [Google Scholar]
- Sugihara H. Nagao M. Harada T. Nakajima Y. Tanimura-Inagaki K. Okajima F. Oikawa S. Comparison of three α-glucosidase inhibitors for glycemic control and body weight reduction in Japanese patients with obese type 2 diabetes. J. Diabetes Invest. 2014;5(2):206–212. doi: 10.1111/jdi.12135. [DOI] [PMC free article] [PubMed] [Google Scholar]
- Roscales S. Plumet J. Biosynthesis and biological activity of carbasugars. Int. J. Carbohydr. Chem. 2016:4760548. [Google Scholar]
- Yadav P. Shah K. Quinolines, a perpetual, multipurpose scaffold in medicinal chemistry. Bioorg. Chem. 2021;109:104639. doi: 10.1016/j.bioorg.2021.104639. [DOI] [PubMed] [Google Scholar]
- Elebiju O. F. Ajani O. O. Oduselu G. O. Ogunnupebi T. A. Adebiyi E. Recent advances in functionalized quinoline scaffolds and hybrids—Exceptional pharmacophore in therapeutic medicine. Front. Chem. 2023;10:1074331. doi: 10.3389/fchem.2022.1074331. [DOI] [PMC free article] [PubMed] [Google Scholar]
- Kerru N. Gummidi L. Maddila S. Gangu K. K. Jonnalagadda S. B. A review on recent advances in nitrogen-containing molecules and their biological applications. Molecules. 2020;25(8):1909. doi: 10.3390/molecules25081909. [DOI] [PMC free article] [PubMed] [Google Scholar]
- Ilakiyalakshmi M. Napoleon A. A. Review on recent development of quinoline for anticancer activities. Arabian J. Chem. 2022;15(11):104168. doi: 10.1016/j.arabjc.2022.104168. [DOI] [Google Scholar]
- Kumari L. Mazumder A. Pandey D. Yar M. S. Kumar R. Mazumder R. Gupta S. Synthesis and biological potentials of quinoline analogs: A review of the literature. Mini-Rev. Org. Chem. 2019;16(7):653–688. doi: 10.2174/1570193X16666190213105146. [DOI] [Google Scholar]
- Noreen T. Taha M. Imra S. Chigurupati S. Rahim F. Selvaraj M. Ali M. Synthesis of alpha-amylase inhibitors based on privileged indole scaffold. Bioorg. Chem. 2017;72:248–255. doi: 10.1016/j.bioorg.2017.04.010. [DOI] [PubMed] [Google Scholar]
- Taha M. Javid M. T. Imran S. Selvaraj M. Chigurupati S. Ullah H. Khan K. M. Synthesis and study of the α-amylase inhibitory potential of thiadiazole quinoline derivatives. Bioorg. Chem. 2017;74:179–186. doi: 10.1016/j.bioorg.2017.08.003. [DOI] [PubMed] [Google Scholar]
- Taha M. Ismail N. H. Imran S. Wadood A. Rahim F. Ali M. Rehman A. U. Novel quinoline derivatives as potent in vitro α-glucosidase inhibitors: in silico studies and SAR predictions. MedChemComm. 2015;6(10):1826–1836. doi: 10.1039/C5MD00280J. [DOI] [Google Scholar]
- Taha M. Sultan S. Imran S. Rahim F. Zaman K. Wadood A. Khan K. M. Synthesis of quinoline derivatives as diabetic II inhibitors and molecular docking studies. Bioorg. Med. Chem. 2019;27(18):4081–4088. doi: 10.1016/j.bmc.2019.07.035. [DOI] [PubMed] [Google Scholar]
- Forozan R. Ghomi M. K. Iraji A. Montazer M. N. Noori M. Dastyafteh N. Mahdavi M. Synthesis, in vitro inhibitor screening, structure-activity relationship, and molecular dynamic simulation studies of novel thioquinoline derivatives as potent α-glucosidase inhibitors. Sci. Rep. 2023;13(1):7819. doi: 10.1038/s41598-023-35140-5. [DOI] [PMC free article] [PubMed] [Google Scholar]
- Cele N. Awolade P. Seboletswe P. Olofinsan K. Islam M. S. Singh P. α-glucosidase and α-amylase inhibitory potentials of quinoline–1, 3, 4-oxadiazole conjugates bearing 1, 2, 3-triazole with antioxidant activity, kinetic studies, and computational validation. Pharmaceuticals. 2022;15(8):1035. doi: 10.3390/ph15081035. [DOI] [PMC free article] [PubMed] [Google Scholar]
- Al-Ghorbani M. Alharbi O. Al-Odayni A. B. Abduh N. A. Quinoline-and Isoindoline-Integrated Polycyclic Compounds as Antioxidant, and Antidiabetic Agents Targeting the Dual Inhibition of α-Glycosidase and α-amylase Enzymes. Pharmaceuticals. 2023;16(9):1222. doi: 10.3390/ph16091222. [DOI] [PMC free article] [PubMed] [Google Scholar]
- Noori M. Rastak M. Halimi M. Ghomi M. K. Mollazadeh M. Mohammadi-Khanaposhtani M. Mahdavi M. Design, synthesis, in vitro, and in silico enzymatic evaluations of thieno [2, 3-b] quinoline-hydrazones as novel inhibitors for α-glucosidase. Bioorg. Chem. 2022;127:105996. doi: 10.1016/j.bioorg.2022.105996. [DOI] [PubMed] [Google Scholar]
- Ranade S. D. Alegaon S. G. Venkatasubramanian U. Priya A. S. Kavalapure R. S. Chand J. Vinod D. Design, synthesis, molecular dynamics simulation, MM/GBSA studies and kinesin spindle protein inhibitory evaluation of some 4-aminoquinoline hybrids. Comput. Biol. Chem. 2023;105:107881. doi: 10.1016/j.compbiolchem.2023.107881. [DOI] [PubMed] [Google Scholar]
- Yousuf H. Shamim S. Khan K. M. Chigurupati S. Hameed S. Khan M. N. Arfeen M. Dihydropyridines as potential α-amylase and α-glucosidase inhibitors: synthesis, in vitro and in silico studies. Bioorg. Chem. 2020;96:103581. doi: 10.1016/j.bioorg.2020.103581. [DOI] [PubMed] [Google Scholar]
- Dixon S. L. Smondyrev A. M. Rao S. N. PHASE: a novel approach to pharmacophore modeling and 3D database searching. Chem. Biol. Drug Des. 2006;67(5):370–372. doi: 10.1111/j.1747-0285.2006.00384.x. [DOI] [PubMed] [Google Scholar]
- Chapdelaine P. Tremblay R. R. Dube J. Y. P-Nitrophenol-alpha-D-glucopyranoside as a substrate for the measurement of maltase activity in human semen. Clin. Chem. 1978;24(2):208–211. doi: 10.1093/clinchem/24.2.208. [DOI] [PubMed] [Google Scholar]
- Nikookar H. Mohammadi-Khanaposhtani M. Imanparast S. Faramarzi M. A. Ranjbar P. R. Mahdavi M. Larijani B. Design, synthesis and in vitro α-glucosidase inhibition of novel dihydropyrano [3, 2-c] quinoline derivatives as potential anti-diabetic agents. Bioorg. Chem. 2018;77:280–286. doi: 10.1016/j.bioorg.2018.01.025. [DOI] [PubMed] [Google Scholar]
- Mughal E. U. Hawsawi M. B. Naeem N. Hassan A. Alluhaibi M. S. Shah S. W. Nazir Y. Sadiq A. Alrafai H. A. Ahmed S. A. Exploring Fluorine-Substituted Piperidines as Potential Therapeutics for Diabetes Mellitus and Alzheimer's Diseases. Eur. J. Med. Chem. 2024;21:s. doi: 10.1016/j.ejmech.2024.116523. [DOI] [PubMed] [Google Scholar]
- Mehmood R. Mughal E. U. Elkaeed E. B. Obaid R. J. Nazir Y. Al-Ghulikah H. A. Naeem N. Al-Rooqi M. M. Ahmed S. A. Shah S. W. Sadiq A. Synthesis of novel 2, 3-dihydro-1, 5-benzothiazepines as α-glucosidase inhibitors: In vitro, in vivo, kinetic, SAR, molecular docking, and QSAR studies. ACS Omega. 2022;7(34):30215–30232. doi: 10.1021/acsomega.2c03328. [DOI] [PMC free article] [PubMed] [Google Scholar]
- Mosmann T. Rapid colorimetric assay for cellular growth and survival: application to proliferation and cytotoxicity assays. J. Immunol. Methods. 1983;65(1–2):55–63. doi: 10.1016/0022-1759(83)90303-4. [DOI] [PubMed] [Google Scholar]
- Jacobson M. P. Pincus D. L. Rapp C. S. Day T. J. Honig B. Shaw D. E. Friesner R. A. A hierarchical approach to all-atom protein loop prediction. Proteins: Struct., Funct., Bioinf. 2004;55(2):351–367. doi: 10.1002/prot.10613. [DOI] [PubMed] [Google Scholar]
- Jacobson M. P. Friesner R. A. Xiang Z. Honig B. On the role of crystal packing forces in determining protein sidechain conformations. J. Mol. Biol. 2002;320:597–608. doi: 10.1016/S0022-2836(02)00470-9. [DOI] [PubMed] [Google Scholar]
- Yang Y. Yao Y. Repasky M. P. Leswing K. Abel R. Shoichet B. K. Jerome S. V. Efficient exploration of chemical space with docking and deep learning. J. Chem. Theory Comput. 2021;17(11):7106–7119. doi: 10.1021/acs.jctc.1c00810. [DOI] [PubMed] [Google Scholar]
- Halgren T. A. Murphy R. B. Friesner R. A. Beard H. S. Frye L. L. Pollard W. T. Banks J. L. Glide: a new approach for rapid, accurate docking and scoring. 2. Enrichment factors in database screening. J. Med. Chem. 2004;47(7):1750–1759. doi: 10.1021/jm030644s. [DOI] [PubMed] [Google Scholar]
- Bowers K. J., International Conference for High Performance Computing, Networking, Storage and Analysis, Scalable algorithms for molecular dynamics simulations on commodity clusters, Tampa Florida, November 2006 [Google Scholar]
- Jorgensen W. L. Maxwell D. S. Tirado-Rives J. Development and testing of the OPLS all-atom force field on conformational energetics and properties of organic liquids. J. Am. Chem. Soc. 1996;118(45):11225–11236. doi: 10.1021/ja9621760. [DOI] [Google Scholar]
- Wang W. Kollman P. A. Free energy calculations on dimer stability of the HIV protease using molecular dynamics and a continuum solvent model. J. Mol. Biol. 2000;303(4):567–582. doi: 10.1006/jmbi.2000.4057. [DOI] [PubMed] [Google Scholar]
- Wang E. Sun H. Wang J. Wang Z. Liu H. Zhang J. Z. Hou T. End-point binding free energy calculation with MM/PBSA and MM/GBSA: strategies and applications in drug design. Chem. Rev. 2019;119(16):9478–9508. doi: 10.1021/acs.chemrev.9b00055. [DOI] [PubMed] [Google Scholar]
- Elkolli M. Chafai N. Chafaa S. Kadi I. Bensouici C. Hellal A. New phosphinic and phosphonic acids: Synthesis, antidiabetic, anti-Alzheimer, antioxidant activity, DFT study, and SARS-CoV-2 inhibition. J. Mol. Struct. 2022;1268:133701. doi: 10.1016/j.molstruc.2022.133701. [DOI] [Google Scholar]
- Ahmed A. Saeed A. Ejaz S. A. Aziz M. Hashmi M. Z. Channar P. A. El-Seedi H. R. Novel adamantyl clubbed iminothiazolidinones as promising elastase inhibitors: design, synthesis, molecular docking, ADMET and DFT studies. RSC Adv. 2022;12(19):11974–11991. doi: 10.1039/D1RA09318E. [DOI] [PMC free article] [PubMed] [Google Scholar]
- Schrödinger Release 2024-1: QikProp, Schrödinger, LLC, New York, NY, 2024 [Google Scholar]
Associated Data
This section collects any data citations, data availability statements, or supplementary materials included in this article.
Supplementary Materials
Data Availability Statement
All data are included in the manuscript.


