

Abstract
Zika and dengue are mosquito-borne diseases that present similar non-specific symptoms but possess dramatically different outcomes. The first line of defense in epidemic outbreaks are rapid point of care diagnostics. Because many outbreaks occur in areas that are resource-poor, assays that are easy to use, inexpensive, and require no power have become invaluable in patient treatment, quarantining, and surveillance. Paper-based sandwich immunoassays such as lateral flow assays (LFA) are attractive as point-of-care solutions as they have the potential for wider deployability than lab-based assays such as PCR. However, their low sensitivity imposes limitations on their ability to detect low biomarker levels and for early diagnosis. Here, we exploit the high sensitivity of surface enhanced Raman spectroscopy (SERS) in a multiplexed assay that can distinguish between Zika and dengue (nonstructural protein 1) NS1 biomarkers. SERS-encoded gold nanostars were conjugated to specific antibodies for both diseases and used in a dipstick immunoassay, which exhibited 15-fold lower detection limits for Zika NS1 and 7-fold for dengue NS1. This platform combines the simplicity of a LFA with the high sensitivity of SERS and could potentially improve Zika diagnosis, but also detect diseases sooner after infection when biomarker levels are low.
Keywords: Surface enhanced Raman spectroscopy, gold nanostars, Zika, dengue, sandwich immunoassay, lateral flow assay, immunochemistry, NS1
Graphical Abstract
Zika and dengue are infectious diseases that are currently a major global health threats1,2 due to climate change3 and increased international travel4,5. Both diseases cause similar initial non-specific symptoms, such as systemic febrile illness, but possess drastically different potential complications. Infections with dengue virus (DENV) can result in dengue hemorrhagic fever6 or dengue shock syndrome, which are both life-threatening, whereas Zika infections (ZIKV) have been linked to microcephaly in newborns7,8 and other neurological manifestations such as Guillain-Barré syndrome9. Zika and dengue can co-circulate geographically, as they share the same transmission vector of the Aedes genus mosquito10. This overlap in clinical presentations and geographic co-localization in endemic areas make it difficult to distinguish between their infections11. Therefore, multiplexed point-of-care (POC) assays that can differentiate the two diseases12 have been of interest for not only patient care but also disease surveillance, emergency preparedness and rapid response efforts. Typically, PCR is used for diagnosis13 due to its high sensitivity and specificity. However, as a nucleic acid amplification technique, it requires specialized equipment and reagents and trained personnel to operate. In contrast, paper-based lateral flow (LFA) and dipstick immunoassays can detect antigens within minutes by of a sandwich immunoassay, and are promising point of care alternatives14,15. In a typical assay, the sample (e.g. biological fluid) is added onto the sample pad where the antigen binds to the detection label (e.g. antibody-conjugated gold nanoparticles). The mobile phase wicks through the stationary phase by capillary action, passing the test line, where the antigen-nanoparticle complex is trapped and accumulated, thus rendering a colored band16. These assays are self-contained in that they do not require special reagents or power to run, and can provide an answer within minutes, so they are attractive for rapid diagnostics. Furthermore, they can be multiplexed for testing two diseases simultaneously in a single device.
Because test readout is typically by eye, low sensitivity can be a drawback. For acute dengue this is not problematic because its biomarker, non-structural protein 1 (NS1), is known to be present in patient serum at high levels, ~15 μg/ml at two days post infection17. In contrast, ZIKV NS1 levels are still largely not known, but based on low viremia and initial reports, they are expected to be much lower than DENV NS118. Thus, increasing assay sensitivity is necessary for Zika detection, and would also aid in early and late detection of both pathogens.
There have been various approaches to improve LFA sensitivity by changing the detection label (quantum dots19, fluorescence20, thermal contrast21) or by improving the interaction between the analyte and the label by techniques such as isotachophoresis22, or silver staining to increase signal intensity23. One promising method is Surface-Enhanced Raman Spectroscopy (SERS), which is a near-field effect that occurs when a metal surface (e.g. gold) is irradiated at the metal’s plasmonic resonance, generating a strong local electromagnetic field and resulting in enhancement of the Raman scattering of molecules adsorbed near the surface24. Enhancement factors as high as 104-109 have been observed25 and can be increased by optimizing the geometry of the metal, where sharp tips and edges can strengthen enhancement, resulting in “hot spots”26. The technique does not suffer from photobleaching to the same extent as fluorescence, and excitation and detection can be chosen to coincide with the tissue window27. Thus, SERS has generated great interest for applications such as cancer theranostics28,29 and molecular imaging30,31.
Because Raman is a vibrational spectroscopic technique, and proteins have a complex vibrational signature, spectrally distinguishing between Zika and dengue biomarkers or antibodies is not straightforward32. To overcome this limitation, molecules with unique Raman spectra attached to nanoparticles can be used as reporters to enable detection in a sandwich immunoassay format to distinguish between Zika and dengue. Multiplexed SERS has been used to identify multiple protein biomarkers in cancer33, but so far the combination of SERS and LFA has only been used for single biomarker and not multiplexed detection34.
Here, we demonstrate a multiplexed SERS-based immunoassay that can distinguish ZIKV and DENV NS1. SERS encoded-gold nanostars using 1,2-bis(4-pyridyl)ethylene (BPE) and 4-mercaptobenzoic acid (MBA) as Raman reporter molecules, or “nanotags,” were conjugated to specific antibodies that can distinguish between the ZIKV and DENV NS1 biomarkers. We determine that SERS can decrease the limit of detection (LOD) relative to colorimetric LFA assays by 15-fold for ZIKV NS1 and 7.2-fold for DENV NS1. Because Raman instrumentation is now portable, the nanotags in combination with specific antibodies can be leveraged for a SERS-based LFA POC platform to detect single and multiple infections of these closely related diseases.
RESULTS AND DISCUSSION
SERS-encoded Ab-conjugated GNS synthesis.
Gold Nanostars (GNS) were synthesized in HEPES buffer35–37. Hydrodynamic diameter (DH) measured by Dynamic Light Scattering (DLS) to be DH = 36.8 ± 5.7 nm (Figure 1A) and a zeta potential of ζ = −39.9 ± 1.3 nm (Figure 1B). The conjugates were GNS-BPE-anti-Zika, or Zika nanotags (“Z-nanotags,”) and GNS-MBA-anti-dengue, or Dengue nanotags (“D-nanotags”). TEM imaging of GNS showed star-shaped gold cores of ~47.7 ± 12.2 nm for Z-nanotags (Figure 1C) and 54 ± 12.1 nm (Figure 1D) for D-Nanotags, in agreement with DLS data. GNSs exhibited a SPR peak at 749 nm, confirming absorption in the near-infrared (Figure 1E). To distinguish between the biomarkers in a multiplexed SERS-based LFA, the molecules BPE and MBA were used as Raman reporters. BPE was adsorbed onto the GNS surface for ZIKV detection, whereas MBA was used for DENV detection. The amount of reporter added to the GNS was calculated to result in monolayer coverage on the GNS, assuming all reporter molecule bound to the GNSs.
Figure 1:

Characterization of nanostars (GNSs) used for SERS immunoassay. (a) and Zeta potential (b) of aqueous solutions of plain GNSs, Z-nanotags and D-nanotags (error bars are measurements of n=5; mean ± SD) (*p<0.05, **p<0.01). TEM images of Z-nanotags (c) and D-nanotags (d), Scale bar = 100 nm. e) optical absorption of plain GNSs (blue), GNSs conjugated to anti-Zika antibodies (yellow) and GNSs conjugated to anti-dengue antibodies (orange).
Next, monoclonal antibodies (Abs) were attached to GNSs by a heterobifunctional linker consisting of a dithiol on one end, which binds to GNSs via a gold-thiol bond, and a hydrazide on the other, which binds through a short polyethylene glycol (PEG) chain linker to the antibody Fc region38,39. Afterwards, thiolated PEG (MW = 5 kDa) was added as a backfill for remaining bare gold surface to reduce non-specific interactions. The DH of the GNS-Abs increased to 265 ± 44 nm, for Z-nanotag, and 200 ± 43 nm, for D-nanotag, confirming conjugation (Figure 1A). Zeta potential also changed to −16.8 ± 1.5 nm and −14.3 ± 0.9 nm, for Z-nanotags and D-nanotags, respectively, showing a change on GNS surface due to the antibody and linker attachment (Figure 1B).
A red-shift of the SPR peak was observed for conjugated GNS (8 nm for dengue Ab and 11 nm for Zika Ab, Figure 1E), also confirming conjugation. This was due to both changes in the local refractive index after addition of the protein layer around the GNS39 and some GNS aggregation, also observed in the peaks broadening.
Antibody coverage on the GNSs was quantified by ELISA and determined to be ~8.84 Zika Ab/GNS and ~3.27 dengue Ab/GNS39,40 (Figure S1). Assuming an average footprint of 81.3 nm2 for a typical IgG antibody41 and that synthesized GNS have an average surface area of 2.9 X 10³ nm2 35, the results suggest submonolayer coverage.
SERS signal enhancement of Ab-conjugated GNSs.
To quantify the increase in signal intensity from SERS, Raman signal enhancements of BPE and MBA-encoded GNS were measured. Raman spectral intensities of plain reporter molecules were compared to intensities of the reporter-encoded GNSs under excitation at 785 nm (Figure 2).
Figure 2:

Raman spectroscopy of reporter molecules and nanotags. a) BPE Raman (gray) and SERS (red) signal at 785 nm and 100 mW on a glass slide. The SERS enhancement is 6.3X10⁵. b) MBA Raman (gray) and SERS (red) signal at 785 nm and 100 mW on a glass slide. The SERS enhancement is 8.6X10⁵. All spectra shown are the average of 10 measurements.
Surface enhancement factors (EF) of GNSs were calculated using the highest intensity bands of each reporter. For BPE, the peak at 1609 cm−1 corresponding to C-C/N stretch was used42,43, whereas for MBA the peak at 1584 cm−1 assigned to the ν8a vibrational mode of phenyl ring-stretching motion was used44. EF was calculated using the following equation45,46
| (1) |
where is the peak intensity, the number of contributing reporter molecules, the laser power, the integration time and subscripts Raman and SERS stand for measurements performed on the reporter molecule or on the GNS, respectively. Assuming monolayer coverage of the reporters and acquiring the spectra under the same conditions of laser power and aperture, the EFs of GNS-BPE and GNS-MBA were estimated to be 6.3 X 10⁵ and 8.6 X 10⁵, respectively, within the range that has been reported for similar reporter molecules on GNSs (104-106)47,48. These results confirm that GNSs can enhance the signal of the reporter molecules, and that reporter spectra can be distinguished from one another.
Individvual immunoassay tests for detection of ZIKV and DENV-3.
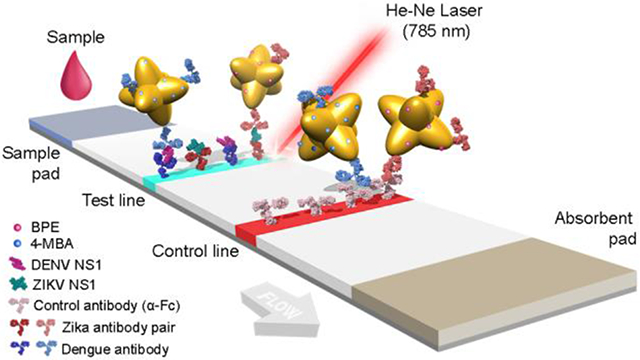
The working principle behind immunoassays is antigen detection by a pair of antibodies in sandwich format. Here, the viral non-structural proteins (NS1) from dengue (DENV-3) and Zika were used as biomarkers. Monoclonal antibodies were obtained by injecting mice with ZIKV and DENV NS1 protein, individually in three animals, and clones producing IgG capable of binding to ZIKV and DENV NS1 with no crossover reactivity were selected to distinguish the viruses in a multiplex assay. Specific antibody pairs for ZIKV and DENV were developed. Immunoassays were run in a dipstick format40, which consisted of a nitrocellulose strip onto which NS1 antibodies were immobilized on the test line, while a control antibody (anti-Fc) at the control line (Figure 3A). Abs of the pair were atached to the GNS surface40. Nanotags were mixed with NS1 in human serum, and the nitrocellulose strip was partially submerged in this solution. Upon contact with the nitrocellulose, the fluid migrated up the strip by capillary action to an attached wick. If a colored spot appeared at the test area, it indicated that NS1 could successfully bind to both the immobilized antibody at the test line and the antibody on the Nanotag. Thus, sandwich immunoassay formation was successful, accumulating Nanotags at the test line (Figure 3B). If a colored spot also appeared at the control area, it indicated that the anti-Fc antibodies could bind to the antibodies on the Nanotag, probing that fluid flow properly occurred.
Figure 3:

Sandwich immunoassay. a) Schematic of dipstick sandwich immunoassay. b) Sandwiches formed by each antibody pair, NS1 and GNS-Ab conjugate, for both ZIKV and DENV NS1, at the test line.
We investigated the ability of each antibody pair to detect each antigen individually by both colorimetric and SERS readouts. First, we tested the ability of the nanotags to detect ZIKV NS1 using anti-ZIKV NS1 antibodies immobilized on the test area (Figure 4A). Z-nanotags were mixed with ZIKV NS1 in human serum. A colored spot appeared both at the test and the control area, indicating sandwich immunoassay formation and proper fluid flow.
Figure 4:

Individvual immunoassay tests for detection of ZIKV and DENV-3. Zika (a) and dengue (b) test line normalized intensity when running ZIKV and DENV NS1, at decreasing concentration of NS1, from 500 to 0 ng/ml of the strips shown in the images. Control = 0 ng/ml NS1. c) Langmuir isotherm fitting for ZIKV and DENV individual tests (mean ± SD, n= 3) including a and b. All plots show the colorimetric analysis of the test line using ImageJ.
Controls of serum without NS1 did not exhibit a visible test line, indicating that the Z-nanotag did not non-specifically bind to immobilized anti-ZIKV NS1. Strips were run at varying ZIKV NS1 concentrations (0-500 ng/ml) and test line gray scale intensities were analyzed using ImageJ49.
Spot intensity increased with increasing ZIKV NS1 (Figure 4A, dark blue). Data was fitted using a modified Langmuir isotherm model50 (Eq. 2) (Figure 4C, blue)
| (2) |
which models the binding of a NP-Ab-Antigen complex (A) to a surface immobilized Ab (S), forming a surface bound species (A-S) characterized by a binding affinity of . The surface coverage is thus proportional to the test line intensity. Fitting the test line intensity using this model allowed determination of the LOD, which was calculated using standard literature approaches of the minimum concentration that yields an average test line intensity that exceeds 3X the standard deviation of the blank (Methods). LODs by visual readout were determined to be 10.92 ng/ml, which is in the range of a typical LFA. Specificity of the Zika antibody pair was probed by running the test with DENV NS1. Test line intensity was negligible at all concentrations, indicating that the Zika antibody pair did not cross react with dengue (Figure 4A, cyan). The calculated ZIKV binding affinity constant, , was 2.7 nM. It was observed that control lines were not uniform throughout different strips. This phenomenon, already reported in the literature40, can be partially attributed to depletion of the GNP-Ab conjugates at the first test line it encounters.
Then, we tested the ability of SERS to read out the assay. SERS measurements of the test line resulted in a spectrum characteristic of BPE, demonstrating that the Z-nanotag can act as a label in an immunoassay (Figure 5A). BPE SERS intensity decreased with decreasing ZIKV NS1, but spectral features did not completely disappear in the absence of ZIKV NS1. As SERS is highly sensitive, apparently even trace amounts of non-specific adsorption of the Z-nanotag on the test line are detectable. To obtain the SERS LOD, peak intensities at 1609 and 1584 cm−1 as a function of ZIKV NS1 concentration (Figure 5C, blue) were fit to a Langmuir fit of the titration curve, from which the LOD was determined to be 0.72 ng/ml, which is ~15 fold lower than the colorimetric readout for this particular pair. Reported viremia18 of infected patients with ZIKV and DENV and NS1 concentration in sera of DENV-infected patients17, suggests that ZIKV NS1 serum levels would probably be lower than that reported for DENV but higher than the LOD here measured. This shows that SERS can be used to detect ZIKV NS1 in an immunoassay with higher sensitivity than a colorimetric readout, and at concentrations of clinical relevance.
Figure 5:

LOD measurements for SERS. a) SERS spectra of Zika test line of individual Zika test with decreasing concentration of ZIKV NS1, from 500 to 10 ng/ml. b) SERS spectra of dengue test line of individual dengue test with decreasing concentration of DENV NS1, from 500 to 10 ng/ml. Control = 0 ng/ml NS1. Averaged spectra of 10 measurements for each concentration. c) LOD measurement for ZIKV and DENV NS1 by SERS, plotting 1609 cm−1 peak intensity (BPE) and 1584 cm−1 (MBA) for each NS1 concentration and fitting a Langmuir isotherm. Error bars represent mean ± SD, n= 10 measurements.
Similar investigation of the D-nanotag was performed. This time, anti-DENV NS1 was immobilized on the test line and the test was run with D-nanotag mixed with DENV NS1 in serum. A colored spot appeared at the test line, indicating the ability of the antibody pair to bind to DENV NS1 (Figure 4B), and titration curves determined an LOD of 55.3 ng/ml (Figure 4C). Assay specificity with respect to ZIKV NS1 was tested (Figure 4B, dark blue), confirming that test line intensity was negligible at all concentrations of ZIKV NS1. The calculated DENV binding affinity constant, , was 3.15 nM.
SERS measurements of the test line resulted in a spectrum characteristic of MBA, again demonstrating the ability of the nanotag to function in an immunoassay (Figure 5B). LOD from SERS using the 1584 cm−1 peak was 7.67 ng/ml for DENV NS1, ~7 fold lower than for colorimetric detection (Figure 5C). As Z-nanotags, MBA spectral features did not completely disappear when DENV NS1 was absent (Figure 5B). Both measured LODs (by eye and SERS) are well below those of patient levels, which can be up to 50 μg/ml17. These results show that SERS can be used for both ZIKV and DENV NS1 detection in immunoassays, with LODs lower than colorimetric readout. Error bars on the data are large and SERS signal variability can be attributed several factors, including variability of the SERS intensity across the test line area and the nanotag physical properties.
Multiplexed SERS-based immunoassay.
Having demonstrated individual detection of ZIKV and DENV NS1, we then tested a multiplexed dipstick immunoassay (Figure 6). First, anti-ZIKV and anti-DENV NS1 were immobilized at different locations on the nitrocellulose (Figure 6A,B). The dipstick was submerged in a mixture of the Z-nanotag and D-nanotag in serum. In the presence of ZIKV NS1, color appeared at the Zika test line but not the dengue test line, confirming correct sandwich formation. SERS spectra of the Zika test line (Figure 6A, blue) exhibited a BPE spectrum, demonstrating readout of the ZIKV NS1. SERS spectra of the dengue test line (Figure 6B, blue) exhibited a BPE spectrum, showing non-specific adsorption of the Z-nanotag. This could also be due to cross reactivity but results from the individual test strips (Figure 4) suggested that cross-reactivity is minimal.
Figure 6:

SERS Multiplexed assay. Multiplexed assay with Zika and dengue test line painted separately. SERS spectra of Zika (a) and dengue (b) test line. c) SERS spectra of multiplex assay with Zika and dengue in the same test line. Samples that are run are control (0 ng/ml NS1) (gray), ZIKV NS1 (blue), DENV NS1 (cyan) and a mixture of ZIKV and DENV NS1 (yellow). Averaged spectra of 10 measurements for each spot.
When DENV NS1 was present, color appeared at the dengue test line but not the Zika line. SERS measurements of the dengue test line (Figure 6B, cyan) showed an MBA spectrum, confirming presence of the D-nanotag and thus readout of DENV NS1. The Zika test line (Figure 6A, cyan) showed no noticeable signal, confirming no non-specific adsorption of the D-nanotag or cross reactivity.
When both ZIKV and DENV NS1 were present, the colorimetric readout showed colored spots at both the Zika and dengue test lines, as expected (Figure 6A,B). The SERS spectrum of the Zika test line showed characteristic BPE peaks (Figure 6A, yellow), indicating presence of the Z-nanotag, and the spectrum of the dengue test line showed a mixture of both BPE and MBA (Figure 6B, yellow). This confirmed presence of the D-nanotag but also some Z-nanotag as well, which could be attributed to some of the non-specific adsorption as determined with the dengue-only sample.
Control samples with no ZIKV or DENV NS1 showed no colored bands at the Zika or dengue test lines, as expected. SERS spectra of the Zika test line had low BPE signal (Figure 6A, gray) and the dengue test line showed some BPE signal due to non-specific adsorption (Figure 6B, gray). This shows that the sensitivity of SERS can pick up even trace amounts of the nanotags below what is detectable by eye.
Then, we tested an assay where Zika and dengue test lines were co-localized (Figure 6C). Anti-Zika and anti-dengue antibodies were mixed and then immobilized at the same location, and the strips were run with a mixture of Z-nanotags and D-nanotags. When ZIKV NS1, DENV NS1, or their mixture was present, color appeared at the test line. SERS spectra of the test line confirmed specific sandwich immunoassay formation. When ZIKV NS1 was present, only the two characteristic peaks of BPE, at 1609 and 1640 cm−1, were observed (Figure 6C, blue); for DENV NS1, only the MBA peak at 1584 cm−1 could be seen (Figure 6C, cyan). When the mixture of NS1 was run, three peaks due to both BPE and MBA reporters were observed (Figure 6C, yellow), demonstrating the feasibility of this SERS-based LFA test to detect both biomarkers in a multiplexed test. For the control when neither ZIKV or DENV NS1 was present, spectra of the reporters could also be seen. Furthermore, reporter signals could also be detected when analyzing other areas of the strip where no antibody was immobilized (Figure S2), indicating that there was non-specific interaction between the nanotags and the nitrocellulose. To avoid these interactions, the use of blocking agents for either the strip or in the eluting buffer are required. In order to probe crossover reactivity between antibodies, other controls have been run in individual Zika tests, dengue tests and multiplexed test with physically separated test areas for each virus (Figure S3).
Quantitative spectral analysis.
BPE and MBA were chosen as reporters because their Raman spectra have minimal spectral overlap and can be easily distinguished. However, there can be situations where it is difficult to distinguish between the signals of the two reporter molecules due to proximity of their peaks in the Raman spectrum, or when reporter signal is so low that it is difficult to distinguish from noise, which can affect the LOD. For this reason, a classical Least Squares algorithm was used to analyze the Raman spectra51. To test algorithm accuracy, two different multiplexed experiments were performed. First, the relative nanotag concentrations were varied from 0:1 to 1:0 Z-nanotag:D-nanotag, with ZIKV and DENV NS1 concentrations fixed. MBA and BPE contributions to the Raman spectra were calculated using the least squares analysis from 425 cm−1 to 1800 cm-1. The prediction performance of the algorithm was evaluated by plotting the predicted Z-Nanotag:D-nanotag ratio against the true Z-Nanotag:D-Nanotag ratio (Figure 7A), showing that the algorithm performed a good prediction of the real BPE:MBA ratio. Prediction was better at lower BPE:MBA ratios, i.e., lower BPE and higher MBA concentrations, due to the fact that MBA Raman signal per se is half of the intensity of BPE spectrum at the same concentration.
Figure 7:

Quantitative spectral analysis. Ratio of BPE:MBA from multiplexed SERS spectra at the test line, at varying Z-Nanotag:D-Nanotag (a) and varying ZIKV NS1:DENV NS1 (b). Large spheres: the mean (n=10), small spheres: individual measurements. Dashed line: theoretical 100% prediction of the algorithm.
Then, the ZIKV and DENV NS1 concentrations were varied for fixed Z-nanotag and D-nanotag concentrations. The predicted ZIKV NS1:DENV NS1 ratio was plotted against the true ZIKV NS1:DENV NS1 ratio to evaluate prediction performance (Figure 7B). In this case, least squares performance was not as good as in the previous experiment, as in this situation it is the antigen concentration that varies. Thus, the affinity between antigen and the nanostars conjugate has a higher influence. These results indicate that the quantitative contributions of the nanotags to the SERS spectra agree with specific recognition of each biomarker. This quantification method would enable distinguishing among other reporters in mixtures with a larger number of reporters to detect among a larger number of closely-related viruses in future work. The assays are functional in full human serum, which is the same sample matrix used in fieldable assays, but actual patient samples often present unforeseen challenges.
CONCLUSIONS
The outbreaks of Zika in 2015 in Brazil or Ebola in 2014 in West Africa have underscored the need for multiplexed POC devices that can provide differential diagnosis for closely related diseases that co-circulate. The main drawback of LFA has traditionally been their low sensitivity, making it challenging to detect low concentrations of biomarkers. In this work, we demonstrate a novel SERS-based LFA platform that can distinguish between Zika and dengue, with lower LOD than those achieved by colorimetric readout. SERS has been promising for enhancing the sensitivity of analyte detection and we show here that the use of multiple nanotags can enable discrimination between Zika and Dengue NS1. A multiplexed assay is particularly valuable in the case of zika and dengue viruses. As they share the same transmission vector, they can co-localize geographically, meaning that in an endemic area an infected patient can either have zika, dengue, or a co-infection of both. In addition, both diseases exhibit similar non-specific symptoms, but the disease outcomes are dramatically different, impacting patient treatment. Enhancement by the GNS, ~105 for both reporter molecules, allowed detection and distinction of Zika and dengue, even when the test line was not visible on the strip. This combined SERS-LFA platform resulted in a decrease in the LOD of 15 fold for Zika, and 7 fold for dengue, allowing the detection of down to 0.72 ng/ml of ZIKV NS1 and 7.67 ng/ml of DENV NS1. Because the LOD is dependent on the GNS-Ab conjugate properties, the amount of reporter on the GNS, and the GNS size, future work will include optimization of the nanotag properties for improved sensitivity. In addition, advancements with SERS instrumentation have resulted in the availability of many portable handheld Raman readers, which opens up the possibility of in-the-field measurements of biomarkers at levels too low to be read by eye in a conventional LFA strip. This portable system can be connected wirelessly to a PC or the cloud, where data would be analyzed and report new disease cases in real-time during an outbreak, allowing a better management of the epidemic, outbreak mapping and proper patient treatment.
METHODS
Reagents.
Gold chloride trihydrate (CAS: 16961– 25–4), N-(2-Hydroxyethyl)piperazine-N′-(2-ethanesulfonic acid) (HEPES) (CAS:7365-45-9), 1,2-bis(4-pyridyl)ethylene (BPE) (CAS:3362-78-2) , 4-mercaptobenzoic acid (MBA) (CAS:1074-36-8), Sucrose (CAS:57-50-1) and Tween-20 (CAS:9005-64-5) were purchased from Sigma-Aldrich. 5kD thiolated mPEG was from nanocs. The hydrazide dithiolalkanearomatic linker (PEG6-NHNH2) was from Sensopath Technologies. Goat anti-mouse IgG, Fc, was purchased from Millipore (AQ127). ZIKV and DENV-3 NS1 native protein was from Native Antigen. Phosphate buffer saline (1x PBS, pH 7.4) was from Gibco (CAT: 10010– 049). Filtered human serum was obtained by filtering 1 mL of human serum from Sigma-Aldrich (H4522) through a 0.2 μm cellulose acetate syringe filter (Pall, Acrodisc 25 mm Syringe Filter, with 0.2 μm HT Tuffryn Membrane).
Antibodies.
Hybridoma cells producing antibodies against ZIKV NS1 were obtained by injection of mice with recombinant native NS1 protein of ZIKV and DENV-3 (purchased from Native Antigen). After hybridomas were screened using ELISA and FACS analysis of ZIKV and DENV infected cells, selected cell cultures were harvested and concentrated using Millipore centrifugal units (30 kDa MW). Protein L columns were used to purify the kappa light chain mouse antibodies that were specific to ZIKV and DENV NS1. After purification, the antibodies were buffer-exchanged into PBS, concentrated, and stored at 4 °C. A NanoDrop 2000 UV–vis spectrophotometer at 280 nm was used to calculate the concentration of the purified antibody, and a TapeStation with a P200 ScreenTape from Agilent Technologies was used to confirm the purity of the monoclonal antibodies.
Synthesis and conjugation of nanostars.
To synthesize gold nanostars (GNS), 1800 μL of 140 mM HEPES (pH 7.4) were mixed with 200 μL of 18 MΩ deionized (Milli-Q) water, followed by the addition of 32 μL of 10 mg/ml HAuCl4· 3H2O and further vortexing. The solution sat undisturbed for 1 h for the nanostar formation. Afterwards, GNS were separated from excess reagents by centrifugation at 4000 rcf for 20 min. Supernatant was then removed, and the nanostar pellet resuspended in 2 ml Milli-Q water. Then, the solution was divided into two equal parts of 1 ml, one for each Raman reporter. The Raman reporter molecule of interest was added and vortexed, ~6 μL of BPE and ~8 μL of MBA (depending on GNS concentration) in order to have a reporter monolayer on the nanostars’ surface, assuming a maximal footprint of 70.18 and 49.89 Å for each reporter, respectively, calculated with MarvinSketch. The solution was left undisturbed for 30 min, and was further centrifuged for 20 min at 4000 rcf. Supernatant was removed and the pellet resuspended in 100 μL of 40 mM HEPES and 300 μL Milli-Q water. For covalent, directional conjugation, the OH groups of the antibody’s Fc region were first oxidized to aldehydes by mixing 200 μL of a 1 mg/mL solution of antibody in 40 mM HEPES (pH 7.4) and 20 μL of 100 mM sodium periodate (NaIO4, Sigma) and allowed to react while shaking (in Clay Adams Nutator from Marshall Scientific) for 45 min at room temperature protected from light. Then, 1 mL of PBS and an excess of linker (2 μL of 33.3 mg/mL in ethanol) were added to the oxidized antibodies and agitated for 30 min, during which time the aldehyde group of the antibodies bound to the hydrazide on the linker. To remove unreacted linker, antibodies were buffer-exchanged into PBS using a 10 kDa centrifugal filter column (Amicon) and resuspended to a 1 mg/mL solution in PBS. To conjugate the linker-Ab to nanostars, 10 μL of 1 mg/ml linker-Ab were added to the nanostars’ solution previously prepared, vortexed and further shaken overnight at room temperature. Afterwards, 10 μL of 0.01 mM mPEG 5 kDa were added, vortexed and further shaken for 30 min. Lastly, the solution was centrifuged at 4000 rcf for 20 min to remove excess reagents and was ready to use.
GNS Characterization.
Optical absorption spectra of the GNS were obtained on a Cary 100 UV–vis Dual-Beam Spectrophotometer (Varian, Inc.). GNS morphology was characterized with a FEI Tecnai G2 TEM at 120 kV. ImageJ was used to measure the dimensions of the GNS in TEM images. A Zetasizer Nano ZS from Malvern Instruments was used to measure the hydrodynamic diameter (DH) and the ζ of plain GNS and their Ab-conjugates. Zeta-potential values are dependent on pH. ELISA quantified the antibody attached per GNS. Briefly, ELISA was performed by incubating 96-well plates with ZIKV and DENV NS1 (at 1 μg/ml and 100 μL/well) separately overnight at room temperature. After washing free NS1, wells were blocked with 300 μL/well of Blotto 5% (2 g non-fat milk, 2 ml washing solution 20X and 38 ml H2O) for 1 hr at room temperature. Then, solution was discarded and wells were incubated for 2 hr with conjugated GNSs samples at 20% (v/v) in blotto 5%. Standard curves were performed with initial concentrations of 2000 ng/ml of viral NS1 with subsequent 2-fold dilutions to obtain 10 points. Samples were discarded and washed 3 times with washing buffer (for 20 ml of buffer mix 1 ml of washing solution 20X and 19 ml H2O). Then 100 μL/well of HRP- anti-Fc was added and incubated for 1h. After washing 3 times, 100 μL/well of TMS was added and let react till blue color appeared. Then, 50 μL/well 0.1 M H2SO4 were added to quench the reaction and absorbance was measured at 450 nm with a TriStar Berthold Technologies plate reader.
Dipstick LFA.
Antibodies were immobilized on the nitrocellulose strip by manually pipetting 0.3 μL of a 2 mg/mL antibody solution onto the nitrocellulose paper and further allowed to dry for at least 30 min. In the test line, monoclonal antibodies against ZIKV or DENV NS1 protein were immobilized. The control line was spotted with goat antibody that could bind to the Fc fragment of the mouse IgG antibodies on the GNS. To run the test, the strip was submerged at its lower end in the test solution containing 4 μL of 50% w/v sucrose in water, 8 μL of 1% v/v Tween 80 in PBS, 1 μL of the GNS-Ab conjugates, 30 μL of human serum and the analyte (NS1), rendering a total of 45 μL. Then, the solution migrated through the strip upwards via capillary action to the absorbent pad attached to the upper end of the strip. When all the solution had been absorbed, the strip was washed with 80 μL of 0.1% v/v Tween 80 in PBS through the same procedure to eliminate unbound conjugates, and allowed to dry.
ImageJ analysis.
Once the tests had dried, images of the tests were obtained by scanning the strips and quantified with ImageJ49 in 8-bit grayscale. Gray values of the test area were normalized by subtracting the grayscale values of the background as follows: , where is the measured gray value of the blank, is the gray value of the highest concentration point and gray is the gray value at each concentration.
SERS measurements.
Raman and SERS spectra were acquired using a Raman Senterra II microscope (Bruker Optiks GmbH, Germany). A Ne laser with a power of 10 mW operating at λ = 785 nm was utilized as the excitation source. A thermoelectrically cooled CCD detector was coupled to a spectrograph. Raman spectra were obtained using a Raman point method with a 10x objective lens, with a total of 10 points per sample measured. The data integration time at each point was 5 s with 5 co-additions. The numerical aperture of the objective lens used in this work is 50 x1000 μm. The spectra acquired for each spot were decoded using OPUS software v 7.0 (Bruker Optiks GmbH, Germany). Baseline correction was performed by concave Rubberband correction method using 15 iterations and 64 baseline points. Mathematical calculations on the spectra such as spectral averaging, intensity, area, or peak shift measurements were performed in Matlab.
LOD and calculations.
In the case of optically analyzed strips (ImageJ), normalized gray values were plotted and fitted in a Langmuir equation of the form: , where is the concentration of antigen present in the 45 μL of sample in the solution, is the effective binding constant in a Langmuir-like system and is a normalization constant to scale the curve between 0 and 1. For SERS-based LFA, intensity values of peaks at 1609 cm−1 (BPE) and 1584 cm−1 (MBA) were also plotted and fitted in a Langmuir isotherm model, without normalization. The limit of detection (LOD) was defined as the minimum concentration that yielded an average test area intensity that exceeded by 3 times the standard deviation of a blank (test area intensity running sample without antigen) over the average intensity of the blank38,52. To obtain, values, test line intensities vs NS1 concentration (colorimetric LFA) were fitted to the aforementioned equation using matlab’s curve fitting toolbox.
Quantitative spectral analysis.
A Least Squares (LS) method was used in this work to perform a quantitative analysis of Raman spectroscopy53. LS finds the weights of the linear combination of spectra from the pure components contained in the sample that minimizes the squared difference with the Raman spectrum of the sample. Pure component spectra of Z-nanotag and D-nanotag were acquired from 0.3 μL of nanostars solution in water at the same concentration deposited on a nitrocellulose strip.
Supplementary Material
ACKNOWLEDGMENTS
This work was supported by the NIH NIAID (AI100190). We thank CMSE at MIT for TEM facilities and the Department of Chemistry at UMB for SERS instrumentation. We thank Dr. Justina Tam, Dr. Vladimir Liberman, and Diego Lopez for experimental assistance. Daniela M. Graf-Stillfried Barreto for help with Senterra II, Biel Roig-Solvas for help with signal processing. HdP was supported by the MIT/SUTD International Design Centre, a Rafael del Pino Fellowship, a Broshy Fellowship, and a MIT Tata Center for Technology and Design Fellowship.
Part of the graphical abstract’s graphics were performed with the UCSF Chimera package. Chimera is developed by the Resource for Biocomputing, Visualization, and Informatics at the University of California, San Francisco (supported by NIGMS P41-GM103311).
ABBREVIATIONS
- Ab
antibody
- DENV
dengue virus
- DLS
dynamic light scattering
- GNS-MBA-antiDENV
D-nanotag
- EF
Enhancement Factor
- LFA
Lateral Flow Test
- LOD
limit of detection
- GNS
Gold nanostar
- NS1
non-structural protein 1
- PEG
polyethylene glycol
- POC
Point-of-care
- SERS
Surface-Enhanced Raman Spectroscopy
- TEM
transmission electron microscopy
- ZIKV
Zika virus
- GNS-BPE-antiZIKV
Z-nanotag
Footnotes
Supporting information
Additional information on antibody coverage, SERS background signal and SERS individual controls (PDF).
The authors declare no competing financial interest.
REFERENCES
- (1).Guzman MG; Halstead SB; Artsob H; Buchy P; Farrar J; Gubler DJ; Hunsperger E; Kroeger A; Margolis HS; Martínez E; et al. Dengue: a continuing global threat. Nat. Rev. Microbiol 2010, 8 (12), S7–S16 DOI: 10.1038/nrmicro2460. [DOI] [PMC free article] [PubMed] [Google Scholar]
- (2).Lessler J; Chaisson LH; Kucirka LM; Bi Q; Grantz K; Salje H; Carcelen AC; Ott CT; Sheffield JS; Ferguson NM; et al. Assessing the global threat from Zika virus. Science (80-. ). 2016, 46 (24), 601–604 DOI: 10.1126/science.aaf8160. [DOI] [PMC free article] [PubMed] [Google Scholar]
- (3).Naish S; Dale P; Mackenzie JS; McBride J; Mengersen K; Tong S Climate change and dengue: a critical and systematic review of quantitative modelling approaches. BMC Infect. Dis 2014, 14 (1), 167 DOI: 10.1186/1471-2334-14-167. [DOI] [PMC free article] [PubMed] [Google Scholar]
- (4).Wen TH; Tsai CT; Chin WCB Evaluating the role of disease importation in the spatiotemporal transmission of indigenous dengue outbreak. Appl. Geogr 2016, 76, 137–146 DOI: 10.1016/j.apgeog.2016.09.020. [DOI] [Google Scholar]
- (5).Tatem AJ Mapping population and pathogen movements. Int. Health 2014, 6 (1), 5–11 DOI: 10.1093/inthealth/ihu006. [DOI] [PMC free article] [PubMed] [Google Scholar]
- (6).Knowlton K; Solomon G; Rotkin-Ellman M; Council NRD Fever pitch: mosquito-borne dengue fever threat spreading in the Americas. NRDC Issue Pap. 2009, July (July), 1–16. [Google Scholar]
- (7).Rasmussen SA; Jamieson DJ; Honein MA; Petersen LR Zika Virus and Birth Defects — Reviewing the Evidence for Causality. Appl. Geogr 2016, 54 (1), 137–146 DOI: 10.1016/j.apgeog.2016.09.020. [DOI] [PubMed] [Google Scholar]
- (8).Brasil P; Pereira JP Jr.; Raja Gabaglia C; Damasceno L; Wakimoto M; Ribeiro Nogueira RM; Carvalho de Sequeira P; Machado Siqueira A; Abreu de Carvalho LM; Cotrim da Cunha D; et al. Zika Virus Infection in Pregnant Women in Rio de Janeiro — Preliminary Report. N. Engl. J. Med 2016, 6736 (16), 2016 DOI: 10.1017/CBO9781107415324.004. [DOI] [PMC free article] [PubMed] [Google Scholar]
- (9).Smith DW; Mackenzie J Zika virus and Guillain-Barré syndrome: another viral cause to add to the list. Lancet 2016, 387, 1486–1488 DOI: 10.1016/S0140-6736(16)00564-X. [DOI] [PubMed] [Google Scholar]
- (10).Waggoner JJ; Pinsky A Zika Virus : Diagnostics for an Emerging Pandemic Threat VIRUS. 2016, 54 (4), 860–867 DOI: 10.1128/JCM.00279-16.Editor. [DOI] [PMC free article] [PubMed] [Google Scholar]
- (11).Moulin E; Selby K; Cherpillod P; Kaiser L; Boillat-Blanco N Simultaneous outbreaks of dengue, chikungunya and Zika virus infections: diagnosis challenge in the returning traveler with non-specific febrile illness. New Microbes New Infect. 2016, 11, 6–7 DOI: 10.1016/j.nmni.2016.02.003. [DOI] [PMC free article] [PubMed] [Google Scholar]
- (12).Caliendo AM; Gilbert DN; Ginocchio CC; Hanson KE; May L; Quinn TC; Tenover FC; Alland D; Blaschke AJ; Bonomo RA; et al. Better Tests, Better Care: Improved Diagnostics for Infectious Diseases. Clin. Infect. Dis 2013, 57 (suppl 3), S139–S170 DOI: 10.1093/cid/cit578. [DOI] [PMC free article] [PubMed] [Google Scholar]
- (13).Waggoner JJ; Gresh L; Mohamed-Hadley A; Ballesteros G; Vargas Davila MJ; Tellez Y; Sahoo MK; Balmaseda A; Harris E; Pinsky BA Single-reaction multiplex reverse transcription PCR for detection of zika, Chikungunya, and dengue viruses. Emerg. Infect. Dis 2016, 22 (7), 1295–1297 DOI: 10.3201/eid2207.160326. [DOI] [PMC free article] [PubMed] [Google Scholar]
- (14).Yetisen AK; Akram MS; Lowe CR Paper-based microfluidic point-of-care diagnostic devices. Lab Chip 2013, 13 (12), 2210. [DOI] [PubMed] [Google Scholar]
- (15).Parolo C; Merkoci A Paper-based nanobiosensors for diagnostics. Chem. Soc. Rev 2013, 42 (2), 450–457 DOI: Doi 10.1039/C2cs35255a. [DOI] [PubMed] [Google Scholar]
- (16).Posthuma-Trumpie GA; Korf J; Van Amerongen A Lateral flow (immuno)assay: Its strengths, weaknesses, opportunities and threats. A literature survey. Anal. Bioanal. Chem 2009, 393 (2), 569–582 DOI: 10.1007/s00216-008-2287-2. [DOI] [PubMed] [Google Scholar]
- (17).Watanabe S; Tan KH; Rathore a. P. S.; Rozen-Gagnon K; Shuai W; Ruedl C; Vasudevan SG The Magnitude of Dengue Virus NS1 Protein Secretion Is Strain Dependent and Does Not Correlate with Severe Pathologies in the Mouse Infection Model. J. Virol 2012, 86 (10), 5508–5514 DOI: 10.1128/JVI.07081-11. [DOI] [PMC free article] [PubMed] [Google Scholar]
- (18).Waggoner JJ; Gresh L; Vargas MJ; Ballesteros G; Tellez Y; Soda KJ; Sahoo MK; Nuñez A; Balmaseda A; Harris E; et al. Viremia and Clinical Presentation in Nicaraguan Patients Infected with Zika Virus, Chikungunya Virus, and Dengue Virus. Clin. Infect. Dis 2016, 63, 1–7 DOI: 10.1093/cid/ciw589. [DOI] [PMC free article] [PubMed] [Google Scholar]
- (19).Taranova NA; Berlina AN; Zherdev AV; Dzantiev BB “Traffic light” immunochromatographic test based on multicolor quantum dots for the simultaneous detection of several antibiotics in milk. Biosens. Bioelectron 2015, 63, 255–261 DOI: 10.1016/j.bios.2014.07.049. [DOI] [PubMed] [Google Scholar]
- (20).Xie QY; Wu YH; Xiong QR; Xu HY; Xiong YH; Liu K; Jin Y; Lai WH Advantages of fluorescent microspheres compared with colloidal gold as a label in immunochromatographic lateral flow assays. Biosens. Bioelectron 2014, 54, 262–265 DOI: 10.1016/j.bios.2013.11.002. [DOI] [PubMed] [Google Scholar]
- (21).Qin Z; Wang Y; Randrianalisoa J; Raeesi V; Chan WCW; Lipiński W; Bischof JC Quantitative Comparison of Photothermal Heat Generation between Gold Nanospheres and Nanorods. 2013, 51 (18), 4358–4361 DOI: 10.1002/anie.201200997.Significantly. [DOI] [PMC free article] [PubMed] [Google Scholar]
- (22).Moghadam BY; Connelly KT; Posner JD Two orders of magnitude improvement in detection limit of lateral flow assays using isotachophoresis. Anal. Chem 2015, 87 (2), 1009–1017 DOI: 10.1021/ac504552r. [DOI] [PubMed] [Google Scholar]
- (23).Cho IH; Seo SM; Paek EH; Paek SH Immunogold-silver staining-on-a-chip biosensor based on cross-flow chromatography. J. Chromatogr. B Anal. Technol. Biomed. Life Sci 2010, 878 (2), 271–277 DOI: 10.1016/j.jchromb.2009.07.016. [DOI] [PubMed] [Google Scholar]
- (24).Lu X; Rycenga M; Skrabalak SE; Wiley B; Xia Y Chemical Synthesis of Novel Plasmonic Nanoparticles. Annu. Rev. Phys. Chem 2009, 60 (1), 167–192 DOI: 10.1146/annurev.physchem.040808.090434. [DOI] [PubMed] [Google Scholar]
- (25).Zeman EJ; Schatz GC An accurate electromagnetic theory study of surface enhancement factors for silver, gold, copper, lithium, sodium, aluminum, gallium, indium, zinc, and cadmium. J. Phys. Chem 1987, 91 (3), 634–643 DOI: 10.1021/j100287a028. [DOI] [Google Scholar]
- (26).Guerrero-Martínez A; Barbosa S; Pastoriza-Santos I; Liz-Marzán LM Nanostars shine bright for you. Colloidal synthesis, properties and applications of branched metallic nanoparticles. Curr. Opin. Colloid Interface Sci 2011, 16 (2), 118–127 DOI: 10.1016/j.cocis.2010.12.007. [DOI] [Google Scholar]
- (27).Porter MD; Lipert RJ; Siperko LM; Wang G; Narayanan R SERS as a bioassay platform: fundamentals, design, and applications. Chem. Soc. Rev 2008, 37 (5), 1001–1011 DOI: 10.1039/b708461g. [DOI] [PubMed] [Google Scholar]
- (28).Dinish US; Balasundaram G; Chang Y-T; Olivo M Actively targeted in vivo multiplex detection of intrinsic cancer biomarkers using biocompatible SERS nanotags. Sci. Rep 2014, 4, 4075 DOI: 10.1038/srep04075. [DOI] [PMC free article] [PubMed] [Google Scholar]
- (29).Qian X; Peng X-H; Ansari DO; Yin-Goen Q; Chen GZ; Shin DM; Yang L; Young AN; Wang MD; Nie S In vivo tumor targeting and spectroscopic detection with surface-enhanced Raman nanoparticle tags. Nat. Biotechnol 2008, 26 (1), 83–90 DOI: 10.1038/nbt1377. [DOI] [PubMed] [Google Scholar]
- (30).Xia X; Li W; Zhang Y; Xia Y Silica-coated dimers of silver nanospheres as surface-enhanced Raman scattering tags for imaging cancer cells. Interface Focus 2013, 3 (3), 20120092 DOI: 10.1098/rsfs.2012.0092. [DOI] [PMC free article] [PubMed] [Google Scholar]
- (31).Park H; Lee S; Chen L; Lee E; Shin SY; Lee YH; Son SW; Oh CH; Song JM; Kang SH; et al. SERS imaging of HER2-overexpressed MCF7 cells using antibody-conjugated gold nanorods. Phys. Chem. Chem. Phys 2009, 11 (34), 7348 DOI: 10.1039/b913171j. [DOI] [PubMed] [Google Scholar]
- (32).Paul AM; Fan Z; Sinha SS; Shi Y; Le L; Bai F; Ray PC Bioconjugated Gold Nanoparticle Based SERS Probe for Ultrasensitive Identification of Mosquito-Borne Viruses Using Raman Fingerprinting. J. Phys. Chem. C 2015, 119 (41), 23669–23675 DOI: 10.1021/acs.jpcc.5b07387. [DOI] [PMC free article] [PubMed] [Google Scholar]
- (33).Bodelón G; Montes-García V; Fernández-López C; Pastoriza-Santos I; Pérez-Juste J; Liz-Marzán LM Au@pNIPAM SERRS Tags for Multiplex Immunophenotyping Cellular Receptors and Imaging Tumor Cells. Small 2015, 11 (33), 4149–4157 DOI: 10.1002/smll.201500269. [DOI] [PubMed] [Google Scholar]
- (34).Hwang J; Lee S; Choo J Application of a SERS-based lateral flow immunoassay strip for the rapid and sensitive detection of staphylococcal enterotoxin B. Nanoscale 2016, 8 (22), 11418–11425 DOI: 10.1039/C5NR07243C. [DOI] [PubMed] [Google Scholar]
- (35).de Puig H; Tam JO; Yen C-W; Gehrke L; Hamad-Schifferli K Extinction Coefficient of Gold Nanostars. J. Phys. Chem. C 2015, 119 (30), 17408–17415 DOI: 10.1021/acs.jpcc.5b03624. [DOI] [PMC free article] [PubMed] [Google Scholar]
- (36).Xie J; Lee JY; Wang DIC Article Seedless , Surfactantless , High-Yield Synthesis of Branched Gold Nanocrystals in HEPES Buffer Solution Seedless , Surfactantless , High-Yield Synthesis of Branched Gold Nanocrystals in HEPES Buffer Solution. Society 2007, No. 6, 2823–2830 DOI: 10.1021/cm0700100. [DOI] [Google Scholar]
- (37).Dam DHM; Lee JH; Sisco PN; Co DT; Zhang M; Wasielewski MR; Odom TW Direct Observation of Nanoparticle À Cancer Cell Nucleus Interactions. 2012, No. 4, 3318–3326. [DOI] [PMC free article] [PubMed] [Google Scholar]
- (38).Tam JO; de Puig H; Yen C; Bosch I; Gómez-Márquez J; Clavet C; Hamad-Schifferli K; Gehrke L A Comparison of Nanoparticle-Antibody Conjugation Strategies in Sandwich Immunoassays. J. Immunoass. Immunochem 2016. DOI: 10.1080/15321819.2016.1269338. [DOI] [PMC free article] [PubMed] [Google Scholar]
- (39).Kumar S; Aaron J; Sokolov K Directional conjugation of antibodies to nanoparticles for synthesis of multiplexed optical contrast agents with both delivery and targeting moieties. Nat. Protoc 2008, 3 (2), 314–320 DOI: 10.1038/nprot.2008.1. [DOI] [PubMed] [Google Scholar]
- (40).de Puig H; Bosch I; Carré-Camps M; Hamad-Schifferli K Effect of the Protein Corona on Antibody–Antigen Binding in Nanoparticle Sandwich Immunoassays. Bioconjug. Chem 2016, acs.bioconjchem.6b00523 DOI: 10.1021/acs.bioconjchem.6b00523. [DOI] [PMC free article] [PubMed] [Google Scholar]
- (41).Tan YH; Liu M; Nolting B; Go JG; Gervay-Hague J; Liu GY A nanoengineering approach for investigation and regulation of protein immobilization. ACS Nano 2008, 2 (11), 2374–2384 DOI: 10.1021/nn800508f. [DOI] [PMC free article] [PubMed] [Google Scholar]
- (42).Kearns H; Shand NC; Smith WE; Faulds K; Graham D 1064 nm SERS of NIR active hollow gold nanotags. Phys. Chem. Chem. Phys 2015, 17 (3), 1980–1986 DOI: 10.1039/c4cp04281f. [DOI] [PubMed] [Google Scholar]
- (43).Mulvaney SP; Musick MD; Keating CD; Natan MJ Glass-coated, analyte-tagged nanoparticles: A new tagging system based on detection with surface-enhanced Raman scattering. Langmuir 2003, 19 (11), 4784–4790 DOI: 10.1021/la026706j. [DOI] [Google Scholar]
- (44).Michota A; Bukowska J Surface-enhanced Raman scattering (SERS) of 4-mercaptobenzoic acid on silver and gold substrates. J. Raman Spectrosc 2003, 34 (1), 21–25 DOI: 10.1002/jrs.928. [DOI] [Google Scholar]
- (45).Chirumamilla M; Das G; Toma A; Gopalakrishnan A; Zaccaria RP; Liberale C; De Angelis F; Di Fabrizio E Optimization and characterization of Au cuboid nanostructures as a SERS device for sensing applications. Microelectron. Eng 2012, 97, 189–192 DOI: 10.1016/j.mee.2012.05.004. [DOI] [Google Scholar]
- (46).Khoury CG; Vo-Dinh T Gold Nanostars For Surface-Enhanced Raman Scattering: Synthesis, Characterization and Optimization. J. Phys. Chem. C 2008, 112 (48), 18849–18859 DOI: 10.1021/jp8054747. [DOI] [PMC free article] [PubMed] [Google Scholar]
- (47).Chirumamilla M; Gopalakrishnan A; Toma A; Zaccaria RP; Krahne R Plasmon resonance tuning in metal nanostars for surface enhanced Raman scattering. Nanotechnology 2014, 25 (23), 7 DOI: 10.1088/0957-4484/25/23/235303. [DOI] [PubMed] [Google Scholar]
- (48).Nalbant Esenturk E; Hight Walker AR Surface-enhanced Raman scattering spectroscopy via gold nanostars. J. Raman Spectrosc 2009, 40 (1), 86–91 DOI: 10.1002/jrs.2084. [DOI] [Google Scholar]
- (49).Abràmofff MD; Magalhães PJ; Ram SJ Image processing with ImageJ Part II. Biophotonics Int. 2005, 11 (7), 36–43 DOI: 10.1117/1.3589100. [DOI] [Google Scholar]
- (50).De Puig H; Federici S; Baxamusa SH; Bergese P; Hamad-Schifferli K Quantifying the nanomachinery of the nanoparticle-biomolecule interface. Small 2011, 7 (17), 2477–2484 DOI: 10.1002/smll.201100530. [DOI] [PubMed] [Google Scholar]
- (51).Zavaleta CL; Smith BR; Walton I; Doering W; Davis G; Shojaei B; Natan MJ; Gambhir SS Multiplexed imaging of surface enhanced Raman scattering nanotags in living mice using noninvasive Raman spectroscopy. Proc. Natl. Acad. Sci. U. S. A 2009, 106 (32), 13511–13516 DOI: 10.1073/pnas.0813327106. [DOI] [PMC free article] [PubMed] [Google Scholar]
- (52).Grimes JM Enhancement of Lateral Flow Assay for the Detection of Whole Viral Particle and Chlamydial Elementary Bodies. 2014, No. February, 1–57. [Google Scholar]
- (53).Haaland DM; Easterling RG Improved Sensitivity of Infrared Spectroscopy By the Application of Least Squares Methods. Appl. Spectrosc 1980, 34 (5), 539–548 DOI: 10.1366/0003702804731258. [DOI] [Google Scholar]
Associated Data
This section collects any data citations, data availability statements, or supplementary materials included in this article.