

Abstract
Background:
The use of potentially inappropriate medications (PIMs) is associated with increased risk of hospitalizations and emergency room visits and varies by racial and ethnic subgroup. Medicare’s nationwide medication therapy management (MTM) program requires that Part D plans offer an annual comprehensive medication review (CMR) to all beneficiaries who qualify, and provides a platform to reduce PIM use. The objective of this study was to assess the impact of CMR on PIM discontinuation in Medicare beneficiaries and whether this differed by race or ethnicity.
Methods:
Retrospective cohort study of community-dwelling Medicare Part D beneficiaries ≥66 years of age who were eligible for MTM from 2013 to 2019 based on 5% Medicare fee-for-service claims data linked to the 100% MTM data file. Among those using a PIM, MTM-eligible CMR recipients were matched to non-recipients via sequential stratification. The probability of PIM discontinuation was estimated using regression models that pooled yearly subcohorts accounting for within-beneficiary correlations. To identify PIM targets for future intervention, the most common PIMs that remained in use after CMR were reported.
Results:
We matched 24,368 CMR recipients to 24,368 CMR non-recipients during the observation period. Median age was 74–75, 35% were males, most were White beneficiaries (86–87%), and the median number of PIMs was 1. In adjusted analyses, CMR receipt was positively associated with PIM discontinuation (adjusted relative risk [aRR]: 1.26, 95% CI: 1.20–1.32). There was no evidence of differential impact of CMR by race or ethnicity. The PIMs most commonly discontinued after CMR were glimepiride, zolpidem, digoxin, amitriptyline, and nitrofurantoin.
Conclusions:
Among Medicare beneficiaries who are using a PIM, CMR receipt was associated with PIM discontinuation, suggesting that greater CMR use could facilitate PIM reduction for all racial and ethnic groups.
Keywords: Medicare, medication therapy management, comprehensive medication review, potentially inappropriate medications
INTRODUCTION
Over 40% of older adults in the US use at least five or more medications (i.e., polypharmacy).1 Patients with polypharmacy are at increased risk of using potentially inappropriate medications (PIMs), which are generally medications for which the harms outweigh the benefits.2 The use of PIMs has been associated with an increased risk of persistent physical disability, hospitalizations and visits to the emergency room, and higher healthcare costs.3,4
To facilitate the optimization of medication management among older adults, Medicare requires that prescription drug plans (Part D plans) offer medication therapy management (MTM) services to older adults with polypharmacy, multiple chronic conditions, and high drug spending. A cornerstone to these MTM services is the comprehensive medication review (CMR), which involves an interactive, real-time consultation between the healthcare professional (usually a pharmacist) and the patient. After a CMR, the pharmacist may recommend that the patient’s provider make changes to the medication regimen, such as PIM discontinuation. CMRs must be offered annually to eligible Medicare beneficiaries, and Medicare’s Star Rating program further incentivizes Part D plans to reduce PIM use via quality measures such as the ‘Use of High-Risk Medications in the Elderly’ (HRM) quality measure.5
Prior studies have found that Black and Hispanic beneficiaries are less likely to meet Medicare’s minimum thresholds for MTM eligibility criteria6–8 and low-income beneficiaries are less likely to be offered a CMR or to complete a CMR if offered.9,10 Further, there are racial and ethnic differences in the prescribing rates of PIMs. Black females are more likely to be prescribed a medication that increases falls risk compared to White females.11 Hispanic individuals are also more likely to receive PIMs than White individuals.12,13 However, White individuals are more likely to have a higher cumulative anticholinergic and sedative drug load than Black and Hispanic individuals.14 It is unknown whether PIM discontinuation rates differ by race or ethnicity. CMRs may be particularly impactful for underrepresented races and ethnicities, yet whether there are differences in the impact of CMRs on the discontinuation of PIMs among racial and ethnic subgroups is unknown.
A single-site study examining 2015 data found that Medicare CMR recipients were less likely to refill a PIM,15 but the nationwide impact of CMRs on reducing PIM use in multimorbid Medicare beneficiaries with polypharmacy is unknown. The objective of this retrospective cohort study was to estimate the impact of CMRs on the discontinuation of PIM use in Medicare beneficiaries, and determine whether the impact varies based on race or ethnicity. We also report on the top 20 PIMs that were discontinued and then the top 20 PIMs that remained in use after CMR both overall and stratified by racial and ethnic subgroup.
METHODS
Study data and population
A retrospective cohort study was conducted using a 5% random sample of Medicare fee-for-service beneficiaries linked to the 100% Medicare Part D MTM files who were ≥66 years of age, enrolled in Medicare Part D from 2013 to 2019 and met MTM eligibility criteria, which are individually defined by Part D plans in accordance with Medicare’s set thresholds. From 2013–2019, these thresholds were: (i) at least 2–3 diagnosed chronic conditions, (ii) at least 2–8 medications, and (iii) at least $3,000-$4,000 in Part D drug spending (the spending threshold is updated annually).16,17 Each year, on at least a quarterly basis, Part D plans must determine who in their enrolled population meets eligibility criteria to be offered MTM and CMR. For each calendar year between 2013 to 2019, beneficiaries were eligible to enter our study cohort if they met their Part D plan’s MTM eligibility criteria that year. The date in a given year that the beneficiary first met MTM eligibility criteria served as the index date for entry into that year’s study cohort. Beneficiaries could be included in more than one study year.
To allow for creation of baseline covariates and sufficient follow-up to assess for PIM discontinuation, beneficiaries had to have continuous enrollment in Medicare Parts A, B, and D in the year prior to and the year after the index date. We then further restricted the cohort to community-dwelling beneficiaries (based on a previously validated algorithm identifying long-term care stays using Medicare data18) who were chronically using a PIM, defined as at least 2+ fills for ≥30 days each on separate dates in the seven months prior to the index date. A lookback period of seven months allowed us to avoid missing beneficiaries who had 2+ fills of 90 days each (common for chronic medications) and who did not refill immediately. The cohort meeting these criteria (n=78,380 patients) included those who received CMR (27,547 CMR recipient-years, representing 20,089 unique individuals) and those who did not receive CMR (100,447 CMR non-recipient-years, representing 58,291 unique individuals; Figure 1).
Figure 1.
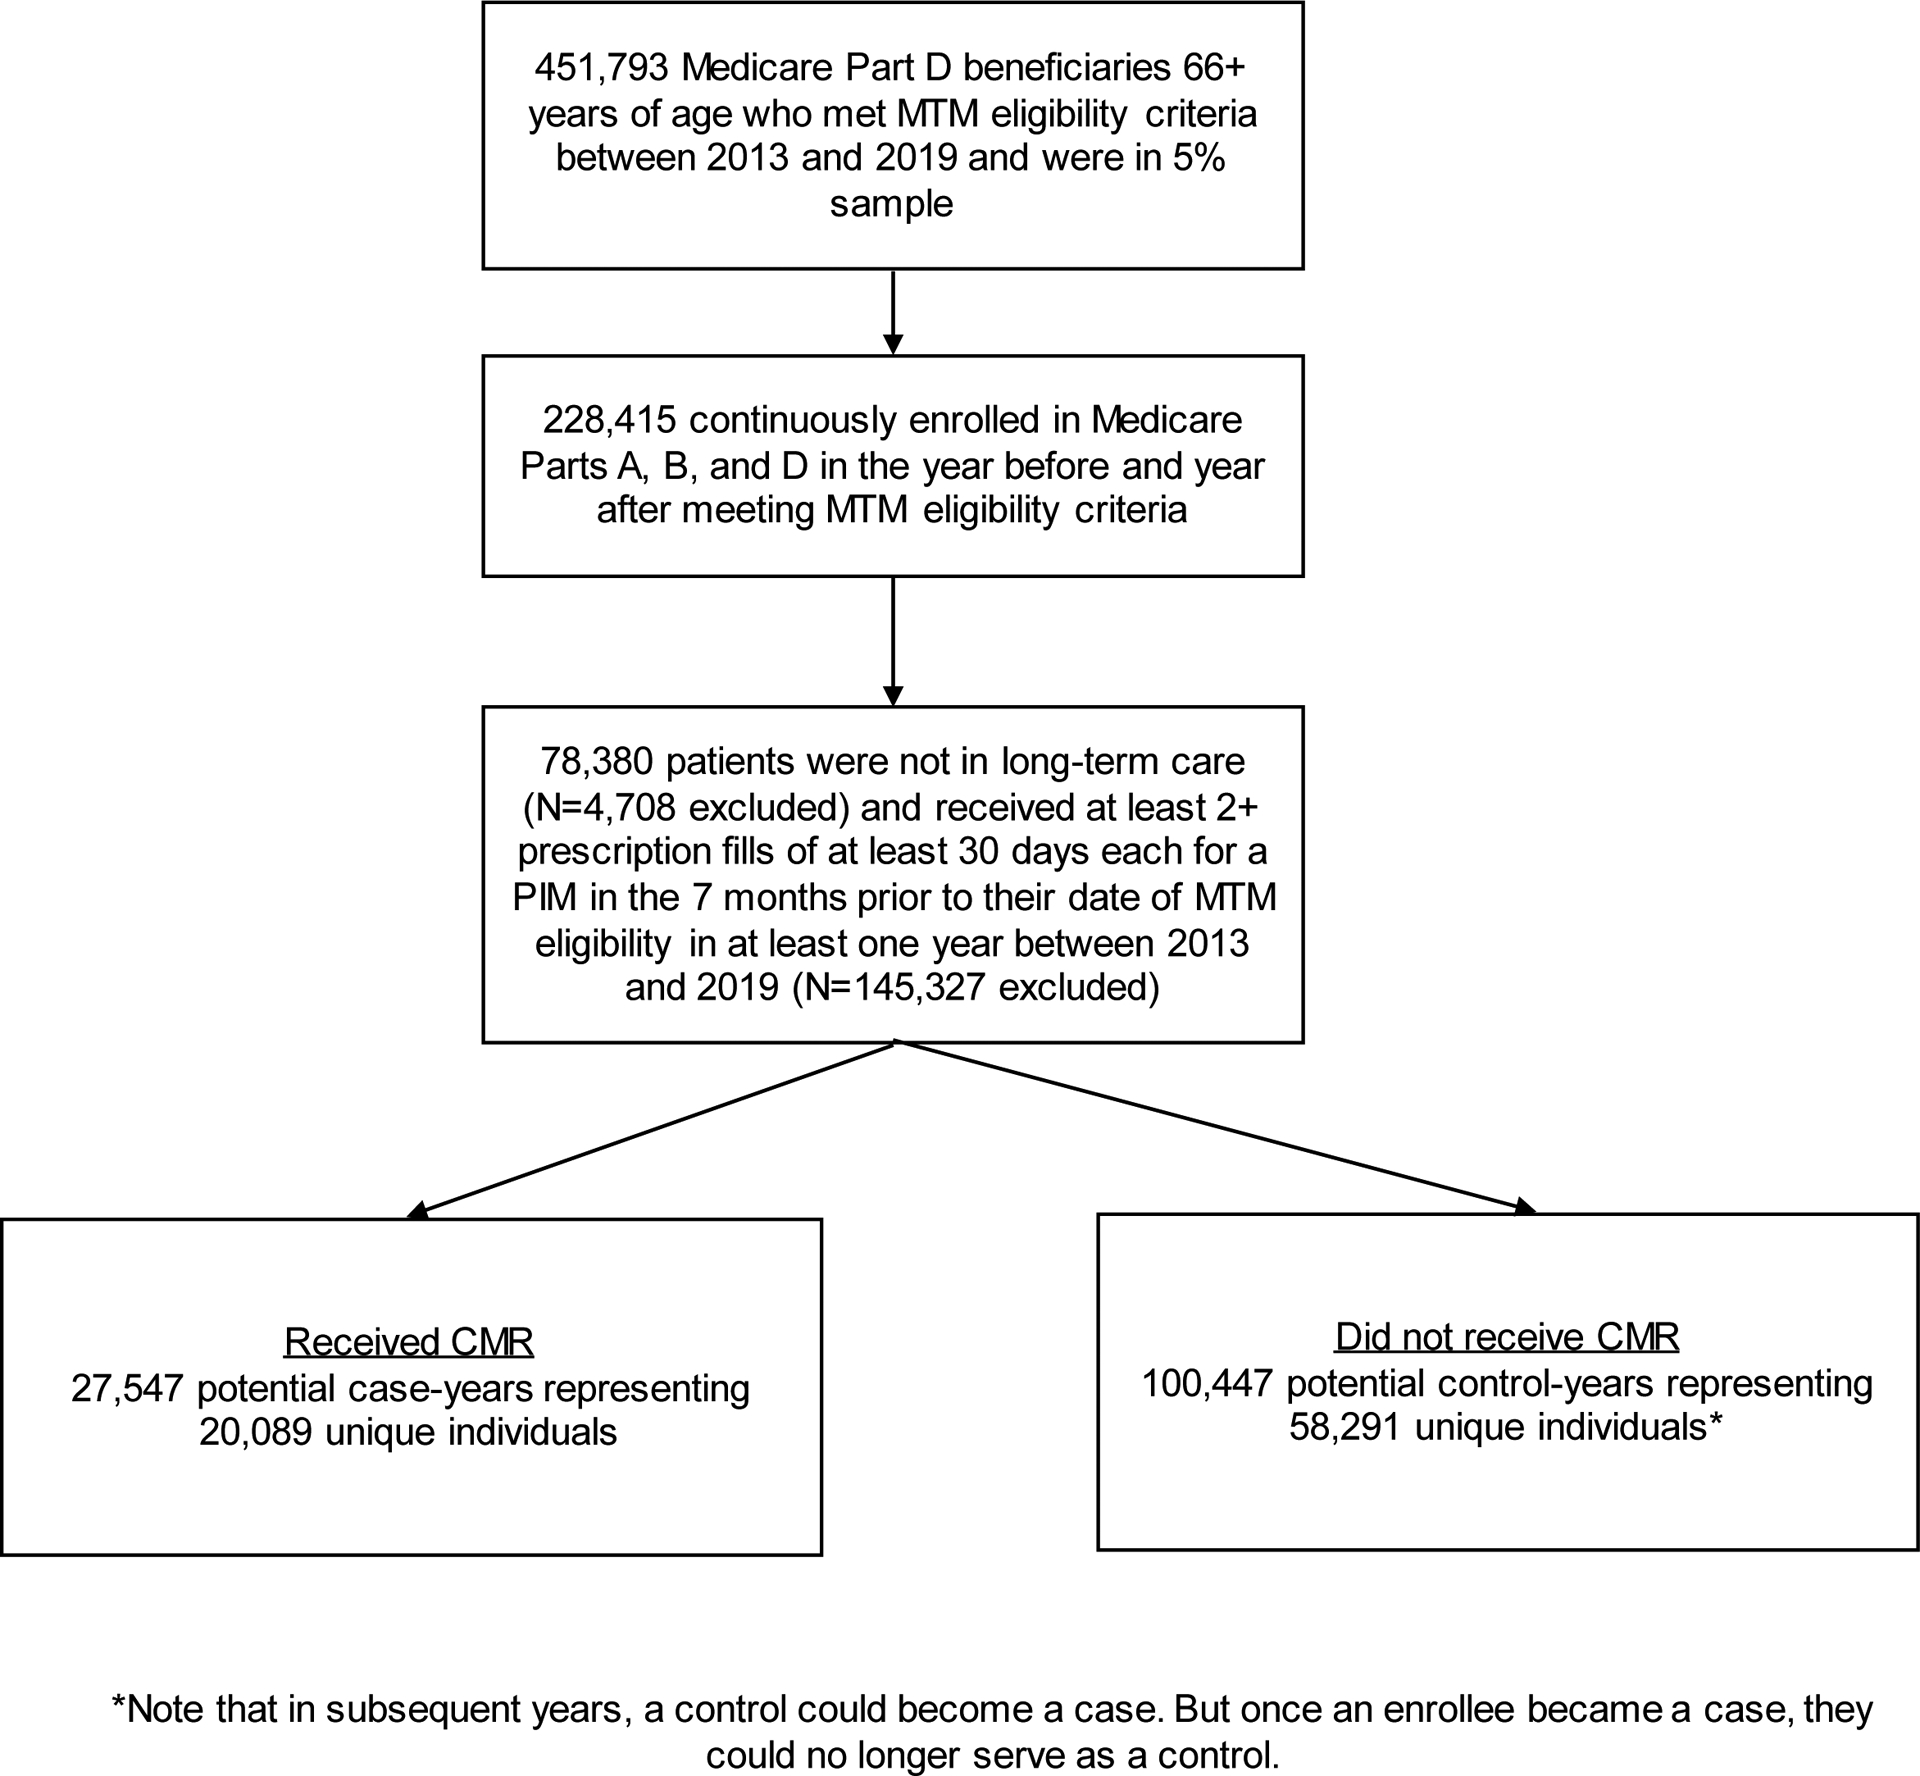
Flowchart
Matching and Covariates
MTM-eligible CMR recipients were matched to MTM-eligible non-recipients via sequential stratification, which is a longitudinal matching approach.19–21 Baseline covariates were measured in relation to each index date, allowing for handling of time-varying confounding. In our two-stage matching approach, we first applied exact matching on the following categorical covariates that are potential confounders: year of MTM eligibility, age (five-year buckets), sex, race and ethnicity (non-Hispanic White, non-Hispanic Black, Hispanic, and other), dual-Medicaid enrollment (dual-Medicaid enrollment, low-income subsidy alone, or neither), geographic region, and prior-year diagnosis-based indicators for diabetes, hypertension, and dementia (since these three comorbidities pre-matching had standardized mean differences [SMD] that were >10%). In the second stage, we matched each CMR recipient with a control (CMR non-recipient) who was most similar in certain continuous variables using the Mahalonobis distance. These variables, which are potential confounders, include age, Charlson comorbidity score, number of medications, number of PIMs, total inflation-adjusted Medicare costs, and total inflation-adjusted out-of-pocket costs in the prior year. Through two-stage matching, a greater number of potential confounders could be included without losing cases due to lack of a matched control. After matching, there were 24,368 CMR recipient-years and 24,368 CMR non-recipient-years.
Additional confounders included in the final regression adjustment included rural residence,22 comorbid conditions, additional measures of health care utilization, and additional prescription-related measures. These variables were also potential confounders, but could not be included as a matching variable without losing cases due to lack of a matched control. Comorbidities (i.e., heart failure, hyperlipidemia, chronic obstructive pulmonary disease, asthma, osteoporosis, depression, chronic kidney disease, and hearing loss) were identified based on Medicare Chronic Conditions Data Warehouse indicators in the year prior to the date of MTM eligibility,23 except for dementia and hearing loss which were not available for the entire study period and were instead based on algorithms used in prior studies.24,25 Additional measures of health care utilization included any inpatient stay, any emergency room visit, and number of outpatient visits in the year prior to MTM eligibility. Additional prescription-related measures included number of prescription fills for any medications as well as specifically for PIMs in the year prior to MTM eligibility.
Outcome Measure
PIMs were defined based on the HRM quality measure, which was developed by Pharmacy Quality Alliance based on Beers criteria and used in the Medicare Star Rating Program.5 We evaluated for PIM discontinuation after a lag time of 3 months after the CMR, to account for the time needed for the pharmacist, patient, and providers to communicate about the CMR recommendations, and because some medications (e.g., antidepressants) may require months-long tapers (e.g., 25–50% reduction every one to four weeks).26,27 We defined PIM discontinuation as no fill for the PIM in the nine months after the three-month lag time. In sensitivity analyses, we varied the definition of PIM discontinuation based on various time windows (e.g., zero-month lag and no fill for 12 months; zero-month lag and no fill for six months; and six-month lag and no fill for six months). If a beneficiary was chronically using 2+ PIMs at the time of MTM eligibility, the beneficiary was counted as discontinuing a PIM if they discontinued at least one PIM.
Analysis
Covariate balance across matched cohorts was assessed based on SMDs <10%, which represent negligible differences between groups.28 A few covariates (e.g., number of prior-year outpatient visits, inflation-adjusted costs, and number of medications) had SMDs greater than 10% (Table 1) and were adjusted for in the model. To evaluate the impact of CMR receipt on PIM discontinuation, we utilized generalized estimating equations with binomial error distributions and log links pooling yearly subcohorts with clustering by patient (since the same patient could be in different yearly subcohorts). Model-estimated probabilities of PIM discontinuation for CMR recipients versus non-recipients were generated at the mean values of all covariates. To evaluate whether the impact of CMR receipt on chance of PIM discontinuation varied by race or ethnicity, interaction terms between CMR receipt and each racial and ethnic subgroup were added. Statistically significant differences were defined at an alpha level of 0.05. All analyses were conducted in SAS version 9.4 (Cary, NC), and the institutional review board at Duke University Health System approved this study. When descriptively reporting the top 20 PIMs that were discontinued after CMR, we report by volume (i.e., number of patients who had the PIM discontinued) and also provide the percentage (i.e., among users of the particular PIM, what percentage discontinued. We reported these overall and by race and ethnicity. We also reported the top 20 PIMs that remained in use after CMR. The study followed the Strengthening the Reporting of Observational Studies in Epidemiology (STROBE) reporting guideline.
Table 1.
Patient Characteristics Before and After Matching
| PRE-MATCH | POST-MATCH | |||||
|---|---|---|---|---|---|---|
|
Recipients of CMR (n=27,547) |
Non-recipients of CMR (n=100,447) |
SMD |
Recipients of CMR (n=24,368) |
Non-recipients of CMR (n=24,368) |
SMD | |
| Age, median (25th,75th percentile) | 74.6 (70.1, 80.3) | 74.9 (70.1, 80.9) | 4.6% | 74.6 (70.1, 80.2) | 74.3 (70.2, 79.6) | 4.5% |
| Male, n (%) | 9,673 (35.1%) | 36,487 (36.3%) | 2.5% | 8,485 (34.8%) | 8,485 (34.8%) | 0.0% |
| Race/Ethnicity, n (%) | 11.9% | 5.5% | ||||
| Asian, non-Hispanic | 486 (1.8%) | 2,726 (2.7%) | 441 (1.8%) | 556 (2.3%) | ||
| Black, non-Hispanic | 2,267 (8.2%) | 7,622 (7.6%) | 1,883 (7.7%) | 1,883 (7.7%) | ||
| Hispanic | 468 (1.7%) | 3,007 (3.0%) | 410 (1.7%) | 519 (2.1%) | ||
| North American Native, non-Hispanic | 89 (0.3%) | 503 (0.5%) | 44 (0.2%) | 44 (0.2%) | ||
| Other | 288 (1.0%) | 1,424 (1.4%) | 196 (0.8%) | 196 (0.8%) | ||
| Unknown | 259 (0.9%) | 259 (0.9%) | 224 (0.9%) | 257 (1.1%) | ||
| White, non-Hispanic | 23,690 (86.0%) | 84,239 (83.9%) | 21,170 (86.9%) | 20,913 (85.8%) | ||
| Dual-Medicaid Enrollment/Low Income Subsidy, n (%) | 8.0% | 0.0% | ||||
| Dually-enrolled in Medicaid | 8,192 (29.7%) | 33,582 (33.4%) | 7,200 (29.5%) | 7,200 (29.5%) | ||
| Low Income Subsidy alone (i.e., not dually-enrolled in Medicaid) | 1,147 (4.2%) | 4,135 (4.1%) | 920 (3.8%) | 920 (3.8%) | ||
| No Low Income Subsidy | 18,208 (66.1%) | 62,730 (62.5%) | 16,248 (66.7%) | 16,248 (66.7%) | ||
| Census division, n (%) | 4.4% | 0.0% | ||||
| Northeast | 6,524 (23.7%) | 23,029 (22.9%) | 5,821 (23.9%) | 5,821 (23.9%) | ||
| Midwest | 5,504 (20.0%) | 18,885 (18.8%) | 4,865 (20.0%) | 4,865 (20.0%) | ||
| South | 11,404 (41.4%) | 42,540 (42.4%) | 10,189 (41.8%) | 10,189 (41.8%) | ||
| West | 4,098 (14.9%) | 15,896 (15.8%) | 3,493 (14.3%) | 3,493 (14.3%) | ||
| Other | 17 (0.1%) | 97 (0.1%) | 0 | 0 | ||
| Rural residence, n (%) | 8,346 (30.3%) | 27,330 (27.2%) | 6.8% | 7,380 (30.3%) | 7,380 (30.3%) | 0.0% |
| Charlson Comorbidity Index, median (25th,75th percentile | 1.0 (0.0, 3.0) | 1.0 (0.0, 3.0) | 7.8% | 1.0 (0.0, 3.0) | 1.0 (0.0, 3.0) | 6.6% |
| Comorbidity, n (%) | ||||||
| Diabetes | 11,661 (42.3%) | 48,780 (48.6%) | 12.5% | 10,545 (43.3%) | 10,545 (43.3%) | 0.0% |
| Heart failure | 3,973 (14.4%) | 16,654 (16.6%) | 6.0% | 3,603 (14.8%) | 3,412 (14.0%) | 2.2% |
| Dyslipidemia | 21,278 (77.2%) | 77,102 (76.8%) | 1.1% | 18,817 (77.2%) | 18,624 (76.4%) | 1.9% |
| Hypertension | 14,378 (52.2%) | 58,100 (57.8%) | 11.4% | 13,094 (53.7%) | 13,094 (53.7%) | 0.0% |
| Chronic obstructive pulmonary disease | 6,145 (22.3%) | 21,486 (21.4%) | 2.2% | 5,577 (22.9%) | 4,933 (20.2%) | 6.4% |
| Asthma | 3,796 (13.8%) | 11,592 (11.5%) | 6.7% | 3,344 (13.7%) | 2,730 (11.2%) | 7.6% |
| Osteoporosis | 4,528 (16.4%) | 18,415 (18.3%) | 5.0% | 4,141 (17.0%) | 4,090 (16.8%) | 0.6% |
| Depression | 3,513 (12.8%) | 14,308 (14.2%) | 4.4% | 3,216 (13.2%) | 3,147 (12.9%) | 0.8% |
| Hearing loss | 938 (3.4%) | 2,841 (2.8%) | 3.3% | 838 (3.4%) | 697 (2.9%) | 3.3% |
| Dementia | 1,879 (6.8%) | 10,716 (10.7%) | 13.7% | 1,567 (6.4%) | 1,567 (6.4%) | 0.0% |
| Chronic kidney disease | 3,720 (13.5%) | 14,439 (14.4%) | 2.5% | 3,338 (13.7%) | 2,953 (12.1%) | 4.7% |
| Had hospitalization in prior year | 8,637 (31.4%) | 31,987 (31.8%) | 1.1% | 7,677 (31.5%) | 6,617 (27.2%) | 9.6% |
| Had emergency room visit in prior year | 13,173 (47.8%) | 47,324 (47.1%) | 1.4% | 11,630 (47.7%) | 10,717 (44.0%) | 7.5% |
| Number of outpatient visits in prior year, median (25th,75th percentile | 5.0 (2.0, 11.0) | 5.0 (1.0, 10.0) | 9.5% | 5.0 (2.0, 11.0) | 4.0 (2.0, 9.0) | 18.2% |
| Inflation-adjusted costs in prior year in USD, median (25th,75th percentile | 17225.3 (9197.7, 34615.8) | 16188.7 (8467.8, 34122.3) | 1.3% | 17071.0 (9092.0, 34525.1) | 14257.3 (7907.0, 27755.6) | 18.8% |
| Number of medications in prior year, median (25th,75th percentile | 17.0 (13.0, 22.0) | 17.0 (13.0, 21.0) | 4.5% | 17.0 (13.0, 22.0) | 16.0 (13.0, 20.0) | 16.8% |
| Number of prescription fills in prior year, median (25th,75th percentile | 69.0 (49.0, 103.0) | 72.0 (49.0, 108.0) | 5.6% | 69.0 (48.0, 103.0) | 67.0 (47.0, 98.0) | 5.5% |
| Inflation-adjusted out-of-pocket medication costs in prior year in USD, median (25th,75th percentile) | 834.4 (191.3, 1704.1) | 786.2 (169.2, 1733.3) | 1.1% | 834.5 (195.4, 1690.4) | 884.9 (196.5, 1713.4) | 0.6% |
| Number of potentially inappropriate medications in prior year, median (25th,75th percentile) | 1.0 (1.0, 2.0) | 1.0 (1.0, 2.0) | 4.2% | 1.0 (1.0, 2.0) | 1.0 (1.0, 2.0) | 9.6% |
| Number of prescription fills for potentially inappropriate medications in prior year, median (25th,75th percentile | 6.0 (4.0, 11.0) | 7.0 (4.0, 12.0) | 8.2% | 6.0 (4.0, 11.0) | 6.0 (4.0, 11.0) | 1.6% |
CMR = comprehensive medication review; SMD = standardized mean difference
RESULTS
The matched cohorts had a median age of 74 (IQR 70–80), 35% were male, 86–87% were non-Hispanic White, 8% were non-Hispanic Black beneficiaries, 2% were non-Hispanic Asian beneficiaries, 2% were Hispanic beneficiaries (Table 1), and most covariates were well-matched. Forty-two percent resided in the South, 30% lived in a rural area and 30% were dual-Medicaid enrollees. The three most common comorbidities were dyslipidemia (77–77%), hypertension (54%), and diabetes (43%), and the median number of PIMs was 1 (IQR 1–2).
After adjusting for covariates, CMR receipt was associated with a higher relative likelihood of discontinuing a PIM (adjusted relative risk [aRR]: 1.26, 95% CI: 1.20–1.32, Table 2). On average, patients who received a CMR had a 19% (95% CI: 19%−20%) chance of discontinuing a PIM while those who did not receive a CMR had a 16% (95% CI: 15%−16%) chance of discontinuing a PIM (p<0.001; Supplementary Table S1). In several sensitivity analyses that modified the time window such as no time lag and a 6-month time lag, the aORs varied between 1.13 and 1.28 and remained statistically significant across sensitivity analyses, suggesting that results are robust. Interactions between CMR receipt and race/ethnicity were not significant (Table 3), indicating a similar association between CMR receipt and PIM discontinuation across racial and ethnic subgroups.
Table 2.
Association between CMR Receipt and Discontinuation of PIM
| Adjusted Relative Risk (95% CI) | |
|---|---|
| CMR received | 1.26 (1.2–1.32) |
| Age | 1.01 (1–1.01) |
| Male | 0.9 (0.86–0.95) |
| Race (ref=White) | |
| Asian, non-Hispanic | 1.25 (1.06–1.46) |
| Black, non-Hispanic | 1.05 (0.96–1.15) |
| Hispanic | 1.12 (0.95–1.32) |
| North American Native, non-Hispanic | 1.42 (0.87–2.32) |
| Other | 1.15 (0.88–1.49) |
| Unknown | 1.04 (0.81–1.33) |
| Dual-Medicaid Enrollment/Low Income Subsidy | |
| LIS only | 1.01 (0.89–1.16) |
| Dual-Medicaid Enrollment | 1.13 (1.04–1.21) |
| Region (ref=Northeast) | |
| Midwest | 1.06 (0.98–1.14) |
| South | 1.06 (0.99–1.14) |
| West | 1.13 (1.04–1.23) |
| Rural | 1.04 (0.98–1.1) |
| Charlson comorbidity score | 1.04 (1.03–1.05) |
| Inpatient stay | 1.05 (0.98–1.12) |
| ER visit | 1.09 (1.03–1.16) |
| OP visit counts | 1 (1–1) |
| Prior year costs to Medicare | 1 (1–1) |
| Number of drugs prescribed in prior year | 1.02 (1.01–1.02) |
| Number of prescription fills in prior year | 1 (1–1) |
| Prior year out-of-pocket medication costs | 1 (1–1) |
| Number of PIMs prescribed in prior year | 1.48 (1.44–1.53) |
| Year of CMR (ref=2013) | |
| 2014 | 1.08 (0.98–1.19) |
| 2015 | 1.11 (1.02–1.21) |
| 2016 | 1 (0.91–1.1) |
| 2017 | 0.89 (0.81–0.97) |
| 2018 | 0.9 (0.82–0.98) |
| 2019 | 0.86 (0.78–0.94) |
CMR = comprehensive medication review; PIM = potentially inappropriate medication
Table 3.
Estimates for PIM discontinuation by racial or ethnic subgroup (when including an interaction between CMR receipt and racial or ethnic subgroup
| Parameter | CMR RR (95% CI) | P value for interaction |
|---|---|---|
| Association of CMR receipt with discontinuation by patient race and ethnicity | ||
| Asian, non-Hispanic | 1.12 (0.83–1.51) | 0.4093 |
| Black, non-Hispanic | 1.12 (0.95–1.32) | 0.1438 |
| White, non-Hispanic | 1.28 (1.21–1.34) | Ref. |
| Hispanic | 1.45 (1.06–1.99) | 0.4248 |
| North American Native, non-Hispanic | 0.49 (0.18–1.34) | 0.0620 |
| Other | 1.70 (1.01–2.86) | 0.2850 |
| Unknown | 0.82 (0.51–1.33) | 0.0734 |
Model is additionally adjusted for age, sex, year of MTM eligibility, dual enrollment in Medicaid or other LIS, geographic region of residence, residence in rural area, Charlson comorbidity score, inpatient stay in prior year, er visit in prior year, number of OP visits in prior year, prior year costs to Medicare, number of drugs prescribed in prior year, number of prescription fills in prior year, prior year out of pocket medication costs, and number of unique PIMS prescribed in the prior year. No interactions between CMR receipt and any of the racial or ethnic groups were statistically significant.
The top five PIMs most commonly discontinued by volume after CMR were glimepiride, zolpidem, digoxin, amitriptyline, and nitrofurantoin. Among the top 20 most commonly discontinued PIMs by volume (i.e., total number of patients), the top five most commonly discontinued PIMs based on percentage of patients were megestrol (52.6%), nitrofurantoin (47.1%), promethazine (41.7%), methocarbamol (39.7%), and cyclobenzaprine (39.4%; Table 4). Supplementary Table S2 shows these results by racial and ethnic subgroup but comparisons are limited by small sample sizes.
Table 4.
Top 20 Most Common PIMs that were Discontinued after CMR
| Patients discontinuing after CMR (Count) | Percentage of patients discontinuing drug after CMR (%) | |
|---|---|---|
| Across All Races/Ethnicities | ||
| GLIMEPIRIDE | 784 | 12.0 |
| ZOLPIDEM TARTRATE | 742 | 25.1 |
| DIGOXIN | 486 | 12.7 |
| AMITRIPTYLINE HCL | 349 | 17.2 |
| NITROFURANTOIN MACROCRYSTAL | 344 | 47.1 |
| CYCLOBENZAPRINE HCL | 308 | 39.4 |
| GLYBURIDE | 267 | 31.0 |
| PAROXETINE HCL | 264 | 11.3 |
| MECLIZINE HCL | 258 | 29.7 |
| DICYCLOMINE HCL | 176 | 25.7 |
| NORTRIPTYLINE HCL | 152 | 21.4 |
| HYDROXYZINE HCL | 144 | 37.4 |
| DOXEPIN HCL | 112 | 22.4 |
| GLYBURIDE/METFORMIN HCL | 98 | 30.4 |
| ESTRADIOL | 91 | 16.3 |
| PROMETHAZINE HCL | 91 | 41.7 |
| MEGESTROL ACETATE | 82 | 52.6 |
| ESTROGENS, CONJUGATED | 80 | 21.4 |
| METHOCARBAMOL | 77 | 39.7 |
| DIPHENOXYLATE HCL/ATROPINE | 74 | 28.8 |
In descriptive analyses identifying potential PIM targets for future CMR deprescribing interventions, the top five most common PIMs that patients continued to use based on volume (i.e., total number of patients) were glimepiride, digoxin, zolpidem, paroxetine, and amitriptyline (Supplementary Table S3). The top five PIMs were the same for non-Hispanic White beneficiaries and non-Hispanic Black beneficiaries. The top five PIMs for Hispanic and Asian beneficiaries were glimepiride, digoxin, zolpidem, paroxetine, and meclizine.
DISCUSSION
This is the first nationwide study to find that receipt of CMR was associated with a higher chance of PIM discontinuation for multimorbid older adults with polypharmacy. This finding demonstrates the value of the Medicare MTM program’s CMR, because PIMs are associated with persistent physical disability, hospitalization, emergency department use, and total healthcare expenditures.3,4 Future studies that examine the impact of CMR on some of these longer-term clinical outcomes are warranted. Findings from this study are particularly timely given that awareness of appropriate deprescribing is growing and Medicare is considering expanding eligibility for the MTM program with an estimated increase in the size of the eligible population from 4.5 million to 11 million annually.29,30
Our findings are consistent with a prior study showing that CMR recipients were less likely to have a repeat filling of a PIM (adjusted odds ratio [aOR]: 0.12, 95% confidence interval [CI]: 0.08–0.22) in 2015.15 However, our findings, based on 2013–2019 data and representative of all standalone Part D plans across the nation, did not demonstrate as large an effect as the 2015 study, which focused on one integrated health delivery system from one geographic region. Since MTM services can vary greatly by plan in terms of delivery, enrollment, and the specific eligibility criteria (as long as they meet Medicare’s minimum thresholds), it is likely that the impact of MTM services on PIM discontinuation can also vary.17 MTM services can also be linked to other medication management services, such as a disease management program that is provided by the Part D plan. Future studies should assess how this heterogeneity in how MTM is delivered and any linkages to other medication management services offered by the Part D plan can impact PIM discontinuation to determine what variations are more effective.
We also found that the CMR impact on PIM discontinuation was similar across racial and ethnic subgroups, suggesting that CMRs can be used to encourage PIM discontinuation at a large scale and for different populations. This is also timely given Medicare’s emphasis on reducing health disparities,31 reporting on quality measures that are stratified by subgroups such as by race and ethnicity,32 development of a health equity summary score (which incorporates race and ethnicity as well as dual eligibility for Medicaid),33 and inclusion of a health equity index reward in the Star Ratings program beginning 2027.34 Despite finding similar CMR impacts on PIM use based on race and ethnicity, chances of receipt of CMR can differ by racial and ethnic subgroups, and these disparities need to be addressed.10 Furthermore, MTM programs are increasingly recognizing the importance of addressing the social needs of their beneficiary population,35 which can also differ based on race and ethnicity. Future work is needed to more deeply explore how other social determinants of health affect CMR receipt and impacts, and how social needs should be addressed as part of MTM programs.
From 2009 to 2017, the Beers criteria-based HRM quality measure was a Medicare Star Rating measure, and therefore Part D plans would have been particularly incentivized to address PIM discontinuations during this time. From 2018–2020, the HRM quality measure became a display measure, meaning that it no longer affected the summary Star rating, but was still measured and displayed on the Medicare Plan Finder website which could affect whether a Medicare beneficiary enrolled in a particular Part D plan. After 2020, the HRM quality measure was retired and replaced with newer quality measures focused on polypharmacy.36 As newer data become available, future studies should examine whether CMR impacts on PIMs as defined by the HRM quality measure (and Beers criteria) have declined (after 2020), and the degree to which CMRs are now helping to reduce polypharmacy.
To identify targets for future CMR deprescribing interventions, we identified the most common PIMs that remained in use after CMR. Such PIMs would not have been addressed during the CMR (at least fully), and would deserve attention in understanding the barriers and next steps in terms of how to encourage their discontinuation. The most common PIMs remaining in use after CMR were similar across racial and ethnic subgroups and consisted of medications for diabetes, heart failure or atrial fibrillation, insomnia, and depression, which reflect some of the most prevalent conditions in older adults. Overall and for each racial and ethnic subgroup, the most commonly continued PIM was glimepiride, a sulfonylurea that is used to treat diabetes but has a higher risk of cardiovascular events, all-cause mortality, and hypoglycemia compared to other non-sulfonylurea diabetes medications. Sulfonylureas are older medications that are generally cheaper so if cost is a barrier to switching to another drug class, glimepiride (a long-acting sulfonylurea) should at a minimum be switched to a short-acting sulfonylurea, such as glipizide, which has a lower risk of prolonged hypoglycemia than glimepiride.2 In some cases, discontinuation of glimepiride without substitution is appropriate. The American Diabetes Association and American Geriatrics Society recommend less-stringent A1c targets (such as <8%) and deintensification of diabetes medications within these individualized targets for older adults with multiple coexisting chronic illnesses, functional impairment, or cognitive impairment.37,38
Despite these guidelines, deintensification of diabetes medications is not commonplace,39,40 indicating how challenging deprescribing can be. Common patient barriers to deprescribing include fear of losing disease control and lack of access to deprescribing education.41–43 Provider barriers to deprescribing include a lack of training on how to deprescribe (e.g., how to taper and monitor) and care-coordination concerns such as uncertainty around discontinuing a medication that was initiated by another prescriber and a fear of consequences if they are not guaranteed follow-up with the patient.43–46 To address these barriers, deprescribing algorithms are being developed, and are available for diabetes medications including sulfonylureas.47 Pharmacists conducting CMRs for Medicare beneficiaries could help play a role in coordinating care, providing consistent follow-up, and encouraging appropriate deintensification of diabetes medications such as glimepiride.
Limitations
One study limitation is that the 100% Medication Therapy Management data file provided by Medicare did not provide enough detail to allow us to know whether the pharmacist conducting the CMR recommended discontinuing a PIM. CMRs can lead to multiple actions, such as educating patients around how to use their medications, addressing potential side effects, addressing out-of-pocket cost concerns, and reaching out to prescribers to encourage medication changes. Thus, it is encouraging to see that CMR receipt among those who were already receiving a PIM was on average associated with an increased likelihood of discontinuing the PIM. Another study limitation is that we did not measure dosage decreases (e.g., if discontinuation of a medication required tapering), so this may represent an under-estimate of CMR impacts on PIM management. However, we did allow for a three-month lag period after CMR receipt to capture some tapering for medications such as antidepressants.26,27 Some medications, such as antipsychotics, may take longer than three months (i.e., even years) to taper.48 A third limitation is that patients who are more likely to receive a CMR may be more amenable to deprescribing and such patient activation measures are not available in administrative claims data. However, analyses did adjust for multiple prior-year healthcare utilization measures, such as number of outpatient visits, number of prescriptions, fills, and out-of-pocket costs, which may somewhat account for patient activation. A fourth limitation is that we required beneficiaries to be continuously enrolled in the year after MTM eligibility so their medication fill data were available. This inclusion criterion may have excluded sicker beneficiaries who died in the first year. Such deaths should be relatively rare for a study population of community-dwelling beneficiaries and such beneficiaries would have been excluded from both the cases and the matched controls. A fifth limitation is that the data lacked individual-level measures of social deprivation and other social determinants of health to more deeply explore how such factors may influence CMR impacts on PIM discontinuation by race and ethnicity. Study strengths included a rigorous study design involving matching, multiple years of data, and a nationally representative cohort of Medicare fee-for-service beneficiaries.
In conclusion, we found that from 2013 to 2019, CMRs from the nationwide Medicare MTM program were associated with PIM discontinuation among community-dwelling Medicare fee-for-service beneficiaries using a PIM and CMR impacts were similar by racial and ethnic subgroups. These results suggest that greater CMR provision could reduce the risk of adverse events associated with PIM use.
Supplementary Material
Key Points.
Every year, approximately 4.5 million Medicare beneficiaries are eligible for medication therapy management services, including a comprehensive medication review (CMR), that Part D plans are required to provide
Among community-dwelling, Medicare fee-for-service beneficiaries, receipt of CMR was associated with the discontinuation of potentially inappropriate medications (PIM)
The impact of CMR on PIM discontinuation did not vary by race or ethnicity
Why Does this Paper Matter?
Medicare’s medication therapy management program has helped to discontinue PIMs across multiple racial and ethnic subgroups and can serve as a platform upon which to build future deprescribing interventions.
ACKNOWLEDGMENTS
AH acknowledges the study’s Stakeholder Advisory Board, the US Deprescribing Research Network Junior Investigator Intensive Program, the JAGS Junior Reviewer Program, and the AGING Initiative’s Multiple Chronic Conditions Scholars Program.
Funding:
This work was supported by the US Deprescribing Research Network (R24AG064025). Study team members were also supported by VA HSR&D funding (IK2 HX003359 to AH and RCS 10-391 to MLM), the Durham Center of Innovation to Accelerate Discovery and Practice Transformation (ADAPT) (CIN 13-410) at the Durham VA Health Care System, and NIA (K23AG058788 to JMP and K23AG076889 to CES).
Sponsor’s Role:
The funders had no role in the design, analysis, and preparation of the paper. The contents do not represent the views of the U.S. Department of Veterans Affairs or the United States Government.
Conflicts of interest:
AH reports honoraria and conference support from Academy of Managed Care Pharmacy, honoraria from Journal of Managed Care and Specialty Pharmacy, conference registration from Pharmacy Quality Alliance, and research grants from Abbott and AstraZeneca. MLM reports ownership of Amgen stock due to his spouse’s employment. No other authors report conflicts.
Footnotes
Supplemental Material. Model-predicted probabilities of PIM discontinuation and Top PIMs that were and were not discontinued by race and ethnicity.
REFERENCES
- 1.Charlesworth CJ, Smit E, Lee DSH, Alramadhan F, Odden MC. Polypharmacy Among Adults Aged 65 Years and Older in the United States: 1988–2010. J Gerontol A Biol Sci Med Sci. 2015;70(8):989–995. doi: 10.1093/gerona/glv013 [DOI] [PMC free article] [PubMed] [Google Scholar]
- 2.By the 2023 American Geriatrics Society Beers Criteria® Update Expert Panel. American Geriatrics Society 2023 updated AGS Beers Criteria® for potentially inappropriate medication use in older adults. J Am Geriatr Soc. 2023;71(7):2052–2081. doi: 10.1111/jgs.18372 [DOI] [PubMed] [Google Scholar]
- 3.Clark CM, Shaver AL, Aurelio LA, et al. Potentially Inappropriate Medications Are Associated with Increased Healthcare Utilization and Costs. J Am Geriatr Soc. 2020;68(11):2542–2550. doi: 10.1111/jgs.16743 [DOI] [PMC free article] [PubMed] [Google Scholar]
- 4.Lockery JE, Collyer TA, Woods RL, et al. Potentially inappropriate medication use is associated with increased risk of incident disability in healthy older adults. J Am Geriatr Soc. 2023;71(8):2495–2505. doi: 10.1111/jgs.18353 [DOI] [PMC free article] [PubMed] [Google Scholar]
- 5.Pharmacy Quality Alliance. 2022 PQA Measure Manual: Use of High-Risk Medications in the Elderly (HRM). 2022. Accessed October 1, 2022. https://www.pqaalliance.org/.
- 6.Spivey CA, Wang J, Qiao Y, et al. Racial and Ethnic Disparities in Meeting MTM Eligibility Criteria Based on Star Ratings Compared with the Medicare Modernization Act. J Manag Care Spec Pharm. 2018;24(2):97–107. doi: 10.18553/jmcp.2018.24.2.97 [DOI] [PMC free article] [PubMed] [Google Scholar]
- 7.Spivey CA, Qiao Y, Wang J, et al. Comparative Effectiveness of Medication Therapy Management Eligibility Criteria Across Racial/Ethnic Groups. J Am Geriatr Soc. 2019;67(3):581–587. doi: 10.1111/jgs.15754 [DOI] [PMC free article] [PubMed] [Google Scholar]
- 8.Wang J, Qiao Y. Historical trend of disparity implications of Medicare MTM eligibility criteria. Res Soc Adm Pharm RSAP. 2013;9(6):758–769. doi: 10.1016/j.sapharm.2012.09.003 [DOI] [PMC free article] [PubMed] [Google Scholar]
- 9.Coe AB, Adeoye-Olatunde OA, Pestka DL, et al. Patterns and predictors of older adult Medicare Part D beneficiaries’ receipt of medication therapy management. Res Soc Adm Pharm RSAP. 2020;16(9):1208–1214. doi: 10.1016/j.sapharm.2019.12.007 [DOI] [PMC free article] [PubMed] [Google Scholar]
- 10.Lee M, Zarowitz BJ, Pellegrin K, Cooke CE, Fleming SP, Brandt N. Social determinants predict whether Medicare beneficiaries are offered a Comprehensive Medication Review. Res Soc Adm Pharm RSAP. 2023;19(1):184–188. doi: 10.1016/j.sapharm.2022.09.015 [DOI] [PubMed] [Google Scholar]
- 11.Shaver AL, Clark CM, Hejna M, Feuerstein S, Wahler RG, Jacobs DM. Trends in fall-related mortality and fall risk increasing drugs among older individuals in the United States,1999–2017. Pharmacoepidemiol Drug Saf. 2021;30(8):1049–1056. doi: 10.1002/pds.5201 [DOI] [PMC free article] [PubMed] [Google Scholar]
- 12.Jungo KT, Streit S, Lauffenburger JC. Utilization and Spending on Potentially Inappropriate Medications by US Older Adults with Multiple Chronic Conditions using Multiple Medications. Arch Gerontol Geriatr. 2021;93:104326. doi: 10.1016/j.archger.2020.104326 [DOI] [PubMed] [Google Scholar]
- 13.Lim D, Jung J. Racial-Ethnic Variations in Potentially Inappropriate Psychotropic Medication Use Among the Elderly. J Racial Ethn Health Disparities. 2019;6(2):436–445. doi: 10.1007/s40615-018-00541-0 [DOI] [PubMed] [Google Scholar]
- 14.Shmuel S, Pate V, Pepin MJ, et al. Quantifying cumulative anticholinergic and sedative drug load among US Medicare Beneficiaries. Pharmacoepidemiol Drug Saf. 2021;30(2):144–156. doi: 10.1002/pds.5144 [DOI] [PMC free article] [PubMed] [Google Scholar]
- 15.Caffiero N, Delate T, Ehizuelen MD, Vogel K. Effectiveness of a Clinical Pharmacist Medication Therapy Management Program in Discontinuation of Drugs to Avoid in the Elderly. J Manag Care Spec Pharm. 2017;23(5):525–531. doi: 10.18553/jmcp.2017.23.5.525 [DOI] [PMC free article] [PubMed] [Google Scholar]
- 16.Gray C, Cooke CE, Brandt N. Evolution of the Medicare Part D Medication Therapy Management Program from Inception in 2006 to the Present. Am Health Drug Benefits. 2019;12(5):243–251. [PMC free article] [PubMed] [Google Scholar]
- 17.2019 Medicare Part D Medication Therapy Management (MTM) Programs. Centers for Medicare & Medicaid Services. Sep 25, 2019. Available from: https://www.cms.gov/medicare/prescription-drug-coverage/prescriptiondrugcovcontra/downloads/cy2019-mtm-fact-sheet.pdf. [Google Scholar]
- 18.Goodwin JS, Li S, Zhou J, Graham JE, Karmarkar A, Ottenbacher K. Comparison of methods to identify long term care nursing home residence with administrative data. BMC Health Serv Res. 2017;17(1):376. doi: 10.1186/s12913-017-2318-9 [DOI] [PMC free article] [PubMed] [Google Scholar]
- 19.Schaubel DE, Wolfe RA, Port FK. A sequential stratification method for estimating the effect of a time-dependent experimental treatment in observational studies. Biometrics. 2006;62(3):910–917. doi: 10.1111/j.1541-0420.2006.00527.x [DOI] [PubMed] [Google Scholar]
- 20.Kennedy EH, Taylor JMG, Schaubel DE, Williams S. The effect of salvage therapy on survival in a longitudinal study with treatment by indication. Stat Med. 2010;29(25):2569–2580. doi: 10.1002/sim.4017 [DOI] [PMC free article] [PubMed] [Google Scholar]
- 21.Thomas LE, Yang S, Wojdyla D, Schaubel DE. Matching with time‐dependent treatments: A review and look forward. Stat Med. 2020;39(17):2350–2370. doi: 10.1002/sim.8533 [DOI] [PMC free article] [PubMed] [Google Scholar]
- 22.Rural-Urban Commuting Area Codes. US Department of Agriculture Economic Research Service. Aug 17, 2020. Available from: https://www.ers.usda.gov/data-products/rural-urban-commuting-area-codes/. [Google Scholar]
- 23.Chronic Conditions. Chronic Conditions Data Warehouse. Available from: https://www2.ccwdata.org/web/guest/condition-categories-chronic.
- 24.Grodstein F, Chang CH, Capuano AW, et al. Identification of Dementia in Recent Medicare Claims Data, Compared With Rigorous Clinical Assessments. J Gerontol A Biol Sci Med Sci. 2022;77(6):1272–1278. doi: 10.1093/gerona/glab377 [DOI] [PMC free article] [PubMed] [Google Scholar]
- 25.Deal JA, Reed NS, Kravetz AD, et al. Incident Hearing Loss and Comorbidity: A Longitudinal Administrative Claims Study. JAMA Otolaryngol-- Head Neck Surg. 2019;145(1):36–43. doi: 10.1001/jamaoto.2018.2876 [DOI] [PMC free article] [PubMed] [Google Scholar]
- 26.DEPRESCRIBING GUIDE FOR SELECTIVE SEROTONIN REUPTAKE INHIBITORS (SSRIs) AND SEROTONIN NORADRENALINE REUPTAKE INHIBITORS (SNRIs). Version 1_2018. NSW Therapeutic Advisory Group Inc Available from: https://www.nswtag.org.au/wp-content/uploads/2018/06/1.3-Deprescribing-Guide-for-Selective-Serotonin-Reuptake-Inhibitors-SSRIs-and-Serotonin-Noradrenaline-Reuptake-Inhibitors-SNRIs.pdf. [Google Scholar]
- 27.Horowitz MA, Taylor D. Tapering of SSRI treatment to mitigate withdrawal symptoms. Lancet Psychiatry. 2019;6(6):538–546. doi: 10.1016/S2215-0366(19)30032-X [DOI] [PubMed] [Google Scholar]
- 28.Austin PC. Balance diagnostics for comparing the distribution of baseline covariates between treatment groups in propensity-score matched samples. Stat Med. 2009;28(25):3083–3107. doi: 10.1002/sim.3697 [DOI] [PMC free article] [PubMed] [Google Scholar]
- 29.Centers for Medicare and Medicaid Services. Medicare Program; Contract Year 2024 Policy and Technical Changes to the Medicare Advantage Program, Medicare Prescription Drug Benefit Program, Medicare Cost Plan Program, Medicare Parts A, B, C, and D Overpayment Provisions of the Affordable Care Act and Programs of All-Inclusive Care for the Elderly. 88 FR 22120. Apr 12, 2023. Available from: https://www.federalregister.gov/d/2023-07115. [Google Scholar]
- 30.Reeve E, Thompson W, Boyd C, Lundby C, Steinman MA. The state of deprescribing research: how did we get here? Basic Clin Pharmacol Toxicol. Published online March 27, 2023. doi: 10.1111/bcpt.13862 [DOI] [PMC free article] [PubMed] [Google Scholar]
- 31.CMS Framework for Health Equity 2022–2032. April 2022. Centers for Medicare and Medicaid Services. Available from: https://www.cms.gov/files/document/cms-framework-health-equity-2022.pdf. [Google Scholar]
- 32.Stratified Reporting. Centers for Medicare and Medicaid Services. Updated Sep 6, 2023. Available from: https://www.cms.gov/priorities/health-equity/minority-health/research-data/stratified-reporting.
- 33.Agniel D, Martino SC, Burkhart Q, et al. Incentivizing Excellent Care to At-Risk Groups with a Health Equity Summary Score. J Gen Intern Med. 2021;36(7):1847–1857. doi: 10.1007/s11606-019-05473-x [DOI] [PMC free article] [PubMed] [Google Scholar]
- 34.2024 Medicare Advantage and Part D Final Rule (CMS-4201-F). Centers for Medicare and Medicaid Services. Apr 5, 2023. Available from: https://www.cms.gov/newsroom/fact-sheets/2024-medicare-advantage-and-part-d-final-rule-cms-4201-f. [Google Scholar]
- 35.Almodóvar AS, Ross E, Nahata MC, Bingham JM. Social needs of dual-enrolled Medicare-Medicaid patients with medication nonadherence in a telehealth medication therapy management program. J Manag Care Spec Pharm. 2023;29(2):210–215. doi: 10.18553/jmcp.2023.29.2.210 [DOI] [PMC free article] [PubMed] [Google Scholar]
- 36.Part C and Part D Performance Data. Centers for Medicare and Medicaid Services. Updated Apr 8, 2023. Available from: https://www.cms.gov/Medicare/Prescription-Drug-Coverage/PrescriptionDrugCovGenIn/PerformanceData. [Google Scholar]
- 37.ElSayed NA, Aleppo G, Aroda VR, et al. 13. Older Adults: Standards of Care in Diabetes-2023. Diabetes Care. 2023;46(Suppl 1):S216–S229. doi: 10.2337/dc23-S013 [DOI] [PMC free article] [PubMed] [Google Scholar]
- 38.American Geriatrics Society Expert Panel on Care of Older Adults with Diabetes Mellitus, Moreno G, Mangione CM, Kimbro L, Vaisberg E. Guidelines abstracted from the American Geriatrics Society Guidelines for Improving the Care of Older Adults with Diabetes Mellitus: 2013 update. J Am Geriatr Soc. 2013;61(11):2020–2026. doi: 10.1111/jgs.12514 [DOI] [PMC free article] [PubMed] [Google Scholar]
- 39.Maciejewski ML, Mi X, Sussman J, et al. Overtreatment and Deintensification of Diabetic Therapy among Medicare Beneficiaries. J Gen Intern Med. 2018;33(1):34–41. doi: 10.1007/s11606-017-4167-y [DOI] [PMC free article] [PubMed] [Google Scholar]
- 40.McAlister FA, Youngson E, Eurich DT. Treatment Deintensification Is Uncommon in Adults With Type 2 Diabetes Mellitus: A Retrospective Cohort Study. Circ Cardiovasc Qual Outcomes. 2017;10(4):e003514. doi: 10.1161/CIRCOUTCOMES.116.003514 [DOI] [PubMed] [Google Scholar]
- 41.Pilla SJ, Meza KA, Schoenborn NL, Boyd CM, Maruthur NM, Chander G. A Qualitative Study of Perspectives of Older Adults on Deintensifying Diabetes Medications. J Gen Intern Med. 2023;38(4):1008–1015. doi: 10.1007/s11606-022-07828-3 [DOI] [PMC free article] [PubMed] [Google Scholar]
- 42.Peat G, Fylan B, Marques I, et al. Barriers and facilitators of successful deprescribing as described by older patients living with frailty, their informal carers and clinicians: a qualitative interview study. BMJ Open. 2022;12(3):e054279. doi: 10.1136/bmjopen-2021-054279 [DOI] [PMC free article] [PubMed] [Google Scholar]
- 43.Doherty AJ, Boland P, Reed J, et al. Barriers and facilitators to deprescribing in primary care: a systematic review. BJGP Open. 2020;4(3):bjgpopen20X101096. doi: 10.3399/bjgpopen20X101096 [DOI] [PMC free article] [PubMed] [Google Scholar]
- 44.Abou J, Crutzen S, Tromp V, et al. Barriers and Enablers of Healthcare Providers to Deprescribe Cardiometabolic Medication in Older Patients: A Focus Group Study. Drugs Aging. 2022;39(3):209–221. doi: 10.1007/s40266-021-00918-7 [DOI] [PMC free article] [PubMed] [Google Scholar]
- 45.Zechmann S, Trueb C, Valeri F, Streit S, Senn O, Neuner-Jehle S. Barriers and enablers for deprescribing among older, multimorbid patients with polypharmacy: an explorative study from Switzerland. BMC Fam Pract. 2019;20(1):64. doi: 10.1186/s12875-019-0953-4 [DOI] [PMC free article] [PubMed] [Google Scholar]
- 46.Keller MS, Carrascoza-Bolanos J, Breda K, et al. Identifying barriers and facilitators to deprescribing benzodiazepines and sedative hypnotics in the hospital setting using the Theoretical Domains Framework and the Capability, Opportunity, Motivation and Behaviour (COM-B) Model: a qualitative study. BMJ Open. 2023;13(2):e066234. doi: 10.1136/bmjopen-2022-066234 [DOI] [PMC free article] [PubMed] [Google Scholar]
- 47.Deprescribing Guidelines and Algorithms. deprescribing.org. Accessed Jul 6, 2023. Available from: https://deprescribing.org/resources/deprescribing-guidelines-algorithms/.
- 48.Horowitz MA, Jauhar S, Natesan S, Murray RM, Taylor D. A Method for Tapering Antipsychotic Treatment That May Minimize the Risk of Relapse. Schizophr Bull. 2021;47(4):1116–1129. doi: 10.1093/schbul/sbab017 [DOI] [PMC free article] [PubMed] [Google Scholar]
Associated Data
This section collects any data citations, data availability statements, or supplementary materials included in this article.