Fig 4.
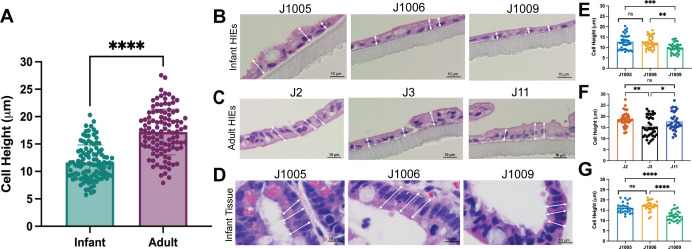
Infant HIEs have shorter epithelial cell height. (A). Quantitation of cell heights measured in H&E-stained images of 5-day differentiated infant and adult HIEs; P-values were calculated by student’s t-test. (B–D): Three representative images were taken for each HIE line and tissue, and blinded images were provided to three study authors for cell height measurements. A minimum of three single cells per image were measured by each analyst, generating up to 35 data points per sample. Panel D shows paired donor tissue samples for each infant HIE line. (E–G): Each dot indicates the height measurement of a single cell. Data represent mean ± SD with each experiment including the three infant and three adult HIE lines. The P-values were calculated by one-way ANOVA. The asterisks (**, ***, and ****) represent P < 0.01, P < 0.001, and P < 0.0001, respectively. Scale bar = 10 μm.

