

Abstract
Background
Classifying diverse skin types is crucial for promoting skin health. However, efficiently identifying and analyzing relevant biomarkers from a vast array of available genetic data is challenging. Therefore, this study aimed to develop a precise and efficient platform for analyzing specific skin biomarkers using quantitative real‐time PCR (qRT‐PCR) with the minimal invasive skin sampling method (MISSM).
Materials and methods
MISSM was used for RNA extraction from skin samples, followed by qRT‐PCR analysis to quantify the expression of 20 biomarkers associated with skin characteristics (four biomarkers each for five skin characteristics). Noninvasive measurements from 299 Korean participants were utilized to correlate biomarker expression with skin parameters. Statistical analyses were conducted between biomarker expression levels and noninvasive skin measurements to select the relatively best‐performing biomarker for each skin characteristic.
Results
Collagen type 1 alpha 1 (COL1A1) and moesin (MSN) were identified as skin aging biomarkers. Krüppel‐like factor 4 (KLF4) and serine peptidase inhibitor Kazal type 5 (SPINK5) were identified as skin dryness biomarkers, whereas melan‐A (MLANA) was selected as a biomarker for understanding pigmentation dynamics. Myelin protein zero like 3 (MPZL3) and high mobility group box 2 (HMGB2) were identified as markers of oily skin and skin sensitivity, respectively. Statistically significant correlations were found between the biomarker expression levels and noninvasive skin characteristic measurements.
Conclusion
This study successfully developed a platform for the precise evaluation of individual skin characteristics using MISSM and qRT‐PCR biomarker analysis. By selecting biomarkers that correlate with noninvasive measurements of skin characteristics, we demonstrated the platform's efficacy in assessing diverse skin conditions.
Keywords: biomarkers, minimal invasive skin sampling, personalized skincare, quantitative real‐time PCR, skin characterization
1. INTRODUCTION
Characterization of individual skin properties is pivotal for selecting appropriate skin care treatments and products tailored to personal needs. Skin types vary widely among individuals and are influenced by factors such as race, sex, age, occupation, and environmental exposure. Understanding these variations is critical for maintaining skin health and preventing adverse reactions resulting from the use of unsuitable products.
Skin types can be classified using Fitzpatrick's 1975 phototype system, which categorizes skin from type I (lightest) to type VI (darkest) based on the skin's response to ultraviolet (UV) radiation and susceptibility to sunburn. This system primarily aids in dermatological treatment and UV exposure risk assessment. 1 However, this classification system has limitations as it relies solely on pigmentation levels. In 2006, Baumann proposed a more nuanced classification, introducing 16 skin types based on four parameters: moisture versus dryness, sensitivity versus resistance, pigmented versus nonpigmented, and wrinkle‐prone versus resilient. However, the subjectivity of this method in self‐assessment surveys poses challenges, often diverging from objective measurements. 2 Advances in technology have spurred the development of noninvasive methods to assess skin characteristics, including imaging devices for surface analysis, and noninvasive skin measurements by each instruments such as moisture content and transepidermal water loss (TEWL). However, these methods often lack depth for assessing deeper skin layers and fail to provide personalized solutions tailored to individual genetic predispositions and dynamic environmental factors. In addition, noninvasive skin measurements are relatively expensive and require specific locations and facilities, making them impractical for general use and difficult to commercialize.
To address these limitations, recent efforts have focused on identifying biomarkers and molecular indicators of specific skin characteristics to offer precise insights into skin health. Biomarkers derived from protein or RNA analysis provide a promising avenue; however, traditional biopsy methods are invasive and impractical for widespread use because of surgical requirements.
We previously proposed a minimal invasive skin sampling method (MISSM) using biodegradable microneedle patches for RNA extraction, thereby enabling comprehensive transcriptomic analysis of collected skin samples. 3 This approach was validated in 33 subjects and highlighted significant correlations between noninvasive skin measurements and gene expression profiles across various skin attributes: aging, dryness, pigmentation, sebum production, sensitivity, acne susceptibility, and rosacea. However, efficiently identifying and analyzing relevant biomarkers from a vast array of available genetic data is challenging and often time‐ and resource‐consuming.
Therefore, this study aimed to develop a novel skin characterization analysis platform by combining MISSM with a targeted tool that utilizes quantitative real‐time PCR (qRT‐PCR) to detect specific biomarkers associated with key skin characteristics. The qRT‐PCR offers the advantage of analyzing the target gene expression in minimal RNA samples, rendering it a practical choice for the development of a robust and widely applicable tool for personalized skin care. Hence, this study aimed to bridge the gap between genetic predisposition and effective skincare solutions by focusing on MISSM coupled with qRT‐PCR analysis to refine biomarker detection techniques. This presents a novel method for potential application in skincare practices to personalize treatment approaches based on individual biological markers.
2. METHODS
2.1. Study participants
This study received ethical approval from the Cutis Institutional Review Board (approval number: CTS‐IRB‐20D02). A total of 299 participants were enrolled in the study, conducted between December 2022 and August 2023. Participants were selected based on specific inclusion and exclusion criteria, and written informed consent was obtained from each individual. All experiments involving human subjects were conducted in accordance with the principles outlined in the Declaration of Helsinki. The demographic details, including the average age and sex of the participants, are presented in Table 1. Following facial cleansing, participants were acclimated for 30 min in an examination room maintained at 22 ± 2°C with a relative humidity of 40%−60% prior to further procedures.
TABLE 1.
Age and sex demographics of the study participants.
| Total | Males | Females | |
|---|---|---|---|
| Sample size (N) | 299 (100%) | 119 (39.8%) | 180 (60.2%) |
| Age in years, mean ± SD | 44.1 ± 13.1 | 43.7 ± 13.4 | 44.4 ± 12.9 |
| Age‐group, N (%) | |||
| 20′s | 57 (19.1%) | 22 (18.5%) | 35 (19.4%) |
| 30′s | 58 (19.4%) | 26 (21.8%) | 32 (17.8%) |
| 40′s | 69 (23.1%) | 29 (24.4%) | 40 (22.2%) |
| 50′s | 65 (21.7%) | 21 (17.6%) | 44 (24.4%) |
| 60′s | 50 (16.7%) | 21 (17.6%) | 29 (16.1%) |
Note: The sample size compositions by sex are row‐wise, while the age‐group compositions in total and by sex are column‐wise.
2.2. Noninvasive devices
Six different noninvasive devices were used in this study to assess the skin type. Skin wrinkles were quantified using the PRIMOS‐CR (Canfield Scientific), a high‐resolution 3D imaging tool, which measured the average roughness parameter (Ra). Measurements were taken on both sides of the crow's feet, and the average value was used. The Cutometer MPA 580 (Courage and Khazaka Electronic GmbH, Cologne, Germany, which operates based on the suction method, was used to measure skin elasticity. The parameter R 2, reflecting gross skin elasticity by calculating resistance to mechanical force versus recovery ability, was selected. Measurements were conducted on both cheeks, and the average value was used.
The Corneometer CM 825 (Courage and Khazaka Electronic GmbH) assessed skin surface hydration at a depth of 10−20 µm within the stratum corneum. TEWL was evaluated using the Tewameter TM 300 (Courage and Khazaka Electronic GmbH), providing an indication of skin barrier function, with higher TEWL values signifying barrier impairment.
The Spectrophotometer CM‐700d (Konica Minolta, Tokyo, Japan) determined skin color by measuring light intensity reflected from the skin. Results were expressed as CIE L*, a*, and b* values. The individual typology angle (ITA°) was calculated using the formula ITA° = (ATAN [L* ‐50]/b*) × 180/3.14159. Higher ITA° values denote lighter skin. Measurements were taken on both upper cheeks, and the average value was used.
The Sebumeter SM 815 (Courage and Khazaka Electronic GmbH) evaluated sebum levels on the skin surface through photometry. In this method, an opaque tape was applied to the measurement site, and its transparency increased with sebum content. The tape's transparency was then measured to determine sebum levels. Measurements were taken on both sides of the nostrils, and the average value was used.
2.3. Lactic acid stinging test
A lactic acid stinging test (LAST) was conducted following a previously described protocol with slight modifications. 4 A cotton swab soaked in a 10% lactic acid solution was applied to the left nasolabial fold, while a cotton swab soaked in a saline solution was applied to the right nasolabial fold. Participants rated the intensity of sensations, including stinging, itching, or burning, using a 4‐point scale (0 = none, 1 = slight, 2 = moderate, and 3 = severe) at intervals of 0‐, 2.5‐, 5‐, and 8‐min postapplication. The stinging score was calculated using the formula: Score = (sum of lactic acid score—sum of saline solution score)/12.
2.4. Skin sampling with microneedle patches
Skin samples from participants were acquired using biocompatible microneedle patches (Raphas, Seoul, Republic of Korea). Two microneedle patches were applied to the cheekbone and nasolabial fold, respectively. The collected skin samples were stored individually at room temperature in 1.5 mL tubes containing RLT buffer until further use. Additionally, no adverse effects were observed from the application of the patches.
2.5. Total RNA extraction and qRT‐PCR
Using microneedle patches soaked in RLT buffer from the RNeasy mini kit (QIAGEN, Hilden, Germany), the subsequent steps of the procedure were performed according to the manufacturer's instructions, and cDNA was prepared using a Veriti thermal cycler (Applied Biosystems, Foster City, CA, USA). The qRT‐PCR was performed at least twice for each sample using 5 µL of cDNA, supplemented with the appropriate primers (Xenohelix, Incheon, Republic of Korea), and a LineGene qPCR system (BIOER, China).
Since the cycle threshold value (CT value) varied depending on the amount of cDNA used in the reaction, it was normalized using the CT value of actin, a housekeeping gene. The ΔCT value, obtained by subtracting the CT value of actin from the CT value of the target gene (skin aging‐related genes: PTEN‐induced kinase 1 [PINK1], collagen type 1 alpha 1 [COL1A1], moesin [MSN], and hyaluronan synthase 2 [HAS2]; skin dryness‐related genes: aquaporin 3 [AQP3], filaggrin [FLG], serine peptidase inhibitor Kazal type 5 [SPINK5], and Krüppel‐like factor [KLF4]; skin pigmentation‐related genes: melan‐A [MLANA], transcription factor AP‐2 alpha [TFAP2A], superoxide dismutase 1 [SOD1], and vitamin D receptor [VDR]; skin oiliness‐related genes: insulin like growth factor 1 [IGF1], myelin protein zero like 3 [MPZL3], cluster of differentiation [CD44], and glycerol‐3‐phosphate acyltransferase 1 [GPAM]; skin sensitivity‐related genes: cysteine‐rich angiogenic inducer 61 [CYR61], prostaglandin‐endoperoxide synthase 2 [PTGS2], phorbol‐12‐myristate‐13‐acetate‐induced protein 1 [PMAIP1], and high mobility group box 2 [HMGB2]), was used for the analysis. RNA extracted from the cheekbone was used to analyze aging‐, dryness‐, and pigmentation‐related genes, while RNA from the nasolabial fold was used to analyze oiliness‐ and sensitivity‐related genes. A decrease in the ΔCT value indicated a corresponding increase in the target gene expression.
2.6. Statistical analysis
Pearson's correlation coefficient was used to determine whether the continuous biomarkers and noninvasive skin measurements data were statistically correlated. To compare the mean values of continuous biomarkers and noninvasive skin measurements, one‐way analysis of variance (ANOVA) was used, and the p‐value calculations were adjusted by using the Bonferroni correction in the case of multiple comparisons.
The total dataset of 299 participants was split into training (70%, N = 209) and test (30%, N = 90) sets to identify relevant biomarkers in the training set and validate them in the test set. Linear regression analysis of each of the seven noninvasive skin measurements (two for skin aging, two for dryness, and one each for pigmentation, oiliness, and sensitivity) upon each of its four candidate biomarkers was performed in the training set to compare the proportion of variation explained (or R‐squared), as well as the statistical significance (or p‐value) of the beta coefficient, among the candidate biomarkers.
A coefficient of variation (CV)‐type root mean squared error (RMSE) was calculated in the test set, using the estimated beta coefficient in the training set, to quantify the difference between the actual skin device measurement and the predicted measurement from each biomarker's estimated beta coefficient. Here, the RMSE was divided by the mean value of its corresponding skin measurement to obtain a unitless CV‐type quantity, which allowed the comparison of prediction error across different skin devices, for example, if the CV‐type RMSE of the biomarker that best explained the Cutometer device on skin aging was smaller than that of the biomarker best explaining the LAST value on skin sensitivity, then skin aging was better explained or predicted than skin sensitivity from the candidate pool of biomarkers.
The final selection of a single biomarker that relatively best explained each of the seven noninvasive device measurements of five skin characteristics was based on the following criteria: (1) the biomarker with the lowest CV‐type RMSE was given the highest priority and (2) in cases where the biomarker with the lowest CV‐type RMSE did not have a satisfactory R 2 value in the linear regression analysis, the biomarker with a p‐value less than 0.05, or the lowest p‐value for testing its Pearson correlation with the noninvasive device measurement being different from zero, was selected as the relative best.
Statistical significance was set at p < 0.05, and all tests were two‐sided. The analyses were conducted using IBM SPSS Statistics 25.0 (Armonk, NY, USA) and R version 4.3.2 (The R Foundation for Statistical Computing, Vienna, Austria).
3. RESULTS
3.1. Establishing average values for skin characteristics by age‐group and sex in Korean participants
A total of 299 participants, including 119 males and 180 females, with an average age of 44.1 ± 13.1 years, were enrolled in this study. All participants voluntarily provided informed consent, and their age and sex compositions are summarized in Table 1. Using noninvasive skin assessment devices (PRIMOS, Cutometer, Corneometer, Tewameter, spectrophotometer, Sebumeter, and LAST), average values for noninvasive skin assessment were established across different skin characteristics by age‐group and sex (Tables 2, 3, 4, 5, 6).
TABLE 2.
Average values of noninvasive measurements and biomarkers of skin aging according to sex and age‐group of Koreans.
| Sex | Age | Cutometer (E/mm, R 2) | PRIMOS (roughness, µm) | PINK1 | COL1A1 | MSN | HAS2 |
|---|---|---|---|---|---|---|---|
| Male | 20′ | 19.314 ± 1.660 | 0.671 ± 0.074 | −0.153 ± 2.577 | 12.758 ± 2.190 | 3.497 ± 2.935 | 11.037 ± 4.224 |
| 30′ | 21.670 ± 4.011 | 0.586 ± 0.065 | 4.590 ± 6.142 | 13.741 ± 2.479 | 6.765 ± 4.861 | 5.140 ± 8.860 | |
| 40′ | 26.675 ± 5.268 | 0.530 ± 0.071 | 4.290 ± 4.620 | 12.520 ± 7.371 | 5.931 ± 5.095 | 11.821 ± 7.156 | |
| 50′ | 30.045 ± 6.080 | 0.525 ± 0.064 | 2.857 ± 5.379 | 12.245 ± 4.021 | 5.281 ± 2.769 | 10.406 ± 7.206 | |
| 60′ | 35.326 ± 9.813 | 0.456 ± 0.073 | 2.306 ± 3.634 | 11.755 ± 2.965 | 6.796 ± 4.947 | 7.214 ± 8.452 | |
| Female | 20′ | 16.336 ± 2.294 | 0.679 ± 0.050 | 2.383 ± 3.686 | 10.227 ± 6.666 | 3.598 ± 3.573 | 9.097 ± 8.505 |
| 30′ | 18.691 ± 2.113 | 0.641 ± 0.058 | 2.935 ± 3.863 | 10.786 ± 8.276 | 5.128 ± 4.485 | 10.709 ± 5.780 | |
| 40′ | 20.106 ± 2.861 | 0.571 ± 0.071 | 3.776 ± 4.290 | 11.265 ± 4.782 | 7.094 ± 4.264 | 4.828 ± 11.465 | |
| 50′ | 23.332 ± 5.520 | 0.579 ± 0.055 | 4.185 ± 4.040 | 12.668 ± 4.313 | 7.287 ± 4.893 | 13.906 ± 5.051 | |
| 60′ | 32.235 ± 7.227 | 0.582 ± 7.227 | 6.528 ± 6.204 | 15.066 ± 3.321 | 7.481 ± 5.463 | 15.505 ± 4.245 |
Abbreviations: COL1A1, collagen type 1 alpha 1; HAS2, hyaluronan synthase 2; MSN, moesin; PINK1, PTEN‐induced kinase 1.
TABLE 3.
Average values of noninvasive measurements and biomarkers of dry skin according to sex and age‐group of Koreans.
| Sex | Age | Corneometer (A.U.) | Tewameter (g/m2/h) | AQP3 | FLG | SPINK5 | KLF4 |
|---|---|---|---|---|---|---|---|
| Male | 20′ | 58.280 ± 13.163 | 22.092 ± 6.251 | 2.222 ± 4.829 | −2.689 ± 5.328 | −0.275 ± 4.506 | 6.106 ± 2.647 |
| 30′ | 59.065 ± 11.957 | 18.325 ± 3.588 | 4.738 ± 5.630 | −1.315 ± 7.720 | 1.258 ± 5.201 | 7.810 ± 6.603 | |
| 40′ | 58.294 ± 12.103 | 25.220 ± 10.054 | 4.935 ± 4.591 | 0.390 ± 5.030 | 2.152 ± 5.969 | 9.426 ± 3.502 | |
| 50′ | 58.862 ± 10.980 | 18.505 ± 5.922 | 2.968 ± 3.045 | −4.975 ± 3.243 | −0.440 ± 2.336 | 5.833 ± 3.753 | |
| 60′ | 68.588 ± 10.073 | 16.757 ± 4.983 | 4.928 ± 4.652 | −5.309 ± 3.219 | 0.240 ± 3.891 | 9.281 ± 6.530 | |
| Female | 20′ | 68.794 ± 13.390 | 17.856 ± 4.712 | 5.110 ± 5.189 | −0.967 ± 7.272 | 0.362 ± 6.340 | 7.635 ± 4.613 |
| 30′ | 68.768 ± 10.631 | 18.366 ± 5.343 | 4.374 ± 3.538 | −1.197 ± 5.159 | 1.707 ± 5.529 | 6.070 ± 3.216 | |
| 40′ | 69.644 ± 10.448 | 15.636 ± 4.612 | 3.100 ± 3.387 | −1.888 ± 4.155 | −0.319 ± 3.685 | 6.429 ± 3.887 | |
| 50′ | 70.383 ± 12.148 | 14.391 ± 5.851 | 4.712 ± 4.949 | −1.848 ± 4.244 | 0.623 ± 4.353 | 6.072 ± 6.337 | |
| 60′ | 72.663 ± 12.379 | 12.651 ± 12.379 | 2.756 ± 3.609 | 0.183 ± 4.192 | 3.251 ± 4.493 | 7.158 ± 2.756 |
Abbreviations: AQP3, aquaporin 3; FLG, filaggrin; KLF4, Krüppel‐like factor; SPINK5, serine peptidase inhibitor Kazal type 5.
TABLE 4.
Average values of noninvasive measurements and biomarkers of pigment skin according to sex and age‐group of Koreans.
| Sex | Age | Spectrophotometer (ITA°) | MLANA | TFAP2A | SOD1 | VDR |
|---|---|---|---|---|---|---|
| Male | 20′ | 36.858 ± 5.084 | 6.111 ± 6.151 | 7.607 ± 3.650 | −2.425 ± 3.326 | 2.977 ± 3.504 |
| 30′ | 36.975 ± 5.879 | 2.217 ± 4.756 | 8.802 ± 6.128 | −3.521 ± 3.447 | 4.278 ± 4.716 | |
| 40′ | 29.425 ± 9.647 | 2.475 ± 3.966 | 9.893 ± 5.352 | −1.881 ± 3.635 | 3.495 ± 2.070 | |
| 50′ | 27.192 ± 8.406 | 2.194 ± 3.341 | 9.675 ± 3.546 | −3.538 ± 2.686 | 5.767 ± 3.219 | |
| 60′ | 22.922 ± 7.889 | −0.364 ± 4.910 | 8.119 ± 3.945 | −3.771 ± 2.230 | 5.237 ± 6.604 | |
| Female | 20′ | 47.162 ± 6.370 | 5.305 ± 5.600 | 7.111 ± 3.907 | −1.750 ± 3.559 | 2.325 ± 6.790 |
| 30′ | 41.938 ± 5.120 | 1.842 ± 3.454 | 7.616 ± 2.990 | −2.581 ± 3.003 | 3.152 ± 1.846 | |
| 40′ | 37.952 ± 5.740 | 0.565 ± 3.048 | 8.690 ± 6.588 | −2.198 ± 3.750 | 3.445 ± 5.661 | |
| 50′ | 36.978 ± 4.890 | 1.228 ± 3.300 | 7.095 ± 6.757 | −2.268 ± 4.029 | 3.661 ± 4.883 | |
| 60′ | 36.361 ± 3.527 | 0.931 ± 1.737 | 8.486 ± 3.428 | −2.813 ± 2.091 | 3.156 ± 1.827 |
Abbreviations: MLANA, melan‐A; SOD1, superoxide dismutase 1; TFAP2A, transcription factor AP‐2 alpha; VDR, vitamin D receptor.
TABLE 5.
Average values of noninvasive measurements and biomarkers of oily skin according to sex and age‐group of Koreans.
| Sex | Age | Sebumeter (µg/cm2) | IGF1 | MPZL3 | CD44 | GPAM |
|---|---|---|---|---|---|---|
| Male | 20′ | 140.389 ± 68.300 | 7.065 ± 7.693 | 9.585 ± 2.269 | 0.766 ± 2.192 | 5.841 ± 3.840 |
| 30′ | 117.650 ± 65.128 | 11.240 ± 5.382 | 10.315 ± 1.739 | 3.399 ± 5.144 | 6.546 ± 3.714 | |
| 40′ | 138.864 ± 69.334 | 11.093 ± 4.497 | 9.651 ± 2.266 | 2.316 ± 3.630 | 6.365 ± 3.010 | |
| 50′ | 101.412 ± 62.367 | 11.962 ± 3.657 | 7.745 ± 2.778 | 0.606 ± 5.000 | 4.351 ± 4.064 | |
| 60′ | 87.500 ± 53.280 | 8.626 ± 8.802 | 6.345 ± 8.005 | 1.389 ± 5.398 | 4.198 ± 3.903 | |
| Female | 20′ | 124.567 ± 65.817 | 13.125 ± 4.144 | 8.511 ± 2.965 | 2.476 ± 4.727 | 6.662 ± 5.074 |
| 30′ | 112.667 ± 77.106 | 12.483 ± 3.940 | 8.073 ± 2.357 | 1.409 ± 4.046 | 5.147 ± 4.309 | |
| 40′ | 90.162 ± 62.998 | 10.304 ± 5.120 | 8.205 ± 5.086 | 3.418 ± 6.138 | 5.049 ± 3.282 | |
| 50′ | 60.000 ± 52.161 | 9.515 ± 4.591 | 8.461 ± 2.697 | 1.568 ± 6.853 | 4.142 ± 4.111 | |
| 60′ | 57.750 ± 41.559 | 11.782 ± 7.890 | 7.131 ± 3.531 | 5.180 ± 6.968 | 6.890 ± 3.937 |
Abbreviations: CD44, cluster of differentiation; GPAM, glycerol‐3‐phosphate acyltransferase 1; IGF1, insulin like growth factor 1; MPZL3, myelin protein zero like 3.
TABLE 6.
Average values of lactic acid sting test and biomarkers of sensitive skin according to sex and age‐group of Koreans.
| Sex | Age | Lactic acid sting test (score) | CYR61 | PMAIP1 | PTGS2 | HMGB2 |
|---|---|---|---|---|---|---|
| Male | 20′ | 0.041 ± 0.164 | 1.506 ± 1.607 | 9.701 ± 8.218 | 2.400 ± 3.157 | 7.418 ± 5.380 |
| 30′ | 0.014 ± 0.070 | 3.457 ± 4.656 | 9.212 ± 5.460 | 3.362 ± 8.522 | 8.129 ± 6.478 | |
| 40′ | 0.076 ± 0.177 | 4.403 ± 5.143 | 11.813 ± 4.913 | 2.482 ± 4.703 | 8.076 ± 6.834 | |
| 50′ | 0.015 ± 0.087 | 1.921 ± 4.118 | 8.544 ± 8.226 | 1.397 ± 6.722 | 5.784 ± 5.619 | |
| 60′ | 0.010 ± 0.038 | 1.209 ± 2.646 | 11.527 ± 5.180 | 0.899 ± 4.214 | 7.615 ± 5.555 | |
| Female | 20′ | 0.024 ± 0.015 | 4.541 ± 5.258 | 11.303 ± 4.781 | 3.004 ± 6.263 | 6.880 ± 5.597 |
| 30′ | 0.092 ± 0.240 | 4.061 ± 5.142 | 11.771 ± 2.867 | −0.466 ± 3.440 | 6.266 ± 3.602 | |
| 40′ | 0.067 ± 0.130 | 5.034 ± 5.021 | 10.146 ± 5.509 | 2.590 ± 6.801 | 6.336 ± 4.602 | |
| 50′ | 0.113 ± 0.209 | 4.604 ± 4.259 | 12.163 ± 3.716 | 0.791 ± 4.326 | 5.783 ± 4.952 | |
| 60′ | 0.127 ± 0.283 | 4.433 ± 5.168 | 11.064 ± 3.150 | −0.156 ± 4.090 | 4.631 ± 5.554 |
Abbreviations: CYR, cysteine‐rich angiogenic inducer 61; HMGB2, high mobility group box 2; PMAIP1, phorbol‐12‐myristate‐13‐acetate‐induced protein 1; PTGS2, prostaglandin‐endoperoxide synthase 2.
Furthermore, RNA extracted from skin samples using MISSM facilitated the selection of target biomarkers based on prior research. 3 , 5 A primer‐probe reaction test using qRT‐PCR kits was used to select biomarkers associated with specific skin attributes, including aging (PINK1, COL1A1, MSN, and HAS2), dryness (AQP3, FLG, SPINK5, and KLF4), pigmentation (MLANA, TFAP2A, SOD1, and VDR), oiliness (IGF1, MPZL3, CD44, and GPAM), and sensitivity (CYR61, PMAIP1, PTGS2, HMGB2). The resulting ΔCT values quantified gene expression levels for these biomarkers, establishing average values across age‐group and sex for the five skin characteristics (Tables 2, 3, 4, 5, 6).
Skin aging, which is closely associated with biological age, was extensively analyzed. We evaluated periorbital wrinkles and skin elasticity using noninvasive measurements (PRIMOS, and Cutometer) and analyzed biomarkers related to skin aging stratified by sex and age group. Analysis of noninvasive skin measurement data revealed significant differences in the Ra parameter, which represents the periorbital wrinkle depth. For females, significant differences were observed across all age groups, except between the 20s and 30s and 30s and 40s age groups. For males, significant differences were found in all age groups except between the 20s and 30s and the 40s and 50s age groups (p < 0.05). This indicates a progressive increase in wrinkle severity with age, reflecting common dermal changes associated with aging. For the R 2 parameter, which indicates skin elasticity, significant differences were observed in females across all age groups, except between the 40s and 50s, the 40s and 60s, and the 50s and 60s age groups. In males, significant differences were noted across all age groups, except between those in their 40s and 50s (p < 0.05) (Figure S1, Table S1). This trend signifies a consistent decline in skin elasticity with age, underscoring the cumulative impact of aging on skin structural integrity.
Subsequently, we analyzed the ΔCT values of skin aging biomarkers. PINK1 showed significant differences among females between the 20s and 60s and the 30s and 60s age groups and among males between the 20s and 30s and the 20s and 40s age groups (p < 0.05). This suggests an age‐related decline in mitochondrial efficiency, which is critical for maintaining cellular energy levels and reducing oxidative stress. COL1A1 exhibited significant differences between the 20s and 60s and the 30s and 60s female age groups (p < 0.05). This highlights the progressive loss of collagen with age, which leads to reduced skin firmness and increased wrinkle formation. Interestingly, no significant age‐related differences in COL1A1 expression were observed in males. MSN demonstrated significant differences between the 20s and 40s, the 20s and 50s, and the 20s and 60s female age groups, and between the 20s and 30s and the 20s and 60s male age groups (p < 0.05). These findings suggested an age‐dependent decline in cytoskeletal integrity, which is crucial for maintaining cell shape and function. Finally, HAS2 showed significant differences between the 40s and 60s female age groups, and between the 20s and 60s, the 30s and 60s, the 40s and 50s, and the 40s and 60s male age groups (p < 0.05). This indicates that age‐related decline in hyaluronic acid synthesis may affect skin hydration and elasticity in a sex‐specific manner, possibly owing to differences in hormonal regulation and skin physiology (Figure S2, Table S2).
3.2. Selection of biomarkers that represent specific noninvasive skin measurements relatively well
As described in the “Statistical analysis” subsection within the “Methods” section, we identified biomarkers that represent specific skin characteristics, which were first measured by noninvasive devices. Among the four candidate biomarkers for each of the five skin characteristics, the selection of a single biomarker that relatively best explained the seven noninvasive measurements was as below:
Among skin aging biomarkers, COL1A1 was identified as the most representative marker for periorbital wrinkle depth measured using the PRIMOS device, with a correlation p‐value of 0.019 and a CV‐type RMSE of 0.283. For skin elasticity measured using the Cutometer, MSN was identified as the most effective aging biomarker, with a correlation p‐value of 0.011 and a CV‐type RMSE of 0.122. Thus, COL1A1 and MSN were selected as the final aging biomarkers that best explained the noninvasive measurements of skin aging (Table 7, and Tables S3,S4).
TABLE 7.
Statistical analysis between noninvasive skin measurements and biomarkers.
| Skin characteristics | Noninvasive skin measurements | Biomarker | Correlation p‐value | CV‐type RMSE |
|---|---|---|---|---|
| Aging | PRIMOS | COL1A1 | 0.019 | 0.283 |
| Cutometer | MSN | 0.011 | 0.122 | |
| Dryness | Corneometer | SPINK5 | 0.218 | 0.238 |
| Tewameter | KLF4 | 0.007 | 0.363 | |
| Pigmentation | Spectrophotometer | MLANA | 0.009 | 0.249 |
| Oiliness | Sebumeter | MPZL3 | 0.071 | 0.669 |
| Sensitivity | LAST | HMGB2 | 0.065 | 2.475 |
Abbreviations: COL1A1, collagen type 1 alpha 1; CV‐type, coefficient of variation type; HMGB2, high mobility group box 2; KLF4, Krüppel‐like factor 4; LAST, lactic acid stinging test; MLANA, melan‐A; MPZL3, myelin protein zero like 3; MSN, moesin; RMSE, root mean squared error; SPINK5, serine peptidase inhibitor Kazal type 5.
Among skin dryness biomarkers, SPINK5 was identified as the most representative marker for the hydration level measured using the Corneometer, with a CV‐type RMSE of 0.238. For TEWL measured using the Tewameter, KLF4 was selected as the most effective dryness biomarker, with a correlation p‐value of 0.007 and CV‐type RMSE of 0.363. Consequently, SPINK5 and KLF4 were chosen as the final dryness biomarkers that best represented noninvasive measurements of skin dryness (Table 7, and Tables S5,S6).
Among the skin pigmentation biomarkers, MLANA was identified as the most representative marker for skin tone measured by the spectrophotometer, with a correlation p‐value of 0.009 and a CV‐type RMSE of 0.2491 (Table 7 and Table S7). Among the skin sensitivity biomarkers, HMGB2 was identified as the most effective marker for skin reactivity, as measured by the LAST, with a CV‐type RMSE of 2.475 (Table 7 and Table S9). Therefore, MLANA and HMGB2 were selected as the final pigmentation and sensitivity biomarkers, respectively, which best explained the noninvasive measurements of skin pigmentation and sensitivity. For skin oiliness biomarkers, MPZL3 was identified as the most effective marker for sebum levels measured using the Sebumeter, with the lowest correlation p‐value. (Table 7 and Table S8).
3.3. Statistical significance of biomarkers for skin characteristics based on noninvasive skin measurements
To validate the significance of the biomarkers, the participants were categorized into extreme groups based on their noninvasive skin measurement values for specific skin characteristics. The top categories were tight, moist, fair, neutral, and resistant, whereas the bottom categories were aging, dry, pigmented, oily, and sensitive. Each group comprised at least 20 participants. The qRT‐PCR analysis of biomarker ΔCT values was observed based on groups classified according to noninvasive skin measurement values.
First, the significance of skin aging biomarkers based on the PRIMOS was analyzed. The COL1A1 ΔCT value decreased significantly from an average of 14.058 ± 3.678 in the high PRIMOS aging group to 10.280 ± 6.438 in the low PRIMOS tight group, indicating increased COL1A1 expression in the tight group (p < 0.05) (Figure 1B). The PINK1 ΔCT value decreased from an average of 4.232 ± 4.635 in the aging group to 2.615 ± 3.829 in the tight group (Figure 1A). The MSN ΔCT value decreased from an average of 6.618 ± 5.238 in the aging group to 5.719 ± 4.454 in the tight group, and the HAS2 ΔCT value also decreased from an average of 11.586 ± 6.705 in the aging group to 8.983 ± 6.919 in the tight group, although statistical significance was not observed (Figure 1C,D). Next, the significance of skin aging biomarkers based on the Cutometer was analyzed. The MSN ΔCT value decreased significantly from an average of 7.082 ± 4.388 in the low Cutometer aging group to 4.577 ± 4.404 in the high Cutometer tight group, indicating an increase in MSN expression in the tight group (p < 0.05) (Figure 2C). The PINK1 ΔCT value decreased from an average of 3.745 ± 4.801 in the aging group to 2.660 ± 4.357 in the tight group (Figure 2A), the COL1A1 ΔCT value decreased from an average of 12.673 ± 5.150 in the aging group to 10.922 ± 5.453 in the tight group (Figure 2B), and the HAS2 ΔCT value decreased from an average of 10.426 ± 8.944 in the aging group to 8.573 ± 9.127 in the tight group (Figure 2D). Similar to the PRIMOS results, COL1A1, MSN, and HAS2 showed an increased expression in the tight group; however, the difference was not statistically significant.
FIGURE 1.
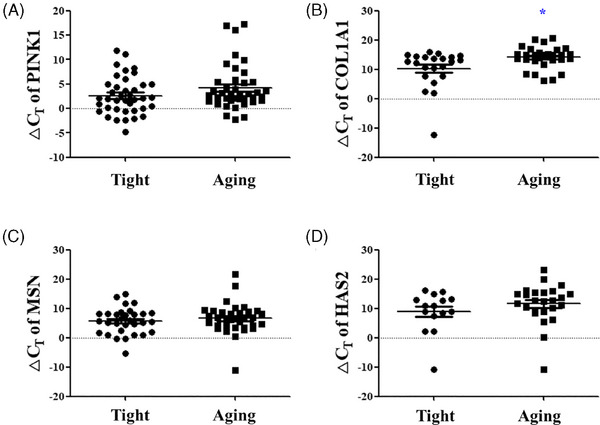
Significance analysis of skin aging biomarkers according to PRIMOS measurement values. The ΔCT values of (A) PINK1, (B) COL1A1, (C) MSN, and (D) HAS2 between the low PRIMOS tight group and the high PRIMOS aging group. Results are displayed as mean ± standard error of the mean of experiments. *p < 0.05. PINK, PTEN‐induced kinase 1; COL1A1, collagen type 1 alpha 1 chain; MSN, moesin; HAS2, hyaluronan synthase 2; ΔCT, delta cycle threshold.
FIGURE 2.
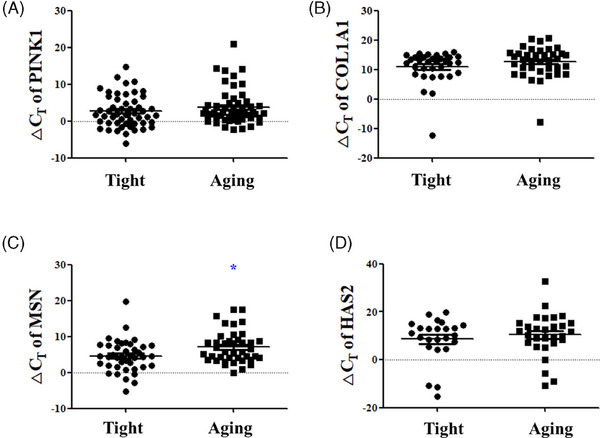
Significance analysis of skin aging biomarkers according to Cutometer measurement values. The ΔCT values of (A) PINK1, (B) COL1A1, (C) MSN, and (D) HAS2 between the low Cutometer tight group and the high Cutometer aging group. Results are displayed as mean ± standard error of the mean of experiments. *p < 0.05. PINK, PTEN‐induced kinase 1; COL1A1, collagen type 1 alpha 1 chain; MSN, moesin; HAS2, hyaluronan synthase 2; ΔCT, delta cycle threshold.
The significance of skin dryness biomarkers based on the Corneometer was analyzed. The AQP3 ΔCT value slightly decreased from an average of 3.955 ± 3.728 in the dry group to 3.814 ± 4.481 in the moist group (Figure 3A), and the KLF4 ΔCT value decreased from an average of 6.610 ± 5.135 in the dry group to 6.502 ± 4.453 in the moist group (Figure 3D). The FLG ΔCT value increased from an average of ‐1.919 ± 4.800 in the dry group to ‐1.501 ± 4.125 in the moist group, and the SPINK5 ΔCT value increased from an average of 0.538 ± 2.968 in the dry group to 1.167 ± 4.474 in the moist group, although no statistical significance was observed (Figure 3B,C). For skin dryness biomarkers based on the Tewameter, the KLF4 ΔCT value significantly decreased from an average of 8.733 ± 4.728 in the high Tewameter dry group to 5.806 ± 5.446 in the low Tewameter moist group, indicating increased KLF4 expression in the moist group (p < 0.05) (Figure 4D). The AQP3 ΔCT value decreased from an average of 5.296 ± 4.871 in the dry group to 3.836 ± 4.918 in the moist group, the FLG ΔCT value decreased from an average of ‐0.222 ± 6.460 in the dry group to ‐2.083 ± 4.350 in the moist group, and the SPINK5 ΔCT value also decreased from an average of 1.262 ± 6.137 in the dry group to 0.629 ± 3.888 in the moist group, without statistical significance (Figure 4A–C).
FIGURE 3.
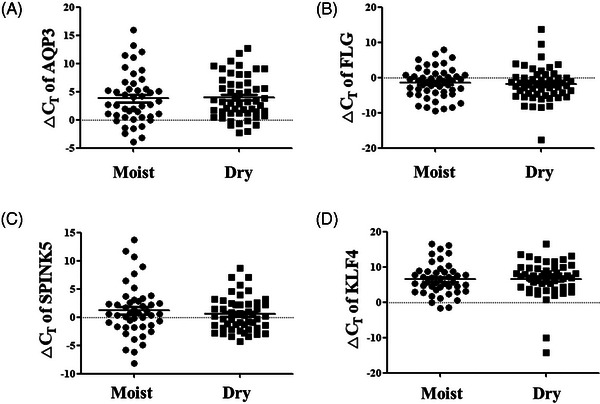
Significance analysis of skin dryness biomarkers according to Corneometer measurement values. The ΔCT values of (A) AQP3, (B) FLG, (C) SPINK5, and (D) KLF4 between the low Corneometer dry group and the high Corneometer moist group. Results are displayed as mean ± standard error of the mean of experiments. AQP3, aquaporin 3; FLG, filaggrin; KLF4, Kruppel‐like factor 4; SPINK5, serine peptidase inhibitor Kazal type 5; ΔCT, delta cycle threshold.
FIGURE 4.

Significance analysis of skin dryness biomarkers according to Tewameter measurement values. The ΔCT values of (A) AQP3, (B) FLG, (C) SPINK5, and (D) KLF4 between high Tewameter dry group and low Tewameter moist group. Results are displayed as mean ± standard error of the mean of experiments. *p < 0.05. AQP3, aquaporin 3; FLG, filaggrin; KLF4, Kruppel‐like factor 4; SPINK5, serine peptidase inhibitor Kazal type 5; ΔCT, delta cycle threshold.
The significance of skin pigmentation biomarkers was analyzed using a spectrophotometer. The MLANA ΔCT value increased significantly from an average of 1.105 ± 3.565 in the pigment group to 4.357 ± 5.204 in the fair group, indicating increased MLANA expression in the pigment group (p < 0.05) (Figure 5A). In addition, the VDR ΔCT value decreased significantly from an average of 5.647 ± 4.771 in the low spectrophotometer pigment group to 2.214 ± 7.229 in the high spectrophotometer fair group, indicating increased VDR expression in the fair group (p < 0.05) (Figure 5D). The TFAP2A ΔCT value decreased from an average of 9.060 ± 3.511 in the pigment group to 8.717 ± 5.873 in the fair group, whereas the SOD1 ΔCT value increased from an average of ‐3.011 ± 3.357 in the pigment group to ‐2.592 ± 3.450 in the fair group (Figure 5A) with no statistically significant differences (Figure 5B,C).
FIGURE 5.
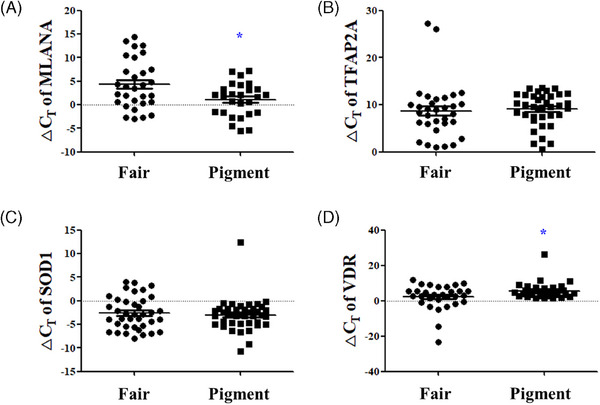
Significance analysis of skin pigmentation biomarkers according to Spectrophotometer measurement values. The ΔCT values of (A) MLANA, (B) TFAP2A, (C) SOD1, and (D) VDR between low Spectrophotometer pigment group and high Spectrophotometer fair group. Results are displayed as mean ± standard error of the mean of experiments. *p < 0.05. MLANA, melan‐A; TFAP2A, transcription factor AP‐2 alpha; SOD1, superoxide dismutase 1; VDR, vitamin D receptor; ΔCT, delta cycle threshold.
The significance of skin oily biomarkers based on the Sebumeter was analyzed. The MPZL3 ΔCT value significantly decreased from an average of 9.147 ± 2.451 in the high Sebumeter oily group to 7.983 ± 2.336 in the low Sebumeter neutral group, indicating increased MPZL3 expression in the neutral group (p < 0.05) (Figure 6B). The IGF1 ΔCT value increased from an average of 10.920 ± 6.418 in the oily group to 11.456 ± 5.729 in the neutral group (Figure 6A), and the CD44 ΔCT value increased from an average of 1.111 ± 2.981 in the oily group to 1.508 ± 4.978 in the neutral group, whereas the GPAM ΔCT value decreased from an average of 6.109 ± 3.761 in the oily group to 5.305 ± 3.593 in the neutral group, without statistical significance (Figure 6C,D).
FIGURE 6.
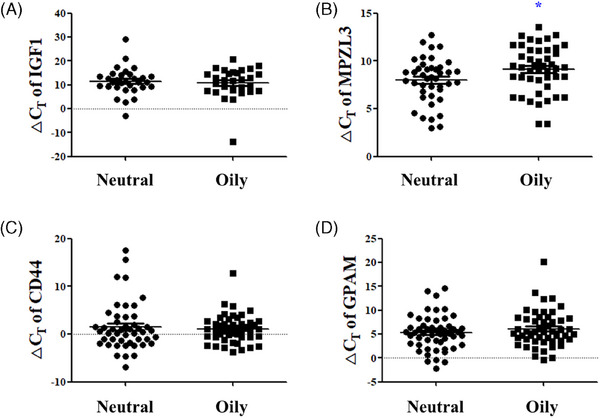
Significance analysis of oily skin biomarkers according to Sebumeter measurement values. The ΔCT values of (A) IGF1, (B) MPZL3, (C) CD44, and (D) GPAM between high Sebumeter oily group and low sebumeter neutral group. Results are displayed as mean ± standard error of the mean of experiments. *p < 0.05. IGF1, insulin‐like growth factor 1; MPZL3, myelin protein zero‐like 3; CD44, CD44 antigen; GPAM, glycerol‐3‐phosphate acyltransferase 1, mitochondrial; ΔCT, delta cycle threshold.
Finally, the significance of sensitive skin biomarkers based on the LAST scores was analyzed. The HMGB2 ΔCT value significantly increased from an average of 4.303 ± 3.063 in the high LAST sensitive group to 6.806 ± 5.612 in the low LAST resistant group, indicating decreased HMGB2 expression in the resistant group (p < 0.05) (Figure 7D). The PMAIP1 ΔCT value also increased from an average of ‐0.694 ± 3.663 in the sensitive group to 1.949 ± 5.620 in the resistant group indicating decreased PMAIP1 expression in the resistant group (p < 0.05) (Figure 7C). The CYR61 ΔCT value slightly increased from an average of 3.494 ± 3.787 in the sensitive group to 3.822 ± 4.937 in the resistant group. The PTGS2 ΔCT value decreased from an average of 12.530 ± 2.395 in the sensitive group to 10.460 ± 5.641 in the resistant group, without statistical significance (Figure 7A,B).
FIGURE 7.
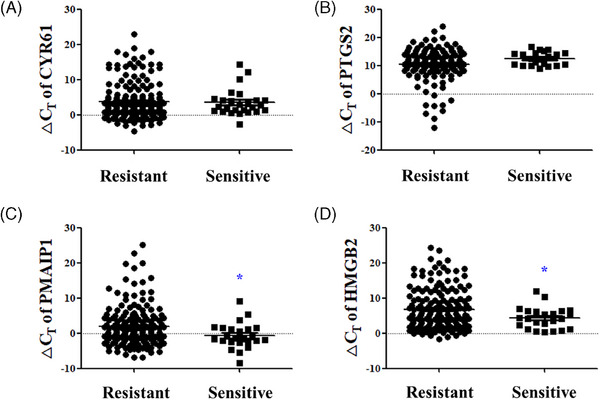
Significance analysis of sensitive skin biomarkers according to LAST scores. The ΔCT values of (A) CYR61, (B) PTGS2, (C) PMAIP1, and (D) HMGB2 between the high LAST sensitive group and low LAST resistant group. Results are displayed as mean ± standard error of the mean of experiments. *p < 0.05. CYR61, cysteine‐rich angiogenic inducer 61; PTGS2, prostaglandin‐endoperoxide synthase 2; PMAIP1, phorbol‐12‐myristate‐13‐acetate‐induced protein 1; HMGB2, high‐mobility group protein B2; ΔCT, delta cycle threshold.
4. DISCUSSION
Correctly classifying one's skin type is crucial for promoting skin health. Numerous methods have been devised to accurately determine skin type, including traditional classification systems, such as the Fitzpatrick skin phototype and Baumann skin types, 1 , 2 as well as skin measurement methods using images or device measurements. 6 , 7 , 8 In our previous study, we identified biomarker candidates that correlated with device measurements for various skin characteristics, such as aging, dryness, pigmentation, oiliness, and sensitivity. 3 Building on this foundation, we used minimally invasive microneedle patches for RNA extraction and microarray analysis to develop a more efficient qRT‐PCR kit designed to detect skin‐type biomarkers for precise transcriptomic analysis.
This study confirmed that RNA extraction and microarray analysis can be performed using minimally invasive skin sampling with a microneedle patch. However, considering that microarray use is time consuming and expensive for the purpose of classifying skin types, we developed a qRT‐PCR kit that detects 20 biomarkers related to different skin properties: aging (PINK1, COL1A1, MSN, and HAS2), dryness (AQP3, FLG, SPINK5, and KLF4), pigmentation (MLANA, TFAP2A, SOD1, and VDR), oiliness (IGF1, MPZL3, CD44, and GPAM), and sensitivity (CYR61, PTGS2, PMAIP1, and HMGB2). This kit allowed for the analysis of biomarker levels in 299 Korean men and women, creating a standard dataset of noninvasive skin measurements and biomarker expression across different ages and sexes. This unique dataset provides a reliable and high‐quality resource expected to serve as a fundamental basis for future research on skin characteristics. Through statistical analysis of biomarker ΔCT values and noninvasive measurement values, seven biomarkers were selected for skin characteristic classification: COL1A1, MSN, KLF4, SPINK5, MLANA, MPZL3, and HMGB2.
Skin aging involves gradual degradation of dermal collagen fibrils, leading to thinner and less elastic skin. 9 COL1A1 is a representative biomarker for skin aging. Type 1 collagen plays a role in maintaining skin elasticity, and COL1A1 expression in aged skin is reduced compared with that in younger skin. 10 , 11 We found that COL1A1 had the highest explanatory power in correlation with PRIMOS measurements of skin wrinkles. Notably, as COL1A1 is primarily expressed in dermal fibroblasts, our findings suggest that its expression can be effectively analyzed using MISSM. MSN encodes a cytoskeletal protein called moesin, which links cell membrane proteins to actin filaments beneath the cell membrane and plays a role in signaling and regulating these proteins. 12 When moesin gene and protein expression was measured in skin undergoing endogenous aging, moesin expression decreased with increasing age. 3 , 13 Our study showed that MSN had the highest correlation with the Cutometer skin elasticity measurements, thus reinforcing MSN's usefulness as a skin aging biomarker, consistent with the existing literature.
Skin dryness is closely linked to the function of the skin barrier and is characterized by dehydration of the stratum corneum (SC), compromised barrier function, and a rough skin surface. 14 , 15 KLF4, which encodes the transcription factor Kruppel‐like factor 4, is highly expressed in differentiating epidermal layers and is essential for establishing barrier function. 16 KLF4 mRNA expression was correlated with Corneometer, Tewameter, and skin‐pH‐meter values, 3 and in this study, the biomarker best explained TEWL levels. SPINK5 regulates their activities, which is consistent with the proliferation, differentiation, and desquamation rate of epidermal keratinocytes. 17 , 18 UV radiation disrupts the epidermal barrier and induces desquamation of the SC. After UVB irradiation, the decrease in SPINK5 expression and the increase in kallikrein (KLK) 5 and KLK7 expression may contribute to the exfoliation of SC. 19 SPINK5 mutation is associated with atopic dermatitis (AD) across some ethnicities and causes defects in skin‐barrier function. 20 , 21 The expression of SPINK5, similar to filaggrin, is reduced in AD skin tissue. 22 Our study confirmed that SPINK5 had the highest correlation with the Corneometer values related to skin moisture content, confirming its usefulness as a dryness indicator.
Skin pigmentation is closely associated with melanin content and distribution. 23 MLANA encodes the melanoma antigen recognized by T cells 1 (MART‐1), which is crucial for the structural maturation of melanosomes, particularly during the early stages. The expression patterns and subcellular distribution of MART‐1 are typically correlated with melanin content. 24 Previous studies have confirmed that MLANA expression is higher in pigmented individuals compared with that in nonpigmented individuals. 3 VDR, involved in ROS inhibition 25 and closely associated with tyrosinase, tyrosinase‐related protein 1, and OCA2 melanosomal transmembrane protein genes, which determine skin color, 26 is also used as a biomarker for skin pigmentation. In this study, MLANA was identified as the biomarker that best explained individual typology angle values.
Oily skin is often considered problematic because excessive sebum blocks pores and promotes bacterial growth. 27 MPZL3 encodes myelin protein zero‐like 3. The relationship between seborrheic dermatitis and decreased adipose tissue has been studied in Mpzl3−/− mice. 28 , 29 MPZL3 expression is lower in individuals with oily skin compared with that in individuals with nonoily skin. 3 In this study, MPZL3 was identified as the biomarker that relatively best explains the Sebumeter results.
Sensitive skin refers to skin that reacts more sensitively than normal skin reacts to stimuli, such as external irritants, cosmetics with specific ingredients, or environmental changes, causing irritation reactions (stinging, burning, itching, and tightness) or dermatitis. 30 , 31 , 32 As the cosmetic market continues to grow, the importance of sensitive skin is increasing. However, research on the definition, diagnosis, and treatment of sensitive skin remains limited because of the lack of objective evaluation methods. 33 HMGB2 encodes a chromatin‐related nonhistone protein involved in transcription, chromatin remodeling, and recombination. HMGB2 expression is reduced in aged cells, 34 , 35 and continuously increases with longer treatment times in three‐dimensional skin treated with 5% lactic acid. 36 In this study, HMGB2 was selected as the biomarker that relatively best explains the LAST test score, confirming its usefulness as an objective biomarker for determining sensitive skin.
Although our study employed advanced statistical techniques to correlate biomarker expression with noninvasive skin measurements, several limitations must be acknowledged. First, the relatively modest sample size of 299 participants may have constrained the statistical power and generalizability of our findings, particularly when analyzing subtle differences across age, sex, and skin characteristics. Larger cohorts would provide more accurate statistical validation and enhance the reliability of the identified biomarkers. Second, the study primarily focused on Korean individuals; therefore, limiting the generalization of the results to broader racial and ethnic populations. Third, although we applied rigorous statistical analyses, including correlation, linear regression, and train‐test validation, additional methodological advancements could further strengthen the predictive accuracy and precision of our findings. Therefore, addressing these statistical limitations through expanded sample sizes, diverse population representations, and advanced analytical methodologies would be beneficial for advancing the field of skin biology and personalized skin care solutions based on biomarkers. Fourth, although we considered several statistical performance measures, such as RMSE, R‐squared (proportion of variation explained), and the size and statistical significance of Pearson correlation, some of the selected biomarkers did not correlate as well or have high explanatory value for the noninvasive device measurements (Tables S3–S9). As such, cautious interpretation is required regarding the immediate applicability of the selected biomarkers in terms of their predictive ability of specific skin conditions.
The skin characteristic analysis method proposed in this study offers a novel approach to understanding and analyzing skin characteristics at the molecular level. This research enables the analysis of the dynamic nature of the skin at the molecular level, providing a molecular biological understanding of an individual's skin characteristics. Compared with traditional noninvasive device measurement methods, this approach offers the advantage of analyzing the specific mechanisms underlying skin characteristics, rendering it a valuable complement to noninvasive skin measurement techniques.
The skin biomarker analysis method using MISSM developed in this study offers a range of practical applications. First, it allows the precise measurement of changes in specific biomarkers within the skin, thereby enabling the observation of internal skin factor variations before and after the use of cosmetics or drugs. 5 This capability is particularly useful for assessing the effectiveness of skin care products and treatments. Additionally, this method can be used to determine an individual's skin type, which is essential for the development of customized cosmetics. Personalized skincare solutions can be created to address specific needs and conditions by understanding the unique biomarker profile of a person's skin. This method enhances the understanding and treatment of skin conditions by providing detailed molecular‐level analysis of skin characteristics. The MISSM also plays a crucial role in the discovery and verification of new materials. This method provides a reliable in vivo platform for testing and confirming the efficacy of new substances that target specific skin characteristics. In addition to these applications, the MISSM method is versatile and can be extended to various dermatological studies. The method is particularly valuable for studies requiring repeated sample collection, such as those diagnosing different skin diseases, identifying predictive biomarkers, and evaluating treatment responses.
5. CONCLUSIONS
This study integrated advanced molecular techniques with noninvasive skin assessments to establish a comprehensive dataset for understanding and categorizing skin characteristics based on age and sex among Korean participants. Using minimally invasive microneedle patches for RNA extraction and subsequent qRT‐PCR analysis, we selected seven biomarkers among a panel of 20 that were relatively associated with the key skin attributes of aging, dryness, pigmentation, oiliness, and sensitivity. These biomarkers, including COL1A1, MSN, KLF4, SPINK5, MLANA, MPZL3, and HMGB2, were selected based on their correlations with and explanatory value of well‐described noninvasive skin measurements, which may provide further insights into classifying or predicting skin attributes.
These findings underscore the dynamic nature of skin characteristics and highlight the significant correlations between biomarker expression levels and noninvasive skin measurements across various skin parameters. COL1A1 and MSN have emerged as pivotal biomarkers of aging, reflecting changes in collagen integrity and skin elasticity over time. Similarly, KLF4 and SPINK5 have been identified as key biomarkers for assessing skin dryness, thereby emphasizing the role of epidermal barrier function and hydration levels. MLANA proved to be essential for understanding skin pigmentation dynamics, whereas MPZL3 and HMGB2 provided valuable insights into oily skin and sensitivity, respectively.
These molecular biomarkers have substantial potential for practical applications in dermatology and personalized skin care. Given the significant variability in skin biology across different genetic backgrounds, future studies should aim to include more diverse cohorts to ensure the applicability and validity of the identified biomarkers across various demographic groups. Moreover, future studies should explore alternative statistical models or integrate machine‐learning approaches to enhance the selection and validation of biomarkers for specific skin characteristics. By understanding individual skin profiles at the molecular level, personalized skin care formulations tailored to specific biomarker profiles can be developed to optimize treatment efficacy and outcomes. Moreover, these biomarkers can serve as objective measures to evaluate the effectiveness of skincare products and interventions, facilitating evidence‐based decision‐making in clinical and cosmetic settings.
CONFLICT OF INTEREST STATEMENT
K.H.L. is the CEO of Cutis Biomedical Research Center and on the advisory committee of Raphas, a parent company of the Cutis Biomedical Research Center. D.H.J. is the CEO of Raphas. S.H.K., J.H.K., Y.M.C., S.M.S., E.Y.J., and S.J.L. are employees of Cutis Biomedical Research Center, and, to our knowledge, have a financial relationship with a commercial entity interested in the subject of this manuscript. The interests of these authors did not influence academic fairness in conducting this study, analyzing the results, or writing the paper.
ETHICAL APPROVAL
The study protocol was approved by the Cutis Institutional Review Board (approval numbers: CTS‐IRB‐20D02‐I1). The study was conducted in accordance with the approved protocol, and all participants provided written informed consent.
Supporting information
Supporting Information
Supporting Information
ACKNOWLEDGMENTS
This research received no external funding.
Kim SH, Kim JH, Choi YM, Seo SM, Jang EY, Lee SJ, et al. Development of a biomarker‐based platform for comprehensive skin characterization using minimally invasive skin sampling and quantitative real‐time PCR. Skin Res Technol. 2024;30:e13908. 10.1111/srt.13908
Seo Hyeong Kim and Ji Hye Kim contributed equally to this work.
DATA AVAILABILITY STATEMENT
All data that support the findings of this study are available from the corresponding authors upon a reasonable request.
REFERENCES
- 1. Roberts WE. Skin type classification systems old and new. Dermatol Clin. 2009;27(4):529‐533, viii. [DOI] [PubMed] [Google Scholar]
- 2. Baumann L. Understanding and treating various skin types: the Baumann Skin Type Indicator. Dermatol Clin. 2008;26(3):359‐373, vi. [DOI] [PubMed] [Google Scholar]
- 3. Kim SH, Kim JH, Lee SJ, Jung MS, Jeong DH, Lee KH. Minimally invasive skin sampling and transcriptome analysis using microneedles for skin type biomarker research. Skin Res Technol. 2022;28(2):322‐335. [DOI] [PMC free article] [PubMed] [Google Scholar]
- 4. Marriott M, Holmes J, Peters L, Cooper K, Rowson M, Basketter DA. The complex problem of sensitive skin. Contact Dermatitis. 2005;53(2):93‐99. [DOI] [PubMed] [Google Scholar]
- 5. Kim SH, Kim JH, Choi YM, et al. Microneedles: a novel clinical technology for evaluating skin characteristics. Skin Res Technol. 2024;30(3):e13647. [DOI] [PMC free article] [PubMed] [Google Scholar]
- 6. Seo JI, Ham HI, Baek JH, Shin MK. An objective skin‐type classification based on non‐invasive biophysical parameters. J Eur Acad Dermatol Venereol. 2022;36(3):444‐452. [DOI] [PubMed] [Google Scholar]
- 7. Ohshima H, Kinoshita S, Oyobikawa M, et al. Use of Cutometer area parameters in evaluating age‐related changes in the skin elasticity of the cheek. Skin Res Technol. 2013;19(1):e238‐e242. [DOI] [PubMed] [Google Scholar]
- 8. Clarys P, Alewaeters K, Lambrecht R, Barel AO. Skin color measurements: comparison between three instruments: the Chromameter(R), the DermaSpectrometer(R) and the Mexameter(R). Skin Res Technol. 2000;6(4):230‐238. [DOI] [PubMed] [Google Scholar]
- 9. Uitto J, Fazio MJ, Olsen DR. Molecular mechanisms of cutaneous aging. Age‐associated connective tissue alterations in the dermis. J Am Acad Dermatol. 1989;21(3 Pt 2):614‐622. [PubMed] [Google Scholar]
- 10. Lago JC, Puzzi MB. The effect of aging in primary human dermal fibroblasts. PLoS One. 2019;14(7):e0219165. [DOI] [PMC free article] [PubMed] [Google Scholar]
- 11. Haustead DJ, Stevenson A, Saxena V, et al. Transcriptome analysis of human ageing in male skin shows mid‐life period of variability and central role of NF‐κB. Sci Rep. 2016;6:26846. [DOI] [PMC free article] [PubMed] [Google Scholar]
- 12. Lee JH, Yoo JH, Oh SH, Lee KY, Lee KH. Knockdown of moesin expression accelerates cellular senescence of human dermal microvascular endothelial cells. Yonsei Med J. 2010;51(3):438‐447. [DOI] [PMC free article] [PubMed] [Google Scholar]
- 13. Kim SH, Kim JH, Suk JM, et al. Identification of skin aging biomarkers correlated with the biomechanical properties. Skin Res Technol. 2021;27(5):940‐947. [DOI] [PubMed] [Google Scholar]
- 14. Pons‐Guiraud A. Dry skin in dermatology: a complex physiopathology. J Eur Acad Dermatol Venereol. 2007;21(Suppl 2):1‐4. [DOI] [PubMed] [Google Scholar]
- 15. Gabe Y, Uchiyama M, Sasaoka S, et al. Efficacy of a fine fiber film applied with a water‐based lotion to improve dry skin. Skin Res Technol. 2022;28(3):465‐471. [DOI] [PMC free article] [PubMed] [Google Scholar]
- 16. Segre JA, Bauer C, Fuchs E. Klf4 is a transcription factor required for establishing the barrier function of the skin. Nat Genet. 1999;22(4):356‐360. [DOI] [PubMed] [Google Scholar]
- 17. Park NJ, Bong SK, Lee S, et al. Compound K improves skin barrier function by increasing SPINK5 expression. J Ginseng Res. 2020;44(6):799‐807. [DOI] [PMC free article] [PubMed] [Google Scholar]
- 18. Komatsu N, Takata M, Otsuki N, et al. Expression and localization of tissue kallikrein mRNAs in human epidermis and appendages. J Invest Dermatol. 2003;121(3):542‐549. [DOI] [PubMed] [Google Scholar]
- 19. Nin M, Katoh N, Kokura S, Handa O, Yoshikawa T, Kishimoto S. Dichotomous effect of ultraviolet B on the expression of corneodesmosomal enzymes in human epidermal keratinocytes. J Dermatol Sci. 2009;54(1):17‐24. [DOI] [PubMed] [Google Scholar]
- 20. Nishio Y, Noguchi E, Shibasaki M, et al. Association between polymorphisms in the SPINK5 gene and atopic dermatitis in the Japanese. Genes Immun. 2003;4(7):515‐517. [DOI] [PubMed] [Google Scholar]
- 21. Zhao LP, Di Z, Zhang L, et al. Association of SPINK5 gene polymorphisms with atopic dermatitis in Northeast China. J Eur Acad Dermatol Venereol. 2012;26(5):572‐577. [DOI] [PubMed] [Google Scholar]
- 22. Di ZH, Ma L, Qi RQ, et al. T Helper 1 and T Helper 2 cytokines differentially modulate expression of filaggrin and its processing proteases in human keratinocytes. Chin Med J. 2016;129(3):295‐303. [DOI] [PMC free article] [PubMed] [Google Scholar]
- 23. Visscher MO. Skin color and pigmentation in ethnic skin. Facial Plast Surg Clin North Am. 2017;25(1):119‐125. [DOI] [PubMed] [Google Scholar]
- 24. Hoashi T, Watabe H, Muller J, Yamaguchi Y, Vieira WD, Hearing VJ. MART‐1 is required for the function of the melanosomal matrix protein PMEL17/GP100 and the maturation of melanosomes. J Biol Chem. 2005;280(14):14006‐14016. [DOI] [PubMed] [Google Scholar]
- 25. Becker AL, Carpenter EL, Slominski AT, Indra AK. The role of the vitamin D receptor in the pathogenesis, prognosis, and treatment of cutaneous melanoma. Front Oncol. 2021;11:743667. [DOI] [PMC free article] [PubMed] [Google Scholar]
- 26. Tiosano D, Audi L, Climer S, et al. Latitudinal clines of the human vitamin D receptor and skin color genes. G3. 2016;6(5):1251‐1266. [DOI] [PMC free article] [PubMed] [Google Scholar]
- 27. Sakuma TH, Maibach HI. Oily skin: an overview. Skin Pharmacol Physiol. 2012;25(5):227‐235. [DOI] [PubMed] [Google Scholar]
- 28. Leiva AG, Chen AL, Devarajan P, et al. Loss of Mpzl3 function causes various skin abnormalities and greatly reduced adipose depots. J Invest Dermatol. 2014;134(7):1817‐1827. [DOI] [PMC free article] [PubMed] [Google Scholar]
- 29. Wikramanayake TC, Borda LJ, Kirsner RS, et al. Loss of MPZL3 function causes seborrhoeic dermatitis‐like phenotype in mice. Exp Dermatol. 2017;26(8):736‐738. [DOI] [PMC free article] [PubMed] [Google Scholar]
- 30. Berardesca E, Farage M, Maibach H. Sensitive skin: an overview. Int J Cosmet Sci. 2013;35(1):2‐8. [DOI] [PubMed] [Google Scholar]
- 31. Do LHD, Azizi N, Maibach H. Sensitive skin syndrome: an update. Am J Clin Dermatol. 2020;21(3):401‐409. [DOI] [PubMed] [Google Scholar]
- 32. Misery L, Boussetta S, Nocera T, Perez‐Cullell N, Taieb C. Sensitive skin in Europe. J Eur Acad Dermatol Venereol. 2009;23(4):376‐381. [DOI] [PubMed] [Google Scholar]
- 33. Farage MA, Maibach HI. Sensitive skin: closing in on a physiological cause. Contact Dermatitis. 2010;62(3):137‐149. [DOI] [PubMed] [Google Scholar]
- 34. Kim HK, Kang MA, Kim MS, Shin YJ, Chi SG, Jeong JH. Transcriptional repression of high‐mobility group box 2 by p21 in radiation‐induced senescence. Mol Cells. 2018;41(4):362‐372. [DOI] [PMC free article] [PubMed] [Google Scholar]
- 35. Taniguchi N, Caramés B, Ronfani L, et al. Aging‐related loss of the chromatin protein HMGB2 in articular cartilage is linked to reduced cellularity and osteoarthritis. Proc Natl Acad Sci. 2009;106(4):1181‐1186. [DOI] [PMC free article] [PubMed] [Google Scholar]
- 36. Hasan MZ, Kitamura M, Kawai M, et al. Transcriptional profiling of lactic acid treated reconstructed human epidermis reveals pathways underlying stinging and itch. Toxicol In Vitro. 2019;57:164‐173. [DOI] [PubMed] [Google Scholar]
Associated Data
This section collects any data citations, data availability statements, or supplementary materials included in this article.
Supplementary Materials
Supporting Information
Supporting Information
Data Availability Statement
All data that support the findings of this study are available from the corresponding authors upon a reasonable request.