Abstract
Anthropogenic activities have substantially enhanced the loadings of reactive nitrogen (Nr) in the Earth system since pre-industrial times1,2, contributing to widespread eutrophication and air pollution3–6. Increased Nr can also influence global climate through a variety of effects on atmospheric and land processes but the cumulative net climate effect is yet to be unravelled. Here we show that anthropogenic Nr causes a net negative direct radiative forcing of −0.34 [−0.20, −0.50] W m−2 in the year 2019 relative to the year 1850. This net cooling effect is the result of increased aerosol loading, reduced methane lifetime and increased terrestrial carbon sequestration associated with increases in anthropogenic Nr, which are not offset by the warming effects of enhanced atmospheric nitrous oxide and ozone. Future predictions using three representative scenarios show that this cooling effect may be weakened primarily as a result of reduced aerosol loading and increased lifetime of methane, whereas in particular N2O-induced warming will probably continue to increase under all scenarios. Our results indicate that future reductions in anthropogenic Nr to achieve environmental protection goals need to be accompanied by enhanced efforts to reduce anthropogenic greenhouse gas emissions to achieve climate change mitigation in line with the Paris Agreement.
Subject terms: Element cycles, Atmospheric chemistry, Ecological modelling, Climate and Earth system modelling
A comprehensive model framework is used to estimate the global net direct radiative forcing of anthropogenic reactive nitrogen as being about −0.34 W m−2, which has a cooling effect on the climate.
Main
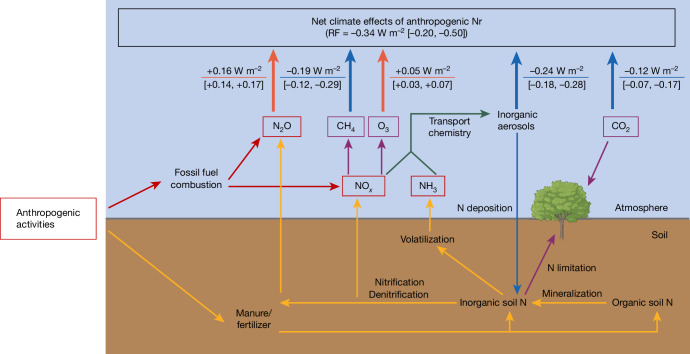
Reactive nitrogen (Nr) in the Earth system, defined as organic and inorganic forms of nitrogen (N) compounds, except the dinitrogen gas (N2), has increased rapidly since the industrial revolution1. This increase can be mainly attributed to emissions associated with anthropogenic fossil fuel combustion and fertilizer application1,2. Elevated concentrations of Nr induce detrimental environmental effects3,4, including air pollution5, eutrophication of surface and near-coast water6 and biodiversity loss7, but can also substantially influence climate. Specifically, the long-lived greenhouse gas nitrous oxide (N2O) contributes to warming of the atmosphere8, whereas short-lived ammonium (NH4+) and nitrate (NO3−) aerosols generated from ammonia (NH3) and nitrogen oxide (NOx) gases can scatter solar radiation and thereby cool the atmosphere9–11. NOx furthermore plays a pivotal role in various atmospheric chemical reactions, regulating the lifetimes and thus mole fractions of other gases, such as the greenhouse gases methane (CH4)12 and ozone (O3)13. Furthermore, fertilizer application and deposition of atmospheric Nr on land and ocean can alleviate N limitation in terrestrial or marine ecosystems and facilitate carbon sequestration, thereby reducing atmospheric CO2 concentrations14,15 and exerting a cooling effect on the atmosphere (Fig. 1).
Fig. 1. Pathways of anthropogenic Nr effects on global climate.
Solid lines and arrows represent processes included in this study using a combination of terrestrial biosphere and atmospheric chemistry modelling. The direct radiative forcing estimates represent the climatic effects of anthropogenic Nr. The uncertainty range of each pathway is estimated on the basis of the 1 standard deviation across the NMIP2 ensemble members as well as the uncertainties in atmospheric chemistry (Supplementary Information Section 1.2). Orange and dark blue solid arrows on the top indicate the warming or cooling effects, respectively. The image of the tree was created using BioRender.com.
So far, the net global Nr climate effect remains unclear because of the substantial variation of individual Nr-related processes across geographic regions16 and the timescale dependence of the climate responses to anthropogenic Nr (ref. 17). An earlier study estimated a global net radiative forcing of anthropogenic Nr of −0.24 [+0.2, −0.5] W m−2 based only on literature review18. Some studies, focusing on hotspots of anthropogenic Nr, such as the United States19, Europe20 and China21, have also assessed the components of the regional climate effects of anthropogenic Nr based on a literature review of the sensitivities of individual processes to anthropogenic Nr inputs. However, these assessments were constrained by their focus on present-day anthropogenic Nr levels, thus neglecting the cumulative effects of long-lived greenhouse gases since the pre-industrial era. They were also limited by the extent to which they consider spatial heterogeneity and nonlinearities between the coupled biogeochemical cycles and atmospheric lifetime of the different forcers, resulting in significant uncertainties that impede attempts to extrapolate regional estimates to globe scale.
Filling these knowledge gaps requires the integration of terrestrial biogeochemistry and atmospheric chemistry to account for the intricate transformations of Nr compounds and the resulting trade-offs in the climate impacts22. Previous studies have demonstrated the effectiveness of both process-based terrestrial biosphere models and global chemical transport models separately in assessing the climate effects of specific anthropogenic Nr compounds or processes9,16,23–26. However, most of the studies associated with terrestrial Nr fluxes only relied on a single model, whereas incorporating model uncertainty is essential for a robust assessment27.
Here we present a comprehensive model framework to estimate the global net direct radiative forcing of anthropogenic Nr as well as the likely changes in radiative forcings in response to future changes of anthropogenic Nr inputs. First, we integrated anthropogenic emission inventories from the community emissions data system (CEDS) and eight terrestrial biosphere model outputs from the global nitrogen/N2O model inter-comparison project phase 2 (NMIP2)28 to quantify the historical anthropogenic Nr effects on terrestrial carbon sequestration, soil NH3 volatilization and soil NOx and N2O emissions. Second, we performed a series of model experiments using box models of greenhouse gases and a global chemical transport model (GEOS-Chem) coupled to a radiative transfer module (RRTMG) to estimate the global net direct radiative forcing of anthropogenic Nr associated with each of these emission sources. Finally, we estimated how the net direct radiative forcing may respond to future scenarios of anthropogenic Nr inputs.
Effects of anthropogenic Nr on emissions
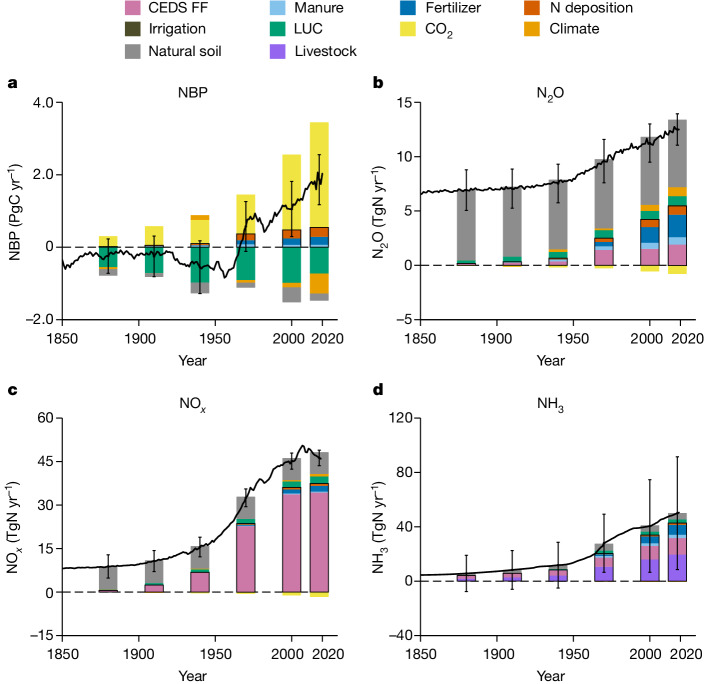
We integrated results from the NMIP2 ensemble with the CEDS inventory (Methods) to comprehensively represent anthropogenic Nr effects on terrestrial carbon fluxes, N2O, NH3 and NOx emissions (Fig. 2). Here, anthropogenic Nr sources were defined as the set of anthropogenic activities that directly add Nr into terrestrial ecosystems or the atmosphere, including manure and fertilizer application, N deposition, fossil fuel combustion and livestock NH3 emissions. Other anthropogenic factors in the configuration of NMIP2, for example, irrigation, land-use change (LUC), elevated CO2 and changing climate, also affect the global N cycle indirectly and thereby modify the response of the terrestrial biosphere to Nr additions. However, a robust identification of anthropogenic contributions from these indirect factors is not possible and therefore the influences of these indirect factors were not attributed to anthropogenic Nr effects in this study.
Fig. 2. Historical Nr emissions and terrestrial carbon fluxes based on CEDS inventory and NMIP2 ensemble mean.
a–d, The terrestrial NBP (a), N2O (b), NOx (c) and NH3 (d) emissions, respectively. All of the fossil fuel sources in CEDS are indicated by the pale violet bars, whereas other colours indicate factor contributions based on the NMIP2 ensemble mean. The soil NH3 emissions have been scaled by the CEDS agricultural emissions (Methods). The fire emission of each component is not included in the current NMIP2 configuration. The contributions of each factor were averaged over 1880s, 1910s, 1940s, 1970s, 2000s and 2020s with a 5-year time window, in which the direct anthropogenic Nr effects are shown with a black outline. Black lines indicate the ensemble mean annual flux of each compound and the error bars indicate 1 standard deviation among different NMIP2 members. FF, fossil fuel.
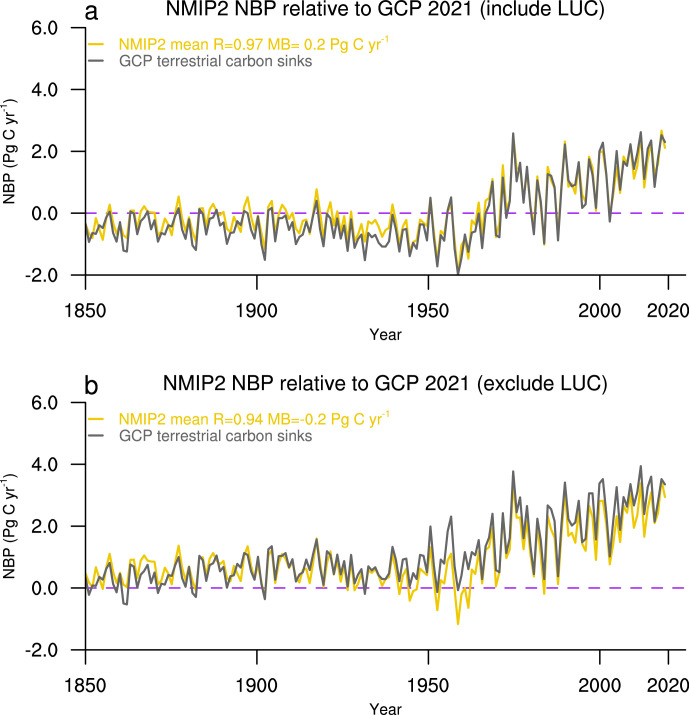
The net biome productivity (NBP) of the NMIP2 ensemble, which corresponds the terrestrial carbon balance, showed similar magnitudes and trends relative to Global Carbon Project 202129, with the correlation coefficient of 0.94 (0.98) and mean bias of −0.1 PgC yr−1 (0.2 PgC yr−1) when excluding (including) the effects of LUC, respectively (Extended Data Fig. 1). Anthropogenic Nr, including fertilizer and manure applications and N deposition, increased terrestrial carbon sinks by 0.55 ± 0.38 PgC yr−1 over 2016–2020 (Fig. 2a). The N2O emissions from both soils and fossil fuel combustion over 2016–2020 were 12.6 ± 1.5 TgN yr−1, for which anthropogenic Nr contributed about 5.5 ± 0.97 TgN yr−1. The NMIP2 ensemble estimates of global soil N2O emissions induced by manure and fertilizer application, N deposition and from natural soil during 2016–2020 were 2.7 ± 0.95, 0.80 ± 0.22 and 6.2 ± 1.6 TgN yr−1, respectively (Fig. 2b). These estimates fall well within the uncertainty ranges of 2.5–5.8, 0.4–1.4 and 4.9–6.5 TgN yr−1 over 2007–2016 according to the latest N2O budget estimates30.
Extended Data Fig. 1. Comparison of net biome productivity (NBP) estimates from the NMIP2 ensemble and the Global Carbon Project (GCP2021).
The yellow and gray lines represent the NBP of NMIP2 ensemble and GCP202129 estimate, respectively. a and b show time series with and without the effect of land use change (LUC), respectively. The correlation coefficient (R) and mean bias (MB) of annual NBP between NMIP2 ensemble and GCP2021 are also given.
Anthropogenic NOx emissions during 2016–2020 reached 46.5 ± 2.7 TgN yr−1, most of which were due to fossil fuel combustion, as derived from CEDS. The NMIP2 ensemble estimated that anthropogenic activities contributed about 3.1 ± 0.77 TgN yr−1 of the 12.2 ± 2.7 TgN yr−1 global soil NOx emissions over 2016–2020 (Fig. 2c), the last of which was slightly higher than the recent estimates of about 9.5 ± 0.4 TgN yr−1 for 1980–201731. Independent estimates of the present-day global NH3 emissions are highly uncertain with a range of 40–163 TgN yr−1 (refs. 32–34). This uncertainty is also reflected in the spread of the NMIP2 ensemble (Fig. 2d and Supplementary Fig. 1), which, however, showed a consistent relative imprint of agricultural fertilizer and manure applications on the trend of global NH3 emissions from 1850 to 2019. To derive a globally consistent time evolution of the anthropogenic Nr effect on NH3 emissions for our climate assessment, we adopted a conservative estimate of total NH3 emissions of 50.5 TgN yr−1 in 2019 based on CEDS inventory and applied relative contribution of anthropogenic Nr to NH3 emissions simulated by the NMIP2 ensemble (Methods).
Radiative forcing from anthropogenic Nr
We next examined the net climate effects of anthropogenic Nr by combining the box-model simulated atmospheric CO2, N2O and CH4 concentrations and the emissions of NH3 and NOx, in the GEOS-Chem-RRTMG model with and without accounting for the anthropogenic Nr effect (Methods). Changes in the CH4 lifetime due to the effect of changing atmospheric NOx burden on hydroxyl radical (OH) were also calculated offline using a box model (Methods). The direct radiative forcing of anthropogenic Nr for each compound was then calculated as the difference in all-sky radiative forcing at the top of the atmosphere between present-day (here defined as 2019) and pre-industrial (here defined as 1850) times. The uncertainties were estimated on the basis of the spread across the NMIP2 ensemble members as well as in atmospheric chemistry (Supplementary Information Section 1.2).
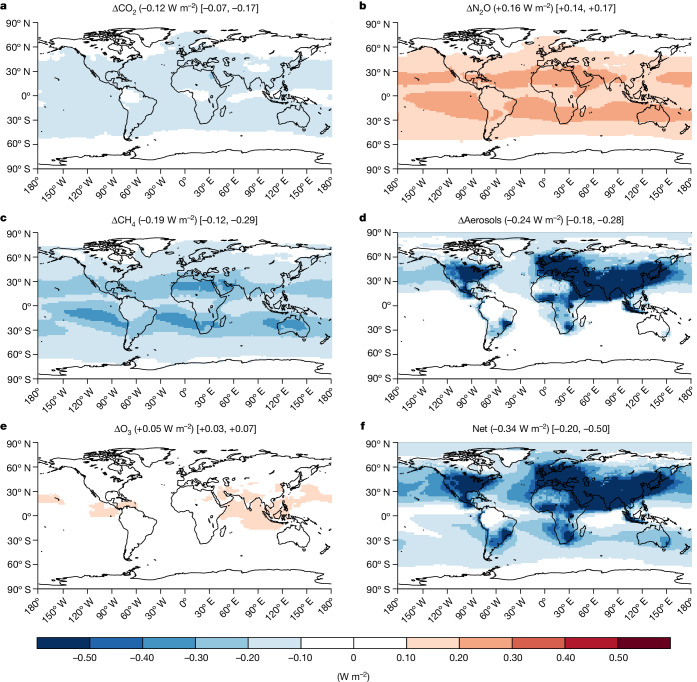
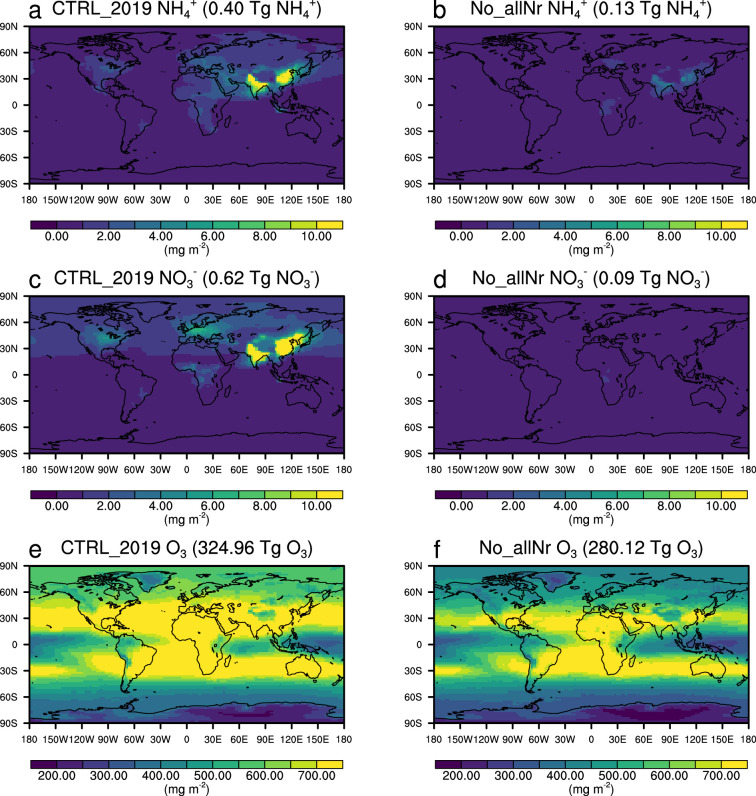
The net global direct radiative forcing associated with the cumulative effect of historical emissions in 2019 was estimated as −0.34 [−0.20, −0.50] W m−2 (Fig. 3), for which anthropogenic Nr effects on CO2, N2O, CH4, aerosols (including ammonium, nitrate and sulfate; Methods) and tropospheric O3 contributed −0.12 [−0.07, −0.17], +0.16 [+0.14, +0.17], −0.19 [−0.12, −0.29], −0.24 [−0.18, −0.28] and +0.05 [+0.03, +0.07] W m−2, respectively. Each component generally falls within the expected uncertainty ranges relative to previous studies focusing on individual Nr components or processes (Supplementary Information Section 3 and Supplementary Table 3). The anthropogenic Nr-induced N2O warming slightly outweighed the cooling effects by N-induced increases in terrestrial carbon sequestration, consistent with a previous study using one terrestrial biosphere model9. The enhanced NOx emissions led to a significant cooling effect through decreasing CH4 lifetime and increasing aerosol burdens, whereas the negative direct radiative forcing of aerosols was unevenly distributed and prevalent in air-polluted regions such as Northern America, Western Europe and Eastern and Southern Asia. In response to the substantial NOx increases since pre-industrial times, present-day tropospheric O3 was found to be enhanced across the entire simulated global grid, resulting in significant increases in global tropospheric O3 burden from 280.1 to 325.0 Tg (Extended Data Fig. 2). This O3 enhancement partly offsets the cooling climate effects from reduced CH4 lifetime and increased aerosol burden considering the greenhouse gas effect of O3.
Fig. 3. Global direct radiative forcing in 2019 induced by anthropogenic Nr.
a–f, The contributions of CO2 (a), N2O (b), CH4 (c), aerosols (d), O3 (e) and the net effect (f) (that is, sum of a–e) were derived in the GEOS-Chem-RRTMG model by calculating differences in all-sky top-of-atmosphere radiative forcing between CTRL_2019 and No_allNr experiments. The radiative forcing of aerosols is the sum of the direct radiative forcing contributed by ammonium, nitrate and sulfate aerosols. Numbers in parentheses represent the global area-weighted averages, whereas numbers in the brackets indicate the uncertainty ranges based on sensitivity experiments with GEOS-Chem-RRTMG using ±1 standard deviation among NMIP2 ensembles as well as ±30% uncertainty in OH and O3 concentrations (Supplementary Information Section 1.2). Note the Nr effects on global CO2, N2O and CH4 are assumed to be evenly distributed, so that the patterns of these three greenhouse gases are mostly determined by other forcing agents, including the distribution of clouds.
Extended Data Fig. 2. Simulated global burden of short-lived atmospheric compounds.
The column burden of a-b ammonium aerosol, c-d nitrate aerosol and e-f O3 in CTRL_2019 and No_allNr experiments are given, respectively. The column burden of each compound was accumulated over the whole atmospheric column in GEOS-Chem based on the annual mean concentrations.
Splitting agricultural and other sources
To better understand the anthropogenic Nr climate effect, we further isolated the effects of agricultural and non-agricultural activities (Methods). Here, the soil emissions attributed to fertilizer and manure application were considered as agricultural sources whereas fossil fuel combustion and soil emissions attributed to changes in N deposition were regarded as non-agricultural sources. Attributing all the N deposition as non-agricultural sources omits the effect of N deposition on agricultural fluxes35 but this effect will be comparatively small given the much lower N deposition rates compared to agricultural fertilizer application (Fig. 2).
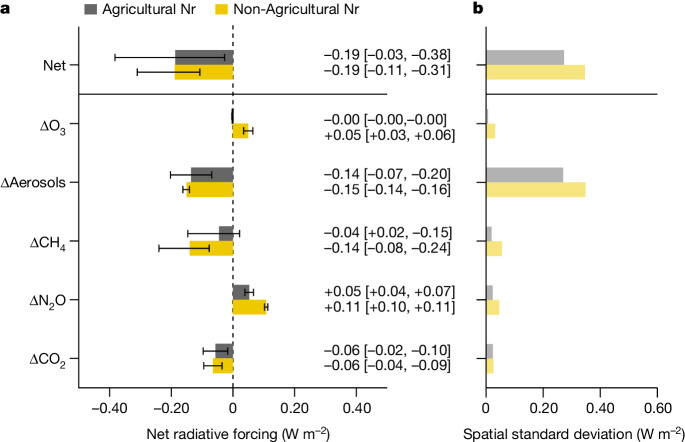
Figure 4a showed that the net climate effects derived from agricultural and non-agricultural sources were comparable (−0.19 [−0.03, −0.38] and −0.19 [−0.11, −0.31] W m−2, respectively). For the agricultural sources, the net cooling effect was dominated by the direct aerosol effect, which could be attributed to the agricultural NH3 emissions, whereas the Nr effects of CO2 uptake and N2O emissions on the global radiative forcing compensated each other, in agreement with previous studies9. Conversely, NOx emissions emitted from fossil fuel combustion dominated the net cooling effects of non-agricultural sources. Higher atmospheric NOx burden not only induced a higher nitrate aerosol burden but also significantly decreased the atmospheric mole fraction of CH4 through increasing atmospheric OH. The warming effect of non-agricultural N2O was amplified by the synchronous decline in atmospheric CH4 because of their interactions in the radiative transfer36. We quantified this unmasking effect on the N2O radiative forcing by decreasing CH4 using a sensitivity experiment with GEOS-Chem-RRTMG (Extended Data Table 1) as a decrease in the non-agricultural N2O radiative forcing from +0.11 to + 0.07 W m−2.
Fig. 4. Global direct radiative forcing associated with anthropogenic Nr from agricultural and non-agricultural sources.
a, The direct radiative forcing values are based on differences of sensitivity experiments between CTRL_2019 and No_agriNr or No_nonagriNr, respectively. The radiative forcing of aerosols is the sum of the direct radiative forcing contributed by ammonium, nitrate and sulfate aerosols. Uncertainty bars were derived from GEOS-Chem runs forced with ensemble mean ± 1 standard deviation in the NMIP2 ensemble and the associated sensitivities of radiative forcing to Nr changes (Supplementary Information Section 1.3). b, Spatial variation of the direct forcing effect, estimated as 1 standard deviation of direct radiative forcing across the global simulated grid.
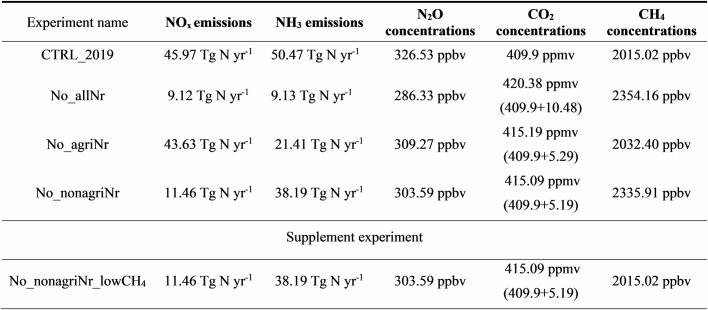
Extended Data Table 1.
Summary of the GEOS-Chem sensitivity experiments
The global NOx and NH3 emissions are derived by integrating CEDS and NMIP2 ensembles. Atmospheric concentrations of N2O, CO2 and CH4 are retrieved by the box models. The CTRL_2019 experiment includes all anthropogenic Nr sources; The No_allNr experiment excludes anthropogenic Nr sources of fossil fuel, fertilizer and manure application and N deposition; The No_agriNr experiment excludes anthropogenic Nr sources of fertilizer and manure application; The No_agriNr experiment excludes anthropogenic Nr sources of fossil fuel and N deposition. The livestock NH3 emission is attributed as agricultural sources.
Because of the large difference in lifetimes between long-lived greenhouse gases (such as CO2 and N2O) and short-lived reactive gases (such as NH3 and NOx), regional differences in the emissions matter more for the short-lived gases. As a result, the strength of the regional anthropogenic Nr climate effects shows large spatial variations (Figs. 3 and 4b). In particular, the aerosol effects tend to be strong in regions with high levels of air pollution, such as India and eastern China but show negligible radiative forcing on open ocean because of their short lifetime and limited atmospheric transport.
It should be noted that the radiative forcings attributed to agricultural and non-agricultural Nr are affected by the nonlinearity in the chemistry of aerosol formation, which results in a somewhat stronger net cooling effect from the sum of the individual effects (−0.38 W m−2) compared to the combined estimate (−0.34 W m−2 in Fig. 3f). The direct radiative forcing of nitrate aerosol is not only weakened with substantial NOx reductions in the no_nonagriNr experiment but also reduced by the decline in the ammonium nitrate aerosol associated with significant NH3 emission reduction in the no_agriNr experiment (Methods; Extended Data Fig. 3 and Supplementary Table 5). The NOx reduction further affects the concentrations of atmospheric oxidants such as O3 and OH and reduces the formation of sulfate aerosol in no_nonagriNr experiment (Supplementary Table 5; Methods). Nevertheless, this nonlinearity in aerosol chemistry does not influence the ranking or overall magnitude of the factors by which Nr influences radiative forcing.
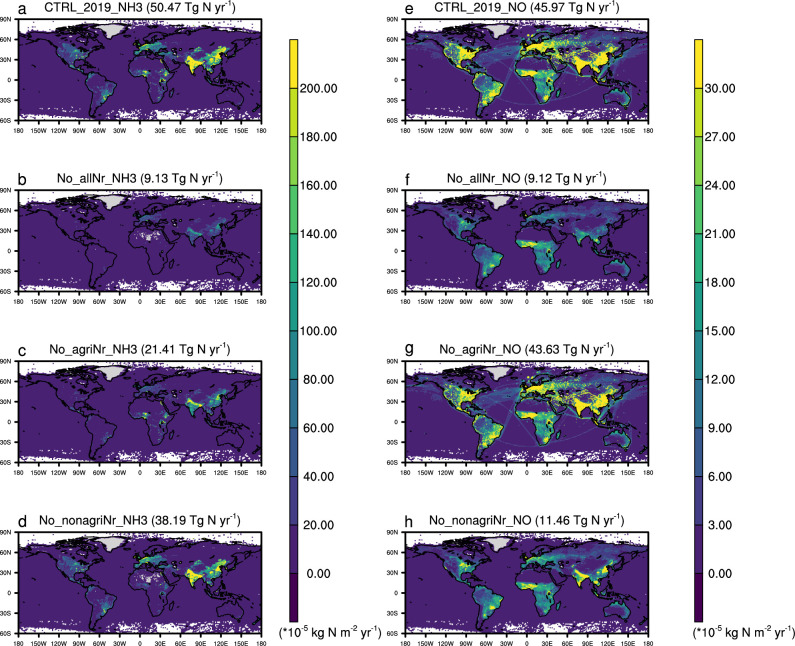
Extended Data Fig. 3. Global patterns of anthropogenic NH3 and NOx emissions.
a-d The NH3 emissions and e-h NOx emissions in the CTRL_2019, No_allNr, No_agriNr, and No_nonagriNr sensitivity experiments, respectively, are shown. The sub-title of each panel gives the global total emissions in the year of 2019.
Scenarios of future Nr climate effects
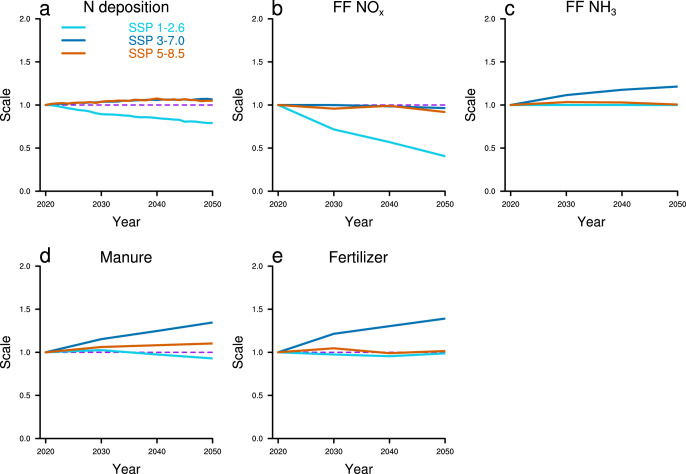
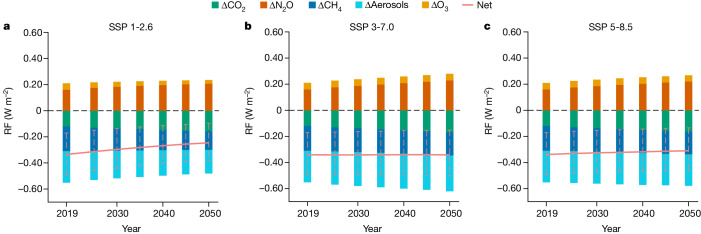
To illustrate the likely consequences of potential future changes in anthropogenic Nr, we next use the understanding gained in the previous section in a simplified analysis using three representative scenarios from the shared socioeconomic pathways (SSPs; Methods). The SSP 1-2.6 assumes an ‘Nr cleaner’ scenario with strong reduction in fossil-fuel-based NOx emission but relatively unchanged magnitudes of fertilizer and manure application to meet global food demands (Extended Data Fig. 4). These Nr-related emissions changes lead to a net warming effect of +0.09 W m−2 by the 2050s relative to 2019 dominated by the increased CH4 lifetime and a decreased direct aerosol effect (Fig. 5a). In the SSP 3-7.0 scenario, the future global total fossil fuel sources of Nr remain close to the 2019 level, resulting in similar magnitude of global aerosol forcing but potentially various trends among different regions. Enhanced fertilizer and manure applications increase N2O emissions and lead to a stronger N2O warming effect of +0.06 W m−2 in the 2050s relative to 2019, which is compensated by the cooling effects of increased aerosol loadings (−0.03 W m−2 enhancement in 2050s relative to 2019) and enhanced terrestrial carbon sequestration (−0.04 W m−2 enhancement in the 2050s relative to 2019). However, bounding assumptions on the magnitude of N saturation (Supplementary Information Section 2.1 and Supplementary Fig. 4) suggest that carbon sequestration effect might be overestimated by about 0.02 W m−2. Finally, the SSP 5-8.5 scenario predicts a generally unchanged level of anthropogenic Nr compared to 2019, thus compensating changes in climate forcing. These results imply that stronger reductions in greenhouse gases emissions are required accompanied by the ‘clean-Nr’ scenario to achieve both environmental benefits and climate change mitigation.
Extended Data Fig. 4. Development of global anthropogenic Nr inputs in future SSP scenarios.
a-e indicate the changes of anthropogenic Nr inputs from N deposition, fossil fuel NOx, fossil fuel NH3, manure and fertilizer applications, respectively. For each SSP scenario, the annual scale factors were calculated by the ratios of future anthropogenic Nr to the 2019 levels, which is indicated by the dashed purple lines. The N deposition and fossil fuel data are from the input4MIPs (https://esgf-data.dkrz.de/projects/input4mips-dkrz/). Manure and fertilizer predictions are obtained from Mogollon, et al.96.
Fig. 5. Global direct radiative forcings induced by future scenarios of anthropogenic Nr.
a–c, Global direct radiative forcing relative to pre-industrial concentrations (1850) in response to changes in anthropogenic Nr inputs following SSP 1-2.6 (a), SSP 3-7.0 (b) and SSP 5-8.5 (c) scenarios. The net changes in radiative forcing are shown as solid orange lines. The dashed purple lines indicate no direct radiative forcing change relative to pre-industrial times. The error bars were calculated by the percentage ranges in direct radiative forcing derived from the historical estimates (Supplementary Information Section 1.3).
The magnitude of the estimated radiative forcing is associated with uncertainties in each individual compound or process (Supplementary Information Section 2) but also the unavoidable ambiguity in defining the scope of anthropogenic impacts. Here we adapted a straightforward but conservative definition with only direct Nr inputs by anthropogenic activities. However, other human-induced factors, such as elevated CO2 and LUC, as well as the climate change and associated impacts (for example, wildfire) can have substantial impacts on biogeochemical cycling, including C29, water37 and N cycles, thus making it challenging to unambiguously identify the contributions from anthropogenic Nr. Although these indirect effects might amplify the overall climate effects of anthropogenic Nr, the NMIP2-ensemble simulations suggest that these effects on the C or N cycle are not as significant as the overall direct anthropogenic Nr effect.
In this study, several processes, including the influences of aerosols or O3 on terrestrial carbon fluxes, aerosol–cloud interactions, N addition effects on soil CH4 uptakes and N fertilization on marine biogeochemistry were not included because of the likely small effect on climate or uncertainty to quantify the global effect (Supplementary Information Section 2.5). For the effects we examined in this study, on the one hand, the future CO2 cooling due to CO2 uptake on land may be overestimated in our study because we omit the contribution of fossil-fuel-based CO2 emissions from N fertilizer production by the Haber–Bosch method and, more importantly, terrestrial ecosystems exposed to high chronic N additions may become N saturated within the next few decades and contribute less to terrestrial C storage (Supplementary Information Section 2.1). Uncertainties also remain in quantifying soil N2O, NOx and NH3 emissions (Supplementary Information Sections 2.2 to 2.4). On the other hand, the negative radiative forcing of nitrate aerosol may be overestimated, as the GEOS-Chem model tends to overestimate nitrate aerosol concentrations38–40. Furthermore, changes in NOx can further influence the formation of organic aerosols by altering atmospheric oxidation capacity and aerosol yields41–43, which are not examined in this study given the large uncertainty in simulating corresponding chemical processes. To reduce uncertainties and gain a more comprehensive understanding of potential feedbacks, the development of more integrative Earth system models including key interactions among processes of terrestrial and marine biogeochemistry, atmospheric chemistry, climate dynamics and radiative processes would be required.
Comprehensively assessing the global climate effects of anthropogenic Nr has been challenging for decades considering the complexity in atmospheric physical and chemical processes as well as the terrestrial biogeochemical cycles. Bringing together biosphere and atmospheric chemistry modelling, our results contribute to a clearer picture that at present the combined effects from short-lived and long-term Nr-related climate forcers is a global net cooling with strong regional variations. The enhanced consistency allows us to estimate the net radiative forcing of anthropogenic Nr at −0.34 [−0.20, −0.50] W m−2, which improves the robustness relative to the only other available estimate based on literature review alone (−0.24 [ + 0.2, −0.50] W m−2) (ref. 18). Future reductions in anthropogenic Nr will likely weaken this net cooling effect mainly through a reducing atmospheric aerosol burden and an increased CH4 lifetime, whereas the future effect of warming from fertilizer-induced N2O emissions will remain or even increase. Our findings thus imply that to alleviate the negative environmental effects of Nr without larger rates of climate change, stronger reductions in the emission of greenhouse gases CO2 and CH4 need to be implemented concurrently with Nr reductions.
Methods
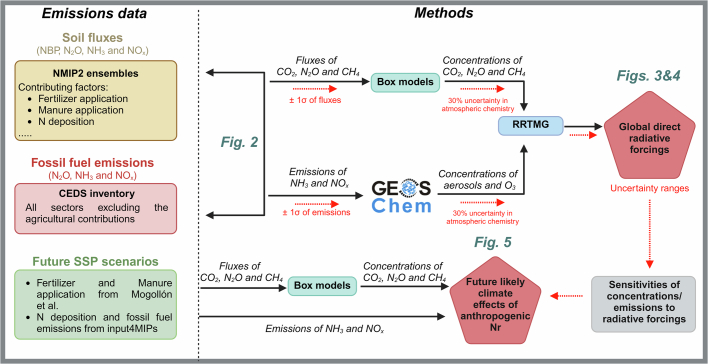
A summary for the data and methods in this study is given in Extended Data Fig. 6. Here we introduce each part in detail.
Extended Data Fig. 6. Schematic workflow summary of this study.
Solid black arrows indicate main methods or data, as described in Methods. Dashed red arrows indicate the uncertainty analysis and the associated sensitivities to radiative forcing (see SI text S1). The main figures in this study are highlighted accordingly with the figure indexes. This figure is created with BioRender.com.
NMIP2 multimodel dataset
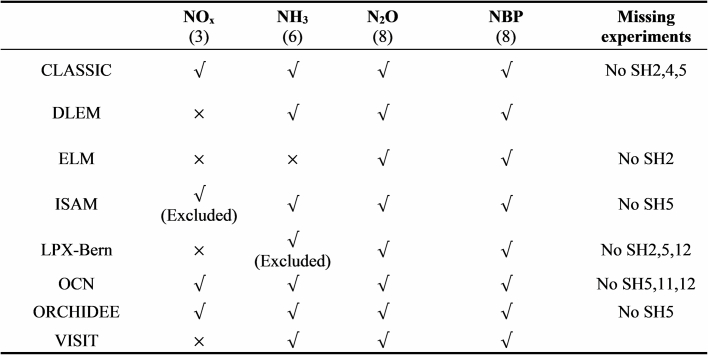
The NMIP2 ensemble included eight terrestrial biosphere models with comprehensive descriptions of terrestrial carbon and nitrogen cycles, driven by harmonized climate, land use and nitrogen cycle drivers. Each NMIP2 member provided data at a spatial resolution of 0.5° × 0.5° from 11 transient, factorial simulations (Extended Data Table 2) to disentangle the contributions of N fertilizer use, manure application, N deposition, irrigation, LUC, CO2 elevation and climate changes from pre-industrial times (1850) to present day (2020). Climate data were generated from CRU-JRA55 6-h forcing44; historical CO2 concentrations were derived from ice core CO2 data and NOAA annual observations. Anthropogenic Nr deposition was generated by international global atmospheric chemistry/stratospheric processes and their role in climate chemistry–climate model initiative (https://www.sparc-climate.org/activities/ccm-initiative/). Nitrogen fertilizer and manure application data were specially generated for NMIP2 based on high-resolution (5 arcmin) harmonized data on the history of anthropogenic nitrogen inputs45. Land use changes were generated from land-use harmonization 2 project46,47, surveys by the International Fertilizer Industry Association and the Food and Agricultural Organization and the Global Livestock Impact Mapping System. For more details on NMIP2 configuration and input data, refer to refs. 28,48. To calculate the ensemble mean, we used output from eight models for NBP and N2O but could only rely on six models for soil NH3 and three for soil NOx emissions, respectively (Extended Data Table 3).
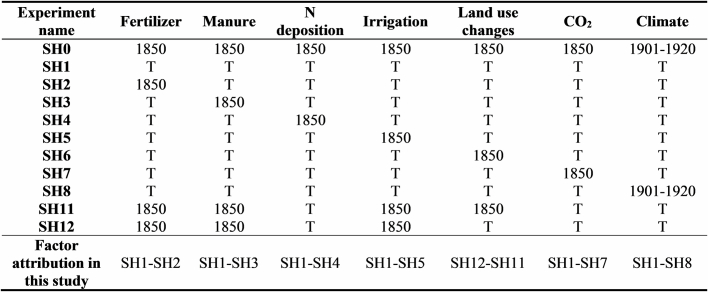
Extended Data Table 2.
Experiment configurations in NMIP2
The letter ‘T’ indicates a transient change as the forcing data from 1850 to 2020. The 1850 or 1901–1920 indicates that the corresponding forcing was fixed in this year or time periods. Climate over 1850–1900 were repeated by 1901–1920 for all experiments due to the missing of data. The last row of the table indicates how the factorial contribution for each factor in this study is calculated from the differences between corresponding experiments.
Extended Data Table 3.
Summary of the eight terrestrial biosphere models in NMIP2 used in this study
Some of the models failed to finish all experiments, which were indicated in the last column. Soil NH3 volatilization of LPX-Bern was excluded from the integration of NMIP2 and CEDS since it failed to show factor contributions. Soil NOx emissions simulated by ISAM was also excluded due to the unreasonably high magnitude. The number of models that we finally used to drive GEOS-Chem model for the corresponding variable was indicated in the top row.
CEDS inventory
The CEDS inventory was generated by integrating existing global, regional and country-specific inventories with a consistent and reproducible methodology, representing monthly grid-level anthropogenic emissions of chemically reactive gases (for example, carbon monoxide (CO), NH3, NOx, sulfur dioxide and non-methane volatile organic compounds), carbonaceous aerosols (black carbon and organic carbon) and greenhouse gases (CO2, CH4 and N2O) from 1750 to present day (updating to the latest year)32. For each gas or aerosol, the anthropogenic emissions were divided into eight sectors, including non-combustion agricultural, energy transformation and extraction, industrial combustion, residential, international shipping, solvents, transportation and waste disposal. Here we accessed the CEDS data from a postprocessed version by GEOS-Chem support team, which made several modifications to fit the GEOS-Chem configurations (http://wiki.seas.harvard.edu/geos-chem/index.php/CEDS_anthropogenic_emissions).
Integration of Nr emission data
The effect of anthropogenic fertilization, manure application, N deposition, irrigation, LUC, CO2 elevation and climate changes on simulations of NBP, N2O and NOx in the NMIP2 ensemble are quantified on the basis of the differences among a series of sensitivity experiments (Extended Data Table 2). The contribution of LUC is quantified by the difference between the SH12 and SH11 experiment (rather than differences between SH1 and SH6) to avoid the confounding effects from changes in fertilizer and manure application. N2O and NBP fluxes are accessible for all of the eight NMIP2 members, whereas the NOx flux is only available with CLASSIC, OCN and ORCHIDEE (Extended Data Table 3).
The NH3 emission estimate of 39.0 TgN yr−1 by the NMIP2 ensemble, which accounts for agricultural NH3 soil emissions but not those emissions from livestock manure, is close to the CEDS agricultural NH3 emissions (38.2 TgN yr−1) for the year 2019. However, the large intermodel variability (Supplementary Fig. 1d) makes the direct use of these simulations to quantify the anthropogenic effect susceptible to biases in individual models. Therefore, we retained the original CEDS agricultural NH3 emission in this study and attribute soil NH3 emission changes by first applying a fixed ratio (48%) on the total agricultural NH3 emissions in 2019, whereas the rest (52%) is led by livestock according to ref. 35 and then scaling the anthropogenic Nr influence on soil NH3 emissions according to the temporal evolution of soil NH3 emissions in the NMIP2 ensemble.
Finally, we integrated the CEDS anthropogenic inventory and NMIP2 multimodel data to represent the anthropogenic Nr emissions. Anthropogenic emissions from fossil fuel combustion were taken as the sum of all sectors in CEDS inventory, except for the agricultural emissions. Besides fossil fuel combustion and soil Nr emissions, we examined the biomass burning emissions of Nr based on ref. 49. This dataset was used to provide the historical biomass burning emissions in CMIP6 from 1850 to 2015 and showed similar magnitude and variabilities as GFED4.1 inventory in the past decades. The historical annual biomass burning N2O emissions were used to establish N2O box model (see below). However, because the biomass burning emissions of NOx and NH3 showed little differences between the present day and pre-industrial period, here we neglected such differences and used the same present-day biomass burning emissions in all the GEOS-Chem experiments.
CO2, N2O and CH4 box models
To estimate the effects of anthropogenic Nr on atmospheric CO2 concentrations, we used atmospheric box models based on the framework of ref. 9. The changes in atmospheric CO2 concentrations induced by anthropogenic Nr effects on terrestrial carbon fluxes were represented by:
| 1 |
where indicates changes in atmospheric CO2 concentrations (ppmv) from 1850 to 2019 because of anthropogenic Nr. The accumulated NBP induced by fertilizer and manure applications and N deposition during 1850–2019 was calculated from NMIP2 ensemble mean (Extended Data Table 2). The was 2.12 PgC ppmv−1 following ref. 50. The partitioning constant α accounting for the ocean-borne fraction of atmospheric CO2 increase was determined to be 0.61 given the historical (1850–2019) increases in the atmosphere (235 PgC) and ocean (150 PgC) carbon estimated from the global carbon budget29.
The N2O box model was also based on ref. 9:
| 2 |
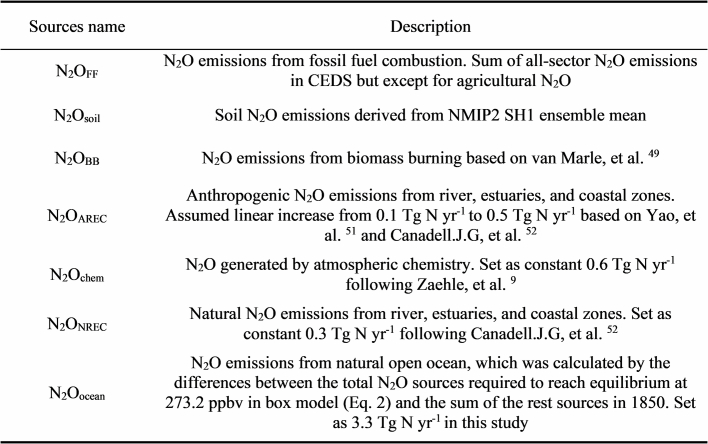
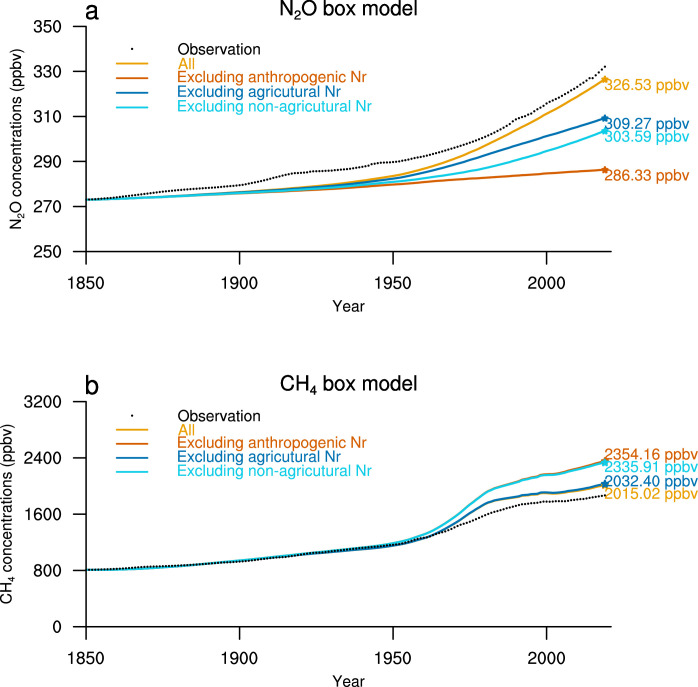
where the was the annual increasing rate of atmospheric N2O concentrations at the yr year. N2O sources from fossil fuel (FF) combustion, soil, biomass burning (BB), anthropogenic emissions from river, estuaries and coastal zones (AREC), atmospheric chemistry, natural emissions from river, estuaries and coastal zones (NREC) as well as open ocean were summarized in Extended Data Table 4 (refs. 9,49,51,52). The was set as 4.8 TgN ppbv−1 following ref. 9. The [N2O]yr indicated the surface atmospheric N2O concentrations at the yr year and was the perturbation lifetime of atmospheric N2O, taken as 116 years (ref. 52). The simulated global surface N2O concentrations were shown in Extended Data Fig. 5a.
Extended Data Table 4.
Summary of N2O sources applied in the box model
Summary of N2O sources applied in the box model. All N2O fluxes represented an annual time series from 1850 to 2019
All N2O fluxes represented an annual time series from 1850 to 2019.
Extended Data Fig. 5. Global N2O and CH4 concentrations during 1850–2019 based on the box models.
a N2O concentration; and b CH4 concentration. The black dots indicate the historical annual N2O and CH4 concentrations, as observed from ice core, firn and atmospheric measurements101. Lines with different colors represent the different SSP scenarios. Concentration values indicate the global mean concentration in the year of 2019 derived from the box models.
We used a CH4 box model described by ref. 53 to examine the effects of changes in NOx emissions on CH4 concentrations due to changed atmospheric OH concentrations:
| 3 |
where [CH4]yr indicated the global mean CH4 concentrations at the yr year. was the total CH4 emissions at the yr year, which was calculated by summing CH4 emissions by anthropogenic activities based on CEDS inventory, biomass burning emissions based on ref. 49 and natural sources with an estimate of 230 Tg yr−1. The was set as 2.78 Tg ppb−1 (ref. 54). The CH4 lifetime was estimated by:
| 4 |
where , and were set as constant numbers of 120, 150 and 200 years, respectively, to represent CH4 lifetime led by stratospheric loss, soil uptake and tropospheric chlorine reactions. Parameter was the CH4 lifetime due to the OH oxidation, which was calculated by:
| 5 |
where and were the references of CH4 lifetime and concentrations. Here we selected the year of 2005 as the reference year with of 11.17 years and of 1,783.36 ppb. The sensitivity factor SOH was −0.31 following ref. 55. , SCO and SVOC were set as 0.0042 (Tg[N] yr−1)−1, −0.000105 (Tg[CO] yr−1)−1 and −0.000315 (Tg[VOC] yr−1)−1, respectively, following Table 4.11 of ref. 56. The emission changes in NOx (), CO () and volatile organic compounds (VOC) (), which included changes in anthropogenic emissions from CEDS and biomass burning emissions from ref. 49, were calculated by the differences between the yr year and the reference year (2005), respectively. The temperature effects on atmospheric CH4 loss rates were expressed by multiplying factor ST of 0.0316 K−1 (ref. 56) and changes in global surface mean temperature relative to the reference year (2005). The simulated global mean surface CH4 concentrations were shown in Extended Data Fig. 5b.
The GEOS-Chem-RRTMG model and sensitivity experiments
We used the state-of-art global three-dimensional chemical transport model GEOS-Chem (v.12.0.0) with a fully coupled NOx–Ox–hydrocarbon–aerosol chemistry mechanism57–60 to simulate NH3 and NOx concentration and associated aerosol loadings and O3 at a horizontal resolution of 2° latitude 2.5° longitude and a vertical resolution of 47 layers from surface to 0.1 hPa level. The photolysis rates were computed by Fast-JX scheme58. Aerosol concentrations were calculated online by the ISORROPIA II package61. Version two of modern era retrospective-analysis for research and application (MERRA2) assimilated meteorological data was used to drive the GEOS-Chem model. Atmospheric concentrations of the long-lived greenhouse gases CO2, CH4 and N2O were derived from simple atmospheric box models (see above). On the basis of the simulated concentrations of tracers, we diagnosed direct radiative forcing of Nr-related compounds using the offline RRTMG in GEOS-Chem62. The annual-mean direct radiative forcing in the year 2019 was estimated from a year-long simulation after a 6 month spin-up period. In particular, GEOS-Chem fully considers the nonlinearity of inorganic aerosol chemistry, in which sulfate aerosol has higher priority than nitrate aerosol in aerosol formation when ammonia gas is limited in the atmosphere. Changes in the atmospheric NOx loading can also affect oxidation of sulfur dioxide by perturbating atmospheric oxidants, such as O3 and OH. As a result, the sulfate aerosol loadings could also be perturbed by changes in NOx emissions, despite the fact that the sulfur dioxide emissions are identical in all our experiments. We thus use the sum of direct radiative forcing of ammonium (NH4+), nitrate (NO3−) and sulfate (SO42−) aerosols to represent the aerosol climate effects induced by anthropogenic Nr.
We designed four sensitivity experiments to isolate the anthropogenic Nr effects on climate, in which each experiment was driven by the same meteorological forcing but with different NH3 and NOx emissions as well as CO2, N2O and CH4 concentrations. The NH3 and NOx emissions in each experiment are given in Extended Data Fig. 3, whereas CO2, N2O and CH4 concentrations were summarized in Extended Data Table 1. An extra sensitivity experiment, which followed No_nonagriNr run but assumed CH4 concentrations as in the CTRL run, was designed to quantify the effect of changes in CH4 concentrations on the radiative forcing of N2O due to non-agricultural emission changes. We estimated the uncertainty in the radiative forcing estimates by propagating the variation across NMIP2 ensemble projections into atmospheric concentrations and thus radiative forcing. The full uncertainty analysis and uncertainty discussions are detailed in the Supplementary Information and rely on refs. 9–11,18,28,32–35,52,62–95.
Linear extrapolation of climate effects under the SSP scenarios
We extrapolated the future climate effects due to changes in anthropogenic Nr under three representative SSP scenarios (SSP 1-2.6, 3-7.0 and 5-8.5). The future fossil fuel emissions and N deposition were from the input4MIPs dataset (https://esgf-data.dkrz.de/projects/input4mips-dkrz/). Future fertilizer and manure applications were based on the IMAGE predictions until 205096. To maintain consistency in this study, the future Nr-related sources were scaled to 2019 levels for each dataset (Extended Data Fig. 4). Because the future fossil-fuel-based emission of N2O is not included in input4MIPs, the future development of this source of N2O was scaled to the future development of fossil-fuel-based NOx.
To estimate the magnitude of climate effects of anthropogenic Nr under the SSP scenarios, we built a simple linear framework based on the following assumptions. (1) The change in radiative forcing of atmospheric greenhouse gas attributable to Nr-related changes was linearly related to their change in atmospheric concentrations, whereas the direct radiative forcing of short-lived gases or aerosols was linearly related to the total emissions of precursors11,97,98 at the corresponding year. (2) The effects of anthropogenic Nr on soil–gas fluxes were linearly determined by anthropogenic Nr addition, including both fertilizer/manure application and N deposition. Then a simple model was established based on the GEOS-Chem diagnosed direct radiative forcing of individual compound to calculate the radiative forcing relative to 1850:
| 6 |
| 7 |
| 8 |
| 9 |
| 10 |
Where the RF_Nr_CO2 yr, RF_Nr_N2Oyr, RF_Nr_CH4 yr, RF_Nr_aerosolyr and RF_Nr_O3 yr represent the direct radiative forcing associated with anthropogenic Nr of each gas at the yr year relative to 1850. The values in 2019 were derived from the differences between CTRL_2019 and No_allNr experiments (−0.12 W m−2, +0.16 W m−2, −0.19 W m−2, −0.24 W m−2 and +0.05 W m−2, respectively; Fig. 3). The sensitivities (, and ) of radiative forcing to greenhouse gas concentrations were derived from the other eight GEOS-Chem sensitivity experiments (Supplementary Information Section 1.3 and Supplementary Table 2).
In particular, we calculated the reduction effect as follows:
NBPfertilizer,yr, NBPmanure,yr and NBPNdep,yr represented the NBP contributed by fertilizer, manure and N deposition in the yr year, which is calculated by multiplying the NMIP2 ensemble mean present-day (average of 2015–2019) contributions and the corresponding scaling factors in Extended Data Fig. 4.
The N2O and CH4 concentrations in the yr year ( and ) were derived by the simple N2O and CH4 box models (equation (2) and equations (3)–(5) starting from (N2O concentrations in CTRL_2019 experiments) and (CH4 concentrations in CTRL_2019 experiments), respectively. N2O (in N2O box model) and NOx (in CH4 box model) emissions from both fossil fuel combustion and anthropogenic Nr-induced soil emissions were reduced relative to emissions in 2019 with the scaling factors accordingly (Extended Data Fig. 4), whereas the other sources were kept the same as 2019.
For short-lived compounds (aerosols and O3), NOx yr (or NH3 yr) indicated the NOx (or NH3) emissions from both fossil fuel and soil by applying the scaling factors on each sector (Extended Data Fig. 4) in the yr year.
Online content
Any methods, additional references, Nature Portfolio reporting summaries, source data, extended data, supplementary information, acknowledgements, peer review information; details of author contributions and competing interests; and statements of data and code availability are available at 10.1038/s41586-024-07714-4.
Supplementary information
Supplementary Sections 1–3, Tables 1–5, Figs. 1–5 and reference. Supplementary Section 1 introduces the methods to assess the uncertainty ranges in the climate effects of anthropogenic Nr; Section 2 discusses the main uncertainties in this study; and Section 3 compares our estimates on each Nr-related facet with previous individual studies.
Acknowledgements
C.G. and S.Z. acknowledge support from the European Commission H2020 programme (grant no. 101003536; ESM2025). H.T. and N.P. acknowledge funding support from the US National Science Foundation (grant no. 1903722) and USDA CBG project no. TENX12899. S.P. acknowledges funding support from the US National Science Foundation (grant no. 1922687) and the US Department of the Treasury (grant no. DISL-MESC-ALCOE-06). A.I. acknowledges support from the JSPS KAKENHI (grant no. 21H05318). Q.Z. is supported by Reducing Uncertainties in Biogeochemical Interactions through Synthesis and Computation (RUBISCO) Scientific Focus Area, Office of Biological and Environmental Research of the US Department of Energy Office of Science. C.G. and S.Z. thank D. Olivié and colleagues for help in building the CH4 box model (https://zenodo.org/records/5293940)53.
Extended data figures and tables
Author contributions
C.G. and S.Z. designed the study. C.G. performed the GEOS-Chem simulations and data analysis. H.L. assisted the GEOS-Chem simulation. H.T., N.P. and S.P. led the NMIP2 projects. H.T., N.P., S.P., A.I., A.K.J., S.K.-G., F.J., Q.S., H.S., N.V., Q.Z., C.P., F.M., F.H.M.T. and S.Z. together contributed to the simulation of terrestrial biosphere models in NMIP2. C.G. and S.Z. wrote the manuscript. All authors contributed to reviewing or editing the manuscript.
Peer review
Peer review information
Nature thanks Klaus Butterbach-Bahl, David Pelster and the other, anonymous, reviewer(s) for their contribution to the peer review of this work. Peer reviewer reports are available.
Funding
Open access funding provided by Max Planck Society.
Data availability
The CEDS inventory used in GEOS-Chem can be downloaded at https://ftp.as.harvard.edu/gcgrid/data/ExtData/HEMCO/CEDS/. The NMIP2 model outputs and the GEOS-Chem outputs in this study are available at Zenodo (10.5281/zenodo.10032973)99. The base maps in all figures are based on the default global map in the NCAR Command Language (NCL).
Code availability
The GEOS-Chem-RRTMG source codes can be accessed at https://github.com/geoschem/geos-chem. Data analysis and visualization are conducted by NCL. Scripts are available at Zenodo (10.5281/zenodo.11179126)100.
Competing interests
The authors declare no competing interests.
Footnotes
Publisher’s note Springer Nature remains neutral with regard to jurisdictional claims in published maps and institutional affiliations.
Extended data
is available for this paper at 10.1038/s41586-024-07714-4.
Supplementary information
The online version contains supplementary material available at 10.1038/s41586-024-07714-4.
References
- 1.Fowler, D. et al. The global nitrogen cycle in the twenty-first century. Phil. Trans. R. Soc. B368, 20130164 (2013). [DOI] [PMC free article] [PubMed] [Google Scholar]
- 2.Gruber, N. & Galloway, J. N. An Earth-system perspective of the global nitrogen cycle. Nature451, 293–296 (2008). [DOI] [PubMed] [Google Scholar]
- 3.Galloway, J. N. et al. Transformation of the nitrogen cycle: recent trends, questions and potential solutions. Science320, 889–892 (2008). [DOI] [PubMed] [Google Scholar]
- 4.Bodirsky, B. L. et al. Reactive nitrogen requirements to feed the world in 2050 and potential to mitigate nitrogen pollution. Nat. Commun.5, 3858 (2014). [DOI] [PubMed] [Google Scholar]
- 5.Liu, M. et al. Ammonia emission control in China would mitigate haze pollution and nitrogen deposition, but worsen acid rain. Proc. Natl. Acad. Sci. USA116, 7760–7765 (2019). [DOI] [PMC free article] [PubMed] [Google Scholar]
- 6.Dodds, W. K. & Smith, V. H. Nitrogen, phosphorus and eutrophication in streams. Inland Waters6, 155–164 (2016). [Google Scholar]
- 7.Humbert, J. Y., Dwyer, J. M., Andrey, A. & Arlettaz, R. Impacts of nitrogen addition on plant biodiversity in mountain grasslands depend on dose, application duration and climate: a systematic review. Glob. Change Biol.22, 110–120 (2016). [DOI] [PubMed] [Google Scholar]
- 8.Stocker, B. D. et al. Multiple greenhouse-gas feedbacks from the land biosphere under future climate change scenarios. Nat. Clim. Change3, 666–672 (2013). [Google Scholar]
- 9.Zaehle, S., Ciais, P., Friend, A. D. & Prieur, V. Carbon benefits of anthropogenic reactive nitrogen offset by nitrous oxide emissions. Nat. Geosci.4, 601–605 (2011). [Google Scholar]
- 10.Hauglustaine, D. A., Balkanski, Y. & Schulz, M. A global model simulation of present and future nitrate aerosols and their direct radiative forcing of climate. Atmos. Chem. Phys.14, 11031–11063 (2014). [Google Scholar]
- 11.Thornhill, G. D. et al. Effective radiative forcing from emissions of reactive gases and aerosols—a multi-model comparison. Atmos. Chem. Phys.21, 853–874 (2021). [Google Scholar]
- 12.Peng, S. et al. Wetland emission and atmospheric sink changes explain methane growth in 2020. Nature612, 477–482 (2022). [DOI] [PubMed] [Google Scholar]
- 13.Lu, X. et al. The underappreciated role of agricultural soil nitrogen oxide emissions in ozone pollution regulation in North China. Nat. Commun.12, 5021 (2021). [DOI] [PMC free article] [PubMed] [Google Scholar]
- 14.Reay, D. S., Dentener, F., Smith, P., Grace, J. & Feely, R. A. Global nitrogen deposition and carbon sinks. Nat. Geosci.1, 430–437 (2008). [Google Scholar]
- 15.Fleischer, K. et al. The contribution of nitrogen deposition to the photosynthetic capacity of forests. Glob. Biogeochem. Cycles27, 187–199 (2013). [Google Scholar]
- 16.Derwent, R. G. et al. Radiative forcing from surface NOx emissions: spatial and seasonal variations. Clim. Change88, 385–401 (2008). [Google Scholar]
- 17.Allen, M. R. et al. New use of global warming potentials to compare cumulative and short-lived climate pollutants. Nat. Clim. Change6, 773–776 (2016). [Google Scholar]
- 18.Erisman, J. W., Galloway, J., Seitzinger, S., Bleeker, A. & Butterbach-Bahl, K. Reactive nitrogen in the environment and its effect on climate change. Curr. Opin. Environ. Sustain.3, 281–290 (2011). [Google Scholar]
- 19.Pinder, R. W. et al. Climate change impacts of US reactive nitrogen. Proc. Natl. Acad. Sci. USA109, 7671–7675 (2012). [DOI] [PMC free article] [PubMed] [Google Scholar]
- 20.Butterbach-Bahl, K. et al. in The European Nitrogen Assessment: Sources, Effects and Policy Perspectives (eds Bleeker, A. et al.) 434–462 (Cambridge Univ. Press, 2011).
- 21.Shi, Y., Cui, S., Ju, X., Cai, Z. & Zhu, Y. Impacts of reactive nitrogen on climate change in China. Sci. Rep.5, 8118 (2015). [DOI] [PMC free article] [PubMed] [Google Scholar]
- 22.Gong, C., Kou-Giesbrecht, S. & Zaehle, S. Anthropogenic-driven perturbations on nitrogen cycles and interactions with climate changes. Curr. Opin. Green Sustain. Chem.46, 100897 (2024). [Google Scholar]
- 23.Martin, S. T. et al. Effects of the physical state of tropospheric ammonium-sulfate-nitrate particles on global aerosol direct radiative forcing. Atmos. Chem. Phys.4, 183–214 (2004). [Google Scholar]
- 24.Ma, R. et al. Data-driven estimates of fertilizer-induced soil NH3, NO and N2O emissions from croplands in China and their climate change impacts. Glob. Change Biol.28, 1008–1022 (2022). [DOI] [PubMed] [Google Scholar]
- 25.Li, J. et al. Spatiotemporal variability of fire effects on soil carbon and nitrogen: a global meta-analysis. Glob. Change Biol.27, 4196–4206 (2021). [DOI] [PubMed] [Google Scholar]
- 26.Arneth, A. et al. Terrestrial biogeochemical feedbacks in the climate system. Nat. Geosci.3, 525–532 (2010). [Google Scholar]
- 27.Meyerholt, J., Sickel, K. & Zaehle, S. Ensemble projections elucidate effects of uncertainty in terrestrial nitrogen limitation on future carbon uptake. Glob. Change Biol.26, 3978–3996 (2020). [DOI] [PubMed] [Google Scholar]
- 28.Tian, H. et al. Global nitrous oxide budget 1980–2020. Earth Syst. Sci. Data Discuss.2023, 1–98 (2023). [Google Scholar]
- 29.Friedlingstein, P. et al. Global carbon budget 2021. Earth Syst. Sci. Data14, 1917–2005 (2022). [Google Scholar]
- 30.Tian, H. et al. A comprehensive quantification of global nitrous oxide sources and sinks. Nature586, 248–256 (2020). [DOI] [PubMed] [Google Scholar]
- 31.Weng, H. et al. Global high-resolution emissions of soil NOx, sea salt aerosols and biogenic volatile organic compounds. Sci. Data7, 148 (2020). [DOI] [PMC free article] [PubMed] [Google Scholar]
- 32.McDuffie, E. E. et al. A global anthropogenic emission inventory of atmospheric pollutants from sector- and fuel-specific sources (1970–2017): an application of the Community Emissions Data System (CEDS). Earth Syst. Sci. Data12, 3413–3442 (2020). [Google Scholar]
- 33.Evangeliou, N. et al. 10-year satellite-constrained fluxes of ammonia improve performance of chemistry transport models. Atmos. Chem. Phys.21, 4431–4451 (2021). [Google Scholar]
- 34.Luo, Z. et al. Estimating global ammonia (NH3) emissions based on IASI observations from 2008 to 2018. Atmos. Chem. Phys.22, 10375–10388 (2022). [Google Scholar]
- 35.Liu, L. et al. Exploring global changes in agricultural ammonia emissions and their contribution to nitrogen deposition since 1980. Proc. Natl. Acad. Sci. USA119, e2121998119 (2022). [DOI] [PMC free article] [PubMed] [Google Scholar]
- 36.Etminan, M., Myhre, G., Highwood, E. J. & Shine, K. P. Radiative forcing of carbon dioxide, methane and nitrous oxide: a significant revision of the methane radiative forcing. Geophys. Res. Lett.43, 12614–12623 (2016). [Google Scholar]
- 37.Li, F. et al. Global water use efficiency saturation due to increased vapor pressure deficit. Science381, 672–677 (2023). [DOI] [PubMed] [Google Scholar]
- 38.Zhang, L. et al. Nitrogen deposition to the United States: distribution, sources and processes. Atmos. Chem. Phys.12, 4539–4554 (2012). [Google Scholar]
- 39.Travis, K. R. et al. Why do models overestimate surface ozone in the Southeast United States? Atmos. Chem. Phys.16, 13561–13577 (2016). [DOI] [PMC free article] [PubMed] [Google Scholar]
- 40.Dutta, I. & Heald, C. L. Exploring deposition observations of oxidized sulfur and nitrogen as a constraint on emissions in the United States. J. Geophys. Res. Atmos.128, e2023JD039610 (2023).
- 41.Kroll, J. H., Ng, N. L., Murphy, S. M., Flagan, R. C. & Seinfeld, J. H. Secondary organic aerosol formation from isoprene photooxidation. Environ. Sci. Technol.40, 1869–1877 (2006). [DOI] [PubMed] [Google Scholar]
- 42.Ng, N. L. et al. Effect of NOx level on secondary organic aerosol (SOA) formation from the photooxidation of terpenes. Atmos. Chem. Phys.7, 5159–5174 (2007). [Google Scholar]
- 43.Ng, N. L. et al. Secondary organic aerosol formation from m-xylene, toluene and benzene. Atmos. Chem. Phys.7, 3909–3922 (2007). [Google Scholar]
- 44.Harris, I., Osborn, T. J., Jones, P. & Lister, D. Version 4 of the CRU TS monthly high-resolution gridded multivariate climate dataset. Sci. Data7, 109 (2020). [DOI] [PMC free article] [PubMed] [Google Scholar]
- 45.Tian, H. et al. History of anthropogenic nitrogen inputs (HaNi) to the terrestrial biosphere: a 5 arcmin resolution annual dataset from 1860 to 2019. Earth Syst. Sci. Data14, 4551–4568 (2022). [Google Scholar]
- 46.Lu, C. & Tian, H. Global nitrogen and phosphorus fertilizer use for agriculture production in the past half century: shifted hot spots and nutrient imbalance. Earth Syst. Sci. Data9, 181–192 (2017). [Google Scholar]
- 47.Hurtt, G. C. et al. Harmonization of global land use change and management for the period 850–2100 (LUH2) for CMIP6. Geosci. Model Dev.13, 5425–5464 (2020). [Google Scholar]
- 48.Tian, H. et al. Global soil nitrous oxide emissions since the preindustrial era estimated by an ensemble of terrestrial biosphere models: magnitude, attribution and uncertainty. Glob. Change Biol.25, 640–659 (2019). [DOI] [PubMed] [Google Scholar]
- 49.van Marle, M. J. E. et al. Historic global biomass burning emissions for CMIP6 (BB4CMIP) based on merging satellite observations with proxies and fire models (1750–2015). Geosci. Model Dev.10, 3329–3357 (2017). [Google Scholar]
- 50.Ballantyne, A. P., Alden, C. B., Miller, J. B., Tans, P. P. & White, J. W. C. Increase in observed net carbon dioxide uptake by land and oceans during the past 50 years. Nature488, 70–72 (2012). [DOI] [PubMed] [Google Scholar]
- 51.Yao, Y. et al. Increased global nitrous oxide emissions from streams and rivers in the Anthropocene. Nat. Clim. Change10, 138–142 (2020).
- 52.Canadell, J. G. et al. in Climate Change 2021: The Physical Science Basis (eds Masson-Delmotte, V. et al.) 673–816 (Cambridge Univ. Press, 2021).
- 53.Olivié, D., Höglund-Isaksson, L., Klimont, Z. & von Salzen, K. Box model for calculation of global atmospheric methane concentration. Zenodo 10.5281/zenodo.5293940 (2021).
- 54.IPCC. AR4 Climate Change 2007: The Physical Science Basis (eds Solomon, S. et al.) (Cambridge Univ. Press, 2007).
- 55.IPCC. Climate Change 2013: The Physical Science Basis (eds Stocker, T. F. et al.) (Cambridge Univ. Press, 2013).
- 56.IPCC. Climate Change 2001: The Scientific Basis (eds Houghton, J. T. et al.) (Cambridge Univ. Press 2001).
- 57.Bey, I. et al. Global modeling of tropospheric chemistry with assimilated meteorology: model description and evaluation. J. Geophys. Res. Atmos.106, 23073–23095 (2001). [Google Scholar]
- 58.Park, R. J., Jacob, D. J., Field, B. D., Yantosca, R. M. & Chin, M. Natural and transboundary pollution influences on sulfate-nitrate-ammonium aerosols in the United States: implications for policy. J. Geophys. Res. Atmos.10.1029/2003jd004473 (2004).
- 59.van Donkelaar, A. et al. Global estimates of ambient fine particulate matter concentrations from satellite-based aerosol optical depth: development and application. Environ. Health Perspect.118, 847–855 (2010). [DOI] [PMC free article] [PubMed] [Google Scholar]
- 60.Li, K. et al. Anthropogenic drivers of 2013–2017 trends in summer surface ozone in China. Proc. Natl. Acad. Sci. USA116, 422–427 (2019). [DOI] [PMC free article] [PubMed] [Google Scholar]
- 61.Fountoukis, C. & Nenes, A. ISORROPIA II: a computationally efficient thermodynamic equilibrium model for K+–Ca2+–Mg2+–NH4+–Na+–SO42−–NO3−–Cl−–H2O aerosols. Atmos. Chem. Phys.7, 4639–4659 (2007). [Google Scholar]
- 62.Heald, C. L. et al. Contrasting the direct radiative effect and direct radiative forcing of aerosols. Atmos. Chem. Phys.14, 5513–5527 (2014). [Google Scholar]
- 63.Jena, C. et al. Inter-comparison of different NOx emission inventories and associated variation in simulated surface ozone in Indian region. Atmos. Environ.117, 61–73 (2015). [Google Scholar]
- 64.Ding, J. et al. Intercomparison of NOx emission inventories over East Asia. Atmos. Chem. Phys.17, 10125–10141 (2017). [Google Scholar]
- 65.Murray, L. T., Fiore, A. M., Shindell, D. T., Naik, V. & Horowitz, L. W. Large uncertainties in global hydroxyl projections tied to fate of reactive nitrogen and carbon. Proc. Natl. Acad. Sci. USA118, e2115204118 (2021). [DOI] [PMC free article] [PubMed] [Google Scholar]
- 66.Szopa, S. V. et al. in Climate Change 2021: The Physical Science Basis (eds Masson-Delmotte, V. et al.) 817–922 (Cambridge Univ. Press, 2021).
- 67.Liu, L. & Greaver, T. L. A review of nitrogen enrichment effects on three biogenic GHGs: the CO2 sink may be largely offset by stimulated N2O and CH4 emission. Ecol. Lett.12, 1103–1117 (2009). [DOI] [PubMed] [Google Scholar]
- 68.Zhang, X. et al. Ammonia emissions may be substantially underestimated in China. Environ. Sci. Technol.51, 12089–12096 (2017). [DOI] [PubMed] [Google Scholar]
- 69.Lessmann, M., Ros, G. H., Young, M. D. & de Vries, W. Global variation in soil carbon sequestration potential through improved cropland management. Glob. Change Biol.28, 1162–1177 (2022). [DOI] [PMC free article] [PubMed] [Google Scholar]
- 70.Ren, J., Guo, F. F. & Xie, S. D. Diagnosing ozone–NOx–VOC sensitivity and revealing causes of ozone increases in China based on 2013–2021 satellite retrievals. Atmos. Chem. Phys.22, 15035–15047 (2022). [Google Scholar]
- 71.Steudler, P. A., Bowden, R. D., Melillo, J. M. & Aber, J. D. Influence of nitrogen-fertilization on methane uptake in temperate forest soils. Nature341, 314–316 (1989). [Google Scholar]
- 72.Sitch, S., Cox, P. M., Collins, W. J. & Huntingford, C. Indirect radiative forcing of climate change through ozone effects on the land-carbon sink. Nature448, 791–794 (2007). [DOI] [PubMed] [Google Scholar]
- 73.Mercado, L. M. et al. Impact of changes in diffuse radiation on the global land carbon sink. Nature458, 1014–1087 (2009). [DOI] [PubMed] [Google Scholar]
- 74.Lombardozzi, D., Levis, S., Bonan, G. & Sparks, J. P. Predicting photosynthesis and transpiration responses to ozone: decoupling modeled photosynthesis and stomatal conductance. Biogeosciences9, 3113–3130 (2012). [Google Scholar]
- 75.Simon, H., Reff, A., Wells, B., Xing, J. & Frank, N. Ozone trends across the United States over a period of decreasing NOx and VOC emissions. Environ. Sci. Technol.49, 186–195 (2015). [DOI] [PubMed] [Google Scholar]
- 76.Yue, X. & Unger, N. The Yale Interactive terrestrial Biosphere model version 1.0: description, evaluation and implementation into NASA GISS ModelE2. Geosci. Model Dev.8, 2399–2417 (2015). [Google Scholar]
- 77.Huang, X. et al. Enhanced secondary pollution offset reduction of primary emissions during COVID-19 lockdown in China. Natl. Sci. Rev.8, nwaa137 (2021). [DOI] [PMC free article] [PubMed] [Google Scholar]
- 78.Wu, M. et al. Development and evaluation of E3SM-MOSAIC: dpatial fistributions and tadiative rffects of nitrate aerosol. J. Adv. Model. Earth Syst.14, e2022MS003157 (2022). [Google Scholar]
- 79.Zhang, K. et al. Insights into the significant increase in ozone during COVID-19 in a typical urban city of China. Atmos. Chem. Phys.22, 4853–4866 (2022). [Google Scholar]
- 80.Duce, R. A. et al. Impacts of atmospheric anthropogenic nitrogen on the open ocean. Science320, 893–897 (2008). [DOI] [PubMed] [Google Scholar]
- 81.Paulot, F. et al. Global oceanic emission of ammonia: constraints from seawater and atmospheric observations. Glob. Biogeochem. Cycles29, 1165–1178 (2015). [Google Scholar]
- 82.Saunois, M. et al. The global methane budget 2000–2017. Earth Syst. Sci. Data12, 1561–1623 (2020). [Google Scholar]
- 83.Xia, N. et al. Effects of nitrogen addition on soil methane uptake in global forest biomes. Environ. Pollut.264, 114751 (2020). [DOI] [PubMed] [Google Scholar]
- 84.Li, Q., Peng, C., Zhang, J., Li, Y. & Song, X. Nitrogen addition decreases methane uptake caused by methanotroph and methanogen imbalances in a Moso bamboo forest. Sci. Rep.11, 5578 (2021). [DOI] [PMC free article] [PubMed] [Google Scholar]
- 85.Song, W., Liu, X., Houlton, B. Z. & Liu, C. Isotopic constraints confirm the significant role of microbial nitrogen oxides emissions from the land and ocean environment. Natl. Sci. Rev.9, nwac106 (2022). [DOI] [PMC free article] [PubMed] [Google Scholar]
- 86.Bian, H. et al. Investigation of global particulate nitrate from the AeroCom phase III experiment. Atmos. Chem. Phys.17, 12911–12940 (2017). [Google Scholar]
- 87.An, Q. et al. The development of an atmospheric aerosol/chemistry-climate model, BCC_AGCM_CUACE2.0 and simulated effective radiative forcing of nitrate aerosols. J. Adv. Model. Earth Syst.11, 3816–3835 (2019). [Google Scholar]
- 88.Forster, P. et al. in Climate Change 2021: The Physical Science Basis (eds Masson-Delmotte, V. et al.) 923–1054 (Cambridge Univ. Press, 2021).
- 89.Zaveri, R. A. et al. Development and evaluation of chemistry-aerosol-climate model CAM5-Chem-MAM7-MOSAIC: global atmospheric distribution and radiative effects of nitrate aerosol. J. Adv. Model. Earth Syst.13, e2020MS002346 (2021). [DOI] [PMC free article] [PubMed] [Google Scholar]
- 90.Schulte-Uebbing, L. F., Ros, G. H. & de Vries, W. Experimental evidence shows minor contribution of nitrogen deposition to global forest carbon sequestration. Glob. Change Biol.28, 899–917 (2022). [DOI] [PMC free article] [PubMed] [Google Scholar]
- 91.Kou-Giesbrecht, S. et al. Evaluating nitrogen cycling in terrestrial biosphere models: a disconnect between the carbon and nitrogen cycles. Earth Syst. Dynam.14, 767–795 (2023). [Google Scholar]
- 92.Wang, Y. & Meyer, T. J. A route to renewable energy triggered by the Haber–Bosch process. Chem5, 496–497 (2019). [Google Scholar]
- 93.Peng, Y., Chen, H. Y. H. & Yang, Y. Global pattern and drivers of nitrogen saturation threshold of grassland productivity. Func. Ecol.34, 1979–1990 (2020). [Google Scholar]
- 94.He, N. et al. Global patterns of nitrogen saturation in forests. Preprint at 10.21203/rs.3.rs-3559857/v1 (2023).
- 95.Schulte-Uebbing, L. F., Beusen, A. H. W., Bouwman, A. F. & de Vries, W. From planetary to regional boundaries for agricultural nitrogen pollution. Nature610, 507–512 (2022). [DOI] [PubMed] [Google Scholar]
- 96.Mogollon, J. M. et al. Assessing future reactive nitrogen inputs into global croplands based on the shared socioeconomic pathways. Environ. Res. Lett. 13, 044008 (2018).
- 97.Unger, N., Shindell, D. T., Koch, D. M. & Streets, D. G. Air pollution radiative forcing from specific emissions sectors at 2030. J. Geophys. Res. Atmos.10.1029/2007jd008683 (2008).
- 98.Chen, Y. J. et al. Investigating the linear dependence of direct and indirect radiative forcing on emission of carbonaceous aerosols in a global climate model. J. Geophys. Res. Atmos.123, 1657–1672 (2018). [Google Scholar]
- 99.Gong, C. Data for ‘Global net climate effects of anthropogenic reactive nitrogen’. Zenodo 10.5281/zenodo.10032973 (2024). [DOI] [PMC free article] [PubMed]
- 100.Gong, C. Scripts for ‘Global net climate effects of anthropogenic reactive nitrogen’. Zenodo 10.5281/zenodo.11179127 (2024). [DOI] [PMC free article] [PubMed]
- 101.Meinshausen, M. et al. Historical greenhouse gas concentrations for climate modelling (CMIP6). Geosci. Model Dev.10, 2057–2116 (2017). [Google Scholar]
Associated Data
This section collects any data citations, data availability statements, or supplementary materials included in this article.
Supplementary Materials
Supplementary Sections 1–3, Tables 1–5, Figs. 1–5 and reference. Supplementary Section 1 introduces the methods to assess the uncertainty ranges in the climate effects of anthropogenic Nr; Section 2 discusses the main uncertainties in this study; and Section 3 compares our estimates on each Nr-related facet with previous individual studies.
Data Availability Statement
The CEDS inventory used in GEOS-Chem can be downloaded at https://ftp.as.harvard.edu/gcgrid/data/ExtData/HEMCO/CEDS/. The NMIP2 model outputs and the GEOS-Chem outputs in this study are available at Zenodo (10.5281/zenodo.10032973)99. The base maps in all figures are based on the default global map in the NCAR Command Language (NCL).
The GEOS-Chem-RRTMG source codes can be accessed at https://github.com/geoschem/geos-chem. Data analysis and visualization are conducted by NCL. Scripts are available at Zenodo (10.5281/zenodo.11179126)100.


