

Abstract
This study investigated the usefulness of deep learning-based automatic detection of temporomandibular joint (TMJ) effusion using magnetic resonance imaging (MRI) in patients with temporomandibular disorder and whether the diagnostic accuracy of the model improved when patients’ clinical information was provided in addition to MRI images. The sagittal MR images of 2948 TMJs were collected from 1017 women and 457 men (mean age 37.19 ± 18.64 years). The TMJ effusion diagnostic performances of three convolutional neural networks (scratch, fine-tuning, and freeze schemes) were compared with those of human experts based on areas under the curve (AUCs) and diagnosis accuracies. The fine-tuning model with proton density (PD) images showed acceptable prediction performance (AUC = 0.7895), and the from-scratch (0.6193) and freeze (0.6149) models showed lower performances (p < 0.05). The fine-tuning model had excellent specificity compared to the human experts (87.25% vs. 58.17%). However, the human experts were superior in sensitivity (80.00% vs. 57.43%) (all p < 0.001). In gradient-weighted class activation mapping (Grad-CAM) visualizations, the fine-tuning scheme focused more on effusion than on other structures of the TMJ, and the sparsity was higher than that of the from-scratch scheme (82.40% vs. 49.83%, p < 0.05). The Grad-CAM visualizations agreed with the model learned through important features in the TMJ area, particularly around the articular disc. Two fine-tuning models on PD and T2-weighted images showed that the diagnostic performance did not improve compared with using PD alone (p < 0.05). Diverse AUCs were observed across each group when the patients were divided according to age (0.7083–0.8375) and sex (male:0.7576, female:0.7083). The prediction accuracy of the ensemble model was higher than that of the human experts when all the data were used (74.21% vs. 67.71%, p < 0.05). A deep neural network (DNN) was developed to process multimodal data, including MRI and patient clinical data. Analysis of four age groups with the DNN model showed that the 41–60 age group had the best performance (AUC = 0.8258). The fine-tuning model and DNN were optimal for judging TMJ effusion and may be used to prevent true negative cases and aid in human diagnostic performance. Assistive automated diagnostic methods have the potential to increase clinicians’ diagnostic accuracy.
Keywords: Temporomandibular joint, Temporomandibular disorder, Effusion, Artificial intelligence, Convolutional neural network, Deep learning
Subject terms: Diseases, Medical research, Risk factors
Introduction
Temporomandibular disorder (TMD), a representative musculoskeletal disease of the orofacial area, is an umbrella term for the pain and dysfunction of the temporomandibular joint (TMJ) complex and masticatory muscles1. TMD has a multifactorial etiology, including physical, psychological, genetic, and environmental factors2. The typical symptoms of TMD are noise and pain in the TMJ and masticatory muscles and can be accompanied by restricted mandibular movement, ear pain, ear fullness, tinnitus, neck and shoulder pain, and headaches3. When TMD persists, it can cause permanent physical damage, such as malocclusion or facial asymmetry4,5, as well as psychosocial problems, such as depression, anxiety, and sleep disturbances, especially in children and adolescents6,7. TMD is common worldwide, and its overall prevalence is approximately 31% in adults and older people and 11% in children and adolescents8. TMD is 1.5–2.24 times more prevalent in women than in men9,10. Unlike other joint diseases, for which the prevalence increases with age, TMD primarily occurs in individuals aged 20–45 years11. Based on age, TMD prevalence has been shown to follow an inverted U curve12. However, the prevalence of TMJ degeneration is as high as 70% in individuals aged 65 years13. Therefore, understanding the complex sex- and age-dependent clinical characteristics of TMD requires a comprehensive approach.
The Diagnostic Criteria for Temporomandibular Disorders (DC/TMD) Axis I, an internationally used diagnostic index, includes 10 common TMD classifications14. In general, joint effusion has been suggested to indicate intra-articular inflammation in patients with internal derangement and osteoarthritis15,16. The TMJ is one of the most complex and unique joints in the body. Effusion may be related to disc displacement, degenerative joint disease, and arthralgia; however, it has not been mentioned as a major condition for judgment14. TMJ effusion typically shows high signal intensity on proton density (PD) and T2-weighted (T2W) magnetic resonance imaging (MRI)17. To date, MRI studies investigating TMJ effusion or the association between clinical signs and symptoms, including TMJ effusion and pain, have been limited. Spontaneous pain was significantly related to TMJ effusion in TMD patients; however, pain during palpation of the masticatory muscles and TMJ area was not related to TMJ effusion18. TMJ effusion was associated with articular disc displacement in the sagittal plane but not with arthralgia19. In the presence of TMJ arthritis and dental occlusal changes, particularly in the case of an ipsilateral posterior open bite, effusion may occur in the affected joint20. However, the sensitivity and specificity for TMJ arthritis with effusion have not been established.
MRI is a non-invasive imaging modality with excellent reliability and validity for analyzing soft tissues and fluids within the TMJ complex. MRI is the gold standard for evaluating the TMJ complex, disc-condylar relationship, and disc displacement. MRI is also used for hard tissue evaluation, but its reliability is poor21. Furthermore, MRI is the only imaging modality that provides direct visualization of joint effusion in vivo22. However, the evaluation of an MR image is generally subjective, and the interpretation can change depending on the interpreter’s experience and the MR sequences. Thus, it is essential to establish a standardized MRI outcome for appropriate diagnosis to ensure diagnostic repeatability and reproducibility23. Additionally, MRI interpretations fall short of showing a clear association between the reported symptoms and TMJ effusion. Thus, the correlation between clinical signs, symptoms, and imaging findings in TMD patients remains controversial.
The recent artificial intelligence (AI) revolution has improved the predictive accuracy, speed, and efficiency of medical diagnostic process. AI algorithms can automatically analyze medical images, including conventional X-rays, computed tomography (CT), cone-beam CT (CBCT), MRI, and ultrasound, to help clinicians identify and diagnose diseases more accurately and quickly24. Advancements in medical imaging modalities and technologies have played a crucial role in aiding the early detection of human diseases and reducing mortality rates. Recently, rapid progress in high throughput data analysis methods and AI technologies has accelerated concurrently25,26. Particularly, the rapid development of radiomics and deep learning techniques has led to an exponential increase in new AI-based imaging models capable of handling extensive application data27. However, AI-based automatic diagnosis of TMD remains largely within the scope of academic research. Using multimodal data based on multiple outcomes, such as patient images, text representations, and signals in complex aspects of the disease, is an optimal solution for better diagnostic decisions28. According to Richens et al., combining multiple data sources can provide a more complete picture of a patient's health, reducing the potential for misdiagnosis and increasing diagnostic accuracy29. Multimodal data can help healthcare providers better treat and manage chronic conditions, such as TMD, by monitoring the progression of the condition over time. However, no diagnostic approach for processing multimodal TMJ effusion data has been developed.
Machine learning is a subfield of AI that enables machines to learn from past data without explicit programming. The deep-learning method used in this study is a specific field of machine learning that continuously adjusts the layers of an artificial neural network30. Deep learning using convolutional neural networks (CNNs), a subclass of machine learning, is one of the most advanced AI techniques and is increasingly being applied for automatically detecting pathological features in medical images31. Therefore, attention should be paid to diagnosis in the medical field using machine learning and artificial neural networks. Assistive automated diagnostic methods can help solve the challenges of a clinical conundrum, and advance early diagnosis while reducing diagnostic delays, which, in turn, can improve patients’ quality of life32. Recently, studies on TMD diagnosis using deep learning have increased. Using panoramic radiography images, the sensitivity and specificity of the deep learning model for diagnosing TMJ osteoarthritis were equivalent to those of experts33. When using CBCT images, the area under the curve (AUC) for diagnostic accuracy of TMJ osteoarthritis was 0.8634. A fine-tuned model for articular disc displacement using MRI showed excellent predictive performance (AUC = 0.8775)35. However, few studies have performed an automatic diagnosis of effusion in TMD patients using deep learning algorithms. Because TMJ effusion is associated with pain, TMJ inflammation, and TMD progression, research on the application of AI to TMJ effusion is indispensable.
However, no AI models are available to automatically detect TMJ effusion in the MR images of patients with TMD. We hypothesized that deep learning models with superior data augmentation would outperform human clinicians in MRI readings when using the same data and help diagnose TMD. In addition, we attempted to verify the hypothesis that the accuracy of TMJ effusion diagnosis can be increased when clinical information, such as the presence or absence of TMD pain, is added to MRI information. Moreover, the developed deep learning models for TMJ effusion were used to evaluate the diagnostic performance by sex and age.
Methods
The research protocol for this study was reviewed to ensure compliance with the principles of the Declaration of Helsinki and approved by the Institutional Review Board of Kyung Hee University Dental Hospital in Seoul, South Korea (KHD IRB, IRB No-KH-DT21022). Informed consent was obtained from all the participants.
Study population
Figure 1 presents a flowchart of the present study. The study population comprised 1,474 patients with TMD (1,017 women and 457 men, mean age = 37.19 ± 18.64 years), who visited Kyung Hee University Dental Hospital between January 2017 and October 2022. A specialist with > 10 years of experience diagnosed TMD based on the criteria for TMD Axis I14. We identified the patients with TMD and retrospectively reviewed all reports and MRI scans of their TMJs.
Figure 1.
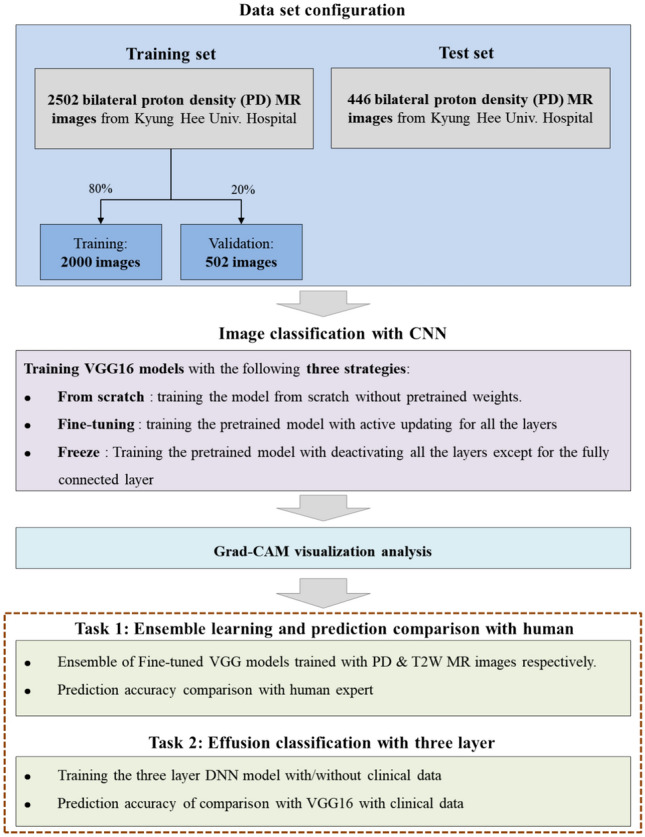
Study flowchart.
The exclusion criteria were serious previous injuries, such as unstable multiple traumas to the orofacial area and maxillary and mandibular fractures. Those with systemic diseases potentially affecting the TMJ, such as rheumatic diseases, systemic osteoarthritis, pregnancy, psychological problems, and psychiatric or neurological disorders, were also excluded. Cases in which the structure of the TMJ complex was not clearly distinguished on MRI and in which neither signal intensity nor contour could define TMJ effusion were excluded35.
Among 1474 patients (2948 TMJs), 2,502 bilateral MR images with PD from 1251 patients (84.8%) who visited the hospital between January 2017 and October 2021 comprised the training set, whereas 446 images from 223 patients (15.6%) who visited the hospital between September 2021 and October 2022 comprised the evaluation dataset. When training the CNN models, 20% of the training set was used for validation. Since the validation data were not used for training the CNN models, we can accurately measure the general prediction performance of the models on unknown data.
MRI image acquisition
High-resolution MR images were obtained using a 3T MRI system (Signa™ Genesis, GE Healthcare, Chicago, IL, USA) with a 6 × 8-cm diameter surface coil. MRI examination was dependent on the MR sequences and protocol of the Kyung Hee University Medical Center. All scans involved sagittal oblique sections (section thickness, 3 mm or less; field of view, 15-cm; matrix dimensions, 256 × 224 matrix), and spin-echo sagittal MR images were obtained on the axial localizer images. T2-weighted images (T2WIs) were obtained using a 650/14 repetition time (TR)/echo time (TE) and 2650/82 TR/TE sequences. The PD images were obtained using a 2650/82 TR/TE sequence. MRI protocols for TMJ evaluation are identical to our previous studies3,36.
Interpretation of ADD with CNN models-VGG16 models for interpreting Effusion
For training and obtaining the performance of the CNN model, PD, and T2W MR images, the input images were pre-processed as follows: First, MR images were cropped around the TMJ, that is, the region where TMJ effusion mainly occurs, as the region of interest. Subsequently, each channel of the image was resized to 224 × 224 × 3 pixels. As a result, the inputs were set to dimensions of 224 × 224 × 3 and were composed of red, green, and blue channels.
Visual geometry group (VGG) 16 used in this study is a CNN with 16 deep layers37. For image classification, the pre-trained three-dimensional VGG16 models were used. One of the top-vision model architectures to date, VGG16, is a CNN architecture that can reduce the error rate by half when compared to the AlexNet 8-layers model38. Compared to the AlexNet 8-layers model, VGG16 is twice as deep and comprises a convolutional layer, three fully connected layers, a 3 × 3 convolutional filter, stride, padding 1, 2 × 2 max pooling, and a rectified linear unit (ReLU)39. Because our objective was not only to achieve high AUC scores but also to analyze the learned features and activation maps, we selected this model for its intuitive structure. The equation for the convolutional layer in the VGG16 is as follows (1):
| 1 |
where is processed feature of input value X, {i, j} denotes the index of y, l denotes the layer order. W is convolutional filter which size is m ∗ m.
Three models employing different learning schemes were tested. The first scheme was “fine-tuning” which trained every layer of the VGG16 model from pre-trained parameter40. The pre-trained parameters capture general patterns of images, having been tuned with over 1.3 million images37. This capability to capture general patterns allows the model to be trained efficiently for another task, even with a limited number of images40. The second scheme was “from scratch” which trained all parameters of the model from scratch. Since the parameters of from scratch initialized randomly, a significantly larger number of images is required to fully train the model completely compared to the fine-tuning scheme. The last scheme was “freeze” which only trained the last layer of the pre-trained model while keeping the other layers fixed. Since the freeze scheme only need to train parameters of the last layer, the model can be trained with smaller number of images compared to the fine-tuning scheme. However, the prediction performance of the model can be limited since most of the parameters are not tuned41.
The evaluation metrics were AUC and accuracy42. To obtain the accuracy, we measured the classification threshold using Youden’s index calculated on the validation set43. In all three schemes—fine-tuning, training from scratch, and freezing—the same Adam optimizer and data augmentation techniques were applied. These techniques generate artificial data from the given data. For a given MR image, artificial images can be generated and augmented through flipping, rotating, and affine transformations. The Adam optimizer is an adaptive learning rate optimization algorithm designed specifically for training deep neural networks. Data augmentation reduces the risk of overfitting by training the model by augmenting the data44. For training of all three schemes, a learning rate of 1e−4 in 20 epochs was used. The best model for each scheme was derived considering the lowest validation loss per epoch.
Ensemble model with PD and T2WIs
An additional ensemble method was used to test the improvement in the prediction performance of the single fine-tuned model. The three fine-tuned models were trained using two types of MR images, and the pairs of predicted values were averaged (Fig. 2). This “data” ensemble was inspired by the notion that using diverse data improves generalization performance more than using a single CNN model44. Equation of the probability of ensemble model can be abbreviated as (2)
| 2 |
where P1 and P2 are predicted from the fine-tuned VGG16, which exploits the PD and T2W MR images, respectively. Each model was trained using PD and T2WIs with data augmentation techniques that randomly rotated, flipped, and affined the cropped input images.
Figure 2.

Architecture of the TMJ effusion prediction ensemble model.
Grad-CAM for investigating VGG16 model
We analyzed gradient-weighted class activation mapping (Grad-CAM) of the input images to deeply understand the learned features of the fine-tuning and scratch models by comparing identical images that both models accurately predicted as positive images45. Grad-CAM visualizes the key area of the input image which affect higher impact for predicting label compared to other region of the input image. The visualization of Grad-CAM is processed when it is time to predict a label by calculating the important weight , which equals the average value where is the logit of class c and is the k-th activation map. The Grad-CAM heat map was acquired as follows (3):
| 3 |
Applying a heat map to the input image illustrates the key area for prediction, because the heat map visualizes the significant pixels that change the most. We present some of the best Grad-CAM images for visualization.
Diagnosis of TMJ effusion of human experts
TMJ effusion is defined as the collection of fluid in the TMJ space. It manifests as areas of high-intensity signals in the joint space on T2WIs and PD images. Joint effusion was coded dichotomously as positive or negative. A positive finding of effusion was identified when there was a high-intensity signal in the superior or inferior joint space on closed-mouth sagittal T2 or PD-weighted images14. Two experts with more than 10 years of experience analyzed the MRI findings with the naked eye, while the patients’ clinical information was blinded. Intra-class correlation coefficients (ICCs) of 0.77 and 0.81 were estimated in intra-examiner reproducibility measurements. Inter-examiner ICCs for TMJ effusion diagnosis were 0.80 and 0.82 in each measurement. When there was disagreement, a unified conclusion was reached through several discussions until a consensus was reached.
Statistical methods
Descriptive statistics are reported as means ± standard deviations or numbers with percentages, as appropriate. To analyze the distribution of discontinuous data, we used χ2 tests for equality of proportions, Fisher’s exact tests, and Bonferroni tests. All statistical analyses were performed using the IBM SPSS Statistics for Windows (version 24.0; IBM Corp., Armonk, NY, USA), R Version 4.0.2 (R Foundation for Statistical Computing, Vienna, Austria), and Python Version 3.9.7 (Python Software Foundation, DE, USA). A receiver operating characteristic (ROC) curve was plotted and the AUC was calculated for each model, in which AUC = 0.5 indicated no discrimination, 0.6 ≥ AUC > 0.5 indicated poor discrimination, 0.7 ≥ AUC > 0.6 indicated acceptable discrimination, 0.8 ≥ AUC > 0.7 indicated excellent discrimination, and AUC > 0.9 indicated outstanding discrimination46. Analysis of variance (ANOVA) and post hoc tests were used to compare the mean AUC values of the three prediction models. McNemar’s test was used to compare the prediction accuracies of the CNN models with those of the human experts. Statistical significance was set at a two-tailed p value < 0.05.
Ethical approval
The research protocol was reviewed in compliance with the Declaration of Helsinki and approved by the Institutional Review Board of Kyung Hee University Dental Hospital in Seoul, South Korea (IRB No-KH-DT21022).
Informed consent
Informed consent was obtained from all patients involved in the study.
Results
Prediction results of the three learning strategies
Figure 3 presents the results of image classification using the three different learning schemes applied to VGG16 and Residual Network (ResNet) 50. Since VGG16 outperforms ResNet50, we utilized VGG16 for further investigation of effusion. To determine the best classification of each model, each row represents a ROC curve with an AUC score and a confusion table. The fine-tuned model showed the best prediction performance (AUC = 07,895). The from-scratch model was the second-best model, with an AUC of approximately 0.6193. Because this model was trained from scratch using only MR images, the AUC showed that essentially little discrimination performance between effusion and non-effusion was achieved in the CNN features. However, the pre-trained learning weights allowed for a more precise separation, which increased the AUC score by approximately 0.16. The model with the lowest AUC (0.6149) was obtained by using the freezing scheme. Among the three models, the fine-tuning model had the best AUC score (0.7895), and the AUC scores of the other models showed excellent classification performance.
Figure 3.

Classification results of three convolutional neural network (CNN) models using three different learning strategies on proton density images with VGG16 and ResNet50.
Visualization comparison between fine-tuning and from-scratch models using Grad-CAM
We conducted Grad-CAM analysis of the last channel using the test set images to understand and analyze the learned features of the fine-tuning and from-scratch models. Figure 4 shows the representative flow of the activation map for recognizing TMJ effusion in PD MRI images. The regions of interest (ROIs) for the from-scratch model provided acceptable gradient values; however, the heat maps of the fine-tuning model consistently showed a more concentrated effusion. The from-scratch model tended to give small gradient scores (0.2–0.4) to the uninterested areas, according to a comparison of the fine-tuning model outputs. We also examined the last channel activation maps of both models to further understand the differences between their gradient heatmaps because the Grad-CAM feature of important weight was created by averaging the activation map Ak element-wise. Out of 512 images, we selected one and printed 100 activation maps from the last channels of both models. Figure 5 shows the results. The first and second rows display the results of the from-scratch and fine-tuning models, respectively. Fine-tuning model has higher sparsity than from-scratch model, which shows more concentrated activation maps. Sparsity is the ratio of the number of zero values from all values in activation map. The Grad-CAM visualizations also agreed with the model learned through important features in the TMJ area, especially, around the articular disc. The fine-tuning model discovered a sparser representation in each activation map than the from-scratch model. Sparsity is the number of zero value/total values in the activation map. The activation maps of fine-tuning model had a zero area of approximately 82% when the mean sparsity of all 512 maps was measured (using approximately 18% of the gradient signals). However, the sparsity of the from-scratch model was 56%, quite correlated with the gradient values of the uninterested regions.
Figure 4.

Activation map for recognizing TMJ effusion in PD MRI image.
Figure 5.

Grad-CAM images and last channel activation maps of from-scratch model and fine-tuning model.
Effect of applying ensemble methods and prediction results
To test the improvement in accuracy using additional training data, an ensemble of two fine-tuned models was created using two types of MR images. The two prediction probabilities are assigned to the ensemble model, which averaged them to obtain the final prediction outputs. We then compared the prediction results of the single fine-tuning and ensemble models with those of human experts. Figure 6 shows the confusion tables of both results and a comparison between the three models, including two fine-tuned models on the PD and T2WIs and one ensemble model of these two fine-tuned models.
Figure 6.

Classification results of two fine-tuning models with PD and T2W images, ensemble model of two fine-tuning models, and human experts.
Comparing the ensemble model and human experts, the performance of the ensemble model was higher than that of human experts, but not significantly (p = 0.2755) (Fig. 6). That is, when the prediction accuracy was obtained for all data, the fine-tuning model on PD was 0.7421, the fine-tuning model on T2 was 0.7309, the ensemble model of the previous two models was 0.7107, and that of human experts was 0.6771. The fine-tuning model with PD images had excellent specificity compared to human experts (87.25% vs. 58.17%), and human experts had superior sensitivity (80.00% vs. 57.43%) (Table 1).
Table 1.
The sensitivity and specificity of fine-tuning models, ensemble model, and human experts.
| Parameter | Fine-tuning on PD | Fine-tuning on T2W | Ensemble | Human expert | p value |
|---|---|---|---|---|---|
| Values of confusion matrix | |||||
| TN (n) | 219 | 213 | 214 | 146 | |
| FN (n) | 83 | 82 | 92 | 39 | |
| FP (n) | 32 | 38 | 37 | 105 | |
| TP (n) | 112 | 113 | 103 | 156 | |
| Diagnostic accuracy | |||||
| Sensitivity (%)a | 57.4359 | 57.9487 | 52.8205 | 80.0000 | 0.0000*** |
| Specificity (%)a | 87.2510 | 84.8606 | 85.2590 | 58.1673 | 0.0000*** |
| PPV (%)a | 77.7778 | 74.8344 | 73.5714 | 59.7701 | 0.0000*** |
| NPV (%)a | 72.5166 | 72.2034 | 69.9346 | 78.9189 | 0.0002*** |
PD, proton density magnetic resonance imaging; T2W, T2-weighted magnetic resonance imaging; TN, true negative; FN, false negative; FP, false positive; TP, true positive; PPV, positive predictive value; NPV, negative predictive value. Sensitivity = [TP/(TP + FN)] × 100, specificity = [TN/(FP + TN)] × 100, PPV = [TP/(TP + FP)] × 100, and NPV = [TN/(FN + TN)] × 100. aThe results were obtained using the chi-square test (χ2 test). Statistical significance was set at p < 0.05. ***p < 0.001.
AUCs of deep learning models and human experts according to age and sex
By creating subsets of testing data for different sexes and age ranges, we further evaluated the predictions. In most groups, the fine-tuning and ensemble models exhibited significant performance in predicting effusion. Figure 7 shows the accuracy of the human experts for each patient group according to sex and age. All patients are comprised in the “ALL” group, patients under 20 are comprised in the “AGE1” group, patients over 20 but under 40 are comprised in the “AGE2” group, patients over 40 but under 60 are comprised in the “AGE3” group, and the remaining patients over the age of 61 are comprised in the “AGE4” group. Table 2 shows the prediction accuracy of Fine-tuning on PD images, T2 images, and the ensemble model. Their accuracies were compared using ANOVA. In Table 2 and Fig. 7, performance of the ensemble model has been shown. In “ALL” group, the AUC of the ensemble model is 0.0118 higher than that of single fine-tuning model on T2WIs. Among the three models, the ensemble model exhibited the highest AUC score (area under the curve [AUC] = 0.7717).
Figure 7.

Accuracy comparisons of the two fine-tuning models and human experts.
Table 2.
AUCs of fine-tuning model on PD, fine-tuning model on T2, and ensemble model of two fine-tuning models.
| Fine-tuning model on PD | Fine-tuning model on T2W | Ensemble model | p value | ||
|---|---|---|---|---|---|
| Sex | |||||
| Male | (n = 120) | 0.7576 | 0.7000 | 0.6750 | 0.0002*** |
| Female | (n = 326) | 0.7083 | 0.7423 | 0.7361 | 0.3077 |
| Age (years) | |||||
| AGE1 (Age ≤ 20) | (n = 104) | 0.7307 | 0.7500 | 0.7019 | 0.0307* |
| AGE2 (Age 21–40) | (n = 138) | 0.7173 | 0.7318 | 0.6956 | 0.0249* |
| AGE3 (Age 41–60) | (n = 124) | 0.7741 | 0.7419 | 0.7500 | 0.0002*** |
| AGE4 (over 60) | (n = 80) | 0.8375 | 0.7875 | 0.8250 | 0.8803 |
PD, proton density magnetic resonance imaging; T2W, T2-weighted magnetic resonance imaging. The results were analyzed using ANOVA. Statistical significance was set at p < 0.05. *p < 0.05, ***p < 0.001.
The predictive performance was the highest in the AGE4 group aged 60 years or older. When using all data in the fine-tuning model on PD, the accuracy was 0.742. In the age group, the accuracy was highest in AGE4 (0.8375), and that in females (0.7576) was higher than that in males (0.7083). In the Ensemble model, the prediction accuracy was also the highest for AGE4 (0.825), and that in females (0.7361) was higher than that in males (0.675). The accuracy of human experts was generally lower than that of the VGG16 models, and the same was true for all values according to the AGE group (0.6521–0.7125) and gender (0.6483–0.6840). The fine-tuning model on the PD image showed a significantly higher accuracy when using all data than when using human experts. Furthermore, when analyzed according to sex, the accuracy of the fine-tuning model PD image was significantly higher than that of the human experts only in women. When all data were analyzed by dividing the data by age and gender, the accuracy of the CNN model was higher than that of the human experts in the fine-tuning and ensemble models; however, there was no statistically significant difference, except for the first two cases (all p > 0.05).
Effect of containing clinical data as input feature of three layered DNN
This study aimed to determine whether disclosing a patient’s clinical information is helpful in automatically diagnosing TMJ effusion compared to MRI alone. The clinical information obtained from the TMJ report of the patient included age, sex, presence or absence of TMD pain, visual analog scale (VAS) score of pain derived from the TMJ and adjacent structures (TMD pain), elapsed period of TMD symptom onset (duration), symptom-occurring or affected side, and TMJ noise. The duration of TMD pain has been reported to be several days. TMD pain was subjectively scored by the patients, ranging from 0 (no pain at all) to 10 (the worst pain imaginable), using the VAS.
To test the improvement of TMJ effusion prediction accuracy using clinical data, we built a new deep neural network (DNN) model that consists of a three-layered neural network with a logistic activation function that takes the probability from VGG16 and clinical data obtained from TMD patients as input features. We used 272 probabilities from the VGG16 and clinical data as the test set.
The probabilities obtained from the fine-tuned VGG16 model and the clinical data were concatenated and subjected to standard scaling. These concatenated features were then utilized as input features for a three-layer DNN aimed at predicting effusion. The experimental results revealed that the model incorporating clinical data exhibited lower AUC values compared to the fine-tuned VGG16 model. This discrepancy can potentially be attributed to the smaller size of the clinical dataset compared to the number of MR images. The limited amount of clinical data instances may have contributed to this outcome. Nonetheless, the statistical analysis demonstrated that the performances of the two models were statistically similar, as indicated by the p values exceeding the threshold of 0.05. This finding emphasizes the importance of considering dataset size and highlights the potential for optimizing the fusion of multiple modalities, such as clinical data and imaging, in the development of accurate and robust predictive models for effusion detection. Figure 8 shows the architecture of the effusion prediction model, which contains clinical data as input features. The DNN model was trained using the probability from the fine-tuned VGG16 model and the clinical data from the diagnoses of human experts. Subsequently, the predicted AUC results of the TMJ effusion of the DNN model and the AUC results of the fine-tuned model on the PD image were compared.
Figure 8.

Architecture of the effusion prediction model which contains clinical data as input feature.
In the case of AUC value of fine-tuning model on PD, when divided by gender (male:0.7195, female:0.8216) and by age group (Aged ≤ 20:0.7531, 21-40:0.7531, 21-40:0.7387, 41-60:0.8275, over 61:0.8752) ranged from acceptable to excellent. However, when analyzed by adding clinical data to the fine-tuning model with DNN, contrary to expectations, when divided by gender (male:0.7110, female:0.7792) and age group (Aged ≤ 20:0.6964, 21-40:0.7425, 21-40:0.7387, 41-60:0.8258, over 61:0.7882), and there was no significant difference compared to when clinical data were not considered (Table 3). The highest AUC in each model was found in the over 61-year-old group in the fine-tuning model of PD and in the 41–60-year-old group in the DNN model with clinical data added. Both models showed larger AUC values in females than in males.
Table 3.
Comparison of AUCs between fine-tuning model on PD and DNN with clinical data.
| Fine-tuning model on PD | DNN model fused with fine-tuning on PD and clinical data | p valuea | Fine-tuning model on T2W | DNN model fused with fine-tuning on T2W and clinical data | p valueb | ||
|---|---|---|---|---|---|---|---|
| Sex | |||||||
| Male | (n = 84) | 0.7195 | 0.7110 | 0.9028 | 0.7137 | 0.6306 | 0.2494 |
| Female | (n = 188) | 0.8216 | 0.7792 | 0.3030 | 0.7891 | 0.7192 | 0.1143 |
| Age (years) | |||||||
| AGE1(Age ≤ 20) | (n = 62) | 0.7531 | 0.6964 | 0.4788 | 0.8224 | 0.6832 | 0.0687 |
| AGE2(Age 21–40) | (n = 90) | 0.7387 | 0.7425 | 0.9536 | 0.7283 | 0.6581 | 0.3058 |
| AGE3(Age 41–60) | (n = 78) | 0.8275 | 0.8258 | 0.9776 | 0.7171 | 0.6579 | 0.4241 |
| AGE4(over 60) | (n = 42) | 0.8752 | 0.7882 | 0.2833 | 0.8258 | 0.7670 | 0.5022 |
PD, proton density magnetic resonance imaging; T2W, T2-weighted magnetic resonance imaging. The results were analyzed using ANOVA. Statistical significance was set at p < 0.05. aComparison of values of the fine-tuning model on PD and DNN model fused with fine-tuning on PD and clinical data, bComparison of values of the fine-tuning model on T2W and DNN model fused with fine-tuning on T2W and clinical data.
Table 3 compares the results of the DNN with the fine-tuned model and the clinical data. Adding the best-performing fine-tuning model for PD to the clinical data did not improve the prediction accuracy. That is, when comparing the results of the DNN by sex and age, there was no significant difference in prediction accuracy in all cases.
Discussion
In this study, MRI data were judged using CNN models of the three strategies, and the best model was verified. We then compared the results of the best-performing model with those of human experts. In addition, predictions were made based on a DNN using multimodal data, including image data and patient clinical information, and the results were compared with those of human experts. Among the three CNN models, fine-tuning, scratch, and freeze models, the fine-tuning model was the best at predicting the diagnosis of TMJ effusion. The fine-tuning model had an AUC value of 0.7895 and showed the highest performance compared to the from-scratch (0.6193) and freeze models (0.6149). The fine-tuning model showed better performance when using PD images rather than T2WIs, and the ensemble model showed excellent performance in people aged 61 years or older when divided by age group rather than using the entire dataset. Overall, the ensemble model of the two fine-tuning models outperformed the human experts. The prediction accuracy of the ensemble model (74.21%) was higher than that of human experts (67.71%) when using all data. However, the fine-tuning model with PD images had excellent specificity compared with that of human experts (87.25% vs. 58.17%), and human experts had superior sensitivity (80.00% vs. 57.43%). When TMJ effusion was predicted using a fine-tuned model with PD images by age group, the AUC associated with patients over 61 years was 0.8375, showing excellent performance. In the ensemble model with two fine-tuned models, the AUC was 0.8250. Among the AUCs obtained from the DNN model with clinical data, the best performance among the five age groups was the group aged 41–60 years, which was 0.8258. However, the DNN with clinical data and a fine-tuning model for PD did not show a significant difference in TMJ effusion prediction performance.
Diagnosis of joint effusion may involve physical examination, imaging tests, and laboratory evaluation of the fluid in the joint47. In addition, clinicians obtain pain characteristics, medical history, current health, and other systemic symptoms from the patients to narrow the judgment of effusion48. No study has been conducted on the diagnosis of TMJ effusion using CNN and ensemble models; therefore, we introduce a study approaching another joint effusion. In the prediction of joint effusion using the VGG16 model for the elbow joints of adult (AUC = 0.996) and pediatric patients (AUC = 0.924), and the prediction accuracies of the VGG models were not significantly different from that of radiologists49. However, prediction performance varies depending on the type of human joint, the type of imaging modality used, and the applied artificial neural algorithms. The deep learning model for detecting joint diseases using MRI images showed relatively superb accuracy ranging from 70 to 100%50. That is, AI or deep learning models have the potential to match or exceed human-level prediction performance in MRI-based diagnosis of joint diseases. However, in a DNN using MR images of the knee joint, the average accuracy of the joint effusion was only 62%51. Therefore, effusion may be a common comorbidity of osteoarthritis and disc displacement in TMD patients. Recently, approaches based on AI technologies for diagnosing or detecting disc displacement of the TMJ or osteoarthritis have been continuously attempted35,52–54. In the present study, the fine-tuning model with PD images for TMJ effusion showed acceptable prediction performance. In terms of age group, both the fine-tuning and ensemble models for TMJ effusion showed excellent performance (both AUCs > 0.8) with increased diagnostic accuracy in older people over 61 years of age. Further research is needed to clarify our findings and further improve AI-based diagnostic accuracy.
This study began with the question of how AI algorithms can help clinicians diagnose and predict TMD. Sensitivity (true-positive rate) and specificity (true-negative rate) are important for ensuring diagnostic reliability55. The sensitivity of TMJ effusion was higher for human experts than for any model, and the fine-tuning model had better specificity than human experts. A previous MRI study of the knee joint was consistent with our results; conventional radiographs had a sensitivity of 90–92% and specificity of 39–54% for joint effusion; however, MRI showed a sensitivity of 76% and specificity of 83%56. High sensitivity leads to several problems, including abnormal labeling of normal tissue, resulting in unnecessary treatment. Therefore, deep learning can complement human diagnoses in terms of specificity. However, in the newly developed DC/TMD Axis I protocol, intra-articular disorders had a sensitivity of 0.80 and specificity of 0.9714. MRI revealed intra-articular effusion in 46.5% of patients with TMD, and when the MRI results were considered as a reference, ultrasonography had a similar sensitivity (75.6%) and specificity (76.5%)57. When the disease prevalence was low, the number of false-positive results was far higher than the number of true-positive results58. When making a differential diagnosis of a disease with a high prevalence, such as TMD, clinicians are more accustomed to combining the puzzle with a specific disease rather than diagnosing a non-disease59. In the case of high prevalence (> 50% prevalence), the NPV was 90%, and in the case of low prevalence (< 5% prevalence), the NPV increased to 99%55. Interestingly, the specificity was higher than the sensitivity of the deep learning model. In the AI algorithm using X-ray images of pneumothorax, the sensitivity of AI ranged from 33.04 to46.09%, and the specificity ranged from 61.74 to 71.30%; moreover, when 1000 X-ray images were added to the data set, the sensitivity increased by 15.48%60. Therefore, the deep learning model can automatically cover false-negative cases that human experts may miss, helping to diagnose diseases. In a recent meta-analysis of deep learning for pneumothorax diagnosis, both sensitivity and specificity were improved by increasing the number of training samples61. However, there is a possibility of a high risk of bias, indicating that additional studies with participants or study designs to reduce this risk are needed.
The diagnostic performance of the AI model for TMJ effusion was acceptable, with an excellent discrimination level. In deep learning, the fine-tuning model is an approach in which the weights of a pre-trained model are trained on new data62. The fine-tuning model had better prediction performance for TMJ effusion than the from-scratch and freeze models. Learning from pretrained weights allows a fine-tuned model to outperform the from-scratch model35. The fine-tuning model for evaluating the TMJ exudate in the Grad-CAM analysis provided clearer visualization than the from-scratch model by deactivating unwanted gradient values. The effusion accuracy of the fine-tuning model using PD images was higher than that of human experts. Additionally, the prediction accuracy of the ensemble model was higher than that of human experts when all data were used (74.21% vs. 67.71%, p < 0.05). In our previous study, the ensemble model had a higher AUC than a single fine-tuning model in predicting anterior disc displacement in a TMD patient35. Ensemble learning refers to the generation and combination of multiple model outputs to solve a particular machine-learning task63. The intuitive explanation for ensemble methodology stems from human nature and the tendency to gather different opinions and weigh and combine them to make complex decision64. The main idea is that weighing and aggregating several individual opinions is better than choosing the opinion of one individual. An example of such a decision is matching a medical treatment to a disease65. It was proved that neural networks can classify TMJ effusions with similar or superior accuracy to that offered by human experts utilizing PD MR images, suggesting that automated assessment of images from MRI may be useful for assessing TMJ effusions.
In this study, a DNN was used to process multimodal data along with patient clinical data. When the DNN was approached by adding the patient's clinical information to the MR images, the prediction performance was not significantly improved compared with the single fine-tuning model using only the MRI images, despite being superior to human experts. As effusion is a parameter clearly observed on MRI36. Additional information, including TMD pain, pain duration, absence/presence of osteoarthritis, and ADD TMJ effusion, did not contribute to the performance of the effusion diagnosis deep learning model. Moreover, although TMJ effusion occurred with disc displacement in previous studies, the incidence of TMJ effusion in patients (8–18%) was significantly lower than that in patients with ADD (40–56.5%)36,66. This indirectly demonstrates that disc displacement is not always a prerequisite for TMJ effusion. TMD pain and TMJ effusion have been reported to be related19,67. Regardless of the cause of fluid accumulation in the joint, the symptoms are more or less the same. Their severities range from mild to debilitating. Classic symptoms of joint effusion include swelling, pain, redness, and warmth. In this study, TMD pain intensity and VAS score did not improve the prediction accuracy of TMJ effusion. AI-based techniques can be used to analyze a patient’s medical history, genetics, and other factors to create personalized treatment plans, and this trend will likely continue to develop in the future. However, AI-based medical diagnostics is an open research domain, and we highly recommend that researchers continue their research to improve the final prediction accuracy and expedite the learning process.
A great advantage of using AI models is the analysis of vast amounts of medical data and the identification of patterns and relationships30. AI for disease diagnostics can help clinicians improve patient outcomes and deliver more efficient and effective healthcare systems68. However, the development and deployment of AI for TMD diagnosis, especially using multimodal patient data, including MR images and text data, are still in their infancy. Moreover, several technical, regulatory, and ethical challenges must be overcome for this technology to reach its full potential. The first problem is health data quality and availability, where AI algorithms require large amounts of high-quality labeled data to be effective, which can be a problem in the medical field where data are often fragmented, incomplete, or unlabeled69. However, AI algorithms can become biased when trained on data that is not representative of the population they intend to provide, leading to inaccurate or unfair diagnoses70. Therefore, to obtain clear results, high-quality data from TMD patients and data obtained from standardized procedures at multiple institutions are required.
This study has several strengths and weaknesses. Transfer learning is used to improve a model in a single domain by transferring information from related domains. Transfer learning is required when there is a limited supply of target training data. This could be due to the rarity of the data. However, collecting these data is expensive. Because the pre-trained CNN model contains common characteristics of diverse images, we can expect a better prediction performance by fine-tuning the model71. The AUC for the ROC for our better model is 0.8752. This model is suitable for clinical use; however, for the model to have good diagnostic performance for all ages and both sexes, more training and refinement are required. When scrutinizing the training images, it was found that, although the training images were labeled solely for TMJ effusion, there was certain heterogeneity, with diversified features not being labeled. Some MR images can be distorted owing to interference caused by foreign objects such as fixation screws and plates after maxillofacial surgery, dental implants, or various other prostheses. These features are undesirable and may cause confusion during AI training. For improvement, we can refine our training images to suit the common scenarios encountered in the clinical setting to better match the expected patient sample, for example, without foreign objects, without obvious TMJ pathologies, and with an appropriate MRI protocol. Third, AI models were used as a classification method. Each training image was labeled as a TMJ effusion. It is possible to train object detection in a location where TMJ effusion occurs easily, or as another algorithm that can determine TMJ effusion together with ADD. Theoretically, this shall enhance the performance by putting more weight on the feature. We suggest that a better AI model, an explainable AI model based on more data, be attempted in relation to TMJ effusion and TMD. Because research results based on AI and deep learning on TMJ effusion are limited, additional research is required to establish the credibility of the points discussed above.
Acknowledgements
The authors extend their special thanks to Sung-Woo Lee of the Department of Oral Medicine and Oral Diagnosis at Seoul National University and Jung-Pyo Hong of the Department of Orofacial Pain and Oral Medicine at Kyung Hee University Dental Hospital.
Author contributions
Writing and original draft preparation, Y.-H.L. and S.J.; conceptualization, Y.-H.L. and Y.-K.N.; methodology, Y.-H.L. and S.J.; software, Y.-H.L., S.J., and Y.-K.N.; validation and formal analysis, Y.-H.L., S.J., and Q.-S.A.; investigation, Y.-H.L. and S.J.; resources, Y.-H.L. and Q.-S.A.; data curation, Y.-H.L. and S.J.; writing, review, and editing, Y.-H.L. and S.J.; visualization, Y.-H.L., S.J., and J.-H.W; supervision, Y.-K.N.; project administration, Y.-H.L.; funding acquisition, Y.-H.L. and Y.-K.N. All authors contributed to and approved the submitted manuscript.
Funding
This work was supported by a National Research Foundation of Korea (NRF) grant funded by the Korean government (MSIT) (No. NRF-2020R1F1A1070072, No. RS-2024-00421203), IITP/MSIT (IITP-2021-0-02068, RS-2020-II201373, RS-2023-00220628), and Kyung Hee University in 2021 (KHU-20211863).
Data availability
The datasets used and/or analyzed in the current study are available from the corresponding author upon reasonable request.
Competing interests
The authors declare no competing interests.
Footnotes
The original online version of this Article was revised: The original version of this Article contained an error in the Funding section. “This work was supported by a National Research Foundation of Korea (NRF) grant funded by the Korean government (MSIT) (No. NRF-2020R1F1A1070072, No. RS-2024-0042120), IITP/MSIT (IITP-2021-0-02068, RS-2020-II201373, RS-2023-00220628), and Kyung Hee University in 2021 (KHU-20211863).” now reads: “This work was supported by a National Research Foundation of Korea (NRF) grant funded by the Korean government (MSIT) (No. NRF-2020R1F1A1070072, No. RS-2024-00421203), IITP/MSIT (IITP-2021-0-02068, RS-2020-II201373, RS-2023-00220628), and Kyung Hee University in 2021 (KHU-20211863)”
Publisher's note
Springer Nature remains neutral with regard to jurisdictional claims in published maps and institutional affiliations.
Yeon-Hee Lee and Yung-Kyun Noh: These authors contributed equally.
Change history
12/17/2024
A Correction to this paper has been published: 10.1038/s41598-024-83143-7
Contributor Information
Yeon-Hee Lee, Email: omod0209@gmail.com.
Yung-Kyun Noh, Email: nohyung@hanyang.ac.kr.
References
- 1.List, T. & Jensen, R. H. Temporomandibular disorders: Old ideas and new concepts. Cephalalgia37, 692–704. 10.1177/0333102416686302 (2017). [DOI] [PubMed] [Google Scholar]
- 2.Chisnoiu, A. M. et al. Factors involved in the etiology of temporomandibular disorders—a literature review. Clujul. Med.88, 473–478. 10.15386/cjmed-485 (2015). [DOI] [PMC free article] [PubMed] [Google Scholar]
- 3.Lee, Y. H., Lee, K. M. & Auh, Q. S. MRI-based assessment of masticatory muscle changes in TMD patients after whiplash injury. J. Clin. Med.10.3390/jcm10071404 (2021). [DOI] [PMC free article] [PubMed] [Google Scholar]
- 4.de Paiva Bertoli, F. M. et al. Anxiety and malocclusion are associated with temporomandibular disorders in adolescents diagnosed by RDC/TMD. A cross-sectional study. J. Oral Rehabil.45, 747–755. 10.1111/joor.12684 (2018). [DOI] [PubMed] [Google Scholar]
- 5.Al-Khotani, A. et al. The associations between psychosocial aspects and TMD-pain related aspects in children and adolescents. J. Headache Pain17, 30. 10.1186/s10194-016-0622-0 (2016). [DOI] [PMC free article] [PubMed] [Google Scholar]
- 6.Lee, Y.-H. & Auh, Q. S. Clinical factors affecting depression in patients with painful temporomandibular disorders during the COVID-19 pandemic. Sci. Rep.12, 14667. 10.1038/s41598-022-18745-0 (2022). [DOI] [PMC free article] [PubMed] [Google Scholar]
- 7.Lee, Y.-H., Lee, K. M., Kim, T. & Hong, J.-P. Psychological factors that influence decision-making regarding trauma-related pain in adolescents with temporomandibular disorder. Sci. Rep.9, 18728. 10.1038/s41598-019-55274-9 (2019). [DOI] [PMC free article] [PubMed] [Google Scholar]
- 8.Valesan, L. F. et al. Prevalence of temporomandibular joint disorders: A systematic review and meta-analysis. Clin. Oral. Investig.25, 441–453. 10.1007/s00784-020-03710-w (2021). [DOI] [PubMed] [Google Scholar]
- 9.Warren, M. P. & Fried, J. L. Temporomandibular disorders and hormones in women. Cells Tissues Organs169, 187–192. 10.1159/000047881 (2001). [DOI] [PubMed] [Google Scholar]
- 10.Bueno, C. H., Pereira, D. D., Pattussi, M. P., Grossi, P. K. & Grossi, M. L. Gender differences in temporomandibular disorders in adult populational studies: A systematic review and meta-analysis. J. Oral Rehabil.45, 720–729. 10.1111/joor.12661 (2018). [DOI] [PubMed] [Google Scholar]
- 11.Minghelli, B. et al. Prevalence of temporomandibular disorder in children and adolescents from public schools in Southern Portugal. N. Am. J. Med. Sci.6, 126–132. 10.4103/1947-2714.128474 (2014). [DOI] [PMC free article] [PubMed] [Google Scholar]
- 12.LeResche, L. Epidemiology of temporomandibular disorders: implications for the investigation of etiologic factors. Crit. Rev. Oral Biol. Med.8, 291–305. 10.1177/10454411970080030401 (1997). [DOI] [PubMed] [Google Scholar]
- 13.Schmitter, M. et al. Prevalence of clinical and radiographic signs of osteoarthrosis of the temporomandibular joint in an older persons community. Dentomaxillofac. Radiol.39, 231–234. 10.1259/dmfr/16270943 (2010). [DOI] [PMC free article] [PubMed] [Google Scholar]
- 14.Schiffman, E. et al. Diagnostic criteria for temporomandibular disorders (DC/TMD) for clinical and research applications: Recommendations of the international RDC/TMD Consortium network* and orofacial pain special interest group†. J. Oral Facial Pain Headache28, 6–27. 10.11607/jop.1151 (2014). [DOI] [PMC free article] [PubMed] [Google Scholar]
- 15.Emshoff, R., Brandlmaier, I., Bertram, S. & Rudisch, A. Relative odds of temporomandibular joint pain as a function of magnetic resonance imaging findings of internal derangement, osteoarthrosis, effusion, and bone marrow edema. Oral Surg. Oral Med. Oral Pathol. Oral Radiol. Endod.95, 437–445. 10.1067/moe.2003.95 (2003). [DOI] [PubMed] [Google Scholar]
- 16.Bertram, S. et al. Diagnosing TMJ internal derangement and osteoarthritis with magnetic resonance imaging. J. Am. Dent. Assoc.132, 753–761. 10.14219/jada.archive.2001.0272 (2001). [DOI] [PubMed] [Google Scholar]
- 17.Aksoy, S. & Orhan, K. Comparison of T2 weighted, fat-suppressed t2 weighted, and three-dimensional (3D) fast imaging employing steady-state acquisition (FIESTA-C) sequences in the temporomandibular joint (TMJ) evaluation. Biomed. Res. Int.2021, 6032559. 10.1155/2021/6032559 (2021). [DOI] [PMC free article] [PubMed] [Google Scholar]
- 18.Park, H. N., Kim, K. A. & Koh, K. J. Relationship between pain and effusion on magnetic resonance imaging in temporomandibular disorder patients. Imaging Sci. Dent.44, 293–299. 10.5624/isd.2014.44.4.293 (2014). [DOI] [PMC free article] [PubMed] [Google Scholar]
- 19.Khawaja, S. N., Crow, H., Mahmoud, R. F., Kartha, K. & Gonzalez, Y. Is there an association between temporomandibular joint effusion and arthralgia?. J. Oral Maxillofac. Surg.75, 268–275. 10.1016/j.joms.2016.08.027 (2017). [DOI] [PMC free article] [PubMed] [Google Scholar]
- 20.Peck, C. C. et al. Expanding the taxonomy of the diagnostic criteria for temporomandibular disorders. J. Oral Rehabil.41, 2–23. 10.1111/joor.12132 (2014). [DOI] [PMC free article] [PubMed] [Google Scholar]
- 21.Mastrogiacomo, S., Dou, W., Jansen, J. A. & Walboomers, X. F. Magnetic resonance imaging of hard tissues and hard tissue engineered bio-substitutes. Mol. Imaging Biol.21, 1003–1019. 10.1007/s11307-019-01345-2 (2019). [DOI] [PubMed] [Google Scholar]
- 22.Tanaka, T., Morimoto, Y., Masumi, S., Tominaga, K. & Ohba, T. Utility of frequency-selective fat saturation T2-weighted MR images for the detection of joint effusion in the temporomandibular joint. Dentomaxillofac. Radiol.31, 305–312. 10.1038/sj.dmfr.4600713 (2002). [DOI] [PubMed] [Google Scholar]
- 23.Orhan, K., Nishiyama, H., Tadashi, S., Murakami, S. & Furukawa, S. Comparison of altered signal intensity, position, and morphology of the TMJ disc in MR images corrected for variations in surface coil sensitivity. Oral Surg. Oral Med. Oral Pathol. Oral Radiol. Endod.101, 515–522. 10.1016/j.tripleo.2005.04.004 (2006). [DOI] [PubMed] [Google Scholar]
- 24.Barragán-Montero, A. et al. Artificial intelligence and machine learning for medical imaging: A technology review. Phys. Med.83, 242–256. 10.1016/j.ejmp.2021.04.016 (2021). [DOI] [PMC free article] [PubMed] [Google Scholar]
- 25.Islam, S. K. M. S. et al. In Data driven approaches on medical imaging (eds Bin Zheng, Stefan Andrei, Md Kamruzzaman Sarker, & Kishor Datta Gupta) 1–25 (Springer Nature, Switzerland, 2023).
- 26.Jones, M. A., Islam, W., Faiz, R., Chen, X. & Zheng, B. Applying artificial intelligence technology to assist with breast cancer diagnosis and prognosis prediction. Front. Oncol.12, 980793. 10.3389/fonc.2022.980793 (2022). [DOI] [PMC free article] [PubMed] [Google Scholar]
- 27.Danala, G. et al. A comparison of computer-aided diagnosis schemes optimized using radiomics and deep transfer learning methods. Bioengineering (Basel)10.3390/bioengineering9060256 (2022). [DOI] [PMC free article] [PubMed] [Google Scholar]
- 28.Acosta, J. N., Falcone, G. J., Rajpurkar, P. & Topol, E. J. Multimodal biomedical AI. Nat. Med.28, 1773–1784. 10.1038/s41591-022-01981-2 (2022). [DOI] [PubMed] [Google Scholar]
- 29.Richens, J. G., Lee, C. M. & Johri, S. Improving the accuracy of medical diagnosis with causal machine learning. Nat. Commun.11, 3923. 10.1038/s41467-020-17419-7 (2020). [DOI] [PMC free article] [PubMed] [Google Scholar]
- 30.Janiesch, C., Zschech, P. & Heinrich, K. Machine learning and deep learning. Electron. Markets31, 685–695. 10.1007/s12525-021-00475-2 (2021). [Google Scholar]
- 31.Klang, E. Deep learning and medical imaging. J. Thorac. Dis.10, 1325–1328. 10.21037/jtd.2018.02.76 (2018). [DOI] [PMC free article] [PubMed] [Google Scholar]
- 32.Javaid, M., Haleem, A., Pratap Singh, R., Suman, R. & Rab, S. Significance of machine learning in healthcare: Features, pillars and applications. Int. J. Intell. Netw.3, 58–73. 10.1016/j.ijin.2022.05.002 (2022). [Google Scholar]
- 33.Choi, E., Kim, D., Lee, J.-Y. & Park, H.-K. Artificial intelligence in detecting temporomandibular joint osteoarthritis on orthopantomogram. Sci. Rep.11, 10246. 10.1038/s41598-021-89742-y (2021). [DOI] [PMC free article] [PubMed] [Google Scholar]
- 34.Xu, L., Chen, J., Qiu, K., Yang, F. & Wu, W. Artificial intelligence for detecting temporomandibular joint osteoarthritis using radiographic image data: A systematic review and meta-analysis of diagnostic test accuracy. PLoS One18, e0288631. 10.1371/journal.pone.0288631 (2023). [DOI] [PMC free article] [PubMed] [Google Scholar]
- 35.Lee, Y.-H., Won, J. H., Kim, S., Auh, Q. S. & Noh, Y.-K. Advantages of deep learning with convolutional neural network in detecting disc displacement of the temporomandibular joint in magnetic resonance imaging. Sci. Rep.12, 11352. 10.1038/s41598-022-15231-5 (2022). [DOI] [PMC free article] [PubMed] [Google Scholar]
- 36.Lee, Y. H., Lee, K. M., Auh, Q. S. & Hong, J. P. Magnetic resonance imaging-based prediction of the relationship between whiplash injury and temporomandibular disorders. Front. Neurol.8, 725. 10.3389/fneur.2017.00725 (2017). [DOI] [PMC free article] [PubMed] [Google Scholar]
- 37.Simonyan, K. & Zisserman, A. Very deep convolutional networks for large-scale image recognition. arXiv preprint arXiv:1409.1556 (2014).
- 38.Schiffman, E. et al. Diagnostic criteria for temporomandibular disorders (DC/TMD) for clinical and research applications: Recommendations of the international RDC/TMD consortium network* and orofacial pain special interest group†. J. Oral Fac. Pain Headache28, 6–27. 10.11607/jop.1151 (2014). [DOI] [PMC free article] [PubMed] [Google Scholar]
- 39.Diker, A., Cömert, Z., Avcı, E., Toğaçar, M. & Ergen, B. In 2019 1st International Informatics and Software Engineering Conference (UBMYK). 1–6.
- 40.Siddiqi, R. In Proceedings of the 2019 3rd International Conference on Deep Learning Technologies 91–100 (Association for Computing Machinery, Xiamen, China, 2019).
- 41.Brock, A., Lim, T., Ritchie, J. M. & Weston, N. Freezeout: Accelerate training by progressively freezing layers. arXiv preprint arXiv:1706.04983 (2017).
- 42.Toğaçar, M., Ergen, B. & Cömert, Z. Tumor type detection in brain MR images of the deep model developed using hypercolumn technique, attention modules, and residual blocks. Med. Biol. Eng. Comput.59, 57–70. 10.1007/s11517-020-02290-x (2021). [DOI] [PubMed] [Google Scholar]
- 43.Youden, W. J. Index for rating diagnostic tests. Cancer3, 32–35. 10.1002/1097-0142(1950)3:1%3c32::AID-CNCR2820030106%3e3.0.CO;2-3 (1950). [DOI] [PubMed] [Google Scholar]
- 44.Shorten, C. & Khoshgoftaar, T. M. A survey on image data augmentation for deep learning. J. Big Data6, 60. 10.1186/s40537-019-0197-0 (2019). [DOI] [PMC free article] [PubMed] [Google Scholar]
- 45.Selvaraju, R. R. et al. Grad-CAM: Visual explanations from deep networks via gradient-based localization. Int. J. Comput. Vis.128, 336–359. 10.1007/s11263-019-01228-7 (2020). [Google Scholar]
- 46.Metz, C. E. Basic principles of ROC analysis. Semin. Nucl. Med.8, 283–298. 10.1016/s0001-2998(78)80014-2 (1978). [DOI] [PubMed] [Google Scholar]
- 47.Johnson, M. W. Acute knee effusions: A systematic approach to diagnosis. Am. Fam. Phys.61, 2391–2400 (2000). [PubMed] [Google Scholar]
- 48.Karkhanis, V. S. & Joshi, J. M. Pleural effusion: Diagnosis, treatment, and management. Open Access Emerg. Med.4, 31–52. 10.2147/oaem.S29942 (2012). [DOI] [PMC free article] [PubMed] [Google Scholar]
- 49.Huhtanen, J. T. et al. Deep learning accurately classifies elbow joint effusion in adult and pediatric radiographs. Sci. Rep.12, 11803. 10.1038/s41598-022-16154-x (2022). [DOI] [PMC free article] [PubMed] [Google Scholar]
- 50.Xiongfeng, T. et al. Automated detection of knee cystic lesions on magnetic resonance imaging using deep learning. Front. Med. Lausanne9, 928642. 10.3389/fmed.2022.928642 (2022). [DOI] [PMC free article] [PubMed] [Google Scholar]
- 51.Raman, S., Gold, G. E., Rosen, M. S. & Sveinsson, B. Automatic estimation of knee effusion from limited MRI data. Sci. Rep.12, 3155. 10.1038/s41598-022-07092-9 (2022). [DOI] [PMC free article] [PubMed] [Google Scholar]
- 52.Jha, N., Lee, K. S. & Kim, Y. J. Diagnosis of temporomandibular disorders using artificial intelligence technologies: A systematic review and meta-analysis. PLoS One17, e0272715. 10.1371/journal.pone.0272715 (2022). [DOI] [PMC free article] [PubMed] [Google Scholar]
- 53.Orhan, K., Driesen, L., Shujaat, S., Jacobs, R. & Chai, X. Development and validation of a magnetic resonance imaging-based machine learning model for TMJ pathologies. BioMed Res. Int.2021, 6656773. 10.1155/2021/6656773 (2021). [DOI] [PMC free article] [PubMed] [Google Scholar]
- 54.Lee, K. S. et al. Automated detection of TMJ osteoarthritis based on artificial intelligence. J. Dent. Res.99, 1363–1367. 10.1177/0022034520936950 (2020). [DOI] [PubMed] [Google Scholar]
- 55.Parikh, R., Mathai, A., Parikh, S., Chandra Sekhar, G. & Thomas, R. Understanding and using sensitivity, specificity and predictive values. Indian J. Ophthalmol.56, 45–50. 10.4103/0301-4738.37595 (2008). [DOI] [PMC free article] [PubMed] [Google Scholar]
- 56.Tai, A. W. et al. Accuracy of cross-table lateral knee radiography for evaluation of joint effusions. AJR Am. J. Roentgenol.193, W339-344. 10.2214/ajr.09.2562 (2009). [DOI] [PubMed] [Google Scholar]
- 57.Tognini, F., Manfredini, D., Melchiorre, D., Zampa, V. & Bosco, M. Ultrasonographic vs magnetic resonance imaging findings of temporomandibular joint effusion. Minerva Stomatol.52(365–370), 370–362 (2003). [PubMed] [Google Scholar]
- 58.Parikh, R. et al. Role of frequency doubling technology perimetry in screening of diabetic retinopathy. Indian J. Ophthalmol.54, 17–22. 10.4103/0301-4738.21609 (2006). [DOI] [PubMed] [Google Scholar]
- 59.Chen, Y. P., Lo, Y. H., Lai, F. & Huang, C. H. Disease concept-embedding based on the self-supervised method for medical information extraction from electronic health records and disease retrieval: Algorithm development and validation study. J. Med. Internet Res.23, e25113. 10.2196/25113 (2021). [DOI] [PMC free article] [PubMed] [Google Scholar]
- 60.Lai, K. H. A. & Ma, S. K. Sensitivity and specificity of artificial intelligence with Microsoft Azure in detecting pneumothorax in emergency department: A pilot study. Hong Kong J. Emerg. Med.30, 8–15. 10.1177/10249079209489 (2023). [Google Scholar]
- 61.Sugibayashi, T. et al. Deep learning for pneumothorax diagnosis: A systematic review and meta-analysis. Eur. Respir. Rev.10.1183/16000617.0259-2022 (2023). [DOI] [PMC free article] [PubMed] [Google Scholar]
- 62.Sarasaen, C. et al. Fine-tuning deep learning model parameters for improved super-resolution of dynamic MRI with prior-knowledge. Artif. Intell. Med.121, 102196. 10.1016/j.artmed.2021.102196 (2021). [DOI] [PubMed] [Google Scholar]
- 63.Ganaie, M. A., Hu, M., Malik, A. K., Tanveer, M. & Suganthan, P. N. Ensemble deep learning: A review. Eng. Appl. Artif. Intell.115, 105151. 10.1016/j.engappai.2022.105151 (2022). [Google Scholar]
- 64.Yan, H., Fu, L., Qi, Y., Yu, D.-J. & Ye, Q. Robust ensemble method for short-term traffic flow prediction. Fut. Gen. Comput. Syst.133, 395–410. 10.1016/j.future.2022.03.034 (2022). [Google Scholar]
- 65.Sagi, O. & Rokach, L. Ensemble learning: A survey. WIREs Data Min. Knowl. Discov.8, e1249. 10.1002/widm.1249 (2018). [Google Scholar]
- 66.Bergman, H., Andersson, F. & Isberg, A. Incidence of temporomandibular joint changes after whiplash trauma: A prospective study using MR imaging. AJR Am. J. Roentgenol.171, 1237–1243. 10.2214/ajr.171.5.9798853 (1998). [DOI] [PubMed] [Google Scholar]
- 67.Hosgor, H. The relationship between temporomandibular joint effusion and pain in patients with internal derangement. J. Craniomaxillofac. Surg.47, 940–944. 10.1016/j.jcms.2019.03.010 (2019). [DOI] [PubMed] [Google Scholar]
- 68.Bajwa, J., Munir, U., Nori, A. & Williams, B. Artificial intelligence in healthcare: Transforming the practice of medicine. Fut. Healthc. J.8, e188–e194. 10.7861/fhj.2021-0095 (2021). [DOI] [PMC free article] [PubMed] [Google Scholar]
- 69.Al-Antari, M. A. Artificial intelligence for medical diagnostics-existing and future AI technology. Diagnostics (Basel)10.3390/diagnostics13040688 (2023). [DOI] [PMC free article] [PubMed] [Google Scholar]
- 70.Varsha, P. S. How can we manage biases in artificial intelligence systems—A systematic literature review. Int. J. Inf. Manag. Data Insights3, 100165. 10.1016/j.jjimei.2023.100165 (2023). [Google Scholar]
- 71.Weiss, K., Khoshgoftaar, T. M. & Wang, D. A survey of transfer learning. J. Big Data3, 9. 10.1186/s40537-016-0043-6 (2016). [Google Scholar]
Associated Data
This section collects any data citations, data availability statements, or supplementary materials included in this article.
Data Availability Statement
The datasets used and/or analyzed in the current study are available from the corresponding author upon reasonable request.