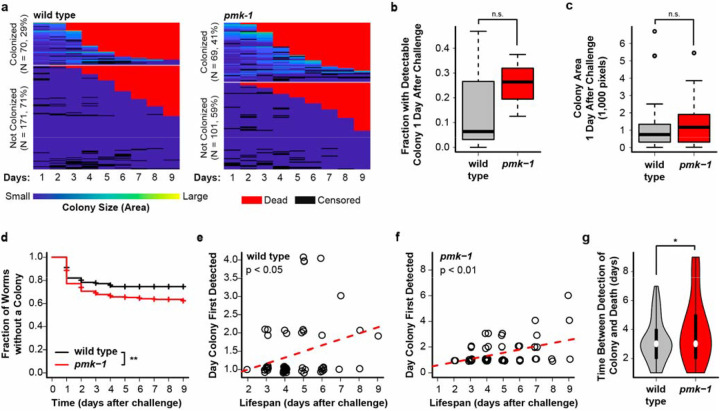
Figure 2. C. elegans lacking pmk-1 are more susceptible to E. coli colonization than wild type.
(a) Heatmap representing colony size (based on fluorescent area) for wild type (left) and pmk-1 mutant (right) C. elegans challenged with GFP-labeled E. coli. Death was highly correlated with colonization status in both wild type (p < 0.001, Pearson’s chi-squared test) and pmk-1 (p < 0.001, Pearson’s chi-squared test) animals, and with genotype (p < 0.01, Pearson’s chi-squared test). (b) The proportion of animals harboring a detectable E. coli colony (p = 0.67, two-sided Welch’s t test) and (c) mean colony area (p = 0.36, two-sided Welch’s t test) were not significantly different between wild type and pmk-1 knockout C. elegans 1 day following challenge. (d) Animals lacking pmk-1 developed significantly more late emerging colonies that were not initially detectable that wild type animals (p < 0.01, log rank test). In C. elegans harboring an E. coli colony, the day when the colony was first detected was significantly associated with lifespan in both (e) wild type (p < 0.05, linear regression) and (f) pmk-1 knockout (p < 0.001, linear regression) animals. Points represent values for individual animals. (g) The time between the initial detection of a colony and death was significantly longer for pmk-1 relative to wild type animals (p < 0.05, Welch’s t test). For box-and-whisker and violin plots, center bar or white point represent median, boxes represent upper and lower quartile, whiskers represent the 5th and 95th percentile, and points indicate outliers. Sample sizes: wild type, Ncolonized = 70, Nuncolonized = 171, Ntotal = 241; pmk-1, Ncolonized = 69, Nuncolonized = 101, Ntotal = 170. * p < 0.05, ** p < 0.01, *** p < 0.001, n.s. = not significant for indicated statistical test.

