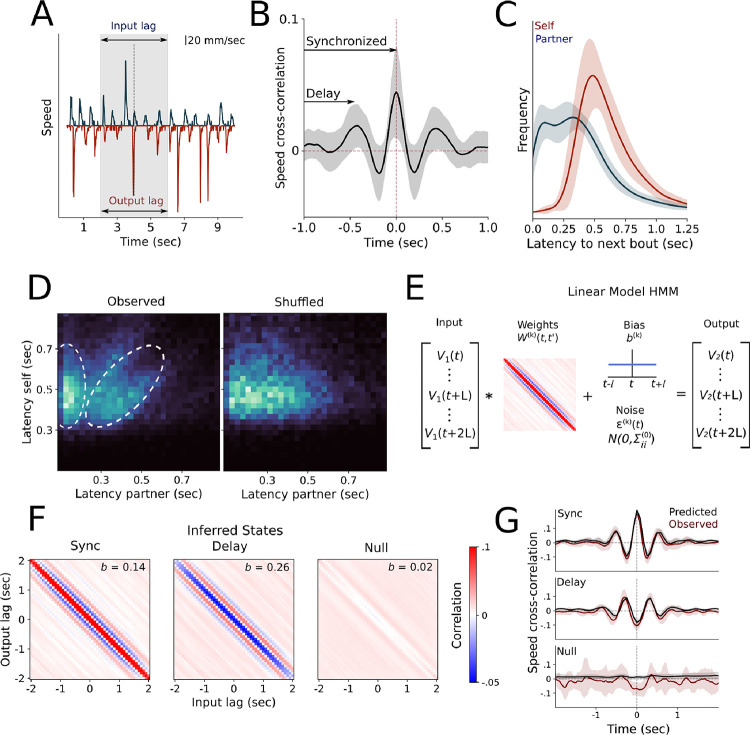
Figure 3.
A.) Example velocities of an interacting pair, with the +/− 2 second input and output lags highlighted in the shaded area. B.) Time-lag velocity cross-correlation, with synchronized and delay elements indicated. Shaded area represents SEM. C.) Histograms of latency to both the target fish’s own next bout, and the partner’s next bout. D.) Phase response curves represented as 2-dimensional heatmap of latency to target fish’s own next bout, and the partner’s next bout. White dotted lines indicate both in-phase and out-of-phase components of interbout interval coordination in the observed data. E.) Schematic of the cLM-HMM. F.) Inferred states after fitting our constrained cLM-HMM to the full behavioral dataset. G.) Observed and predicted cross-correlograms for a representative pair, obtained by convolving the central row of the weights matrix in panel F with the state-weighed autocorrelation of one fish, scaled by the ratio of state-weighed standard deviations of each fish’s speed (see Supplementary Material for details).

