Abstract
Acute pancreatitis, a common exocrine inflammatory disease affecting the pancreas, is characterized by intense abdominal pain and multiple organ dysfunction. However, the alterations in retinal blood vessels among individuals with acute pancreatitis remain poorly understood. This study employed optical coherence tomography angiography (OCTA) to examine the superficial and deep retinal blood vessels in patients with pancreatitis. Sixteen patients diagnosed with pancreatitis (32 eyes) and 16 healthy controls (32 eyes) were recruited from the First Affiliated Hospital of Nanchang University for participation in the study. Various ophthalmic parameters, such as visual acuity, intraocular pressure, and OCTA image for retina consisting of the superficial retinal layer (SRL) and the deep retinal layer (DRL), were recorded for each eye. The study observed the superficial and deep retinal microvascular ring (MIR), macrovascular ring (MAR), and total microvessels (TMI) were observed. Changes in retinal vascular density in the macula through annular partitioning (C1–C6), hemispheric quadrant partitioning (SR, SL, IL, and IR), and early diabetic retinopathy treatment studies (ETDRS) partitioning methods (R, S, L, and I). Correlation analysis was employed to investigate the relationship between retinal capillary density and clinical indicators. Our study revealed that in the superficial retinal layer, the vascular density of TMI, MIR, MAR, SR, IR, S, C2, C3 regions were significantly decreased in patients group compared with the normal group. For the deep retinal layer, the vascular density of MIR, SR, S, C1, C2 regions also reduced in patient group. The ROC analysis demonstrated that OCTA possesses significant diagnostic performance for pancreatitis. In conclusion, patients with pancreatitis may have retinal microvascular dysfunction, and OCTA can be a valuable tool for detecting alterations in ocular microcirculation in pancreatitis patients in clinical practice.
Keywords: Pancreatitis, Optical coherence tomography angiography, Microvascular density
Subject terms: Diseases, Medical research
Introduction
Acute pancreatitis is one of the prevalent abdominal emergencies. The incidence of acute pancreatitis worldwide has been increasing year by year1, and 60–80% of acute pancreatitis is caused by gallstones and alcohol2. Acute pancreatitis is characterized by the aberrant activation of trypsinogen, resulting in inflammatory cell infiltration and secretory cell destruction. It can manifest as a benign, self-limited ailment necessitating only supportive clinical care3, or as a life-threatening disease with serious complications such as pulmonary and renal failure4. Currently, there are some limitations in present approaches for forecasting the severity and prognosis of acute pancreatitis, including clinical evaluation, imaging studies, and analysis of various biochemical markers. Therefore, it is of great significance to explore novel indicators for acute pancreatitis.
Purtscher's retinopathy, initially described by Otmar Purstcher in 1910, refers to the development of retinal hemorrhages and regions of retinal whitening in patients with brain trauma, resulting in decreased visual acuity5. Purtscher-like retinopathy, characterized by similar retinal manifestations, is often associated with medical conditions such as acute pancreatitis, renal failure, disseminated intravascular coagulopathy, thrombotic thrombocytopenic purpura, and autoimmune diseases, rather than trauma6. The pathogenesis of Purtscher-like retinopathy is primarily attributed to the occlusion of precapillary arterioles in the retinal microvasculature. This occlusion may be triggered by various factors including fat emboli, pancreatic proteases, the activation of C5 and complement factors, and leucocyte aggregation, resulting in alterations in the retinal microvasculature7. Patients with severe acute pancreatitis have been reported to develop Purtscher-like retinopathy in some cases8,9. However, there is a lack of research on retinal microvascular alterations in patients with acute pancreatitis, which could prompt the diagnosis and prognosis.
Optical coherence tomography angiography (OCTA) is a non-invasive imaging technique that provides high-resolution visualization of the microvasculature in the retina and choroid10. This technology uses laser reflection off moving red blood cells to accurately maps blood vessels throughout the eye without the need for contrast agents. This novel technology signifies a notable progression in the realm of fundus vascular disease diagnosis and treatment. OCTA has the capability to visualize the supportive band capillary bed and its subtle three-dimensional visualization alterations that are imperceptible through fluorescein angiography (FA)11,12. In the clinical practice, OCTA has shown considerable efficacy in diagnosing and understanding various retinal pathologies, such as diabetic retinopathy13,14, dry and wet age-related macular degeneration15, choroidal neovascularization16, and vascular occlusive disorders17, with a high degree of sensitivity and specificity in detection. Furthermore, OCTA has been applied to the diagnosis of systemic diseases, such as Alzheimer's disease18, Parkinson's disease19 and so on. Our previous OCTA study conducted on patients with Sjogren's syndrome20,21, dermatomyositisand22 and systemic lupus erythematosus23,24 revealed alterations in vascular density in both the superficial and deep retina layers. The results of this study indicate that OCTA has potential utility in diagnosing Sjogren's syndrome and systemic lupus erythematosus.
In this study, we utilized OCTA to observe the changes of deep and superficial retinal blood vessel density in patients with acute pancreatitis, revealing a reduction in retinal vasculature.
Methods and materials
Participants
The research was conducted from June 2023 to December 2023 at the Department of Ophthalmology and Gastroenterology within the First Affiliated Hospital of Nanchang University. Sixteen patients diagnosed with pancreatitis (32 eyes) were recruited from the Department of Gastroenterology, while the healthy control group consisted of healthy individuals (32 eyes) without ocular or systemic diseases. Ophthalmologists affiliated with the First Affiliated Hospital of Nanchang University performed clinical examinations and OCTA imaging to assess for any ocular abnormalities in these participants. The research was granted approval by the local human ethics committee and adhered to the guidelines outlined in the Declaration of Helsinki. Prior to participation in the study, all patients provided written informed consent.
Recruitment criteria
(1) Patients diagnosed with mild acute pancreatitis according to the 2012 Atlanta Acute Pancreatitis classification25; (2) 40 > age > 60 years old; (3) intraocular pressure 10–21 mmHg; (4) refraction < 6.00D; (5) no contact lens use within 2 weeks.
Exclusion conditions
(1) Systemic immune system diseases, such as systemic lupus erythematosus, Sjogren's syndrome, etc. (2) Systemic diseases that affect blood circulation, such as hypertension and diabetes, etc. (3) Ophthalmic diseases, such as glaucoma, cataract, keratoconus, retinopathy, etc. (4) Patients with a history of ophthalmic surgery within 6 months. (5) Patients with contraindications to pupil dilation.
Ethical considerations
The study was conducted in accordance with the principles outlined in the Declaration of Helsinki. The Ethics Committee of the First Affiliated Hospital of Nanchang University approved the study. Each participant agreed to take part in the study after fully understanding the research procedures and being informed of the potential risks. All participants signed a written informed consent form.
Clinical examinations
All participants underwent the following clinical tests and ophthalmic examinations: (1) Assessment of psychological state using the Hospital Anxiety and Depression Scale (HADS); (2) Ocular measurements, including Visual Acuity (VA) (Snellen chart) and Intraocular Pressure (IOP) (Goldmann applanation tonometry); (3) OCTA.
OCTA study
All measurements were conducted by a single examiner utilizing the Angio OCT Optovue RTVue Avanti XR system device (OPTOVUE, USA). The scanning speed was set at 70,000 A scans per second, with a center wavelength of 840 nm, a bandwidth of 45 nm, and an axial resolution of 5 mm. The horizontal resolution rate of 22 μm was utilized for B-scan imaging along the x-axis in a 3 × 3-mm scan mode, encompassing 5 repeat angiography procedures conducted at 216 raster positions along the y-axis, specifically targeting the fovea. The acquisition time for this process was 3.9 s, resulting in the capture of a total of 1080 B-scans were captured, comprising 270 positions at 216 y-axis positions and 5 frames per second. Additionally, 3 × 3 mm OCTA images were obtained through 4 volume scans, including 2 horizontal and 2 vertical grids, resulting in a total of 933,120 scans.
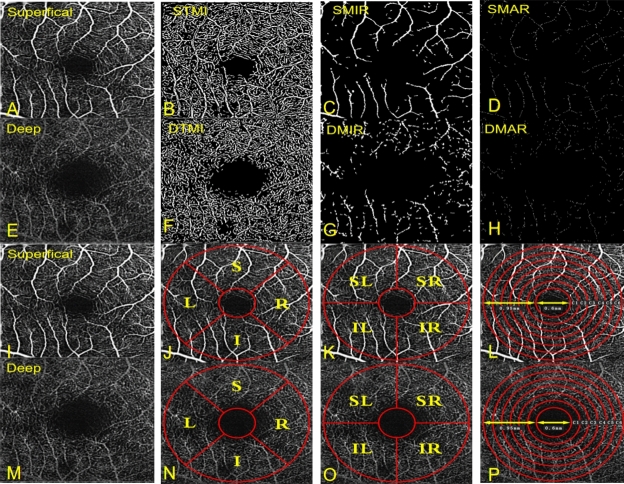
The retinal capillary bed was artificially partitioned into two distinct physiological layers: the superficial retinal layer (SRL, located at the anterior boundary of the inner meso-ganglion cell layer) (Fig. 1A,I) and the deep retinal layer (DRL, situated at the inner border of the inner plexiform lamina and the outer boundary of the outer plexiform lamina) (Fig. 1E,M). Within both layers, macrovascular ring (MAR) (Fig. 1D,H), microvascular ring (MIR) (Fig. 1C,G), and total microvessels (TMI) (Fig. 1B,F) were analyzed. Vascular density was calculated as the ratio of the perfused vessel area to the total measured area. Calculate vessel density was calculated using thresholding algorithms to generate 2D images of SRL or DRL surfaces. Image blocks were segmented and labeled as either 1 (perfusion) or 0 (background) to quantify vessel density akin to length-based metrics. The average tablet image was skeletonized within the area of interest, and results were calculated from the macular center to the 3 × 3 mm edge using a pixel distance of 512 pixels for zooming, thus detecting vascular density gradient image brightness26. Subsequently, custom partition algorithms were applied to analyze the images, which included background noise inversion and the removal of nonvascular structures to create binary images. A single capillary skeleton image with a diameter > 25 mm was obtained by eliminating small blood vessels. The data for all subjects corresponded to their right eye; mirror images and data from the left eye were horizontally flipped for the purpose of averaging and analysis in conjunction with the data from the right eye.
Figure 1.
The 3 × 3 mm OCTA image of the macular region of the retina (A–H). STMI superficial total microvessels, SMAR superficial macrovascular ring, SMIR superficial microvascular ring, DTMI deep total microvessels, DMAR deep macrovascular ring, DMIR deep microvascular ring. Partition methods of the retinal microvascular (I–P). R right, L left, S superior, I inferior, SR superior right, SL superior left, IR inferior right, IL inferior left.
Macular retinal partition method
Hemispherical partition method: according to the diagonal and vertical diagonal of the image, the image was divided into four quadrants: right upper (SR), right lower (IR), left upper (SL), and left lower (IL) quadrants (Fig. 1K,O).
Early Treatment of Diabetic Retinopathy Study (ETDRS) partition method: connecting the two quadrants of the diagonal, the retina was divided into four quadrants, namely upper (S), lower (I), left (L), and right (R) (Fig. 1J,N).
Replacement partition method: the image was divided into six rings with a bandwidth of 0.16 mm, named C1–C6 (Fig. 1L,P).
The Fig. 1 can be a schematic diagram.
Statistical analysis
The data analysis was conducted utilizing SPSS version 27.0 (IBM Corp., Armonk, NY, USA) and GraphPad Prism version 9.5 (GraphPad Software, La Jolla, CA, USA, https://www.graphpad.com/). Mean values ± standard deviations were reported, and statistical comparisons between groups were performed using independent sample t-tests and Chi-square tests. Pearson correlation analysis was employed to assess the relationship between different observational indicators. Receiver operating characteristic (ROC) curves were generated for RT (full, inner, outer) and SVD to evaluate distinctions between individuals with pancreatitis and healthy controls, with the area under the curve (AUC) calculated. Statistical significance was defined as a P-value < 0.05.
Results
General data analysis
This study included a cohort of 16 patients (32 eyes) diagnosed with pancreatitis and 16 cases (32 eyes) from a healthy control group, with a male to female ratio of 1.13:1. The demographic characteristics and clinical data of the participants in both groups were presented in the Table 1.
Table 1.
Demographic characteristics and clinical data of participants in both groups.
| Control | Pancreatitis | t | P | |
|---|---|---|---|---|
| Age (years) | 49.83 ± 3.20 | 50.33 ± .2.80 | 3.175 | 0.747 |
| Gender (m/f) | 8/8 | 9/7 | NA | NA |
| Visual acuity (R) | 0.98 ± 0.07 | 0.54 ± 0.13 | 11.843 | < 0.0001 |
| Visual acuity (L) | 0.83 ± 0.14 | 0.66 ± 0.20 | 2.643 | 0.013 |
Comparison of superficial macular retinal density in the two groups of examined eyes
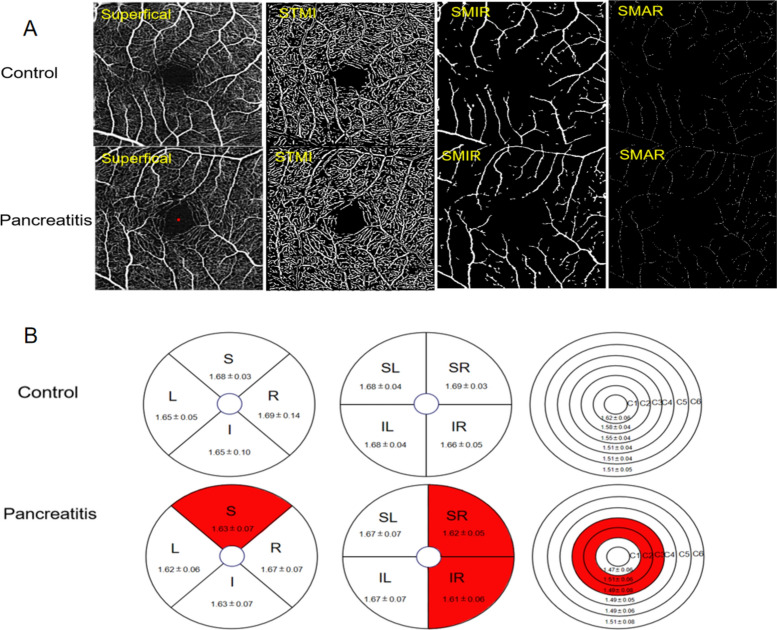
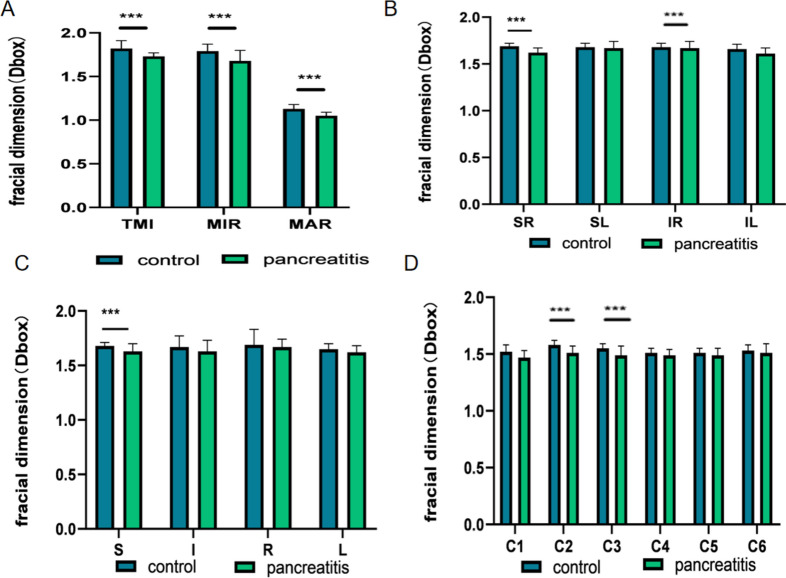
Table 2 presents the findings of retinal density within the superficial macular region, revealing statistically significant differences in superficial TMI, MIR, and MAR between patients with pancreatitis and the control group (Figs. 2A and 3A). Through the application of hemisphere partition, our study revealed a significant reduction in vascular density within the superficial retinal vessels of the SR and IR regions compared to the healthy control group (Figs. 2B and 3B). When employing the ETDRS partition method, a statistically significant decrease in vascular density was observed in the S region in comparison to the healthy control group (Figs. 2B and 3C). Furthermore, utilizing the annular partition method, a significant reduction in vascular density was observed in the superficial regions of C2 and C3 (Figs. 2B and 3D).
Table 2.
Comparison of superficial macular retinal density in the two groups of examined eyes.
| Control | Pancreatitis | t | P | |
|---|---|---|---|---|
| TMI | 1.82 ± 0.09 | 1.73 ± 0.04 | 5.304 | < 0.0001 |
| MIR | 1.79 ± 0.08 | 1.68 ± 0.12 | 4.326 | < 0.0001 |
| MAR | 1.13 ± 0.05 | 1.05 ± 0.04 | 7.687 | < 0.0001 |
| SR | 1.69 ± 0.03 | 1.62 ± 0.05 | 6.938 | < 0.0001 |
| SL | 1.68 ± 0.04 | 1.67 ± 0.07 | 0.505 | 0.616 |
| IL | 1.68 ± 0.04 | 1.67 ± 0.07 | 0.941 | 0.352 |
| IR | 1.66 ± 0.05 | 1.61 ± 0.06 | 3.793 | < 0.0001 |
| S | 1.68 ± 0.03 | 1.63 ± 0.07 | 4.051 | < 0.0001 |
| I | 1.67 ± 0.10 | 1.63 ± 0.10 | 1.650 | 0.104 |
| R | 1.69 ± 0.14 | 1.67 ± 0.07 | 0.611 | 0.543 |
| L | 1.65 ± 0.05 | 1.62 ± 0.06 | 2.116 | 0.038 |
| C1 | 1.52 ± 0.06 | 1.47 ± 0.06 | 2.854 | 0.006 |
| C2 | 1.58 ± 0.04 | 1.51 ± 0.06 | 5.614 | < 0.0001 |
| C3 | 1.55 ± 0.04 | 1.49 ± 0.08 | 3.846 | < 0.0001 |
| C4 | 1.51 ± 0.04 | 1.49 ± 0.05 | 2.250 | 0.028 |
| C5 | 1.51 ± 0.04 | 1.49 ± 0.06 | 1.471 | 0.146 |
| C6 | 1.53 ± 0.05 | 1.51 ± 0.08 | 1.343 | 0.184 |
Figure 2.
The alteration of superficial macular retinal density between control group and patient group. (A) Superficial retinal vessel density map of control group and patient group. (B) Results of superficial retinal vascular density in different regions of control group and patient group (MD ± SD). STMI superficial total microvessels, SMAR superficial macrovascular ring, SMIR superficial microvascular ring, L left, R right, S superior, I inferior, IL inferior left, IR inferior right, SL superior left, SR superior right.
Figure 3.
Results of superficial retinal vascular density analysis in control and pancreatitis groups. (A–D) The quantitative statistics of superficial retinal vascular density in different regions between control and pancreatitis groups. TMI total microvessels, MAR macrovascular ring, MIR microvascular ring, L left, R right, S superior, I inferior, IL inferior left, IR inferior right, SL superior left, SR superior right. ***P < 0.001.
Comparison of deep retinal density in the macula in two groups of examined eyes
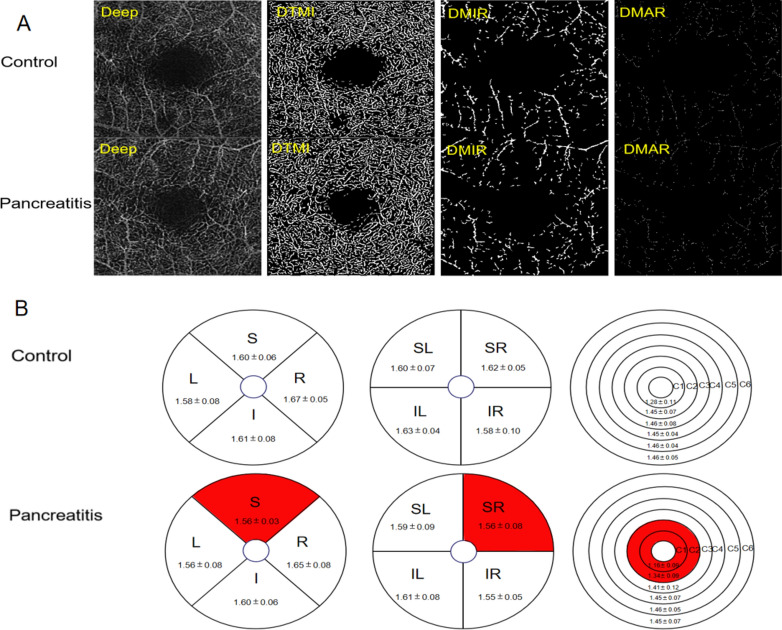
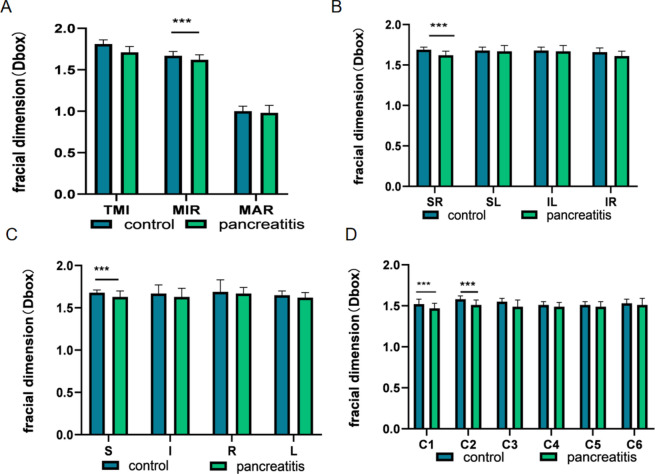
Table 3 presents the results of retinal density within the deep macular region, revealing statistically significant differences in deep TMI, MIR and MAR between patients with pancreatitis and the control group (Fig. 4A). The study observed a significant decrease in the density of deep temporal macular and deep macular inner retinal layers in patients diagnosed with pancreatitis (Fig. 5A). The study employed the hemisphere partition technique to demonstrate a significant decrease in the density of deep retinal capillaries in the SR region compared to the healthy control group (Figs. 4B and 5B). The application of the ETDRS partition method revealed a statistically significant reduction in vascular density in the S region when compared to the healthy control group (Figs. 4B and 5C). Moreover, the microvascular density in the C1 and C2 regions exhibited a significant decrease when analyzed using the ring partition method (Figs. 4B and 5D).
Table 3.
Comparison of deep retinal density in the macula in the eyes of the two groups examined.
| Control | Pancreatitis | t | P | |
|---|---|---|---|---|
| TMI | 1.81 ± 0.05 | 1.71 ± 0.07 | 3.494 | 0.001 |
| MIR | 1.67 ± 0.05 | 1.62 ± 0.06 | 5.631 | < 0.0001 |
| MAR | 1.00 ± 0.06 | 0.98 ± 0.09 | 1.495 | 0.140 |
| SR | 1.62 ± 0.05 | 1.56 ± 0.08 | 4.384 | < 0.0001 |
| SL | 1.60 ± 0.07 | 1.59 ± 0.09 | 1.038 | 0.303 |
| IL | 1.63 ± 0.04 | 1.61 ± 0.08 | 1.508 | 0.137 |
| IR | 1.58 ± 0.10 | 1.55 ± 0.05 | 3.007 | 0.003 |
| S | 1.60 ± 0.06 | 1.56 ± 0.03 | 4.817 | < 0.0001 |
| I | 1.61 ± 0.08 | 1.60 ± 0.06 | 1.597 | 0.115 |
| R | 1.67 ± 0.05 | 1.65 ± 0.08 | 1.041 | 0.303 |
| L | 1.58 ± 0.08 | 1.56 ± 0.08 | 1.148 | 0.255 |
| C1 | 1.28 ± 0.11 | 1.16 ± 0.09 | 5.209 | < 0.0001 |
| C2 | 1.45 ± 0.07 | 1.34 ± 0.09 | 6.711 | < 0.0001 |
| C3 | 1.46 ± 0.08 | 1.41 ± 0.12 | 2.619 | 0.013 |
| C4 | 1.45 ± 0.04 | 1.45 ± 0.07 | 0.839 | 0.405 |
| C5 | 1.46 ± 0.04 | 1.46 ± 0.05 | 0.602 | 0.550 |
| C6 | 1.46 ± 0.05 | 1.45 ± 0.07 | 1.220 | 0.227 |
Figure 4.
Results of deep retinal vascular density analysis in control and pancreatitis groups. (A) Superficial retinal vessel density map of control group and patient group. (B) Results of deep retinal vascular density in different regions of normal group and pancreatitis group (MD ± SD). DTMI deep total microvessels, DMAR deep macrovascular ring, DMIR deep microvascular ring, L left, R right, S superior, I inferior, IL inferior left, IR inferior right, SL superior left, SR superior right.
Figure 5.
Results of deep retinal vascular density analysis in control and pancreatitis groups. (A–D) The quantitative statistics of deep retinal vascular density in different regions between control and pancreatitis groups. TMI total microvessels, MAR macrovascular ring, MIR microvascular ring, L left, R right, S superior, I inferior, IL inferior left, IR inferior right, SL superior left, SR superior right. ***P < 0.001.
ROC curve analysis of superficial and deep retinal vessel densities in different regions for pancreatitis
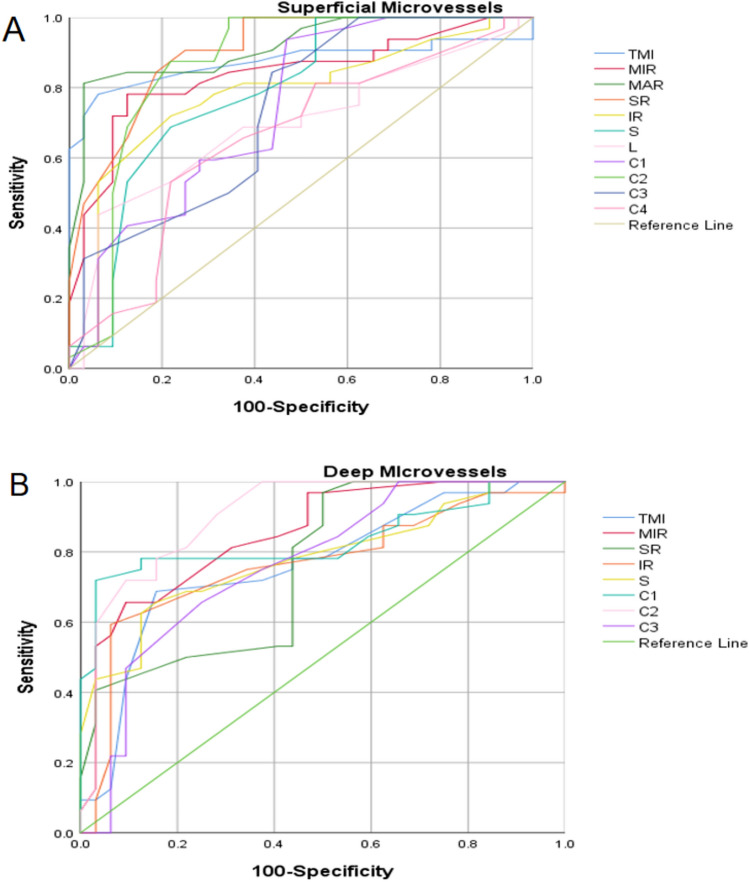
Statistically significant differences were observed in various retinal parameters, including TMI, MIR, MAR, SR, IR, S, L, C1, C2, C3, and C4, within the superficial layer of the retina in the pancreatitis group (P < 0.05). The area under the ROC curve for large vessels in the superficial retinal density was calculated to be 0.917 (95% confidence interval [CI] = 0.849–0.985), indicating an increased diagnostic sensitivity for pancreatitis when assessing superficial retinal density (Fig. 6A). Significant variations in TMI, MIR, SR, IR, S, C1, C2, and C3 areas were also observed in the deep retinal layer of the pancreatitis group (P < 0.05). The area under the ROC curve in the C2 region of deep retinal density is 0.907 (95% CI = 0.833–0.981), suggesting a greater diagnostic sensitivity for pancreatitis with respect to deep retinal density (Fig. 6B).
Figure 6.
ROC curve analysis of sectorial, quadrantal and annular microvascular densities of retinal layer. (A) The ROC curve analysis of superficial retinal layer; (B) The ROC curve analysis of deep retinal layer. I inferior, IL inferior left, IR inferior right, L left, R right, DTMI deeper total microvessels.
Discussion
In most cases, acute pancreatitis is a mild, self-limited disease, but certain individuals may progress to multi-organ disorders including eye27,28. In this research, we performed OCTA detection in patients with acute pancreatitis and healthy control to quantitatively observe the density of superficial and deep retinal vessels. As a result, we found that the vessels density of retina in superficial and deep layer are both significantly decreased in patients with acute pancreatitis. Furthermore, we performed ROC analysis between different partition of superficial and deep layer of retina to calculate the area under the curve. These results show that retinal vascular changes may serve as a potential diagnostic marker for the diagnosis of acute pancreatitis.
The association between non-ocular lesions and retinopathy, particularly chronic and acute cases of pancreatitis, has been extensively studied. To determine whether retinal abnormalities were present in patients with chronic pancreatitis, P Toskes et al.29 conducted a study to assess 28 patients with chronic pancreatitis and 19 healthy subjects by performing fundus examination and retinal function. The results showed a 40% increase in the final threshold for dark adaptation in patients with pancreatitis, irrespective of the presence of steatorrhea was significantly increased by 40% in patients with pancreatitis. Patients with steatorrhea had a significant reduction of approximately 42% in electroretinal B waves. Notably, even in the absence of steatorrhea, nondiabetic retinopathy and retinal dysfunction are prevalent in patients with chronic pancreatitis. Another, Kim et al.30 found a potential correlation between the onset of central retinal vein occlusion following necrotizing pancreatitis induced by alcohol abuse may and the transient hypercoagulability of the blood. Besides, Hamp et al.31 reported a case of acute dark field and vision loss after 1 week of hospitalization for acute pancreatitis. Upon retinal examination, it was observed that there were multiple scattered areas of retinal whitening accompanied by bilateral optic nerve hemorrhages, ultimately confirming the presence of Purtscher-like retinopathy. When considering the various main theories surrounding the pathogenesis of acute pancreatitis, including the pancreatic autodigestion theory, microcirculation disturbance theory, bile-pancreatic duct common pathway theory, pancreatic acinar cell apoptosis, leukocyte excessive activation theory, and necrosis theory32, it becomes apparent that these factors may contribute to the development of retinopathy in cases of acute pancreatitis. Indeed, following pancreatic injury or inflammation, proteases such as trypsin can activate the complement system, resulting in the formation of C5A-induced aggregates of leukocytes, platelets, and fibrin. This process can lead to retinal embolism and ischemia7. The excessive complement activation during systemic inflammation in acute pancreatitis can cause Purtscher-like retinopathy8. Our findings align with previous research indicating a significantly reduction in retinal vasculature during acute pancreatitis. The presence of vessel emboli may play a central role in explaining this clinical phenomenon.
The retina, an inner layer of the ocular tissue characterized by high metabolic activity, receives its blood supply from the central retinal artery. The retinal microvasculature supports the visual function of the retina by supplying oxygen, nutrients, and removing waste products from retinal cells33. Based on OCT, it provides depth-resolution images of retinal and choroidal blood flow with a higher level of detail10.
In this study, OCTA was used to assess retinal vessel density in patients with acute pancreatitis and healthy control. The results indicate a significant decrease in vascular density in the vascular density of TMI, MIR, MAR, SR, IR, S, C2, C3 in patients group compared to the normal group in the superficial retinal layer. Similarly, in the deep retinal layer, a decrease in vascular density was observed in the MIR, SR, S, C1, C2 regions among patient group. It is hypothesized that trypsin activation in acute pancreatitis may trigger the complement system, leading to disruptions in the blood-retinal barrier, interference with neurovascular units, and alterations in the retinal microvascular structure. Further research is required to validate this hypothesis. It should be noticed that there was a significant reduction in both the microvascular and macrovascular density in the superficial layer, while only macrovascular density was decreased in the deep layer. This discrepancy may be attributed to the subtle discrepancy of the structure of superficial and deep vessels. In addition, randomness of emboli serves as a reasonable explanation for the alterations of vascular density in different regions34,35.
There are some limitations existing in our study. On the one hand, the sample size enrolled is small, so it is worth further study on large sample to testify the conclusions derived from this study; On the other hand, the age range of the included group was about 50 years old, and acute pancreatitis could occur in all ages36, but the retinal vascular density of young patients with acute pancreatitis was not included in the study. Additionally, these deficiencies and the mechanism of retinal vascular density changes in patients with acute pancreatitis need further study.
Conclusions
In contrast to the healthy subjects, the vascular density of the superficial and deep retina in patients with pancreatitis is decreased. It should be cautioned that retinal microvascular dysfunction may be present in patients with pancreatitis in clinical practice. Moreover, OCTA can effectively detect changes in ocular microcirculation in patients with pancreatitis.
Author contributions
Conceptualization, Yan-Mei Zeng and Yi Shao; Methodology, Jin‑Yu Hu, Qian‑Min Ge; Software, Jie Zou, Hong Wei; Formal analysis, Qian Ling, Liang‑Qi He.; Investigation, Cheng Chen; Data curation, Xiao-Yu Wang; Writing—original draft, Yun-Qing Luo and Zi-Song Xu; Writing—review and editing and Visualization, Yun-Qing Luo; Manuscript polishing, Xian-Mei Zhou, Xuan Liao; Supervision and Funding acquisition, Yun-Qing Luo and Zi-Song. All authors have read and agreed to the published version of the manuscript.
Funding
The author(s) disclosed receipt of the following financial support for the research, authorship, and/or publication of this article: This work was supported by the Major (Key) R&D Program of Jiangxi Province, Jiangxi Province Double Thousand Plan Science and Technology Innovation High-end Talent Project (2022), Excellent Talents Development Project of Jiangxi Province, National Natural Science Foundation of China (grant number 20181 bbg70004, 20203BBG73059, 2022103, 2022, 20192BCBL23020, 82160195).
Data availability
The data used and/or analyzed during the present study are available from the corresponding author on reasonable request.
Competing interests
The authors declare no competing interests.
Footnotes
Publisher's note
Springer Nature remains neutral with regard to jurisdictional claims in published maps and institutional affiliations.
These authors contributed equally: Yun-Qing Luo, Zi-Song Xu, Yan-Mei Zeng and Yi Shao.
Contributor Information
Yan-Mei Zeng, Email: 1421204590@qq.com.
Yi Shao, Email: freebee99@163.com.
References
- 1.Iannuzzi, J. P. et al. Global incidence of acute pancreatitis is increasing over time: A systematic review and meta-analysis. Gastroenterology162(1), 122–134 (2022). 10.1053/j.gastro.2021.09.043 [DOI] [PubMed] [Google Scholar]
- 2.Roberts, S. E. et al. The incidence and aetiology of acute pancreatitis across Europe. Pancreatology17(2), 155–165 (2017). 10.1016/j.pan.2017.01.005 [DOI] [PubMed] [Google Scholar]
- 3.Moggia, E. et al. Pharmacological interventions for acute pancreatitis. Cochrane Database Syst. Rev.4(4), CD011384 (2017). [DOI] [PMC free article] [PubMed] [Google Scholar]
- 4.Zerem, E. et al. Current trends in acute pancreatitis: Diagnostic and therapeutic challenges. World J. Gastroenterol.29(18), 2747–2763 (2023). 10.3748/wjg.v29.i18.2747 [DOI] [PMC free article] [PubMed] [Google Scholar]
- 5.El-Koofy, N. M. et al. Management strategy and novel ophthalmological findings in neonatal severe hypertriglyceridemia: A case report and literature review. Lipids Health Dis.20(1), 38 (2021). 10.1186/s12944-021-01464-2 [DOI] [PMC free article] [PubMed] [Google Scholar]
- 6.Prabhu, V. et al. Internal limiting membrane separation and posterior vitreous hyperreflective dots: Novel OCT findings in Purtscher-like retinopathy. BMC Ophthalmol.24(1), 137 (2024). 10.1186/s12886-024-03413-w [DOI] [PMC free article] [PubMed] [Google Scholar]
- 7.Massa, R. et al. Purtscher-like retinopathy. Case Rep. Ophthalmol. Med.2015, 421329 (2015). [DOI] [PMC free article] [PubMed] [Google Scholar]
- 8.Gahn, G. M. et al. Purtscher’s-like retinopathy associated with acute pancreatitis. Am. J. Ophthalmol. Case Rep.20, 100892 (2020). 10.1016/j.ajoc.2020.100892 [DOI] [PMC free article] [PubMed] [Google Scholar]
- 9.Rišková, L. et al. Purtscher-like retinopathy as a complication of acute pancreatitis. Rozhl. Chir.95(12), 449–452 (2016). [PubMed] [Google Scholar]
- 10.Spaide, R. F. et al. Optical coherence tomography angiography. Prog. Retin. Eye Res.64, 1–55 (2018). 10.1016/j.preteyeres.2017.11.003 [DOI] [PMC free article] [PubMed] [Google Scholar]
- 11.Lin, Z. et al. Quantitative evaluation of retinal and choroidal changes in Fabry disease using optical coherence tomography angiography. Lasers Med. Sci.37(1), 269–277 (2022). 10.1007/s10103-020-03242-5 [DOI] [PubMed] [Google Scholar]
- 12.Lin, F. et al. Longitudinal changes in macular optical coherence tomography angiography metrics in primary open-angle glaucoma with high myopia: A prospective study. Investig. Ophthalmol. Vis. Sci.62(1), 30 (2021). 10.1167/iovs.62.1.30 [DOI] [PMC free article] [PubMed] [Google Scholar]
- 13.Zeng, Q. Z. et al. Comparison of 24 × 20 mm(2) swept-source OCTA and fluorescein angiography for the evaluation of lesions in diabetic retinopathy. Int. J. Ophthalmol.15(11), 1798–1805 (2022). 10.18240/ijo.2022.11.10 [DOI] [PMC free article] [PubMed] [Google Scholar]
- 14.Waheed, N. K. et al. Optical coherence tomography angiography in diabetic retinopathy. Prog. Retin. Eye Res.97, 101206 (2023). 10.1016/j.preteyeres.2023.101206 [DOI] [PMC free article] [PubMed] [Google Scholar]
- 15.Roisman, L. & Goldhardt, R. OCT angiography: An upcoming non-invasive tool for diagnosis of age-related macular degeneration. Curr. Ophthalmol. Rep.5(2), 136–140 (2017). 10.1007/s40135-017-0131-6 [DOI] [PMC free article] [PubMed] [Google Scholar]
- 16.Kongwattananon, W. et al. Role of optical coherence tomography angiography in detecting and monitoring inflammatory choroidal neovascularization. Retina42(6), 1047–1056 (2022). 10.1097/IAE.0000000000003420 [DOI] [PMC free article] [PubMed] [Google Scholar]
- 17.Wang, J. et al. Deep learning for diagnosing and segmenting choroidal neovascularization in OCT angiography in a large real-world data set. Transl. Vis. Sci. Technol.12(4), 15 (2023). 10.1167/tvst.12.4.15 [DOI] [PMC free article] [PubMed] [Google Scholar]
- 18.Cunha, J. P. et al. OCT in Alzheimer’s disease: Thinning of the RNFL and superior hemiretina. Graefes Arch. Clin. Exp. Ophthalmol.255(9), 1827–1835 (2017). 10.1007/s00417-017-3715-9 [DOI] [PubMed] [Google Scholar]
- 19.Lauermann, J. L. et al. Applicability of optical coherence tomography angiography (OCTA) imaging in Parkinson’s disease. Sci. Rep.11(1), 5520 (2021). 10.1038/s41598-021-84862-x [DOI] [PMC free article] [PubMed] [Google Scholar]
- 20.Yang, Q. C. et al. Ocular microvascular alteration in Sjögren syndrome. Quant. Imaging Med. Surg.12(2), 1324–1335 (2022). 10.21037/qims-21-234 [DOI] [PMC free article] [PubMed] [Google Scholar]
- 21.Liu, R. et al. Optical coherence tomography angiography biomarkers of retinal thickness and microvascular alterations in Sjogren’s syndrome. Front. Neurol.13, 853930 (2022). 10.3389/fneur.2022.853930 [DOI] [PMC free article] [PubMed] [Google Scholar]
- 22.Huang, B. Z. et al. Retinal microvascular and microstructural alterations in the diagnosis of dermatomyositis: A new approach. Front. Med. (Lausanne)10, 1164351 (2023). 10.3389/fmed.2023.1164351 [DOI] [PMC free article] [PubMed] [Google Scholar]
- 23.Liu, R. et al. Retinal thickness and microvascular alterations in the diagnosis of systemic lupus erythematosus: A new approach. Quant. Imaging Med. Surg.12(1), 823–837 (2022). 10.21037/qims-21-359 [DOI] [PMC free article] [PubMed] [Google Scholar]
- 24.Shi, W. Q. et al. Retinal microvasculature and conjunctival vessel alterations in patients with systemic lupus erythematosus—An optical coherence tomography angiography study. Front. Med. (Lausanne)8, 724283 (2021). 10.3389/fmed.2021.724283 [DOI] [PMC free article] [PubMed] [Google Scholar]
- 25.Sarr, M. G. 2012 revision of the Atlanta classification of acute pancreatitis. Pol. Arch. Med. Wewn123(3), 118–124 (2023). 10.20452/pamw.1627 [DOI] [PubMed] [Google Scholar]
- 26.Mirshahi, R. et al. Foveal avascular zone segmentation in optical coherence tomography angiography images using a deep learning approach. Sci. Rep.11(1), 1031 (2021). 10.1038/s41598-020-80058-x [DOI] [PMC free article] [PubMed] [Google Scholar]
- 27.Forsmark, C. E., Vege, S. S. & Wilcox, C. M. Acute pancreatitis. N. Engl. J. Med.375(20), 1972–1981 (2016). 10.1056/NEJMra1505202 [DOI] [PubMed] [Google Scholar]
- 28.Feng, Y. C. et al. Study on acute recent stage pancreatitis. World J. Gastroenterol.20(43), 16138–16145 (2014). 10.3748/wjg.v20.i43.16138 [DOI] [PMC free article] [PubMed] [Google Scholar]
- 29.Toskes, P. P. et al. Non-diabetic retinal abnormalities in chronic pancreatitis. N. Engl. J. Med.300(17), 942–946 (1979). 10.1056/NEJM197904263001702 [DOI] [PubMed] [Google Scholar]
- 30.Kim, E. J. et al. Central retinal vein occlusion secondary to necrotizing pancreatitis. R I Med. J.105(8), 50–51 (2022). [PubMed] [Google Scholar]
- 31.Hamp, A. M. et al. Purtscher’s retinopathy associated with acute pancreatitis. Optom. Vis. Sci.91(2), e43-51 (2014). 10.1097/OPX.0000000000000132 [DOI] [PubMed] [Google Scholar]
- 32.Wang, G. J. et al. Acute pancreatitis: Etiology and common pathogenesis. World J. Gastroenterol.15(12), 1427–1430 (2009). 10.3748/wjg.15.1427 [DOI] [PMC free article] [PubMed] [Google Scholar]
- 33.Hoon, M. et al. Functional architecture of the retina: Development and disease. Prog. Retin. Eye Res.42, 44–84 (2014). 10.1016/j.preteyeres.2014.06.003 [DOI] [PMC free article] [PubMed] [Google Scholar]
- 34.Elwood, K. F. et al. Purtscher-like retinopathy with cardioembolic stroke: Case report and literature review. Case Rep. Ophthalmol.13(3), 943–948 (2022). 10.1159/000527038 [DOI] [PMC free article] [PubMed] [Google Scholar]
- 35.Sissingh, N. J. et al. Therapeutic anticoagulation for splanchnic vein thrombosis in acute pancreatitis: A systematic review and meta-analysis. Pancreatology22(2), 235–243 (2022). 10.1016/j.pan.2021.12.008 [DOI] [PubMed] [Google Scholar]
- 36.Beyer, G. et al. Clinical practice guideline—Acute and chronic pancreatitis. Dtsch. Arztebl. Int.119(29–30), 495–501 (2022). [DOI] [PMC free article] [PubMed] [Google Scholar]
Associated Data
This section collects any data citations, data availability statements, or supplementary materials included in this article.
Data Availability Statement
The data used and/or analyzed during the present study are available from the corresponding author on reasonable request.


