

Abstract
Background
Achalasia poses a significant socioeconomic burden, yet global trends remain undocumented. This study aims to describe the worldwide trends in the incidence and prevalence of achalasia from 1925 to 2021 and explore their correlation with various factors through a comprehensive systematic review.
Methods
We searched the PubMed/MEDLINE, Embase, and Cochrane databases from inception to 30 June 2023, to identify studies reporting the incidence or prevalence of achalasia in the general population. This study utilized pooled estimates with 95% confidence intervals (CI) to estimate the incidence and prevalence of achalasia, and conducted various subgroup analyses.
Results
A total of 26 eligible studies covering approximately 269 million participants and 20,873 patients from 14 countries across five continents were included. Global pooled incidence and prevalence of achalasia were estimated to be 0.78 cases per 100,000 person‐years (95% CI, 0.64–0.93; number of studies, 26; sample population, 269,315,171) and 10.82 cases per 100,000 person‐years (95% CI, 8.15–13.48; number of studies, 14; sample population, 192,176,076), respectively. The incidence of achalasia was higher in Oceania (than Asia and Africa) and in adults (than children) after the introduction of the Chicago classification. Prevalence followed a similar pattern. The pooled incidence of achalasia showed an overall upward trend from 1925 to 2021 (1925–1999; 0.40 [0.32–0.49] vs. 2018–2021; 1.64 [1.33–1.95] cases per 100,000 person‐years).
Conclusions
The incidence and prevalence of achalasia have notably increased, particularly with advancements in diagnosis, and show significant variation worldwide, despite the large heterogeneity within the sample population. Further studies are necessary to accurately assess the global incidence and prevalence of achalasia.
Keywords: achalasia, incidence, meta‐analysis, prevalence, systematic review

Key summary.
Summarise the established knowledge of this study
Achalasia is a rare motility disorder of the esophagus characterized by impaired relaxation of the lower esophageal sphincter, and has a high economic burden due to serious symptoms and risk factors for malignancy.
What are the significant and/or new findings of this study?
Global pooled incidence and prevalence of achalasia were estimated to be 0.78 cases per 100,000 person‐years and 10.82 cases per 100,000 person‐years.
The incidence of achalasia was higher in Oceania (compared to Asia and Africa) and in adults (compared to children) after the introduction of the Chicago classification.
The incidence and prevalence of achalasia tended to gradually increase over time, and this became noticeable with the development of novel diagnostic tools and the introduction of systematic diagnostic criteria.
INTRODUCTION
Achalasia is a rare motility disorder of the esophagus characterized by impaired relaxation of the lower esophageal sphincter. 1 Not only does this condition impose high economic burdens, but it also poses a significant risk factor for esophageal cancer. 1 , 2
Considering the studies organized thus far or the pathophysiological mechanism, the incidence and prevalence of achalasia increase with age and are known to be common in patients in their 50s or older. 1 , 2 However, no studies have systematically analyzed differences between races or countries or specified changes in worldwide incidence and prevalence based on variations in years and diagnostic criteria/tools.
Understanding the global incidence and prevalence of achalasia and its temporal trends is crucial for informing medical policies and guiding future research directions. Therefore, this study aims to comprehensively analyze the global, regional, and national trends in the incidence and prevalence of achalasia from 1925 to 2021, including various subgroup analyses.
METHODS
This systematic literature review and meta‐analysis were undertaken to examine global trends in the incidence and prevalence of achalasia. The study adhered to the Preferred Reporting Items for Systematic Reviews and Meta‐Analyses guidelines, 3 and the protocol was registered in PROSPERO (CRD42023457597).
Search strategy and study selection
We conducted a comprehensive search of PubMed/MEDLINE, Embase, and Cochrane databases from their inception to 30 June 2023, to identify studies reporting the incidence or prevalence of achalasia. These studies utilized appropriate diagnostic methods relevant to the time of the study and encompassed all age groups. Eligibility criteria included studies with participants from the general population or community‐based datasets.
To ensure the validity of our results, several exclusion criteria were applied. Studies lacking essential measures such as the number of cases, population, year of occurrence, or collection period were excluded. We utilized the calculation results from the included studies, entering only the incidence (or prevalence) and the corresponding population with an exact date and period match. Additionally, biased samples, including individuals attending health checkups at screening clinics, employees at institutions, or university students, were excluded. Studies with the same target population or fewer than 50 participants were also omitted. Given the absence of interventional studies, our inclusion criteria were limited to general population‐based observational studies with larger sample sizes. Language restrictions were not imposed, and when necessary, content was verified through translation.
The databases were searched using the terms “achalasia,” which were combined using the set operator “AND” with studies identified using the terms “incidence” or “prevalence” as free text terms. Initially, 1221 studies were screened; subsequently, the titles and abstracts of all selected studies were rescreened to identify potential suitability. Non‐eligible studies were excluded after the initial screening. A recursive search was performed using the bibliographies of all eligible papers. Two investigators (KL and WC) independently assessed the eligibility for the study, and disagreements were resolved through discussion with a third investigator (DKY).
Data extraction and statistical analysis
Data were independently extracted by two investigators (KL and WC) using Microsoft Excel 2013 (Microsoft, Redmond, WA, USA). The following data were collected from each study: the first author, year, country, region, number of cases, study period, study design, population, data source, and diagnosis. The incidence and prevalence rates of achalasia in the total population and subgroups were extracted from each study. As representative incidence and prevalence for each study, we used the mean annual values. If the included studies provided data for individual years, we used the data for each year. Otherwise, we used the mean annual incidence based on the middle year of the study period. All studies were assessed for risk of bias (RoB) using the criteria developed by Hoy et al. 4 Based on an evaluation of nine items, a study was deemed to have low RoB if three or fewer items were relevant, and high RoB if seven or more were applicable.
Subgroup analyses were conducted based on sex, age group (adults and children), year group (before 2000, 2000–2009, 2010–2013, 2014–2017, and 2018–2021), national development level, continent (Africa [Algeria, Zimbabwe], Asia [Israel, Japan, Singapore, South Korea], Europe [Iceland, Italy, Netherlands, United Kingdom], North America [Canada, United States], Oceania [Australia, New Zealand]), data source (research validated and code‐based), and diagnostic criteria (before and after 2009). 5 We classified countries into two groups based on the human development index (HDI). 6 The first group consisted of countries with an HDI greater than 0.92, which included Canada, Japan, the Netherlands, New Zealand, Singapore, South Korea, the United Kingdom, and the United States. The second group comprises countries with an HDI lower than 0.92, such as Algeria, Israel, Italy, and Zimbabwe. We assumed that the cases were randomly sampled from the population and that the incidence and prevalence rates were approximately normally distributed.
A Der Simonian and Laird random‐effects model was used to estimate the pooled estimate for global incidence and prevalence, along with 95% confidence intervals (CIs). Heterogeneity was quantified using the I2 statistic via Q‐statistics. 7 Egger's regression test was employed in this meta‐analysis to assess publication bias. 8 Furthermore, a 95% prediction interval was calculated to make predictions about the effect size of a new study that would be expected to arise from the same population as the included studies. 3 This interval provides a range within which the true effect size of the new study is likely to fall with a certain level of confidence. Microsoft Excel and R software (version 3.1.1; R Foundation, Vienna, Austria) were used to calculate the main results and generate all tables. Statistical significance was set at two‐sided p < 0.05.
RESULTS
Initially, the search strategy identified 2306 studies. Of these, 26 studies met the eligibility criteria, 2 , 9 , 10 , 11 , 12 , 13 , 14 , 15 , 16 , 17 , 18 , 19 , 20 , 21 , 22 , 23 , 24 , 25 , 26 , 27 , 28 , 29 , 30 , 31 , 32 , 33 involving 269,315,171 participants and 20,873 patients with achalasia from 14 countries across five continents. Figure 1 shows a global incidence and prevalence map, and figure S1 summarizes the results of the search strategy. Data of patients with achalasia from 1922 to 2021 were extracted, and all studies were conducted in a single country. Table 1 shows the details of all the included studies. The studies included in the analysis encompass both code‐based and researcher‐validated studies, not exclusively reliant on the diagnosis with high‐resolution manometry (HRM). Thus, for a comprehensive analysis, we examined all studies that initially defined participants as achalasia during the study period. Additionally, we selected and analyzed studies that align with the current standard for achalasia, specifically researcher‐validated studies utilizing HRM for diagnosis. The incidence and prevalence data are presented in Table S1, while the incidence trend is illustrated in Figure S2.
FIGURE 1.
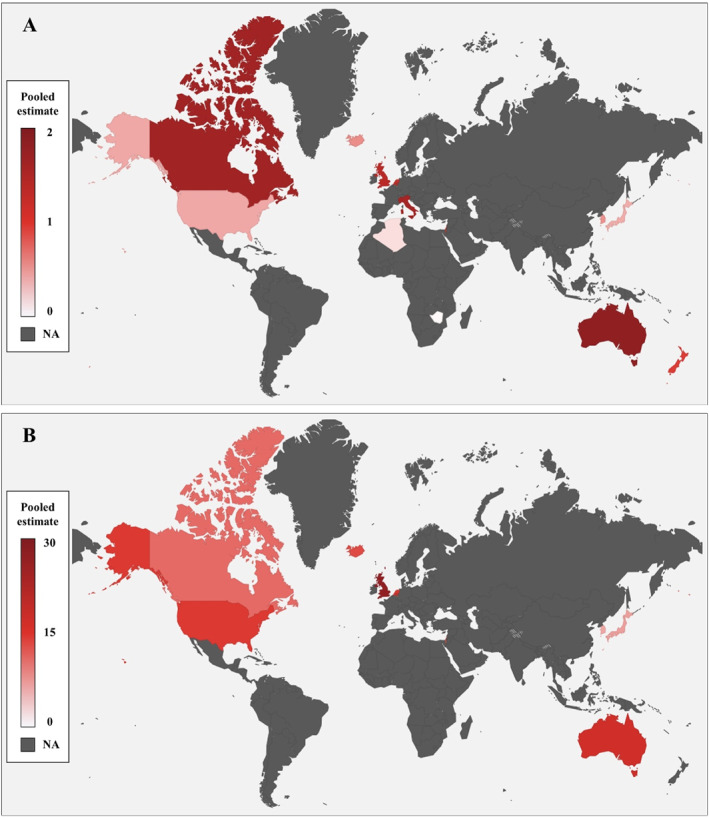
Global incidence (a) and prevalence (b) of achalasia, 1925–2021. Pooled estimates: cases per 100,000 population.
TABLE 1.
Summary of the included studies.
| First author, year | Country | Region | Mean annual incidence | Study period | Study design | Population | Data source | Diagnosis | |
|---|---|---|---|---|---|---|---|---|---|
| Cases, n | Total (male/female) | ||||||||
| Arber et al., 1993 | Israel | Tel aviv | 162 | 0.97 (0.95/0.99) | 1973–1983 | Retrospective | All | Hospital | EM, endoscopy, esophagography |
| Birgisson et al., 2007 | Iceland | ‐ | 62 | 0.55 (0.58/0.52) | 1952–2002 | Retrospective | All | Database, manual searching | ICD code, EM, esophagography |
| Duffield et al., 2017 | Australia | South | 288 | 2.30 (2.55/2.05) | 2004–2013 | Prospective | Adults | Australian Bureau of statistics | EM |
| Earlam et al., 1969 | United States | Rochester | 7 | 0.58 (1.04/0.17) | 1925–1964 | Retrospective | All | Mayo clinic, medical institutions | Esophagography |
| Farrukh et al., 2008 | United Kingdom | Leicester | 14 | 0.89 (1.17/0.62) | 1986–2005 | Retrospective | Adults | National census | EM, endoscopy, esophagography |
| Galen et al., 1982 | United States | Virginia | 31 | 0.61 | 1975–1978 | Retrospective | All | Medical college of Virginia | EM, endoscopy, esophagography |
| Gennaro et al., 2011 | Italy | Veneto | 365 | 1.59 (1.59/1.58) | 2001–2005 | Retrospective | All | Hospital discharge database | ICD‐9, case notes |
| Harvey et al., 2019 | United Kingdom | England | 10,509 | 1.99 (2.02/1.97) | 2006–2015 | Retrospective | All | Hospital episode statistics | ICD‐9, EM, endoscopy |
| 711 | 1.53 (1.47/1.60) | The health improvement network | |||||||
| Ho et al., 1999 | Singapore | ‐ | 48 | 0.29 (0.30/0.28) | 1989–1996 | Prospective | All | National University hospital | EM, endoscopy, esophagography |
| Howard et al., 1992 | United Kingdom | Edinburgh | 38 | 0.81 (0.80/0.83) | 1986–1991 | Retrospective | All | City hospital | EM |
| Inoue et al., 2023 | Australia | West | 296 | 1.50 (1.50/1.51) | 2012–2021 | Retrospective | All | Royal Perth hospital | HRM |
| Kim et al., 2014 | South Korea | ‐ | 191 | 0.39 (0.33/0.44) | 2007–2011 | Retrospective | All | National health insurance | ICD‐10 |
| Kim et al., 2023 | South Korea | ‐ | 3065 | 0.67 (0.63/0.71) | 2009–2017 | Retrospective | All | National health insurance | ICD‐10 |
| Marlais et al., 2011 | United Kingdom | Total | 228 | 0.18 | 1998–2008 | Retrospective | Children (<16 years) | British association of Pediatric Surgeons database | ICD‐10 |
| England | 193 | 0.18 | |||||||
| Northern Ireland | 25 | 0.24 | |||||||
| Scotland | 7 | 0.11 | |||||||
| Wales | 3 | 0.07 | |||||||
| Mayberry et al., 1980 | United Kingdom | Cardiff | 48 | 0.40 (0.24/0.41) | 1926–1977 | Retrospective | All | Hospital | EM, endoscopy, esophagography |
| Mayberry et al., 1985 | United Kingdom | Nottingham | 53 | 0.51 | 1966–1983 | Retrospective | All | Hospital | EM, endoscopy, esophagography |
| Mayberry et al., 1987 | United Kingdom | England | 216 | 0.9 (0.9/0.9) | 1972–1983 | Retrospective | All | Hospital | Case notes |
| Scotland | 699 | 1.15 (1.10/1.20) | |||||||
| Mayberry et al., 1988 | United Kingdom | Eire | 15 | 0.31 | 1976–1985 | Retrospective | Children (<15 years) | British association of Pediatric Surgeons | Case notes |
| England and Wales | 106 | 0.10 | |||||||
| Northern Ireland | 7 | 0.06 | |||||||
| Scotland | 1 | 0.02 | |||||||
| Mayberry et al., 1988 | New Zealand | North and South Island | 152 | 0.95 (0.94/0.97) | 1980–1984 | Retrospective | All | National health statistics center | Case notes |
| Sadowski et al., 2010 | Canada | Alberta | 463 | 1.63 (1.85/1.43) | 1996–2007 | Retrospective | All | Alberta health ministry database | ICD‐9, 10, procedure code |
| Samo et al., 2017 | United States | Chicago | 246 | 1.07 (1.05/1.10) | 2004–2014 | Retrospective | Adults | Northwestern medicine enterprise data Warehouse database | HRM |
| Sato et al., 2019 | Japan | ‐ | 289 | 0.40 (0.44/0.37) | 2005–2017 | Retrospective | All | Japan medical data center database | ICD‐10 |
| Smits et al., 2016 | Netherlands | ‐ | 87 | 0.10 (0.12/0.08) | 1990–2013 | Retrospective | Children (<18 years) | Dutch governmental database | EM, endoscopy, esophagography, HRM |
| Stein et al., 1985 | Zimbabwe | Bulawayo, Harare | 25 | 0.03 (0.05/0.02) | 1974–1983 | Retrospective | All | Hospital | Endoscopy, esophagography, case notes |
| Tebaibia et al., 2016 | Algeria | Wilayas | 1256 | 0.16 (0.15/0.16) | 1990–2014 | Prospective | All | Continuing medical education | EM, endoscopy, esophagography |
| van Hoeij et al., 2018 | Netherlands | ‐ | 907 | 2.2 (2.2/2.2) | 2006–2014 | Retrospective | Adults | Dutch healthcare insurance company | ICD‐10 |
Abbreviations: EM, Esophageal manometry (conventional); HRM, High resolution manometry; ICD‐9,10, International Classification of Diseases ninth, 10th Revision.
Global pooled incidence of achalasia
A total of 26 studies had incidence data, 2 , 9 , 10 , 11 , 12 , 13 , 14 , 15 , 16 , 17 , 18 , 19 , 20 , 21 , 22 , 23 , 24 , 25 , 26 , 27 , 28 , 29 , 30 , 31 , 32 , 33 and the global pooled incidence of achalasia was 0.78 cases per 100,000 person‐years (95% CI, 0.64–0.93; I 2 = 99.230%), with a 95% prediction interval of −0.03–1.60 (Table 2).
TABLE 2.
Global incidence of Achalasia from 1925 to 2021.
| Included studies (subgroup a ) | Number of participants | Pooled estimates (95% CI), cases per 100,000 population | Heterogeneity I 2, % | Egger's p‐value | 95% prediction interval | |
|---|---|---|---|---|---|---|
| Overall | 26 (32) | 269,315,171 | 0.78 (0.64–0.93) | 99.230 | 0.014 | −0.03–1.60 |
| Sex | ||||||
| Male | 22 (24) | 119,473,703 | 0.90 (0.69–1.10) | 97.346 | 0.001 | −0.07–1.86 |
| Female | 22 (24) | 120,375,948 | 0.85 (0.65–1.05) | 97.999 | <0.001 | −0.10–1.80 |
| Age group | ||||||
| Adults | 4 (4) | 8,001,692 | 1.64 (0.90–2.38) | 94.168 | 0.628 | −1.88–5.16 |
| Children | 3 (6) | 28,285,163 | 0.10 (0.03–0.18) | 94.335 | 0.627 | −0.15–0.36 |
| Year group b | ||||||
| 1925–1999 | 14 (29) | 73,849,982 | 0.40 (0.32–0.49) | 88.700 | <0.001 | 0.06–0.74 |
| 2000–2009 | 12 (35) | 433,169,613 | 1.45 (1.19–1.72) | 99.032 | <0.001 | −0.10–3.01 |
| 2010–2013 | 8 (28) | 510,769,779 | 1.51 (1.25–1.77) | 98.899 | 0.005 | 0.12–2.90 |
| 2014–2017 | 5 (14) | 337,301,126 | 1.37 (1.03–1.71) | 98.774 | 0.155 | −0.02–2.76 |
| 2018–2021 | 1 (4) | 8,303,716 | 1.64 (1.33–1.95) | 19.938 | 0.001 | 0.73–2.55 |
| Development | ||||||
| HDI >0.92 | 22 (28) | 224,329,780 | 0.80 (0.64–0.97) | 99.230 | 0.030 | −0.07–1.68 |
| HDI <0.92 | 4 (4) | 45,485,331 | 0.65 (0.28–1.02) | 99.173 | 0.231 | −1.09–2.39 |
| Continent | ||||||
| Africa | 2 (2) | 39,361,585 | 0.09 (−0.03–0.21) | 94.657 | NA | NA |
| Asia | 5 (5) | 109,213,195 | 0.50 (0.27–0.74) | 95.645 | 0.351 | −0.36–1.45 |
| Europe | 12 (17) | 104,787,037 | 0.76 (0.56–0.97) | 99.254 | 0.017 | −0.14–1.67 |
| North America | 4 (4) | 9,549,125 | 0.94 (0.54–1.34) | 87.026 | 0.115 | −0.91–2.79 |
| Oceania | 3 (4) | 6,404,229 | 1.41 (0.74–2.08) | 96.679 | 0.762 | −1.82–4.63 |
| Data source | ||||||
| Researcher validated | 20 (26) | 145,540,201 | 0.77 (0.59–0.95) | 99.067 | <0.001 | −0.15–1.69 |
| Code‐base | 6 (6) | 124,274,910 | 0.82 (0.52–1.13) | 99.439 | 0.622 | −0.26–1.91 |
| Diagnostic criteria b | ||||||
| Before 2009 | 24 (64) | 507,019,595 | 1.02 (0.88–1.16) | 98.716 | <0.001 | −0.04–2.07 |
| After 2009 | 8 (46) | 856,374,620 | 1.48 (1.28–1.69) | 98.759 | <0.001 | 0.19–2.77 |
Subgroups represent regions or districts in the included studies.
If the included studies provided individual year data, we used those data; otherwise, we used the mean annual incidence based on the middle year of the study period.
Auxiliary to Table 2 results, Table S3 compares subgroup differences in the incidence of achalasia in this study. A total of 22 studies had information on sex; the incidence was 0.90 cases per 100,000 person‐years (95% CI, 0.69–1.10) in males and 0.85 cases per 100,000 person‐years (95% CI, 0.65–1.05) in females. The incidence in adults was 1.64 cases per 100,000 person‐years (95% CI, 0.90–2.38), whereas the incidence in children was 0.10 cases per 100,000 person‐years (95% CI, 0.03–0.18). This difference was statistically significant (p < 0.001). Based on the study year, the global incidence of achalasia tended to increase overall, and the difference has been remarkable since 2000, when HRM was introduced (Figure 2 and Table 2). In addition, when comparing the two groups based on whether CC 2009 was enacted or not, 1.02 cases per 100,000 person‐years (95% CI, 0.88–1.16) before CC and 1.48 cases per 100,000 person‐years (95% CI, 0.90–2.38) after CC were found, which were also statistically significant (p < 0.001). The incidence was also compared between country groups divided by an HDI of 0.92. The incidence of countries with HDI >0.92 was 0.80 cases per 100,000 person‐years (95% CI, 0.64–0.97), and the incidence of countries with HDI <0.92 was 0.65 cases per 100,000 person‐years (95% CI, 0.28–1.02), but the difference was not statistically significant (p = 0.468). When examined by continent, the incidence in Africa was the lowest (0.09 cases per 100,000 person‐years [95% CI, −0.03–0.21]), followed by Asia, Europe, and North America, and the highest in Oceania, with 1.41 cases per 100,000 person‐years (95% CI, 0.74–2.08). For further details, please refer to Table S3. According to the data source, in the subgroup analysis, one group used researcher‐validated sources, such as test results or surgical records, and the other used diagnostic codes or surgery/procedure codes for achalasia treatment. When comparing the two groups, the difference in incidence was insignificant (0.77 vs. 0.82 cases per 100,000 person‐years, p = 0.782). Nevertheless, comparisons between subgroups may lack validity due to significant heterogeneity. The pooled incidence of achalasia showed an overall upward trend from 1925 to 2021 (1925–1999; 0.40 [0.32–0.49] vs. 2018–2021; 1.64 [1.33–1.95] cases per 100,000 person‐years) (Figure 2).
FIGURE 2.

Temporal trends in incidence (a) and prevalence (b) of achalasia, 1925–2021. Pooled estimates: cases per 100,000 population.
Global pooled prevalence of achalasia
In our systematic review, 14 studies 2 , 12 , 14 , 18 , 19 , 21 , 24 , 26 , 28 , 29 , 30 , 31 , 32 , 33 with prevalence data were used to estimate the global pooled prevalence of achalasia (Table 3). It was estimated to be 10.82 cases per 100,000 person‐years (95% CI, 8.15–13.48; I 2 = 99.619%) with a 95% prediction interval of −0.56–22.20. In prevalence, subgroup analysis (Table S4) was performed, and the items compared were the same as in incidence. There was no significant difference in prevalence according to sex (8.97 cases per 100,000 person‐years [95% CI, 2.02–15.93] vs. 7.64 cases per 100,000 person‐years [95% CI, 2.31–12.98]. As in the incidence, adults had a significantly higher prevalence compared with children (15.41 cases per 100,000 person‐years [95% CI, 13.67–17.14] vs. 0.90 cases per 100,000 person‐years [95% CI, 0.66–1.14]. In the continental comparison, there were no African prevalence data; therefore, only the remaining four continents were compared. Asia had the lowest prevalence (6.83 cases per 100,000 person‐years [95% CI, 3.96–9.67]), Oceania had the highest prevalence (16.90 cases per 100,000 person‐years [95% CI, 15.13–18.67]), and there was little difference between Europe and North America (12.63 vs. 12.57 cases per 100,000 person‐years, respectively). In the intercontinental bilateral comparison, some values were significant, whereas others were not (Table S4). Conversely, there was a slight difference in the prevalence by country classification based on the HDI (10.68 cases per 100,000 person‐years [95% CI, 7.97–13.38] in HDI >0.92 vs. 12.60 cases per 100,000 person‐years [95% CI, 11.72–13.46] in HDI <0.92) and the prevalence according to the data source (11.67 cases per 100,000 person‐years [95% CI, 7.04–16.30] in researcher validated vs. 9.33 cases per 100,000 person‐years [95% CI, 6.40–12.27] in code‐based). Both were statistically insignificant (p = 0.185 in HDI and p = 0.403 in the data source). It's important to note that, similar to the incidence findings, differences between subgroups could be inaccurate due to heterogeneity.
TABLE 3.
Global prevalence of Achalasia from 1952 to 2021.
| Included studies (subgroup a ) | Number of participants a | Pooled estimates (95% CI), cases per 100,000 population | Heterogeneity I 2, % | Egger's p‐value | 95% prediction interval | |
|---|---|---|---|---|---|---|
| Overall | 14 | 192,176,076 | 10.82 (8.15–13.48) | 99.619 | 0.443 | −0.56–22.20 |
| Sex | ||||||
| Male | 4 | 28,289,376 | 8.97 (2.02–15.93) | 98.775 | 0.109 | −24.94–42.89 |
| Female | 4 | 28,155,847 | 7.64 (2.31–12.98) | 98.345 | 0.051 | −19.59–34.88 |
| Age group | ||||||
| Adults | 2 | 6,734,464 | 15.41 (13.67–17.14) | 67.093 | NA | NA |
| Children | 1 | 6,214,286 | 0.90 (0.66–1.14) | NA | NA | NA |
| Year group b | ||||||
| 1952–1999 | 5 (9) | 65,743,363 | 7.54 (4.74–10.35) | 98.852 | 0.058 | −3.05–18.14 |
| 2000–2009 | 5 (10) | 36,906,370 | 16.24 (12.32–20.16) | 99.054 | <0.001 | 1.00–31.48 |
| 2010–2013 | 5 (11) | 94,677,659 | 16.58 (9.66–23.51) | 99.813 | <0.001 | −11.06–44.23 |
| 2014–2017 | 5 (6) | 72,534,124 | 14.85 (9.43–20.27) | 99.630 | 0.052 | −5.39–35.09 |
| 2018–2021 | 1 (1) | 2,065,774 | 16.90 (15.13–18.67) | NA | NA | NA |
| Development | ||||||
| HDI >0.92 | 13 | 190,523,903 | 10.68 (7.97–13.38) | 99.614 | 0.360 | −5.45–26.99 |
| HDI <0.92 | 1 | 1,652,173 | 12.60 (11.72–13.46) | NA | NA | NA |
| Continent | ||||||
| Asia | 5 | 109,984,175 | 6.83 (3.96–9.67) | 99.226 | 0.464 | −4.46–18.08 |
| Europe | 6 | 75,102,159 | 12.63 (3.94–21.32) | 99.733 | 0.022 | −19.87–45.13 |
| North America | 2 | 5,023,968 | 12.57 (9.04–16.10) | 92.140 | NA | NA |
| Oceania | 1 | 2,065,774 | 16.90 (15.13–18.67) | NA | NA | NA |
| Data source | ||||||
| Researcher validated | 9 | 78,943,578 | 11.67 (7.04–16.30) | 99.652 | 0.002 | −25.75–25.79 |
| Code‐base | 5 | 113,232,498 | 9.33 (6.40–12.27) | 98.720 | 0.203 | −2.21–20.88 |
| Diagnostic criteria b | ||||||
| Before 2009 | 9 (19) | 89,073,442 | 12.13 (9.06–15.19) | 99.419 | <0.001 | −2.55–26.81 |
| After 2009 | 8 (18) | 169,277,557 | 16.02 (12.58–19.45) | 99.761 | <0.001 | 2.44–29.55 |
Subgroups represent regions or districts in the included studies.
If the included studies provided individual year data, we used those data; otherwise, we used the prevalence rate at the end of the study year.
Publication bias assessment
Funnel plots were used to evaluate asymmetry in the included studies. This result was found to have a low risk of publication bias (Egger test: p = 0.014 for the overall incidence of achalasia and p = 0.443 for the overall prevalence of achalasia). However, in several subgroup analyses, the funnel plots showed asymmetry, suggesting a publication bias. A detailed description of the funnel plots used in our study is shown in Figures S3–S43.
Risk of bias was evaluated for 27 studies, and one study was excluded from the analysis due to high RoB. 34 Seven studies were found to have a moderate RoB 9 , 11 , 14 , 15 , 20 , 25 , 33 and the remaining 19 studies were evaluated to have a low RoB. 2 , 10 , 12 , 13 , 16 , 17 , 18 , 19 , 21 , 22 , 23 , 24 , 26 , 27 , 28 , 29 , 30 , 31 , 32 The details of the RoB in the studies included in the analysis are listed in Table S5.
DISCUSSION
Key findings
Our systematic review and meta‐analysis complied incidence and prevalence data from 1925 to 2021 from 14 countries across five continents (Table S2). The global pooled incidence and prevalence of achalasia were estimated to be 0.78 cases per 100,000 person‐years and 10.82 cases per 100,000 person‐years, respectively. The incidence of achalasia was greater in Oceania, in adults, and after the introduction of the CC 2009. The incidence and prevalence of achalasia have increased significantly and show considerable variation across regions worldwide.
Comparison with previous studies
Some earlier reviews and incidence/prevalence studies of achalasia briefly touched upon epidemiology. 1 , 24 , 27 , 28 , 31 However, these studies did not delve into differences by continent and race, rates by age, or global trends in incidence and prevalence. To the best of our knowledge, our study represents the first comprehensive analysis of global incidence and prevalence trends. Moreover, it stands as the inaugural synthesis of analyses that consider regional, demographic, and social factors, data sources, and diagnostic criteria.
Possible explanation of our results
In comparison to the period before 2000, our study revealed a substantial 4.1‐fold increase in the incidence and a 2.2‐fold increase in the prevalence of achalasia. Several factors may contribute to this rise. Firstly, the introduction of innovative diagnostic tools, such as HRM, along with the establishment of systematic diagnostic standards, has likely played a significant role. Secondly, in this study, the incidence increased with increasing age is confirmed (Figure S44). The life span of the world population is increasing. 35 Thirdly, improved worldwide access to healthcare services may be a contributing factor, supported by the higher incidence observed in countries with HDI >0.92 in our study. Additionally, the prevailing view that achalasia shares a pathophysiology with autoimmune diseases is supported by the frequent co‐occurrence of Sjögren's syndrome, type 1 diabetes mellitus, and hypothyroidism in achalasia patients. 1 , 36 With various autoimmune diseases on the rise globally, achalasia appears to follow a similar trend. 37
The observed differences in incidence and prevalence across countries and continents can be attributed not only to variations in the developmental level of countries but also to other potential factors. These may include differences in dietary patterns, 38 , 39 genetic factors, 1 and the extent of healthcare coverage for various examinations and treatments. 35 , 40
Strengths and limitations
This study had several limitations. First, our data are lacking in South America, the Middle East (except Israel) and Africa. Second, some of the included studies did not include sex or age data. This suggests that the analyses of sex and age may differ from reality. Third, the diagnosis of achalasia requires not only HRM, but also esophagography and esophagogastroduodenoscopy. 1 , 25 , 41 Therefore, it is difficult to diagnose achalasia in an environment with poor medical access; in our study, the data for countries with HDI <0.92 are relatively scarce. Therefore, underdiagnosed populations in these environments may be significantly higher. Fourth, the data analysis included both code‐based studies and studies that did not exclusively use HRM for diagnosis. Six code‐based studies 2 , 21 , 23 , 24 , 31 , 33 were incorporated into this meta‐analysis, each employing one or more cross‐validation methods to define cases. Among the researcher‐validated studies, excluding three studies, diagnoses were made using methods other than HRM, primarily conventional manometry. In some studies, there was a mix of periods where HRM was used and others where it was not. Consequently, the three studies that adhered to the current criteria for achalasia were separated and subjected to further analysis. Due to the limited number of included studies, the analysis results were presented in an incidence and prevalence table and underwent trend analysis with regression (Table S1 and Figure S2). Fifth, the timing of study inclusion varies in each country. As the incidence and prevalence differ by country or continent, the studies included in the analysis were conducted in different years, leading to some inconsistencies in the incidence and prevalence graph (Figure 2). Sixth, some pooled estimates or 95% prediction intervals estimated as negative values in Tables 2 and 3 were considered to have limited data bias. 42 Seventh, our analysis revealed significant heterogeneity. This aligns with previous meta‐analyses reporting increased incidence and prevalence of the disease, which also showed a higher tendency for heterogeneity. 38 , 43 , 44 , 45 Consequently, we refrained from conducting a meta‐regression analysis due to the substantial degree of heterogeneity between studies in our analysis. Therefore, the results of our study must be interpreted with great care, considering this aspect.
Despite these limitations, our study has several strengths. We comprehensively searched multiple databases to identify relevant studies on achalasia. In addition, our study visualized the changes in incidence and prevalence over time and analyzed the trends following the introduction of HRM and the establishment of CC. The incidence and prevalence were also compared according to sex, age, region, national development level, and data source. Accordingly, through this systematic review and meta‐analysis, we found out that there was no significant difference in incidence and prevalence according to sex, data source (Researcher validated vs. code based), and national development level (HDI >0.92 vs. Human development index <0.92) worldwide. Conversely, we showed that the incidence and prevalence were significantly higher in adults than in children, lower in Asia and Africa, and highest in Oceania. In addition, the incidence and prevalence by country were visualized on a world map to make it easy to see at a glance.
Further considerations and policy implication
Based on the findings of our study, both the incidence and prevalence of achalasia have exhibited an overall increase. Several factors suggest that the prevalence of this disease is likely to continue rising in the future, including the increasing life expectancy and incidence of autoimmune diseases. However, diagnosis of achalasia requires significant medical accessibility. 17 , 27 , 28 , 30 , 32 , 46 Consequently, there are concerns that many cases may go unrevealed in underdeveloped countries. Moreover, in the subgroup analysis based on national development levels, the incidence and prevalence exhibited opposing tendencies, hinting at differences in accessibility to curative treatment. This underscores the importance of not only improving the diagnosis but also enhancing treatment access in underdeveloped countries. Furthermore, an analysis of the incidence and prevalence by subtype of achalasia and the change in incidence and prevalence according to the updated version of the CC needs to be performed.
CONCLUSION
Despite several limitations such as heterogeneity, this study presents information on global trends in the incidence and prevalence of achalasia over time, exploring variations by sex, age, geographical region, and diagnostic criteria. The rising incidence of achalasia is evident, especially with the development of HRM and the implementation of diagnostic systems, suggesting a potential increase in the global health burden in the future. To achieve more accurate incidence and prevalence estimates, additional data from the South American and African continents, as well as underdeveloped countries with limited medical access, are essential. The substantial variation in achalasia incidence and prevalence observed worldwide in this study supports the influence of genetic, cultural, and environmental factors. Consequently, beyond the findings of this study, further exploration of these factors is crucial for enhancing global health outcomes in the future.
AUTHOR CONTRIBUTIONS
The author contributions were as follows. Conceptualization: Kwanjoo Lee, Wonyoung Cho, and Dong Keon Yon; Acquisition, analysis, or interpretation of data: In Kyung Yoo, Abdullah Özgür Yeniova, Jong Woo Hahn, Min Seo Kim, Soo‐Young Yoon, Masoud Rahmati, Jun Hyuk Lee, Myeongcheol Lee, Wonyoung Cho, and Dong Keon Yon; Drafting of the manuscript: Kwanjoo Lee, Sung Pyo Hong, Wonyoung Cho, and Dong Keon Yon; Critical revision of the manuscript for important intellectual content: In Kyung Yoo, Abdullah Özgür Yeniova, Jong Woo Hahn, Min Seo Kim, Soo‐Young Yoon, Masoud Rahmati, Jun Hyuk Lee, Myeongcheol Lee, Wonyoung Cho, and Dong Keon Yon; Statistical analysis: Kwanjoo Lee, Wonyoung Cho, and Dong Keon Yon; Supervision: Dong Keon Yon.
CONFLICT OF INTEREST STATEMENT
The authors declare that they have no conflicts of interest.
ETHICS APPROVAL
Not applicable.
INFORMED CONSENT
Not applicable.
Supporting information
Supplementary Information S1
Supplementary Information S2
ACKNOWLEDGMENTS
This research was supported by grants from the National Research Foundation of Korea (MSIT; RS‐2023‐00248157) and the Korea Health Technology R&D Project through the Korea Health Industry Development Institute, funded by the Ministry of Health and Welfare, Republic of Korea (grant number: HE23C002800). The funders played no role in the design and conduct of the study.
Lee K, Hong SP, Yoo IK, Yeniova AÖ, Hahn JW, Kim MS, et al. Global trends in incidence and prevalence of achalasia, 1925–2021: a systematic review and meta‐analysis. United European Gastroenterol J. 2024;12(4):504–15. 10.1002/ueg2.12555
Wonyoung Cho and Dong Keon Yon contributed equally.
Contributor Information
Wonyoung Cho, Email: bourbaki10@gmail.com.
Dong Keon Yon, Email: yonkkang@gmail.com.
DATA AVAILABILITY STATEMENT
All data are provided in the Article and in the appendix. The study protocol, statistical code, and data set are available from DKY (email: yonkkang@gmail.com).
REFERENCES
- 1. Savarino E, Bhatia S, Roman S, Sifrim D, Tack J, Thompson SK, et al. Achalasia. Nat Rev Dis Prim. 2022;8(1):28. 10.1038/s41572-022-00356-8 [DOI] [PubMed] [Google Scholar]
- 2. Kim GH, Park H, Jung KW, Kim MJ, Kim YJ, Lee JM, et al. Incidence, morbidity, and mortality of achalasia: a nationwide, population‐based cohort study in South Korea. Gut Liver. 2023;17(6):894–904. 10.5009/gnl220334 [DOI] [PMC free article] [PubMed] [Google Scholar]
- 3. Lee SWKM, Koo MJ. PRISMA 2020 statement and guidelines for systematic review and meta‐analysis articles, and their underlying mathematics: life Cycle Committee Recommendations. Life Cycle. 2022;2:2. 10.54724/lc.2022.e9 [DOI] [Google Scholar]
- 4. Hoy D, Brooks P, Woolf A, Blyth F, March L, Bain C, et al. Assessing risk of bias in prevalence studies: modification of an existing tool and evidence of interrater agreement. J Clin Epidemiol. 2012;65(9):934–939. 10.1016/j.jclinepi.2011.11.014 [DOI] [PubMed] [Google Scholar]
- 5. DeLay K, Yadlapati R, Pandolfino JE. Chicago Classification of esophageal motility disorders: past, present, and future. Indian J Gastroenterol. 2021;40(2):120–130. 10.1007/s12664-021-01162-y [DOI] [PubMed] [Google Scholar]
- 6. Morgan E, Arnold M, Gini A, Lorenzoni V, Cabasag CJ, Laversanne M, et al. Global burden of colorectal cancer in 2020 and 2040: incidence and mortality estimates from GLOBOCAN. Gut. 2023;72(2):338–344. 10.1136/gutjnl-2022-327736 [DOI] [PubMed] [Google Scholar]
- 7. Higgins JP, Thompson SG, Deeks JJ, Altman DG. Measuring inconsistency in meta‐analyses. BMJ. 2003;327(7414):557–560. 10.1136/bmj.327.7414.557 [DOI] [PMC free article] [PubMed] [Google Scholar]
- 8. Sterne JA, Egger M. Regression methods to detect publication and other bias in meta‐analysis. Publication bias in meta‐analysis: Prevention, assessment and adjustments; 2005. p. 99–110. [Google Scholar]
- 9. Earlam R, Ellis F, Jr , Nobrega F. Achalasia of the esophagus in a small urban community. In: Mayo clinic proceedings; 1969. p. 478–483. [PubMed] [Google Scholar]
- 10. Mayberry J, Rhodes J. Achalasia in the city of Cardiff from 1926 to 1977. Digestion. 1980;20(4):248–252. 10.1159/000198446 [DOI] [PubMed] [Google Scholar]
- 11. Galen E, Switz D, Zfass A. Achalasia: incidence and treatment in Virginia. Va Med. 1982;109:183–186. [PubMed] [Google Scholar]
- 12. Mayberry JF, Atkinson M. Studies of incidence and prevalence of achalasia in the Nottingham area. QJM: An Int J Med. 1985;56:451–456. [PubMed] [Google Scholar]
- 13. Stein C, Gelfand M, Taylor H. Achalasia in Zimbabwean blacks. South Afr Med J. 1985;67:261–262. [PubMed] [Google Scholar]
- 14. Mayberry JF, Atkinson M. Variations in the prevalence of achalasia in Great Britain and Ireland: an epidemiological study based on hospital admissions. QJM: An Int J Med. 1987;62:67–74. [PubMed] [Google Scholar]
- 15. Mayberry J, Mayell MJ. Epidemiological study of achalasia in children. Gut. 1988;29(1):90–93. 10.1136/gut.29.1.90 [DOI] [PMC free article] [PubMed] [Google Scholar]
- 16. Mayberry JF, Atkinson M. Incidence of achalasia in New Zealand, 1980‐84: an epidemiological study based on hospital discharges. J Gastroenterol Hepatol. 1988;3:247–252. 10.1111/j.1440-1746.1988.tb00246.x [DOI] [Google Scholar]
- 17. Howard P, Maher L, Pryde A, Cameron EW, Heading RC. Five year prospective study of the incidence, clinical features, and diagnosis of achalasia in Edinburgh. Gut. 1992;33(8):1011–1015. 10.1136/gut.33.8.1011 [DOI] [PMC free article] [PubMed] [Google Scholar]
- 18. Arber N, Grossman A, Lurie B, Hoffman M, Rubinstein A, Lilos P, et al. Epidemiology of achalasia in central Israel rarity of esophageal cancer. Dig Dis Sci. 1993;38(10):1920–1925. 10.1007/bf01296119 [DOI] [PubMed] [Google Scholar]
- 19. Birgisson S, Richter JE. Achalasia in Iceland, 1952‐2002: an epidemiologic study. Dig Dis Sci. 2007;52(8):1855–1860. 10.1007/s10620-006-9286-y [DOI] [PubMed] [Google Scholar]
- 20. Farrukh A, DeCaestecker J, Mayberry JF. An epidemiological study of achalasia among the South Asian population of Leicester, 1986‐2005. Dysphagia. 2008;23(2):161–164. 10.1007/s00455-007-9116-1 [DOI] [PubMed] [Google Scholar]
- 21. Sadowski DC, Ackah F, Jiang B, Svenson LW. Achalasia: incidence, prevalence and survival. A population‐based study. Neuro Gastroenterol Motil. 2010;22(9):e256–e261. 10.1111/j.1365-2982.2010.01511.x [DOI] [PubMed] [Google Scholar]
- 22. Gennaro N, Portale G, Gallo C, Rocchietto S, Caruso V, Costantini M, et al. Esophageal achalasia in the Veneto region: epidemiology and treatment. Epidemiology and treatment of achalasia. J Gastrointest Surg. 2011;15(3):423–428. 10.1007/s11605-010-1392-7 [DOI] [PubMed] [Google Scholar]
- 23. Marlais M, Fishman JR, Fell JM, Haddad MJ, Rawat DJ. UK incidence of achalasia: an 11‐year national epidemiological study. Arch Dis Child. 2011;96(2):192–194. 10.1136/adc.2009.171975 [DOI] [PubMed] [Google Scholar]
- 24. Kim E, Lee H, Jung HK, Lee KJ. Achalasia in Korea: an epidemiologic study using a national healthcare database. J Korean Med Sci. 2014;29(4):576–580. 10.3346/jkms.2014.29.4.576 [DOI] [PMC free article] [PubMed] [Google Scholar]
- 25. Tebaibia A, Boudjella MA, Boutarene D, Benmediouni F, Brahimi H, Oumnia N. Incidence, clinical features and para‐clinical findings of achalasia in Algeria: experience of 25 years. World J Gastroenterol. 2016;22(38):8615–8623. 10.3748/wjg.v22.i38.8615 [DOI] [PMC free article] [PubMed] [Google Scholar]
- 26. Smits M, van Lennep M, Vrijlandt R, Benninga M, Oors J, Houwen R, et al. Pediatric achalasia in The Netherlands: incidence, clinical course, and quality of life. J Pediatr. 2016;169:110–115. e113. 10.1016/j.jpeds.2015.10.057 [DOI] [PubMed] [Google Scholar]
- 27. Duffield JA, Hamer PW, Heddle R, Holloway RH, Myers JC, Thompson SK. Incidence of achalasia in South Australia based on esophageal manometry findings. Clin Gastroenterol Hepatol. 2017;15(3):360–365. 10.1016/j.cgh.2016.05.036 [DOI] [PubMed] [Google Scholar]
- 28. Samo S, Carlson DA, Gregory DL, Gawel SH, Pandolfino JE, Kahrilas PJ. Incidence and prevalence of achalasia in central Chicago, 2004‐2014, since the widespread use of high‐resolution manometry. Clin Gastroenterol Hepatol. 2017;15(3):366–373. 10.1016/j.cgh.2016.08.030 [DOI] [PMC free article] [PubMed] [Google Scholar]
- 29. Harvey PR, Thomas T, Chandan JS, Mytton J, Coupland B, Bhala N, et al. Incidence, morbidity and mortality of patients with achalasia in England: findings from a study of nationwide hospital and primary care data. Gut. 2019;68(5):790–795. 10.1136/gutjnl-2018-316089 [DOI] [PubMed] [Google Scholar]
- 30. Inoue M, Adris N, Cai R, Siah C, Kong J, Ragunath K. Incidence, prevalence and clinical management of achalasia since the introduction of high‐resolution manometry in Western Australia. Intern Med J. 2023. 10.1111/imj.16150 [DOI] [PubMed] [Google Scholar]
- 31. van Hoeij FB, Ponds FA, Smout AJ, Bredenoord AJ. Incidence and costs of achalasia in The Netherlands. Neuro Gastroenterol Motil. 2018;30(2). 10.1111/nmo.13195 [DOI] [PubMed] [Google Scholar]
- 32. Ho KY, Tay HH, Kang JY. A prospective study of the clinical features, manometric findings, incidence and prevalence of achalasia in Singapore. J Gastroenterol Hepatol. 1999;14(8):791–795. 10.1046/j.1440-1746.1999.01950.x [DOI] [PubMed] [Google Scholar]
- 33. Sato H, Yokomichi H, Takahashi K, Tominaga K, Mizusawa T, Kimura N, et al. Epidemiological analysis of achalasia in Japan using a large‐scale claims database. J Gastroenterol. 2019;54(7):621–627. 10.1007/s00535-018-01544-8 [DOI] [PubMed] [Google Scholar]
- 34. Gaber CE, Eluri S, Cotton CC, Strassle PD, Farrell TM, Lund JL, et al. Epidemiologic and economic burden of achalasia in the United States. Clin Gastroenterol Hepatol. 2022;20(2):342–352. e345. 10.1016/j.cgh.2021.02.035 [DOI] [PMC free article] [PubMed] [Google Scholar]
- 35. Permanyer I, Scholl N. Global trends in lifespan inequality: 1950‐2015. PLoS One. 2019;14(5):e0215742. 10.1371/journal.pone.0215742 [DOI] [PMC free article] [PubMed] [Google Scholar]
- 36. Romero‐Hernández F, Furuzawa‐Carballeda J, Hernández‐Molina G, Alejandro‐Medrano E, Núñez‐Álvarez CA, Hernández‐Ramírez DF, et al. Autoimmune comorbidity in achalasia patients. J Gastroenterol Hepatol. 2018;33(1):203–208. 10.1111/jgh.13839 [DOI] [PubMed] [Google Scholar]
- 37. Conrad N, Misra S, Verbakel JY, Verbeke G, Molenberghs G, Taylor PN, et al. Incidence, prevalence, and co‐occurrence of autoimmune disorders over time and by age, sex, and socioeconomic status: a population‐based cohort study of 22 million individuals in the UK. Lancet. 2023;401(10391):1878–1890. 10.1016/S0140-6736(23)00457-9 [DOI] [PubMed] [Google Scholar]
- 38. Hahn JW, Lee K, Shin JI, Cho SH, Turner S, Shin JU, et al. Global incidence and prevalence of eosinophilic esophagitis, 1976‐2022: a systematic review and meta‐analysis. Clin Gastroenterol Hepatol. 2023;21(13):3270–3284.e77. 10.1016/j.cgh.2023.06.005 [DOI] [PubMed] [Google Scholar]
- 39. Yeung A, Benmerzouga I. Different clinical features of idiopathic achalasia in various countries. Gastrointest Disord. 2022;4(2):56–65. 10.3390/gidisord4020007 [DOI] [Google Scholar]
- 40. Organization WH. Primary health care on the road to universal health coverage: 2019 global monitoring report; 2021.
- 41. Schizas D, Theochari NA, Katsaros I, Mylonas KS, Triantafyllou T, Michalinos A, et al. Pseudoachalasia: a systematic review of the literature. Esophagus. 2020;17(3):216–222. 10.1007/s10388-020-00720-1 [DOI] [PubMed] [Google Scholar]
- 42. Greenland S, Mansournia MA, Altman DG. Sparse data bias: a problem hiding in plain sight. BMJ. 2016:352. [DOI] [PubMed] [Google Scholar]
- 43. Iannuzzi JP, King JA, Leong JH, Quan J, Windsor JW, Tanyingoh D, et al. Global incidence of acute pancreatitis is increasing over time: a systematic review and meta‐analysis. Gastroenterology. 2022;162(1):122–134. 10.1053/j.gastro.2021.09.043 [DOI] [PubMed] [Google Scholar]
- 44. Le MH, Yeo YH, Li X, Li J, Zou B, Wu Y, et al. 2019 Global NAFLD prevalence: a systematic review and meta‐analysis. Clin Gastroenterol Hepatol. 2022;20(12):2809–2817. e2828. 10.1016/j.cgh.2021.12.002 [DOI] [PubMed] [Google Scholar]
- 45. Hahn JW, Yang HR, Moon JS, Chang JY, Lee K, Kim GA, et al. Global incidence and prevalence of autoimmune hepatitis, 1970‐2022: a systematic review and meta‐analysis. EClinicalMedicine. 2023;65:102280. 10.1016/j.eclinm.2023.102280 [DOI] [PMC free article] [PubMed] [Google Scholar]
- 46. Gyawali CP, Kahrilas PJ. A short history of high‐resolution esophageal manometry. Dysphagia. 2023;38(2):586–595. 10.1007/s00455-021-10372-7 [DOI] [PMC free article] [PubMed] [Google Scholar]
Associated Data
This section collects any data citations, data availability statements, or supplementary materials included in this article.
Supplementary Materials
Supplementary Information S1
Supplementary Information S2
Data Availability Statement
All data are provided in the Article and in the appendix. The study protocol, statistical code, and data set are available from DKY (email: yonkkang@gmail.com).