Abstract
Background
Thymocyte selection-associated HMG-BOX (TOX) belongs to a family of transcription factors containing a highly conserved region of the high mobility group box (HMG-Box). A growing body of research has shown that TOX is involved in the occurrence and development of tumors and promotes T-cell exhaustion. We assessed the role of TOX with The Cancer Genome Atlas (TCGA) Pancancer Data.
Methods
TOX expression was examined with RNA-seq data from the TCGA and Genotype-Tissue Expression (GTEx) databases. The genetic alteration status and protein level of TOX were analyzed using databases, including the Human Protein Atlas (HPA), GeneCards, and STRING. The prognostic significance was estimated with survival data from the TCGA. Moreover, R software was used for enrichment analysis of TOX. The relationship between TOX and immune cell infiltration was assessed with the Tumor Immune Estimation Resource (TIMER) 2.0 database and the “CIBERSORT” method. The correlation between TOX and immune checkpoints was further explored. Immunohistochemical analysis was used to further verify the difference in TOX expression between cancerous and paracancerous tissues, and cell viability was evaluated using a CCK-8 assay.
Results
In most cancer types in the TCGA cohort, differential TOX expression was observed. The genetic alteration status and protein level of TOX were examined, and the prognosis of cancers was associated with TOX expression. Moreover, TOX levels were closely related to different immune-related pathways, immune cell infiltration and immune checkpoints. Additionally, significant differences in TOX expression between several cancerous and paracancerous tissues were validated. Furthermore, TOX clearly impacted the viability of cancer cells.
Conclusions
TOX, a potential biomarker for cancer, may be involved in the regulation of the immune microenvironment and can be used for new targeted drugs.
Keywords: TOX, Immune checkpoint, Immunotherapy, Cancer prognosis, Multiomics technologies
Introduction
A characteristic of tumorigenesis is the accumulation of genetic alterations, which results in the appearance of various neoantigens on the surface of tumor cells. In addition, tumor cells are able to evade immune attack, which represents a breakthrough in cancer immunotherapy [1]. The occurrence and development of tumors depend not only on genetic changes in the tumor cells themselves but also on their surrounding environment: the tumor microenvironment (TME). The tumor immune microenvironment (TIME) is composed of noncellular components (such as blood vessels, the extracellular matrix, and signaling molecules) and cellular components (such as T cells, myeloid cells, and fibroblasts), which are part of the tumor microenvironment, in which immune cell composition and function play crucial roles in the process of cancer [2]. To date, several mechanisms of immune escape have been identified, including the expression of endogenous “immune checkpoints” [3, 4]. Immune checkpoint inhibitors, such as anti-programmed cell death protein 1 (PD-1), have been extensively studied as anticancer agents [5, 6]. Since the discovery of immune checkpoint inhibitors, the use of immunotherapy as a popular tumor treatment has attracted increasing attention [7]. Immune checkpoint inhibitors can significantly enhance the antitumor immune response by blocking inhibitory receptors on exhausted T cells and restoring their function.
Thymocyte selection-associated HMG-BOX (TOX) encodes a nuclear high mobility group (HMG) protein called thymocyte-selective associated high-mobility histone protein [8, 9]. TOX not only plays a role in T lymphocyte differentiation, development, and effector function, but it also promotes immune failure and tumorigenesis [10, 11]. Recent research has revealed that the nuclear factor TOX is a significant regulator of the differentiation of tumor-specific T (TST) cells [8]. TOX expression is notably elevated in dysfunctional TST cells within tumors, as well as in exhausted T cells, indicating its crucial involvement in T-cell exhaustion. Furthermore, the association of TOX with the TME suggests potential links to tumor cells themselves [10]. Consequently, investigating the role of TOX across cancers represents a novel research avenue that could unveil promising targets for cancer immunotherapy. However, there are currently no pancancer studies examining TOX as a therapeutic target.
This study analyzed TOX expression and its relationship with the prognosis of cancer patients. TOX has also been studied in relation to immune cell infiltration and immune checkpoints. These results offer new insights into the role of TOX across cancers and suggest the underlying mechanisms of TOX in cancer immunotherapy.
Materials and methods
Downloading of data
The RNA sequencing (RNA-seq) data from The Cancer Genome Atlas (TCGA) database and the Genotype–Tissue Expression (GTEx) project were downloaded from the UCSC Xena website (https://xenabrowser.net/datapages/) [12, 13]. These data included 33 different tumor types and matched normal tissues from TCGA and 31 normal human tissues from GTEx. Corresponding clinical profiles were downloaded from these two databases. Duplicated data from these two sources were excluded. The mutation characteristics of TOX in different cancers were analyzed with the cBioPortal tool (http://www.cbioportal.org/) [14]. The “TCGA Pan Cancer Atlas Studies” cohort was selected, and “TOX” was entered into the “Query” module. TOX alteration sites, types, and numbers can be found in the “cancer type summary” and “mutation” modules.
Level of TOX proteins in cancers
The HPA database (https://www.proteinatlas.org/) is a comprehensive database of protein tissue localization and expression information [14]. It integrates protein expression information from the human genome and provides a detailed analysis of protein localization and expression in human tissues. The protein level of TOX was downloaded from the HPA database. The STRING (http://string-db.org/) database, which provides experimental and predicted protein‒protein interaction (PPI) information, was used to explore the PPI network of TOX [15]. The GeneCards (https://www.genecards. The “org/) database is a searchable, integrative database that provides comprehensive information on human genes [16]. The subcellular locations of TOX were obtained via the GeneCards database.
Immune cell infiltration analysis
The Tumor Immune Assessment Resource, Version 2 (TIMER2) (http://timer.cistrome.org/) web server is a comprehensive resource for the systematic analysis of immune infiltrates across diverse cancer types [17]. The CIBERSORT algorithm was used to evaluate immune cell infiltration between tumor and adjacent normal tissues. This algorithm can transform the normalized gene expression matrix into the composition of infiltrating immune cells. Here, the differential expression of TOX between tumor and adjacent normal tissues across all TCGA cohorts was studied with the TIMER 2.0 database and the “CIBERSORT” method [18, 19].
Prognostic analysis
Kaplan–Meier (K-M) analysis is a single-factor survival analysis that combines the survival time and termination status of patients to compare and analyze the survival of two groups of patients [20]. Generally, the K-M curve is more commonly used, which can intuitively reflect the survival differences of patients under different conditions. Kaplan‒Meier analysis was used to assess the overall survival (OS) of patients in the TCGA cohort [20, 21]. In addition, the significance of TOX in assessing OS, disease-specific survival (DSS), the disease-free interval (DFI), and the progression-free interval (PFI) was evaluated via univariate Cox regression analysis, which is also a single-factor survival analysis [22].
Enrichment analysis
Correlation analyses were performed with TCGA data. Gene set enrichment analysis (GSEA) was used to determine the key pathways and core genes. Enrichment analyses were conducted to determine whether a series of a priori-defined biological processes were enriched. Here, genes associated with TOX were selected for GSEA [23]. GSEA was performed with the R package “clusterProfiler”, and the parameters were as follows: nPerm = 1000, minGSSize = 10, maxGSSize = 1000, and p value cutoff = 0.05.
Immunohistochemical analysis
The cancer tissues and their adjacent tissues were obtained from patients enrolled in the Department of Pathology, The First Affiliated Hospital of Zhejiang Chinese Medical University (Zhejiang Provincial Hospital of Chinese Medicine). To construct the tissue microarray (TMA), a 3-mm-diameter core of the cancer tissue area was generated. The brief steps for IHC were as follows: First, slides made from the TMA were deparaffinized in xylene and rehydrated in ethanol, and the antigens were extracted for immunohistochemistry (IHC) tests with specific antibodies. Second, the slides were blocked with goat serum for 1 h, and after washing, the slides were further stained with a diluted anti-human TOX antibody (Abcam, ab155768). Then, 3,3′-diaminobenzidine (DAB) was used to stain the tissues after 24 h. The IHC results of TOX staining scores were semiquantified by an immunoreactive scoring (IRS) system, which has been previously described [24].
Cell transfection
The human AGS gastric adenocarcinoma cell line, purchased from the Committee on Type Culture Collection of the Chinese Academy of Sciences (Shanghai, China), were cultured in RPMI-1640 medium containing 10% fetal bovine serum (FBS) and 1% penicillin/streptomycin, after which the cells were cultured in a cell incubator at 37 ℃ with 5% CO2. AGS cells were transfected with TOX small interfering RNA (siRNA) sequences (siTOX) or the negative control to determine TOX knockdown in the cell lines using Lipofectamine 2000 (11668019, Invitrogen, USA), and the transfection reagent was purchased from RiboBio (Guangzhou, China). After transfection, the AGS cells were collected for further experimentation. The transfection efficiency was evaluated via real-time quantitative polymerase chain reaction (real-time qPCR).
Real-time quantitative PCR
Total cellular RNA was extracted with an RNeasy Mini Kit (74106, Qiagen, Germany) according to the manufacturer’s protocol, and the RNA concentration was measured with a NanoDrop 2000 (Thermo Scientific, USA). The complementary DNA (cDNA) from total RNA was synthesized using the PrimeScript 1st Strand cDNA Synthesis Kit (Takara, China); then, qPCR for cDNA amplification was performed via the SYBR Green PCR Kit (TaKaRa, China). The relative levels of messenger RNA (mRNA) expression were calculated via the comparative Ct method (2−ΔΔCt). β-actin was used as an internal control for gene expression, and the specific primers used for real-time qPCR of the TOX and β-actin genes were as follows: TOX: forward-5′-CGCTACCTTTGGCGAAGTCTCT-3′, reverse-5′-CTGGCTCTGTATGCTGCGAGTT-3′; β-actin: forward-5′-CACCATTGGCAATGAGCGGTTC-3′, reverse-5′-AGGTCTTTGCGGATGTCCACGT-3′ [25, 26].
Cell counting Kit-8 assay
A Cell Counting Kit-8 (CCK-8) (K1018, APExBIO) was used for the coumestrol inhibition rate assay with the AGS gastric adenocarcinoma cell line. The brief procedure was as follows. The CCK-8 working solution was added to a dark centrifuge tube, with a ratio of CCK-8/basic culture medium of 1:9. Ten microliters of the CCK-8 working solution was added to each well. After incubation for 4 h at 37 ℃ in a 5% CO2 incubator, the OD value was detected at 450 nm with a Biotek Synergy Neo2 microplate reader (Biotek, USA). The cell viability rate (%) was calculated according to the manufacturer’s protocol. Three independent experiments were conducted in this study.
TOX Immunofluorescence staining
AGS cells were seeded onto glass coverslips and adhered for 12 h at 37 ℃ in a 5% CO2 incubator. AGS cells were washed with PBS, fixed with 4% paraformaldehyde for 10 min, and then permeabilized with 0.1% Triton X-100 for 10 min. Subsequently, cells were blocked with 3% bovine serum albumin (BSA) in PBS for 1 h at room temperature, the primary antibody rabbit anti-human TOX (ab237009) was incubated with AGS cells overnight at 4 ℃, then goat anti-rabbit IgG Alexa Fluor®594 (ab150080) as secondary antibody was incubated for 1 h at room temperature. Additionally, cell nuclei were stained by DAPI (Solarbio, Beijing) for 10 min, then the coverslips with Permount™ Mounting Medium were added onto glass slides, and fluorescence images were obtained by a Zeiss LSM 900 Airyscan2 confocal laser scanning microscope.
Statistical analysis
R software (version 4.1.1) or GraphPad Prism (version 7.0) was used for data processing and statistical analysis. The Student's t test or Mann–Whitney U test was performed to identify differences between two groups, and the correlation between two groups was analyzed by Pearson’s or Spearman’s correlation test. P < 0.05 was considered statistically significant.
Results
TOX Expression
TOX expression was evaluated in the TCGA pan-cancer. High TOX expression was detected in 11 tumors: glioblastoma multiforme (GBM), glioma (GBMLGG), brain lower grade glioma (LGG), head and neck squamous cell carcinoma (HNSC), high-risk Wilms tumor (WT), pancreatic adenocarcinoma (PAAD), uterine carcinosarcoma (UCS), acute lymphoblastic leukemia (ALL), acute myeloid leukemia (LAML), pheochromocytoma and paraganglioma (PCPG), and cholangiocarcinoma (CHOL). Conversely, low TOX expression was detected in 18 tumors: breast invasive carcinoma (BRCA), esophageal carcinoma (ESCA), stomach and esophageal carcinoma (STES), kidney renal papillary cell carcinoma (KIRP), pankidney cohort (KIPAN), colon adenocarcinoma (COAD), colon adenocarcinoma/rectum adenocarcinoma esophageal carcinoma (COADREAD), prostate adenocarcinoma (PRAD), stomach adenocarcinoma (STAD), kidney renal clear cell carcinoma (KIRC), lung squamous cell carcinoma (LUSC), liver hepatocellular carcinoma (LIHC), bladder urothelial carcinoma (BLCA), thyroid carcinoma (THCA), rectum adenocarcinoma (READ), ovarian serous cystadenocarcinoma (OV), testicular germ cell tumors (TGCT), and kidney chromophobe (KICH) (Fig. 1).
Fig. 1.
Pancancer expression of TOX in tumor tissues from the TCGA database and normal tissues from the TCGA and GTEx databases
The expression differences of genes in different clinical staging samples for each tumor type were also calculated. Significant differences in 11 types of tumors were observed: lung adenocarcinoma (LUAD) (T1 = 169, T2 = 276, T3 = 47, T4 = 18), BRCA (T1 = 280, T2 = 630, T3 = 138, T4 = 40), STES (T1 = 52, T2 = 132, T3 = 277, T4 = 121), KIRP (T1 = 191, T2 = 33, T3 = 60), KIPAN (T1 = 484, T2 = 127, T3 = 257, T4 = 14), STAD (T1 = 21, T2 = 89, T3 = 180, T4 = 115), HNSC (T1 = 51, T2 = 157, T3 = 120, T4 = 189), KIRC (T1 = 272, T2 = 69, T3 = 179, T4 = 10), LUSC (T1 = 112, T2 = 292, T3 = 71, T4 = 23), THCA (T1 = 142, T2 = 166, T3 = 171, T4 = 23), TGCT (T1 = 76, T2 = 50, T3 = 6) (Fig. 2).
Fig. 2.
Pancancer TOX expression in different TNM stages
Genetic alterations in TOX
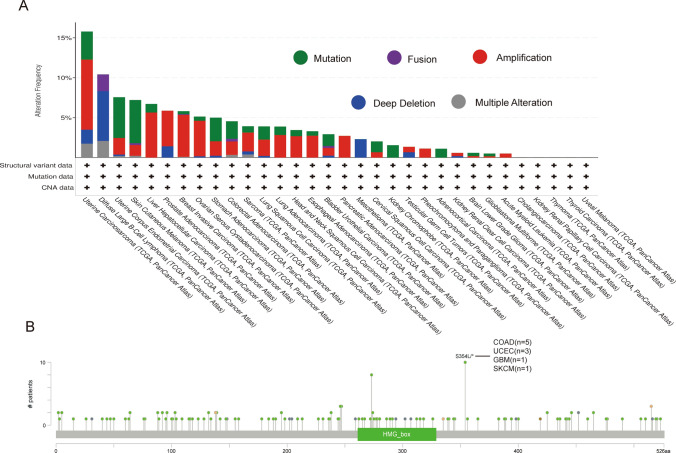
The genetic alteration status of TOX is displayed. As shown in Fig. 3A, patients with cutaneous melanoma with “mutations” as the main type had the highest alteration frequency of TOX (approximately 5%), and the “amplification” type of CNA was the dominant type of uterine carcinosarcoma, with a change frequency of approximately 10%. Furthermore, genetically altered diffuse large B-cell lymphomas (approximately 5%) had copy number deletions of TOX (Fig. 3A). The types, sites and case numbers of the TOX genetic alterations are shown in Fig. 3B. Moreover, the missense mutation of TOX was the main type of genetic alteration, and the S354L/* alteration was detected in 5 patients with COAD, 3 patients with uterine corpus endometrial carcinoma (UCEC), 1 patient with GBM and 1 patient with skin cutaneous melanoma (SKCM) (Fig. 3B).
Fig. 3.
Mutation features of TOX in different tumors in the TCGA cohort. The frequency of the alteration is shown together with the mutation type (A) and site (B)
Protein level of TOX
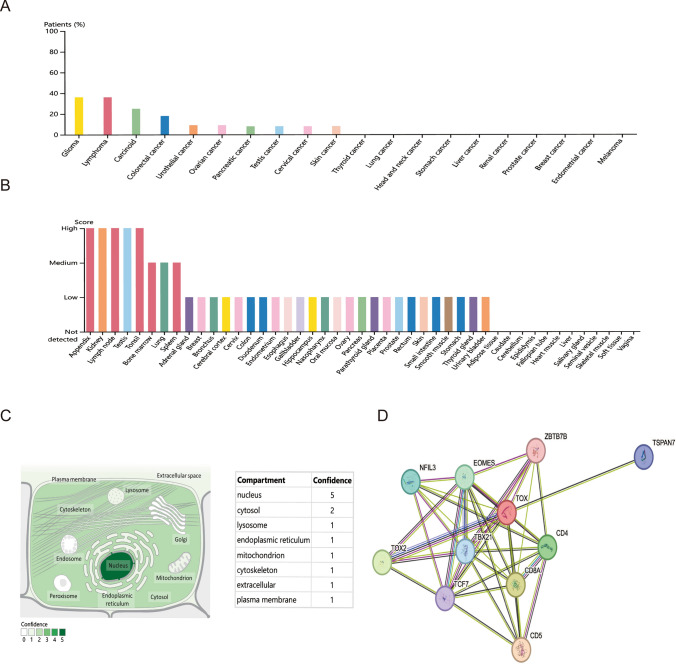
The protein level of TOX was explored using the HPA database. The protein level of TOX was highest in gliomas and lymphomas (Fig. 4A). In normal human tissues, the TOX protein level was high in kidney, testis, appendix, lymph node, and tonsil tissues (Fig. 4B).
Fig. 4.
Protein level and location of TOX. The protein level of TOX was analyzed in different tumors (A) and in normal human tissues (B). The subcellular location of TOX (C) and the PPI network of TOX (D)
The subcellular location of TOX was examined using the GeneCards database. TOX exhibited one protein location on the plasma membrane (Fig. 4C). Furthermore, the results of the PPI network revealed that TOX was closely associated with the CD4, CD5, CD8A, EOMES, NFIL3, TBX21, TCF7, TOX2, TSPAN7, and ZBTB7B proteins (Fig. 4D).
Prognostic analysis of TOX
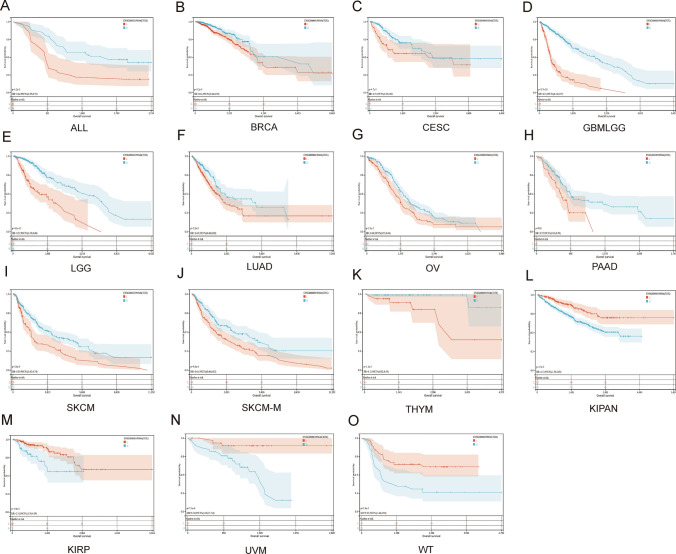
The prognostic significance of TOX was explored. The results of the Kaplan‒Meier OS analysis revealed that TOX was a protective factor for patients with ALL, BRCA, cervical squamous cell carcinoma and endocervical adenocarcinoma (CESC), GBMLGG, LGG, LUAD, OV, PAAD, SKCM, SKCM-M, and thymoma (THYM) (Fig. 5A-K), but it was a risk factor for patients with KIPAN, KIRP, uveal melanoma (UVM), and WT (Fig. 5L–O).
Fig. 5.
Kaplan–Meier analysis of overall survival of TOX. Pancancer Kaplan–Meier overall survival analysis of TOX in the indicated tumor types from the TCGA database (A–O). The median value of TOX in each tumor was taken as the cutoff value. Red: low expression; Blue: high expression
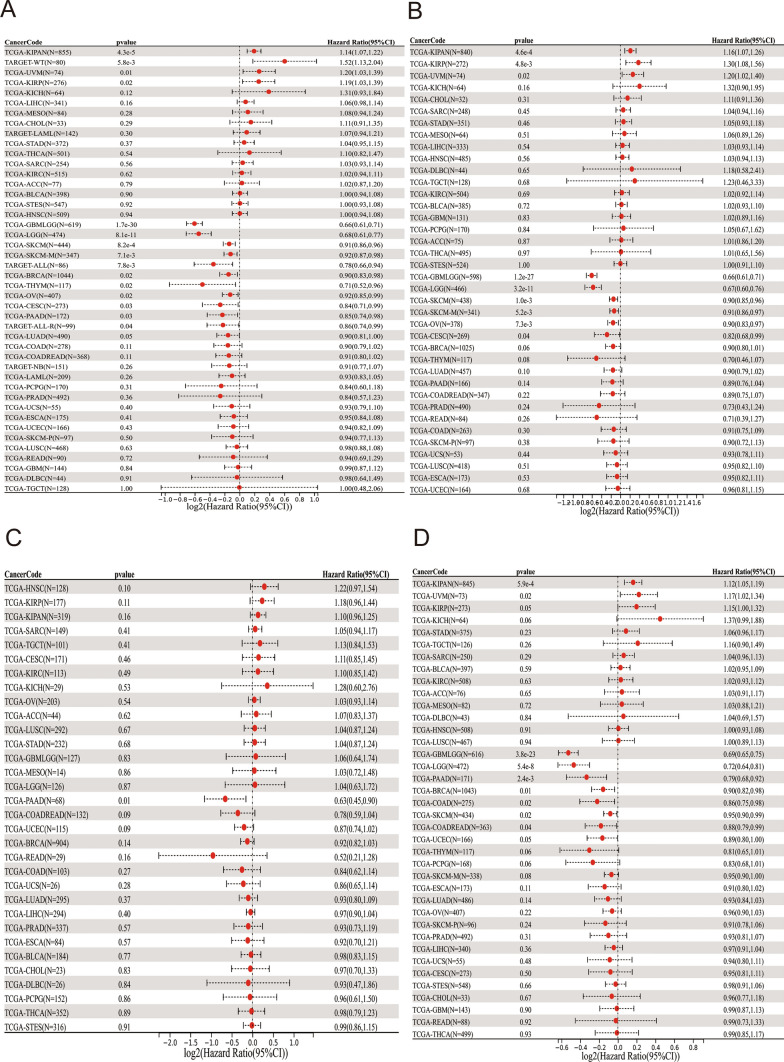
The univariate Cox regression analysis revealed that TOX served as a protective factor for patients with GBMLGG, LGG, SKCM, SKCM-M, ALL, BRCA, THYM, OV, CESC, PAAD, and ALL-R, but it was a risk factor for patients with KIPAN, WT, UVM, and KIRP (Fig. 6A). DSS analysis revealed that TOX was a protective factor for patients with GBMLGG, LGG, SKCM, SKCM-M, OV, and CESC, but it was a risk factor for patients with KIPAN, KIRP, and UVM (Fig. 6B). The DFI analysis revealed that TOX was a protective factor for patients with PAAD (Fig. 6C). Finally, PFI analysis revealed that TOX was a protective factor for patients with GBMLGG, LGG, PAAD, BRCA, COAD, SKCM, and COADREAD, but it was a risk factor for patients with KIPAN and UVM (Fig. 6D).
Fig. 6.
Univariate Cox regression analysis of TOX. Forest map showing the univariate Cox regression results of TOX for OS in the TCGA pancancer cohort (A). Forest map showing the univariate Cox regression results of TOX for DSS in the TCGA pancancer cohort (B). The forest map shows the univariate Cox regression results of TOX for the DFI in the TCGA pancancer cohort (C). The forest map shows the univariate Cox regression results of TOX for PFI in the TCGA pancancer cohort (D). Red represents significant results
GSEA of TOX
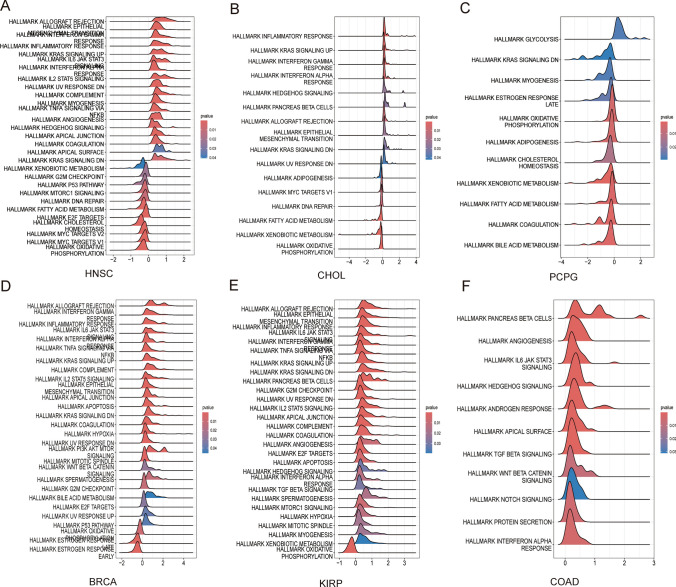
Pathways potentially involved in TOX were evaluated via GSEA in 33 tumor types from the TCGA. The results indicated that TOX was significantly related to many signaling pathways and responses, such as allograft rejection, the inflammatory response, the interferon gamma response, the IL-6-JAK-STAT3 signaling pathway, and the KRAS signaling pathway (Fig. 7A–F).
Fig. 7.
GSEA of TOX across cancers. GSEA of TOX in HNSC (A). GSEA of TOX in CHOL (B). GSEA of TOX in PCPG (C). GSEA of TOX in BRCA (D). GSEA of TOX in KIRP (E). GSEA of TOX in COAD (F)
Immune cell infiltration analysis
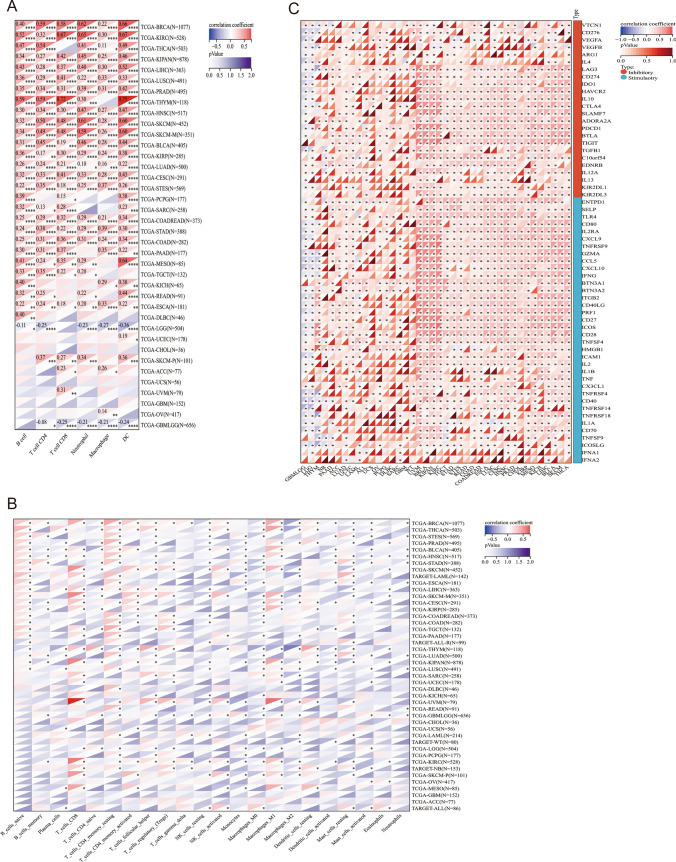
To study the relationship between the expression of TOX and immune cell infiltration, correlation analyses were conducted. The TIMER2 database revealed that TOX was related to the infiltration levels of B cells, CD8+ T cells, CD4+ T cells, neutrophils, macrophages and dendritic cells in the TCGA pancancer cohort (Fig. 8A). The results using the “CIBERSORT” method revealed that TOX was related to the infiltration levels of several immune cells, such as naive B cells, CD8+ T cells, and monocytes (Fig. 8B).
Fig. 8.
Immune cell infiltration analysis. Correlation between TOX expression and the infiltration level of immune cells according to the TIMER2 database (A). The correlation between TOX and the infiltration level of immune cells was determined via the “CIBERSORT” method (B). The relationships between TOX and the marker genes of exhausted T cells, immune-activating genes, and immunosuppressive genes were also determined (C). *p < 0.05; **p < 0.01; ***p < 0.001 and ****p < 0.0001
The relationships between TOX and marker genes of exhausted T cells, immune-activating genes, and immunosuppressive genes were also determined. The results revealed that TOX was positively related to LAG3, CD274, CTLA4, KIR2DL3, TIGIT, and IDO1 in many tumors, such as LICH, BLCA, SKCM, and THCA (Fig. 8C).
Expression of TOX protein in patients with cancer
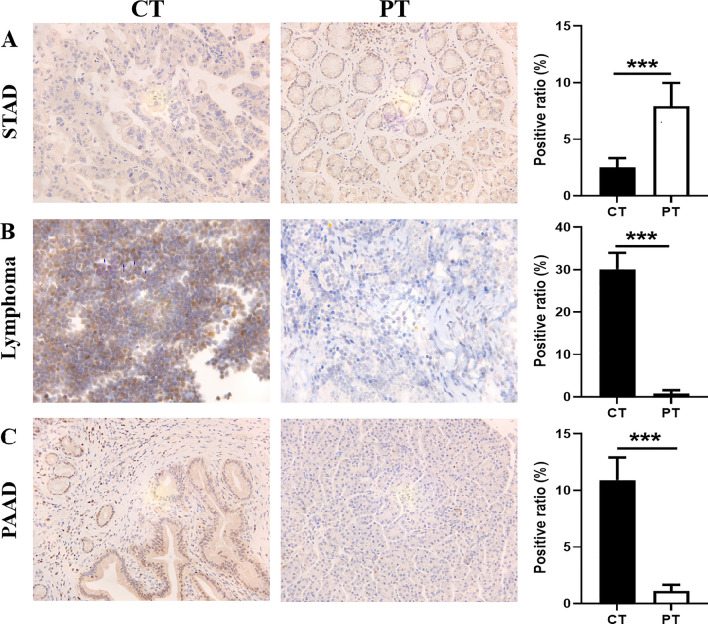
Immunohistochemical (IHC) analysis was performed to examine the expression of TOX in cancerous and paracancerous tissues from patients, including patients with STAD, lymphoma and PAAD (Fig. 9). The results revealed that TOX protein expression was significantly lower in STAD tissues than in paracancerous tissues (Fig. 9A). However, the levels of TOX protein were elevated in lymphoma and PAAD tissues compared with paracancerous tissues (Figs. 9B and C).
Fig. 9.
Expression of TOX in cancerous tissues (CTs) and paracancerous tissues (PTs). IHC analysis revealed that, compared with that in paracancerous tissues, TOX expression was significantly lower in STAD (A), but it was highly expressed in lymphoma (B) and PAAD (C) tissues. ***p < 0.001
Cell viability
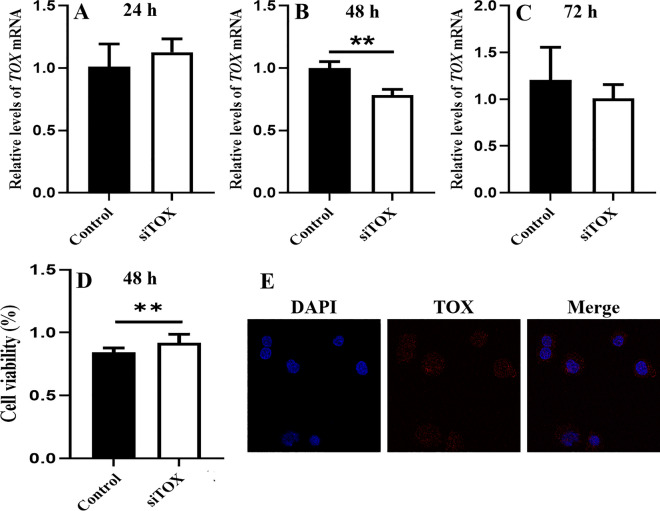
A CCK-8 assay was performed to assess the viability of AGS cells transfected with siTOX, and the expression of the TOX gene was detected by qPCR. The TOX gene was effectively knocked down in AGS cell lines at 48 h by siTOX (Fig. 10A–C), and the cell viability rate was significantly increased in AGS cells at 48 h (Fig. 10D). Additionally, the TOX protein was localized in cytoplasm, nucleus and cell membrane, and which mainly expressed in cytoplasm in AGS cell line by immunofluorescence staining (Fig. 10E).
Fig. 10.
Effects of TOX on the viability of the AGS cell line. The expression of the TOX gene was detected by qPCR at different time points (A–C). The cell viability rate was assessed in AGS cells at 48 h by CCK-8 analysis (D). Immunofluorescence staining demonstrates intracellular localization in AGS cell line (E). **p < 0.01; ***p < 0.001
Discussion
Immune checkpoints are expressed on immune cells that regulate immune activation [27]. Under normal circumstances, immune function can be activated when stimulated, but it is not overactivated because immune checkpoints can help immune system activation remain within the normal range [28]. Tumor cells express substances that activate immune checkpoints, and antigens cannot be presented to T cells, thereby inhibiting the immune function of T cells and allowing tumor cells to escape surveillance and survive [29]. These findings indicated that immune checkpoints play critical roles in regulating the function of immune cells and immune escape of cancer cells.
In recent years, immune checkpoint blockade therapy, a type of immunotherapy for cancer, has received increasing attention. PD-1 and CTLA4 have been approved for the clinical treatment of a variety of tumors, but they have a high incidence of adverse reactions [30, 31]. Therefore, new immune checkpoint targets and drugs are urgently needed. In this study, we investigated the role of TOX in a TCGA pancancer dataset.
First, the expression and prognostic significance of TOX across cancers were examined. TOX expression was high in 11 tumors including GBM, LGG, and HNSC. However, TOX expression was low in 18 tumors including BRCA, PRAD, and STAD. Moreover, the protein level of TOX was high in gliomas and lymphoma. These findings indicated that different levels of TOX was caused by the different source and heterogeneity of cancers, which also implied the important role of TOX in cancers, and which maybe a potential target for the diagnosis and treatment of cancers due to different levels of TOX in tumors. As a potential immune checkpoint, its localization was considered into cytoplasm, nucleus and cell membrane, and so on, and which mainly expressed in cytoplasm in AGS cell line in our study. Hence, the subcellular location of TOX was deeply explored in future study. Moreover, the results of the PPI network revealed that TOX was closely associated with the CD4, CD5, CD8A, EOMES, NFIL3, TBX21, TCF7, TOX2, TSPAN7, and ZBTB7B proteins.
The Kaplan‒Meier OS analysis suggested that TOX served as a protective factor for patients with ALL, BRCA,CESC, GBMLGG, LGG, LUAD, OV, PAAD, SKCM, SKCM-M, and THYM but a risk factor for patients with KIPAN, KIRP, UVM, and WT. For DSS, the results revealed that TOX was a protective factor for patients with GBMLGG, LGG, and SKCM, and so on, but a risk factor for patients with KIPAN, KIRP, and UVM. In addition, the DFI analysis revealed that TOX was a protective factor for patients with PAAD. Furthermore, PFI analysis revealed that TOX served as a protective factor for patients with GBMLGG, LGG, PAAD, BRCA, COAD, SKCM, and COADREAD but a risk factor for patients with KIPAN and UVM. These results were partly consistent with previous reports [8–10]. Therefore, these findings indicated that high TOX expression played a protective role in most tumor types, which contributed to control of cancers, but the detailed mechanism should be deeply revealed by further study.
GSEA revealed that TOX was significantly associated with immune-related pathways, such as allograft rejection, the inflammatory response, the interferon gamma response, the IL-6-JAK-STAT3 signaling pathway, and the KRAS signaling pathway. Intriguingly, previous studies have indicated that TOX is a key factor in the production and maintenance of T-cell dysfunction or exhaustion during chronic infection [8, 32]. Cytotoxic CD8+ T cells are killer cells in the T lymphocyte population. They support a large amount of cellular immunity, especially in tumor tissues [33]. CD4+ T cells play important roles in the activation and memory of cytotoxic CD8+ T cells [34]. We found that TOX expression was positively related to B, CD8+ T, and CD4+ T cells via two different methods, including the TIMER2 database and immune cell infiltration data using the “CIBERSORT” method. This finding implied that TOX expression in different cancers was closely associated with infiltrating immune cells subsets in tumor microenvironment, which might explain the protective effect of TOX in most tumor types.
In this study, to increase the reliability of the results, immunohistochemistry was used for further verification. Compared with those in paracancerous tissues, TOX protein levels were elevated in lymphoma and PAAD tissues but significantly decreased in STAD tissues. Among these subtypes, lymphoma is a subtype of acute lymphoid leukemia. Thus, the IHC results were consistent with the database analysis. T-cell exhaustion is common in patients with chronic infection and cancer [35]. Cancer patients usually have many T cells, but most of them are exhausted. In this study, we found that TOX was related to marker genes of exhausted T cells, immune-activating genes, and immunosuppressive genes, such as ENTPD1, SELP, CXCL9, CTLA4, KIR2DL3, and IDO1, across cancers. Additionally, our results revealed that knockdown of the TOX gene with siTOX significantly increased the viability of AGS cells, and TOX protein was mainly localized in cytoplasm, which partly indicated the necessity of TOX for the proliferation of cancer cells. Overall, these results suggested that TOX might be an immune checkpoint.
Research has indicated that TOX is highly expressed in breast cancer tissues and is correlated with unfavorable prognostic outcomes, and elevated TOX levels have been implicated in facilitating breast cancer cell proliferation and migration while concurrently impeding the antitumor capabilities of T cells [36]. In the context of lung cancer, particularly non-small cell lung cancer (NSCLC), increased TOX expression is linked to disease progression and evasion of immune surveillance mechanisms. TOX has been shown to induce intratumor T-cell exhaustion by upregulating immune checkpoint proteins within the cancer microenvironment [37]. However, investigations into the role of TOX in gastric and pancreatic cancer remain limited.
However, our study has several limitations, and additional experiments are needed to detect the antitumor activity and associated molecular mechanism of TOX in vitro and in vivo. Furthermore, more clinical trials are needed to validate the immune checkpoint effect of TOX.
Conclusion
In summary, we performed a comprehensive evaluation of TOX, revealing its potential role as a prognostic indicator for cancer patients and its immunomodulatory effects. The potential advancements in treatment strategies for TOX molecules may encompass the following components. (1) TOX-targeted therapy involves the creation of small-molecule drugs designed to selectively impede the expression or activity of TOX, thereby reinstating the anti-tumor capabilities of T cells. (2) Combination immunotherapy involves the utilization of TOX inhibitors in conjunction with established immune checkpoint inhibitors to augment the immune response against tumors. (3) Gene editing technologies, such as CRISPR/Cas9, can be used for direct targeting of TOX genes in tumor cells or T cells. (4) In conjunction with immune therapy optimization, specifically CAR-T-cell or TCR-T-cell therapy, the ability to modulate TOX expression enhances the efficacy of immunotherapy. (5) Furthermore, the identification of TOX as a potential biomarker holds promise for predicting patient response and prognosis to immunotherapy, facilitating the development of personalized treatment strategies.
The differential expression of TOX has been shown to have a significant impact on prognosis in various cancer types, highlighting the importance of investigating its role across cancers. TOX plays a critical regulatory role in T-cell exhaustion and the tumor immune microenvironment, making it a promising target for the development of novel cancer treatment strategies. Further exploration of TOX expression and function across different cancer types may provide a theoretical foundation for the development of more effective immunotherapy approaches. Overall, TOX, as a potential new immune checkpoint, might become a target for tumor immunotherapy.
Acknowledgements
We gratefully appreciate the highly qualified native English editors at American Journal Experts (AJE) for providing reputable English language editing service (Verification code: AAD0-DD91-FBB2-A0E9-2108).
Abbreviations
- TME
Tumor microenvironment
- TIME
Tumor immune microenvironment
- PD-1
Programmed cell death protein 1
- HMG-Box
High mobility group-box
- TOX
Thymocyte selection-associated HMG-BOX
- GTEx
Genotype-Tissue Expression
- TST
Tumor-specific T cells
- PPI
Protein‒protein interaction
- CCK-8
Cell Counting Kit-8
- CHOL
Cholangiocarcinoma
- CT
Cancer tissue
- DFS
Disease-free survival
- DLBC
Diffuse large B-cell lymphoma
- GAPDH
Glyceraldehyde 3-phosphate dehydrogenase
- GEO
Gene Expression Omnibus
- GEPIA2
Gene Expression Profiling Interaction Analysis, Version 2
- HCC
Hepatocellular carcinoma
- IHC
Immunohistochemistry
- KEGG
Kyoto Encyclopedia of Genes and Genomes
- Kip
Kinase inhibitory protein
- LUAD
Lung adenocarcinoma
- OV
Ovarian serous cystadenocarcinoma
- PCT
Paracancerous tissue
- PRAD
Prostate adenocarcinoma
- qPCR
Quantitative polymerase chain reaction
- RCC
Renal cell carcinoma
- SKCM
Skin cutaneous melanoma
- SKP1
S-phase kinase-associated protein 1
- STAD
Stomach adenocarcinoma
- TCGA
The Cancer Genome Atlas
- THCA
Thyroid carcinoma
- TIMER2
Tumor Immune Assessment Resource, Version 2
- OS
Overall survival
- DSS
Disease-specific survival
- DFI
Disease-free interval
- PFI
Progression-free interval
- GSEA
Gene set enrichment analysis
- GBM
Glioblastoma multiforme
- LGG
Lower grade glioma
- HNSC
Head and neck squamous cell carcinoma
- PAAD
Pancreatic adenocarcinoma
- UCS
Uterine carcinosarcoma
- ALL
Acute lymphoblastic leukemia
- AML
Acute myeloid leukemia
- CHOL
Cholangiocarcinoma
- BRCA
Breast invasive carcinoma
- STAD
Stomach adenocarcinoma
- LUSC
Lung squamous cell carcinoma
- LIHC
Liver hepatocellular carcinoma
- KIRP
Kidney renal papillary cell carcinoma
- COAD
Colon adenocarcinoma
- PRAD
Prostate adenocarcinoma
Author contributions
Dawei Cui, Shengliang Qiu, and Qinfeng Zhou designed the study. Weiye Lin, Zhengyang Zhou, Qianran Hong, Shuangyu Chen, and Jiayang Li performed the data analysis. Dawei Cui, and Shengliang Qiu drafted the manuscript. Shengliang Qiu, Fengyun Zhong, Qinfeng Zhou and Dawei Cui revised the manuscript. All authors contributed to the manuscript and approved the submitted version.
Funding
This study was supported by National Natural Science Foundation of China (82205211, 81871709), Suzhou Special Project of Diagnosis and Treatment Technology for Key Clinical Diseases (LCZX202204).
Data availability
All data supporting the findings of this study are available within the paper.
Code availability
Data analysis and graphical representation were performed using custom R scripts and publicly available packages, as indicated in the text. All scripts are available on request.
Declarations
Ethics approval and consent to participate
The clinical data of patients involved in this study were derived from an open-access database; therefore, consent was not required. This study was carried out in compliance with the Declaration of Helsinki and received approval from the Ethical Committee of The First Affiliated Hospital of Zhejiang Chinese Medical University (Zhejiang Provincial Hospital of Chinese Medicine), and all participants gave informed consent before the start of the study.
Competing interests
The authors declare no competing interests.
Footnotes
Publisher's Note
Springer Nature remains neutral with regard to jurisdictional claims in published maps and institutional affiliations.
Contributor Information
Fengyun Zhong, Email: zfysz@126.com.
Qinfeng Zhou, Email: zhouqinfeng502@163.com.
Dawei Cui, Email: daweicui@zju.edu.cn.
References
- 1.Gu X, Liu Y, Dai X, et al. Deciphering the potential roles of ferroptosis in regulating tumor immunity and tumor immunotherapy. Front Immunol. 2023;14:1137107. 10.3389/fimmu.2023.1137107. 10.3389/fimmu.2023.1137107 [DOI] [PMC free article] [PubMed] [Google Scholar]
- 2.Xing S, Hu K, Wang Y. Tumor immune microenvironment and immunotherapy in non-small cell lung cancer: update and new challenges. Aging Dis. 2022;13(6):1615–32. 10.14336/AD.2022.0407. 10.14336/AD.2022.0407 [DOI] [PMC free article] [PubMed] [Google Scholar]
- 3.Toor SM, Sasidharan Nair V, Decock J, et al. Immune checkpoints in the tumor microenvironment. Semin Cancer Biol. 2020;65:1–12. 10.1016/j.semcancer.2019.06.021. 10.1016/j.semcancer.2019.06.021 [DOI] [PubMed] [Google Scholar]
- 4.Schmitz F, Wolf D, Holderried TAW. The role of immune checkpoints after cellular therapy. Int J Mol Sci. 2020;21(10):3650. 10.3390/ijms21103650. 10.3390/ijms21103650 [DOI] [PMC free article] [PubMed] [Google Scholar]
- 5.Jiang Y, Chen M, Nie H, et al. PD-1 and PD-L1 in cancer immunotherapy: clinical implications and future considerations. Hum Vaccin Immunother. 2019;15(5):1111–22. 10.1080/21645515.2019.1571892. 10.1080/21645515.2019.1571892 [DOI] [PMC free article] [PubMed] [Google Scholar]
- 6.Kamada T, Togashi Y, Tay C, et al. PD-1+ regulatory T cells amplified by PD-1 blockade promote hyperprogression of cancer. Proc Natl Acad Sci U S A. 2019;116(20):9999–10008. 10.1073/pnas.1822001116. 10.1073/pnas.1822001116 [DOI] [PMC free article] [PubMed] [Google Scholar]
- 7.Liu Z, Ren Y, Weng S, et al. A new trend in cancer treatment: the combination of epigenetics and immunotherapy. Front Immunol. 2022;13:809761. 10.3389/fimmu.2022.809761. 10.3389/fimmu.2022.809761 [DOI] [PMC free article] [PubMed] [Google Scholar]
- 8.Scott AC, Dundar F, Zumbo P, et al. TOX is a critical regulator of tumour-specific T cell differentiation. Nature. 2019;571(7764):270–4. 10.1038/s41586-019-1324-y. 10.1038/s41586-019-1324-y [DOI] [PMC free article] [PubMed] [Google Scholar]
- 9.Han J, Wan M, Ma Z, et al. The TOX subfamily: all-round players in the immune system. Clin Exp Immunol. 2022;208(3):268–80. 10.1093/cei/uxac037. 10.1093/cei/uxac037 [DOI] [PMC free article] [PubMed] [Google Scholar]
- 10.Niu H, Wang H. TOX regulates T lymphocytes differentiation and its function in tumor. Front Immunol. 2023;14:990419. 10.3389/fimmu.2023.990419. 10.3389/fimmu.2023.990419 [DOI] [PMC free article] [PubMed] [Google Scholar]
- 11.Khan O, Giles JR, McDonald S, et al. TOX transcriptionally and epigenetically programs CD8+ T cell exhaustion. Nature. 2019;571(7764):211–8. 10.1038/s41586-019-1325-x. 10.1038/s41586-019-1325-x [DOI] [PMC free article] [PubMed] [Google Scholar]
- 12.Huang H, Qiu D, Zhou Z, et al. A pan-cancer analysis for the oncogenic role of cyclin-dependent kinase inhibitor 1B in human cancers. Discov Oncol. 2023;14(1):126. 10.1007/s12672-023-00746-8. 10.1007/s12672-023-00746-8 [DOI] [PMC free article] [PubMed] [Google Scholar]
- 13.He W, Zhang H, Cheng H, et al. PIK3CD correlates with prognosis, epithelial-mesenchymal transition and tumor immune infiltration in breast carcinoma. Discov Oncol. 2023;14(1):187. 10.1007/s12672-023-00805-0. 10.1007/s12672-023-00805-0 [DOI] [PMC free article] [PubMed] [Google Scholar]
- 14.Liu XS, Chen YL, Chen YX, et al. Pan-cancer analysis reveals correlation between RAB3B expression and tumor heterogeneity, immune microenvironment, and prognosis in multiple cancers. Sci Rep. 2024;14(1):9881. 10.1038/s41598-024-60581-x. 10.1038/s41598-024-60581-x [DOI] [PMC free article] [PubMed] [Google Scholar]
- 15.Wang S, Wu R, Lu J, et al. Protein-protein interaction networks as miners of biological discovery. Proteomics. 2022;22(15–16): e2100190. 10.1002/pmic.202100190. 10.1002/pmic.202100190 [DOI] [PubMed] [Google Scholar]
- 16.Cai X, Lin J, Liu L, et al. A novel TCGA-validated programmed cell-death-related signature of ovarian cancer. BMC Cancer. 2024;24(1):515. 10.1186/s12885-024-12245-2. 10.1186/s12885-024-12245-2 [DOI] [PMC free article] [PubMed] [Google Scholar]
- 17.Lu S, Sun X, Tang H, et al. Colorectal cancer with low SLC35A3 is associated with immune infiltrates and poor prognosis. Sci Rep. 2024;14(1):329. 10.1038/s41598-023-51028-w. 10.1038/s41598-023-51028-w [DOI] [PMC free article] [PubMed] [Google Scholar]
- 18.Li B, Severson E, Pignon J-C, et al. Comprehensive analyses of tumor immunity: implications for cancer immunotherapy. Genome Biol. 2016;17(1):174. 10.1186/s13059-016-1028-7. 10.1186/s13059-016-1028-7 [DOI] [PMC free article] [PubMed] [Google Scholar]
- 19.Kawada JI, Takeuchi S, Imai H, et al. Immune cell infiltration landscapes in pediatric acute myocarditis analyzed by CIBERSORT. J Cardiol. 2021;77(2):174–8. 10.1016/j.jjcc.2020.08.004. 10.1016/j.jjcc.2020.08.004 [DOI] [PubMed] [Google Scholar]
- 20.D’Arrigo G, Leonardis D, Abd ElHafeez S, et al. Methods to analyse time-to-event data: the kaplan-meier survival curve. Oxid Med Cell Longev. 2021;2021:2290120. 10.1155/2021/2290120. 10.1155/2021/2290120 [DOI] [PMC free article] [PubMed] [Google Scholar]
- 21.Lira RPC, Antunes-Foschini R, Rocha EM. Survival analysis (Kaplan-Meier curves): a method to predict the future. Arq Bras Oftalmol. 2020;83(2):V–VII. 10.5935/0004-2749.20200036. 10.5935/0004-2749.20200036 [DOI] [PMC free article] [PubMed] [Google Scholar]
- 22.Su C, Xue J, Liu N. Cox regression analysis of prognostic factors of intensity-modulated radiotherapy in patients with bladder cancer. Arch Esp Urol. 2023;76(6):411–7. 10.56434/j.arch.esp.urol.20237606.50. 10.56434/j.arch.esp.urol.20237606.50 [DOI] [PubMed] [Google Scholar]
- 23.Canzler S, Hackermuller J. multiGSEA: a GSEA-based pathway enrichment analysis for multi-omics data. BMC Bioinformatics. 2020;21(1):561. 10.1186/s12859-020-03910-x. 10.1186/s12859-020-03910-x [DOI] [PMC free article] [PubMed] [Google Scholar]
- 24.Cao H, Zhao J, Chen Z, et al. Loss of LIMCH1 predicts poor prognosis in patients with surgically resected lung adenocarcinoma: a study based on immunohistochemical analysis and bioinformatics. J Cancer. 2021;12(1):181–9. 10.7150/jca.47883. 10.7150/jca.47883 [DOI] [PMC free article] [PubMed] [Google Scholar]
- 25.Zhao X, Duan L, Cui D, et al. Exploration of biomarkers for systemic lupus erythematosus by machine-learning analysis. BMC Immunol. 2023;24(1):44. 10.1186/s12865-023-00581-0. 10.1186/s12865-023-00581-0 [DOI] [PMC free article] [PubMed] [Google Scholar]
- 26.Jiang D, Chen C, Yan D, et al. Exhausted phenotype of circulating CD8+ T cell subsets in hepatitis B virus carriers. BMC Immunol. 2022;23(1):18. 10.1186/s12865-022-00488-2. 10.1186/s12865-022-00488-2 [DOI] [PMC free article] [PubMed] [Google Scholar]
- 27.Li B, Chan HL, Chen P. Immune checkpoint inhibitors: basics and challenges. Curr Med Chem. 2019;26(17):3009–25. 10.2174/0929867324666170804143706. 10.2174/0929867324666170804143706 [DOI] [PubMed] [Google Scholar]
- 28.Zhang Y, Zheng J. Functions of immune checkpoint molecules beyond immune evasion. Adv Exp Med Biol. 2020;1248:201–26. 10.1007/978-981-15-3266-5_9. 10.1007/978-981-15-3266-5_9 [DOI] [PubMed] [Google Scholar]
- 29.Liu Y, Wang Y, Yang Y, et al. Emerging phagocytosis checkpoints in cancer immunotherapy. Signal Transduct Target Ther. 2023;8(1):104. 10.1038/s41392-023-01365-z. 10.1038/s41392-023-01365-z [DOI] [PMC free article] [PubMed] [Google Scholar]
- 30.Rotte A. Combination of CTLA-4 and PD-1 blockers for treatment of cancer. J Exp Clin Cancer Res. 2019;38(1):255. 10.1186/s13046-019-1259-z. 10.1186/s13046-019-1259-z [DOI] [PMC free article] [PubMed] [Google Scholar]
- 31.Dovedi SJ, Elder MJ, Yang C, et al. Design and efficacy of a monovalent bispecific PD-1/CTLA4 antibody that enhances CTLA4 blockade on PD-1+ activated T cells. Cancer Discov. 2021;11(5):1100–17. 10.1158/2159-8290.CD-20-1445. 10.1158/2159-8290.CD-20-1445 [DOI] [PubMed] [Google Scholar]
- 32.Yao C, Sun H-W, Lacey NE, et al. Single-cell RNA-seq reveals TOX as a key regulator of CD8+ T cell persistence in chronic infection. Nat Immunol. 2019;20(7):890–901. 10.1038/s41590-019-0403-4. 10.1038/s41590-019-0403-4 [DOI] [PMC free article] [PubMed] [Google Scholar]
- 33.Lees JR. CD8+ T cells: the past and future of immune regulation. Cell Immunol. 2020;357:104212. 10.1016/j.cellimm.2020.104212. 10.1016/j.cellimm.2020.104212 [DOI] [PubMed] [Google Scholar]
- 34.Speiser DE, Chijioke O, Schaeuble K, et al. CD4+ T cells in cancer. Nat Cancer. 2023;4(3):317–29. 10.1038/s43018-023-00521-2. 10.1038/s43018-023-00521-2 [DOI] [PubMed] [Google Scholar]
- 35.Chow A, Perica K, Klebanoff CA, et al. Clinical implications of T cell exhaustion for cancer immunotherapy. Nat Rev Clin Oncol. 2022;19(12):775–90. 10.1038/s41571-022-00689-z. 10.1038/s41571-022-00689-z [DOI] [PMC free article] [PubMed] [Google Scholar]
- 36.Arora M, Kumari S, Singh J, et al. Expression pattern, regulation, and clinical significance of TOX in breast cancer. Cancer Immunol Immunother. 2021;70(2):349–63. 10.1007/s00262-020-02689-3. 10.1007/s00262-020-02689-3 [DOI] [PMC free article] [PubMed] [Google Scholar]
- 37.Kim K, Park S, Park SY, et al. Single-cell transcriptome analysis reveals TOX as a promoting factor for T cell exhaustion and a predictor for anti-PD-1 responses in human cancer. Genome Med. 2020;12(1):22. 10.1186/s13073-020-00722-9. 10.1186/s13073-020-00722-9 [DOI] [PMC free article] [PubMed] [Google Scholar]
Associated Data
This section collects any data citations, data availability statements, or supplementary materials included in this article.
Data Availability Statement
All data supporting the findings of this study are available within the paper.
Data analysis and graphical representation were performed using custom R scripts and publicly available packages, as indicated in the text. All scripts are available on request.


