Abstract
Test subjects were assessed in a partial gravity environment during parabolic flight while they performed mission-critical activities that challenged their balance and locomotion. These functional activities included rising from a seated position and walking, jumping down, recovering from falls, and maintaining an upright stance. Twelve volunteers were tested during 10 parabolas that produced 0.25×g, 0.5×g, or 0.75×g, and at 1×g during level flight intervals between parabolas. Additionally, 14 other subjects were tested using identical procedures in a 1×g laboratory setting. Partial gravity altered the performance of settling after standing and navigating around obstacles. As gravity levels decreased, the time required to stand up, settle, walk, and negotiate obstacles, and the number of falls increased. Information obtained from these tests will allow space agencies to assess the vestibular, sensorimotor, and cardiovascular risks associated with different levels of partial gravity.
Subject terms: Neuroscience, Physiology
Introduction
Upon landing on the Moon and Mars, crews will need to perform mission-critical tasks autonomously after prolonged periods in microgravity—a scenario that has received very little research attention to date1. These include egressing from a seat, standing, walking, jumping, and recovering from falls. To develop an effective strategy that preserves crew performance during exploration missions, it is essential to determine how exposure to partial gravity, such as that on the Moon or Mars, affects the execution of these maneuvers.
Numerous experiments have investigated how astronauts perform after they return from missions to the International Space Station (ISS)2. The investigators assessed maneuvers such as seat egress, tandem walk, jump down, and recovery from falls, and they detected changes in the execution of these tasks after a 2-week spaceflight on the Space Shuttle or a 6-month stay on board the ISS3,4. Moreover, significant declines in task performance were noted in bed rest participants after they spent 70 days in a −6° head-down tilt position5.
Recently acquired data showed that eight study participants exhibited deficiencies in tandem walk performance after their body was unloaded in the NASA Active Response Gravity Offload System6, a ground analog of the partial gravity environment of space. The NASA Active Response Gravity Offload System and bed rest modify proprioceptive inputs during acute and chronic axial body unloading, respectively. However, these terrestrial conditions do not affect vestibular inputs. By contrast, partial gravity induced by parabolic flight enables the exploration of alterations in vestibular, cardiovascular, and proprioceptive systems. It also sheds light on how these sensory systems integrate with the motor system during the performance of functional activities that will be critical during exploration space missions.
Limited knowledge exists concerning the relationships between exposure to altered gravity levels and the performance of specific maneuvers such as egressing from a seat, walking, jumping down, and recovering from potential falls. To perform these maneuvers correctly, an accurate representation of an upright posture is required, which serves as a reference for aligning the body to achieve maximum stability7,8. The perception of an upright position involves a combination of factors: the perceived direction of gravity, visual cues regarding orientation in an environment, and an internal representation of the body’s orientation known as the idiotropic vector9. Errors in this representation can lead to postural instability.
Astronauts might experience alterations in perceived upright position on the Moon or on Mars if lunar or Martian gravity falls below the threshold that influences the perception of upright. Concerning whole-body linear acceleration, the threshold for vestibular motion detection varies between 0.014 and 0.25 m/s² 10–13. The gravitational acceleration on Mars (3.8 m/s²) and on the Moon (1.6 m/s²) both surpass this threshold. On Earth, normal sway angles in the anterior–posterior and medial–lateral directions are approximately 12.5° and 16°, respectively14–16.
Test subjects were analyzed while performing five functional activities deemed critical for planetary missions (seat egress and walk, jump down, recovery from potential fall, stance, and limits of stability), both while in partial gravity and in normal gravity phases of parabolic flight. The equipment and procedures were identical to those used for assessing astronauts returning from ISS missions and for evaluating ground-based subjects experiencing axial body unloading.
Our hypothesis was that the performance of these activities would diminish as gravity levels decreased and approached the vestibular thresholds. We predicted the most pronounced decline in performance would occur at the lowest gravity level (0.25×g) because the subjects would lack a gravitational reference for perceiving upright posture. The information obtained from the present study could assist in assessing risk to astronauts’ performance during exploration missions and could guide the formulation of countermeasures for these missions.
Results
Tandem stance
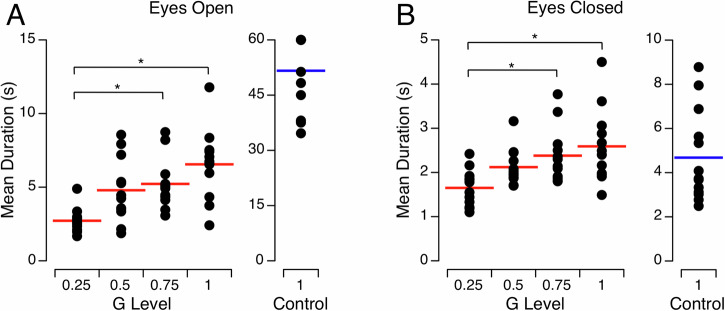
The mean duration the participants were able to maintain an upright stance on a 4.5 cm wide rail before stepping was significantly longer for the subjects tested at 1×g in the laboratory than for those tested at 1×g in the aircraft, for both the tests with their eyes open (t-test, p < 0.001) and with their eyes closed (t-test, p < 0.01) (Fig. 1). Repeated measures ANOVA indicated a significant effect of gravity on the mean duration of tandem stance with eyes open [F(3,47) = 8.61, p < 0.001] and with eyes closed [F(3,47) = 6.64, p = 0.001]. Post hoc analysis using the Bonferroni test indicated that the duration of tandem stance with eyes open at 0.25×g and at 0.75×g was significantly different (p = 0.013), and the duration at 0.25×g and at 1×g was also significantly different (p < 0.001), and with eyes closed the duration was significantly different at 0.25×g and at 0.75×g (p = 0.002), and at 0.25×g and at 1×g (p < 0.001).
Fig. 1. Tandem stance.
Mean duration of tandem stance balance on a narrow rail with eyes open (A) and eyes closed (B). Individual data and mean (red bar) of 12 subjects at 0.25×g, 0.50×g, 0.75×g, and 1.0×g in the aircraft; individual data and mean (blue bar) of 14 subjects at 1×g in the laboratory (Control). Note the different scales in durations between 1×g in the laboratory (Control, 1) and 1×g in the aircraft (G level, 1). *p < 0.05 (Bonferroni test adjusted for multiple comparisons).
Seat egress and walk
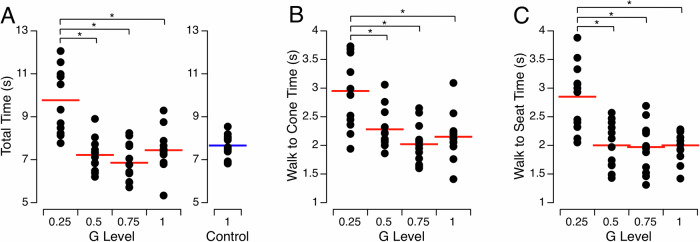
The mean duration for completing the seat egress and walk test was not significantly different for the subjects tested at 1×g in the laboratory and for those tested at 1×g in the aircraft (t-test, p = 0.521) (Fig. 2). Repeated measures ANOVA indicated a significant effect of gravity level on time required to walk toward the cone [F(3,47) = 9.83, p < 0.001], the time required to walk back to the seat [F(3,47)] = 11.67, p < 0.001], and the overall time to complete the whole test [F(3,47) = 18.51, p < 0.001]. Post hoc analysis using the Bonferroni test indicated that these durations were significantly longer at 0.25×g than at 0.5×g, 0.75×g, or 1×g (p < 0.001).
Fig. 2. Seat egress and walk.
Time to complete the obstacle course (A), time to walk to the cone (B), and time to walk back to the seat (C). Individual data and mean (red bar) of 12 subjects at 0.25×g, 0.50×g, 0.75×g, and 1.0×g in the aircraft; individual data and mean (blue bar) of 14 subjects at 1×g in the laboratory. *p < 0.05 (Bonferroni test adjusted for multiple comparisons).
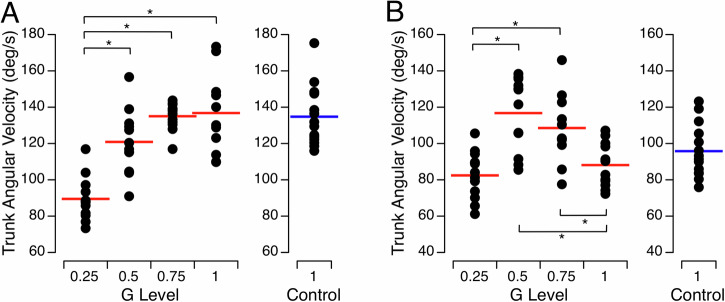
The trunk’s angular velocity around the cone and before sitting was not significantly different for the subjects tested at 1×g in the laboratory and for those tested at 1×g in the aircraft (t-test, p = 0.882 and p = 0.184, respectively) (Fig. 3). Repeated measures ANOVA indicated a significant effect of gravity level on the trunk’s angular velocity around the cone [F(3,47) = 14.90, p < 0.001] and before sitting [F(3,47) = 12.02, p < 0.001]. Post hoc analysis using the Bonferroni adjusted p-value indicated that the trunk’s angular velocity around the cone was significantly slower at 0.25×g than at 0.5×g, 0.75×g, or 1×g (p < 0.001). The trunk’s angular velocity before sitting was significantly slower at 0.25×g than at 0.5×g (p < 0.001) or 0.75×g (p = 0.002). However, it was significantly faster at 0.5×g than at 1×g (p < 0.001); and significantly faster at 0.75×g than at 1×g (p = 0.022).
Fig. 3. Seat egress and walk.
Trunk’s angular velocity around the cone (A) and before seating (B) during the completion of the obstacle course. Individual data and mean (red bar) of 12 subjects at 0.25×g, 0.50×g, 0.75×g, and 1.0×g in the aircraft; individual data and mean (blue bar) of 14 subjects at 1×g in the laboratory. *p < 0.05 (Bonferroni test adjusted for multiple comparisons).
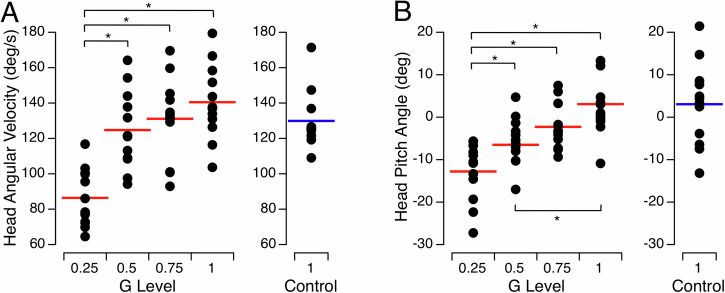
The head’s angular velocity around the cone was not significantly different for the subjects tested at 1×g in the laboratory and for those tested at 1×g in the aircraft (t-test, p = 0.279) (Fig. 4A). Repeated measures ANOVA indicated a significant effect of gravity level on the head’s angular velocity around the cone [F(3,47) = 15.54, p < 0.001]. Post hoc analysis indicated that the head’s angular velocity around the cone was significantly slower at 0.25×g than at 0.5×g, 0.75×g, or 1×g (p < 0.001).
Fig. 4. Seat egress and walk.
Head’s angular velocity around the cone (A) and change in pitch head angle (B) during the completion of the obstacle course. Individual data and mean (red bar) of 12 subjects at 0.25×g, 0.50×g, 0.75×g, and 1.0×g in the aircraft; individual data and mean (blue bar) of 14 subjects at 1×g in the laboratory. *p < 0.05 (Bonferroni test adjusted for multiple comparisons).
The change in head pitch around the cone was not significantly different in the subjects tested at 1×g in the laboratory compared to those tested at 1×g in the aircraft (t-test, p = 0.477) (Fig. 4B). A repeated measures ANOVA indicated a significant effect of gravity level on the change in the head pitch from the start to the end of the cone turn [F(3,47) = 13.35, p < 0.001]. Post hoc analysis using the Bonferroni adjusted p-value indicated significantly larger magnitudes (5–30°) of upward head pitch while exiting the turn compared to entering the turn at 0.25×g compared to 0.5×g (p < 0.05), 0.75×g (p < 0.001), and 1×g (p < 0.01), and at 0.5×g compared to 1×g (p < 0.01).
Recovery from fall
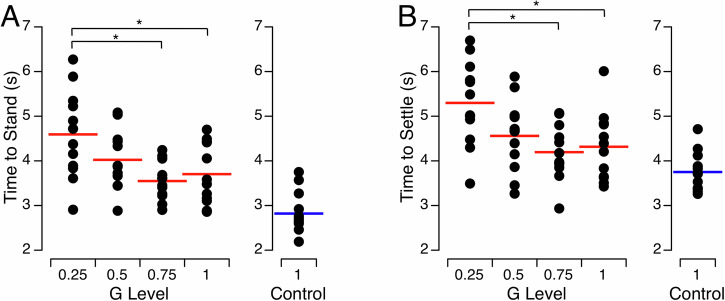
The mean time to stand from a prone position and the mean time to settle after standing were significantly different for the subjects tested at 1×g in the laboratory and for those tested at 1×g in the aircraft (t-test, p < 0.001 and p = 0.036, respectively) (Fig. 5). Repeated measures ANOVA indicated a significant effect of gravity level on time required to stand [F(3,47) = 4.996, p = 0.005] and the time required to settle [F(3,47) = 4.704, p = 0.006]. These times were significantly longer at 0.25×g than at 0.75×g (p < 0.01) or 1×g (p < 0.05).
Fig. 5. Recovery from fall.
Time to stand from a prone position (A) and time to settle after standing (B). Individual data and mean (red bar) of 12 subjects at 0.25×g, 0.50×g, 0.75×g, and 1.0×g in the aircraft; individual data and mean (blue bar) of 14 subjects at 1×g in the laboratory. *p < 0.05 (Bonferroni test adjusted for multiple comparisons).
The changes in heart rate during the transition from a prone position to a standing position were not significantly different for the subjects tested at 1×g in the laboratory and for those tested at 1×g in the aircraft (t-test, p = 0.514) (Fig. 6). Repeated measures ANOVA indicated a significant effect of gravity level on the changes in heart rate [F(3,47) = 5.509, p = 0.003]. Post hoc Bonferroni tests indicated that the change in heart rate was significantly smaller at 0.25×g than at 0.75×g (p = 0.01), or 1×g (p < 0.01).
Fig. 6. Recovery from fall.
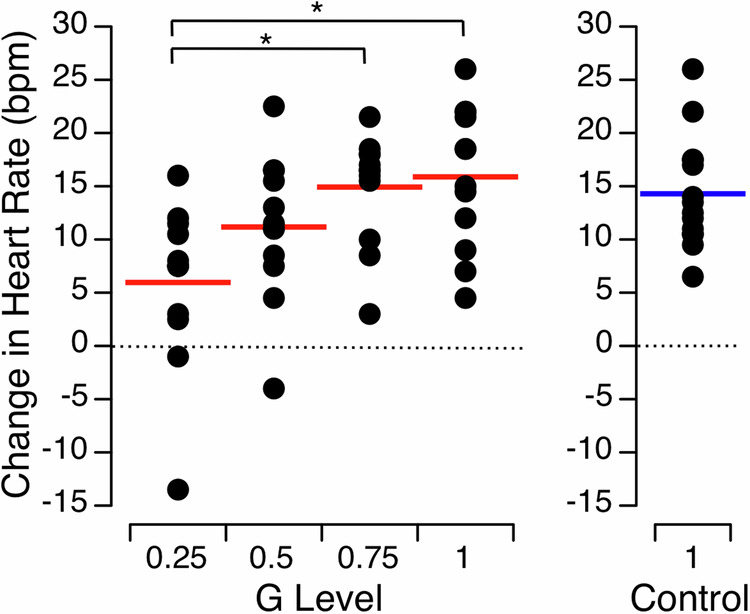
Changes in heart rate after standing from a prone position. Individual data and mean (red bar) of 12 subjects at 0.25g, 0.50g, 0.75g, and 1.0g in the aircraft; individual data and mean (blue bar) of 14 subjects at 1×g in the laboratory. *p < 0.05 (Bonferroni test adjusted for multiple comparisons).
Jump down
During the jump-down test, encompassing all participants, a total of 9 falls occurred at 0.25×g, 2 falls at 0.5×g, 1 fall at 0.75×g, 0 falls at 1×g in the aircraft, and 0 falls at 1×g in the laboratory. The mean time required to settle after jumping from a 30 cm platform was not significantly different for the subjects tested at 1×g in the laboratory and for those tested at 1×g in the aircraft (t-test, p = 0.930) (Fig. 7). Repeated measures ANOVA indicated no significant effect of gravity level on the mean time required to settle [F(3,47) = 1.183, p = 0.327].
Fig. 7. Jump down.
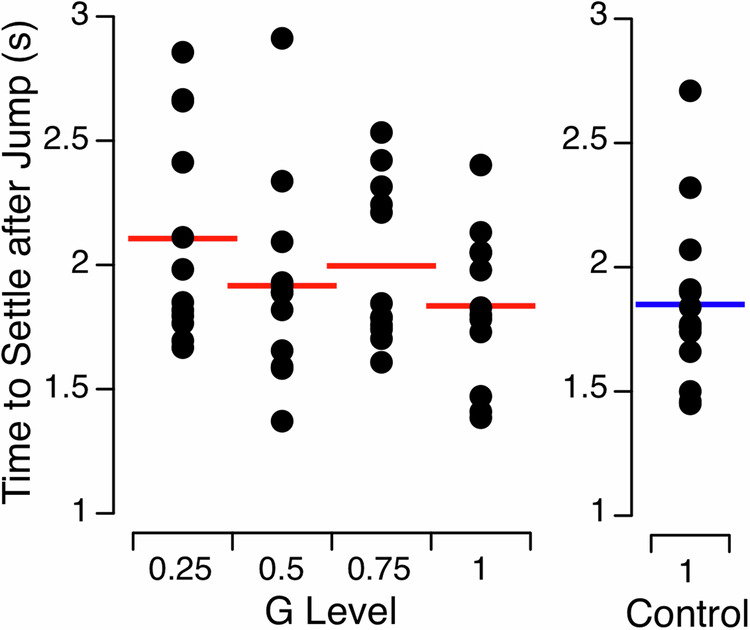
Time to settle after jumping from a 30-cm platform. Individual data and mean (red bar) of 12 subjects at 0.25×g, 0.50×g, 0.75×g, and 1.0×g in the aircraft; individual data and mean (blue bar) of 14 subjects at 1×g in the laboratory.
Limits of stability
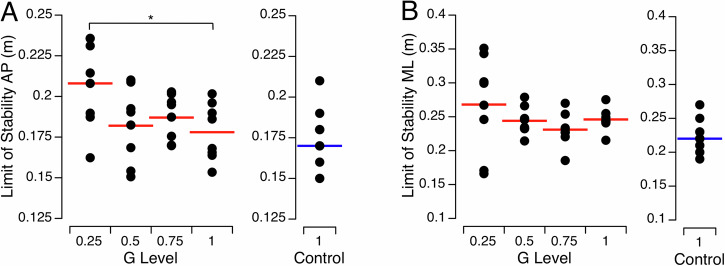
During the limits of the stability test, encompassing all participants, a total of 22 falls occurred at 0.25×g, 12 falls at 0.5×g, 5 falls at 0.75×g, 6 falls at 1×g in the aircraft, and two falls at 1×g in the laboratory. Four subjects were unable to finish the tests at 0.25×g due to falls, resulting in a complete data set being collected from only eight subjects during the flights. The limits of stability in the antero-posterior direction were not significantly different for the subjects tested at 1×g in the laboratory and for those tested at 1×g in the aircraft (t-test, p = 0.676); however, there were significant differences in limits of stability in the medial–lateral directions (p < 0.001) (Fig. 8). Repeated measures ANOVA indicated a significant effect of gravity level on the limits of stability in the antero-posterior direction [F(3,31) = 3.286, p = 0.035] but not in the medial-lateral direction [F(3,31) = 1.207, p = 0.325]. Post hoc Bonferroni tests indicated that the limits of stability in the antero-posterior direction were significantly greater at 0.25×g than at 1×g (p = 0.023).
Fig. 8. Limits of stability.
Amplitude of displacement of the body center of gravity in the anterior–posterior (AP) (A) and the medial–lateral (ML) directions (B). Individual data and mean (red bar) of 8 subjects at 0.25×g, 0.50×g, 0.75×g, and 1.0×g in the aircraft; individual data and mean (blue bar) of 14 subjects at 1×g in the laboratory. *p < 0.05 (Bonferroni test adjusted for multiple comparisons).
Discussion
Our results indicate that the capability to perform functional activities such as settling after standing and walking around obstacles, which will be critical during emergency situations during exploration spaceflight, is altered by partial gravity levels. When the gravity level decreased below 1×g, postural instability increased and it took more time to stand up, settle, walk, and turn around obstacles. The number of falls was also much higher at lower gravity levels after jumping and during the limits of the stability test. However, the limits of stability in the medial-lateral direction and the time required to settle after jumping down were not significantly affected by partial gravity. It is possible that these latter tests were not sensitive enough to detect any significant changes, and/or the movement of the aircraft affected the measures from the force plate.
Gravity is crucial for walking. Research into gait strategies in low-gravity settings has gained prominence with the resurgence of planned crewed missions to the Moon and Mars. Although Apollo mission astronauts reported they used alternative locomotion strategies on the Moon17, studies involving computational simulations and experiments have predominantly focused on studying walking or running, the primary locomotion modes suited for Earth’s gravity.
While walking on Earth, the body uses gravity to facilitate a “falling forward” motion with each step, and the resulting forward momentum is used to restore the initial posture through a pendulum-like mechanism. However, in partial gravity environments, such as the Moon or Mars, the mechanics of walking become less optimal. Previous studies have used parabolic flight, whole-body suspension techniques (simulating lunar and Martian gravity by supporting 84% or 62%, respectively, of a runner’s weight in a sling), and theoretical models to investigate locomotion in partial gravity. These studies have shown that both mechanics and energetics change during lunar and Martian locomotion. Although some locomotor parameters can be non-linear as a function of the gravity reduction, walking speeds are ~30% lower at simulated lunar and Martian gravity than at 1×g, and transitioning from a walk is 25% slower. Peak vertical forces are reduced by as much as 50% at these gravity levels, and although ground contact time during locomotion remains the same as at 1×g, stride length and stride time increase18–22.
On Earth, the speed of a comfortable gait is significantly influenced by the pendulum frequency or period of the swinging motion of a human leg, determined by factors like leg length, mass distribution, and, notably, acceleration due to gravity. When walking, the pendulum motion swings the leg from behind the body to ahead of the body, and minimal energy is required to achieve this movement. However, when the usual walking speed is accelerated, the legs move faster than the pendulum rate, and the muscles need more energy to maintain that pace. Models predict that the natural oscillation period of a pendulum is proportional to the inverse square root of gravitational acceleration. Consequently, this pendulum period at 0.25×g would be roughly 2.5 times longer, resulting in a slower walking pace.
Our findings reveal that the time taken to complete the obstacle course increased as the gravity level decreased. According to Lacquaniti et al.23, this could be attributed to significantly lower friction forces at lower gravity than 1×g. On Earth, humans typically experience a considerable weight, about a force of 800 N, which enables us to exert a robust sideways force when our feet contact the ground. However, at 0.25×g, the downward force reduces to only 200 N while our inertia remains similar to that on Earth. Consequently, it becomes challenging to swiftly halt or alter direction, and locomotion requires careful advance planning, especially when navigating obstacles.
During the rotation around the cone, the yaw angular velocities of both the trunk and head decreased as the g level decreased, suggesting that head and truck coordination in yaw was maintained and that subject’s overall upper body rotation speed decreased at lower g levels. An increase in upward head pitch was also observed while exiting the turn as the g level decreased. At lower g levels, subjects might have adjusted their gaze to the obstacle or chair, divergent from the strategy observed in the other gravitational levels where the cone or floor was the focal point. The upward head pitch at 0.25×g may demonstrate a proactive strategy aimed at pre-planning functional movements leading into the obstacle stepover, the subtask following the cone turn. However, the observed head pitch of the subjects during the seat egress and walk task may have been influenced by the aircraft motion during the parabolic maneuver rather than solely reflecting the subjects’ natural movements.
The results of our jump-down test indicate crewmembers’ capacity to execute jumps from landing vehicles, habitats, and while navigating uneven terrain during exploratory tasks. After spaceflight, astronauts have degraded performance on the jump-down test, which has been attributed to an altered central interpretation of otolith acceleration cues and changes in vestibulospinal and somatosensory spinal reflexes5,24,25. The duration of exposure to partial gravity during parabolic flight is likely insufficient to trigger motor reprogramming, which could explain the lack of altered settling time observed after jumping down across different gravity levels.
Degradation in the control of posture was observed in partial gravity, as shown by the longer time required to settle after standing from a prone position and the mean duration of standing during the tandem stance test. These alterations are presumably the result of a combination of reduced somatosensory and vestibular inputs. For example, in partial gravity levels, there are reductions in roll tilt perception26, kinesthetic awareness27, and postural reflexes17. These results also point to the importance of proprioceptive and skin receptor feedback28 and vestibular threshold cues29 in maintaining balance control. This may also explain the increased number of falls (i.e., recovery steps) during the limits of stability and jump-down tests. Partial gravity presents a biomechanical advantage in the amount of torque required to move the center of mass around the base of support. However, the increased number of falls in partial gravity suggests that this increased range of motion during leaning and landing may be more difficult to control due to altered somatosensory and vestibular feedback.
Our study’s findings reveal that partial gravity significantly impacts the execution of maneuvers that require greater reliance on balance control, such as tandem stance, seat egress and walk, and recovery from potential falls. Similar declines in maneuvers demanding high dynamic control of postural equilibrium are also evident in astronauts immediately after their return from space3. Therefore, it can be inferred that the decreases in postural control that astronauts will experience upon landing on the Moon or Mars may surpass those observed in our study. Consequently, in-flight countermeasures targeting vestibular and proprioceptive systems will be crucial to sustain crewmembers’ balance function, enabling them to successfully execute critical mission tasks30.
The test of recovery from falls not only assessed physical performance but also assessed the cardiovascular system through continuous monitoring of heart rate. Previous data obtained from astronauts after they returned from prolonged missions indicated that signs of presyncope in orthostatically intolerant astronauts may occur during a passive head-up tilt test conducted within minutes after landing31. Heart rate increases as a compensatory response to maintain blood pressure when standing on Earth. When the gravity level decreased in our study, subjects’ control of postural equilibrium was reduced after they changed postural orientation, and this also induced an orthostatic challenge. Our results show that the cardiovascular system was less challenged in partial gravity because subjects showed significantly smaller increases in heart rate during the prone-to-stand change in postural orientation.
A limitation of this study is that the duration required to stand and stabilize at 1×g on board the aircraft was longer than the duration required at 1×g in the laboratory. This delay is likely due to the vibrations encountered during the flight and the slight upward pitch of the airplane’s nose to sustain the requisite lift for flight. In addition, the parabolic flight group was, on average, slightly older than the laboratory control group, which may have affected balance performances. Nonetheless, this observation suggests that the performance declines recorded in this study might be greater than declines on a stable planetary surface with partial gravity.
Experiments with rodents in space using spacecraft centrifuges demonstrated that animal behaviors in gravity levels above 0.28×g were similar to those at 1×g, whereas changes in behaviors that occur at 0.28×g and below were similar to behaviors at zero-gravity32. Regarding humans, Paloski et al.33 discussed the anticipated perceptual and physiological changes associated with exposure to the Moon (0.16×g) and Mars (0.38×g) gravity levels. Despite anecdotal reports of perceptual and balance disturbances in lunar gravity, few controlled experiments have explored the impact of partial gravity on human self-orientation and perception. For example, Apollo astronauts noticed a slight unsteadiness upon landing on the lunar surface34. After Apollo 14 landed on a 7° incline, the crew found the tilt “highly unsettling” despite not perceiving it while they were in the cockpit34. Similarly, when using the Apollo 16 Lunar Rover on a potentially 20° incline, the crew did not sense that they were ascending a steep slope despite an inclinometer detachment35.
A previous study of various gravitational conditions induced during parabolic flight observed distinct responses in participants’ alignment of their subjective vertical with the gravitational vertical. In normal gravity, hypergravity, and Martian gravity, individuals accurately aligned their subjective vertical with the gravitational vertical while in darkness. However, in lunar gravity and microgravity, they aligned their subjective vertical with their body’s longitudinal axis36. This finding was corroborated by Harris et al.37 and Ferrè et al.38. A recent investigation determined that individuals experiencing partial gravity levels (0.25×g, 0.5×g, or 0.75×g) tended to underestimate self-tilt during static whole-body roll tilt that ranged from 5° to 60°, especially in darkness39. This underestimation escalated as the gravity level decreased, aligning with Mittelstaedt’s model suggesting this discrepancy (known as the Aubert effect) arises from a compromise between perceived gravity direction and the idiotropic vector9. Additionally, Dyde et al.40 observed that in microgravity and in lunar gravity, individuals accorded less significance to visual cues than they did in normal gravity when these cues were present.
Although gravity-level dose–response curves have been established for certain biochemical systems in animals41, most human physiological systems lack these defined dose–response relationships42. Our study compared the results of five functional assessments performed at various gravity levels: 0.25×g, 0.5×g, 0.75×g, and 1×g. The performance on these functional tests was compared with results of performance gathered previously from subjects experiencing axial body unloading on Earth6 and from astronauts immediately after they returned from spaceflight3,5. This comparative analysis helps determine the extent of deficits in functional performance under partial gravity conditions. Establishing the correlation between gravity level and the extent of decline in performance will assist in determining the gravity threshold for these functional activities.
A notable finding from this study is that performance measurements at 0.75×g are comparable to those in 1×g for most tests, except for completing the obstacle course and the angular velocity before sitting, which individuals completed faster in 0.75×g than in 1×g. Suggestions have been made that a rotating spacecraft providing artificial gravity might provide a countermeasure against the physiological effects of weightlessness during prolonged exploration missions42. However, the minimum gravity threshold necessary to sustain subject performance has yet to be determined43. Our results show that the execution of critical mission activities remains unimpaired at 0.75×g. A 25% reduction in artificial gravity amplitude (0.75×g vs. 1×g) would notably decrease the required rotation rate (or radius) of a rotating spacecraft.
Our chosen functional tests replicate essential maneuvers that crewmembers will need to undertake upon landing on a celestial body with partial gravity. Some of the tests presented here are identical to those conducted on ISS crewmembers immediately upon their return to Earth after durations of spaceflight spanning several weeks to a year4. These tests are part of NASA’s Spaceflight Standard Measures initiative. NASA’s Human Research Program selected these measures because they are relevant for determining risks to human health and performance during space missions, and the results of these tests will help address these risks. Insights gleaned from these tests enable space agencies to gauge the risk associated with various levels of partial gravity and will help facilitate a more effective and comprehensive strategy to implement countermeasures and maintain crew performance during exploratory missions.
Prolonged exposure to microgravity followed by partial gravity on celestial bodies like the Moon or Mars poses significant risks to astronauts. These include difficulties in standing, walking, and moving effectively, which increase the risk of falls and injuries. This is due to both the transition from microgravity and the exposure to a novel partial gravity environment. Astronauts may also experience disorientation, dizziness, and postflight entry motion sickness. Microgravity can impair motor control and cognitive functions, leading to slower reaction times that could jeopardize safety during emergencies. Preflight and inflight countermeasures should focus on operational training, sensorimotor adaptability training, and maintaining muscular and proprioceptive functions30,44. Post-landing countermeasures should focus on sensory augmentation technologies, gradual re-adaptation through physical therapy and strength training, vestibular rehabilitation techniques, habitat design improvements with support structures, and continuous health monitoring using wearable sensors to promptly address any health issues45.
Methods
Participants
Twelve healthy individuals (six males, six females; age M = 40.2, SD = 8.5 years) participated in the parabolic flight study. All subjects passed a medical examination and had no known history of vestibular or oculomotor abnormalities. Fourteen other healthy subjects (six females, eight males; age M = 29.4, SD = 7.8 years) participated in a control study in the laboratory.
The test procedures were approved by the NASA Johnson Space Center Institutional Review Board and by the Comité de Protection des Personnes Nord Ouest II (Avis no. 22.04602.000171). Tests were performed in accordance with the ethical standards laid down in the latest Declaration of Helsinki for human research. All subjects provided written informed consent before participating in the study. The subjects also provided informed consent to publish identifying information and images in an online open-access publication.
Parabolic flight
This investigation took place during three flights on Novespace’s Airbus A-310 Zero G consisting of 31 parabolas each. These flights were designed to induce three levels of partial gravity. Each flight involved 10 parabolas at 0.25×g, 10 at 0.5×g, and 10 at 0.75×g, with the sequence of gravity levels differing each day. The duration of these parabolas was ~30 s at 0.25×g, 40 s at 0.5×g, and 50 s at 0.75×g, and the pull-up (at 1.8×g) and pull-out phases (at 1.8×g) before and after each parabola lasted 20 s each.
Every study participant was tested during 10 parabolas at 0.25×g, 0.5×g, and 0.75×g. Additionally, each subject completed all tests in a 1×g environment during the flight intervals between parabolas, when the aircraft maintained straight and level flight.
Each of the functional assessments was conducted within the 30–50 s duration of a parabola. The seat egress and walk test and the recovery from potential fall test were each performed twice during two parabolas at each gravity level. The tandem stance test was conducted during four parabolas at each gravity level: two parabolas with eyes open and two parabolas with eyes closed. The jump down and limits of stability tests were conducted during one parabola each. The sequence of the tests was varied for each participant.
All the test subjects had participated in a prior parabolic flight, and none reported motion sickness during their first flight. Five individuals opted to use a prophylactic intramuscular injection of scopolamine (0.4–0.7 mg) to alleviate motion sickness. Because anti-motion sickness drugs act as vestibular suppressants and can, therefore, influence task performance, assessments were also conducted at normal gravity (1×g) on board the aircraft. This also helped control the effects of aircraft turbulence. However, tests at 1×g were not conducted while the aircraft was on the runway due to the tilt of the plane’s floor, which could affect the accuracy of our balance evaluations. Instead, another set of participants of similar age requirements were tested in a laboratory setting at 1×g. Similar hardware and software to those used in the parabolic flight study were employed for consistency.
Experimental protocol
Video recordings of every trial for all tests were captured using GoPro cameras worn by the test operators and securely attached to the aircraft rails. These recordings were analyzed later. Triaxial inertial measurement units (IMU; Opal, APDM, Portland, OR) were positioned using elastic straps on the subject’s forehead and torso (roughly aligned with the 7th cervical vertebra) to capture head and torso movements at a sampling rate of 128 Hz. These data were processed using a low-pass filter. Additionally, an ambulatory heart rate monitor (Polar RS800CX, Polar Electro Oy, Kempele, Finland) was used during the recovery from the potential fall test.
Tandem stance
This test is a conventional assessment of static postural stability46. Participants were directed to stand heel-to-toe in an upright position on a 4.5 cm wide rail with their arms crossed over their chest. This assessment was conducted with eyes open and eyes closed. Postural stability was defined as the maximum duration the participants maintained this stance before stepping off the rail or uncrossing their arms to grab support straps. Subjects were tested at each gravity level during two parabolas with their eyes closed and two parabolas with their eyes open, in random order. All tests began after a period of about 3–5 s in partial gravity.
Seat egress and walk
This test evaluates the capability to stand up from a seated position and assesses mobility while navigating around obstacles. Participants were instructed to swiftly rise from a seated position without using their hands and to walk quickly and safely in a straight line toward a cone four meters away. They were instructed to circumvent the cone, return to the initial position, and resume their seated position in the chair. While walking to and from the cone, individuals had to step over a 30 cm tall obstacle. At least two trials were conducted per parabola. Assessment of performance in this test included the overall time taken to complete the course and the time to complete each section of the course (walk to the cone, turn around the cone, walk back to the seat, and turn before sitting). The angular velocities of the head and trunk while navigating around the cone and before sitting were calculated based on the time required for a rotation of 180° in the filtered IMU yaw data. The threshold for the start of a turn was defined as a point five SD above the trunk IMU yaw during walking3. In addition, the change in head position in pitch, represented in the global reference frame and estimated using a sensor fusion algorithm, was quantified over the duration of the turn. At the onset of the turn, an initial head pitch position was established as the neutral orientation and rectified to zero degrees. The measured variation in head pitch angle quantified the extent of deviation from the initial neutral position established at the start of the turn. A positive change in degrees denoted a downward head pitch towards the base of the plane, while a negative change indicated an upward tilt of the head toward the ceiling of the plane upon exiting the turn.
Jump down
This test assesses how quickly the postural control system can recover from a jump-induced perturbation. Participants jumped from a 30 cm elevation onto a force plate (Bertec, Columbus, OH) that recorded the ground reaction forces (GRF) upon landing. Force plate data were sampled at 500 Hz. After landing, participants were directed to maintain a stationary standing posture on the force plate, with their arms by their sides, for 5 s. At least two trials were conducted per parabola. Quiet stance was defined using trunk angular acceleration during the 4th–9th seconds of standing. The postural settling time, i.e., the time required to maintain equilibrium, was defined as the time between the touchdown and the first instance when the GRF was within 3 SD of the quiet stance GRF for a minimum of 0.5 s3. This calculation was used even if a fall was noted, i.e., if the participant took any steps, lifted their heels or toes, or waved their arms to maintain balance.
Recovery from fall
This test assesses sustained postural control after transitioning from a prone to a standing position. A diminished capability to rise from a prone position is a significant and independent risk factor linked with severe injuries resulting from falls47. During this test, participants began in a prone position and, following a signal from the operator (10 s after the parabola began), swiftly stood up and tried to sustain a stable standing posture and to maintain this position for ten seconds. The time required to stand was calculated as the time elapsed between the operator’s signal and the first instance where the IMU of the trunk’s angular velocity was below 20°/s. The time to settle was calculated as the time elapsed between the operator’s signal and the first instance where the trunk’s angular acceleration reached quiet stance, defined using trunk angular acceleration during the 4th–9th seconds of standing. This test also triggered an orthostatic challenge, so heart rate was monitored throughout. This cardiovascular data can be used to identify potential signs of orthostatic intolerance during this dynamic head-up tilt. One trial was conducted per parabola.
Limits of stability
This test measures an individual’s capability of intentionally shifting their center of gravity towards their stability boundaries without losing balance. This procedure yields insights into voluntary motor control and can help assess the risk of falling48. After 5 s of standing on the force plate, participants were instructed to lean in four directions (forward, backward, right, and left) to their maximum extent without taking any steps, lifting their heels or toes, or uncrossing their arms. One trial was conducted per parabola. If any of the above rules were broken, the trial was repeated. Maximum displacement of the center of pressure (mm) was calculated in the anterior-posterior and medial–lateral directions. This assessment measured alterations in the limits of stability across different gravity levels.
Statistical analysis
The following number of trials were averaged for each test at each gravity level: four trials for tandem stance, two trials for seat egress and walk, two trials for jump down, two trials for recovery from fall, and one trial for limit of stability.
A Shapiro–Wilk test determined that the variables were normally distributed. A two-sample (Welch) t-test (two-tailed) was used to compare performance for all test outcome parameters at 1×g on the ground and performance at 1×g during a straight and level flight between parabolas. Repeated measures analysis of variance (ANOVA) and post hoc Bonferroni adjusted for multiple comparisons were used to detect significant differences between performance during each test across the four gravity levels during the flight (0.25×g, 0.5×g, 0.75×g, and 1×g). The statistical analysis was conducted in R49.
Acknowledgements
The authors thank NASA’s Research Operations and Integration personnel, Novespace personnel, and Neil Melville for implementing the experiment in the Airbus A-310 Zero-G and recruiting the participants. The authors also thank Kerry George for editing the manuscript. This study was funded by the Human Health and Countermeasures Element of NASA’s Human Research Program (grant # 14176).
Author contributions
G.C., T.R.M., A.B., H.W., and S.J.W. contributed to the study design, data collection, data analysis, and manuscript.
Data availability
Data will be made available on reasonable request.
Competing interests
The authors declare no competing interests.
Footnotes
Publisher’s note Springer Nature remains neutral with regard to jurisdictional claims in published maps and institutional affiliations.
References
- 1.Richter, C., Braunstein, B., Winnard, A., Nasser, M. & Weber, T. Human biomechanical and cardiopulmonary responses to partial gravity—a systematic review. Front. Physiol.8, 583 (2017). 10.3389/fphys.2017.00583 [DOI] [PMC free article] [PubMed] [Google Scholar]
- 2.Clément, G. & Reschke, M. F. Neuroscience in Space (Springer, New York, NY, 2008).
- 3.Miller, C. A., Kofman, I. S., Brady, R. R. & May-Phillips, T. R. Functional task and balance performance in bed rests subjects and astronauts. Aerosp. Med. Hum. Perf.89, 806–815 (2018). [DOI] [PubMed] [Google Scholar]
- 4.Clément, G., Moudy, S., Macaulay, T. R., Bishop, M. & Wood, S. J. Mission-critical tasks for assessing risks from vestibular and sensorimotor adaptation during space exploration. Front. Physiol.13, 1029161 (2022). 10.3389/fphys.2022.1029161 [DOI] [PMC free article] [PubMed] [Google Scholar]
- 5.Mulavara, A. P., Peters, B. T., Miller, C. A. & Kofman, I. S. Physiological and functional alterations after spaceflight and bed rest. Med. Sci. Sports Exerc.50, 1961–1980 (2018). 10.1249/MSS.0000000000001615 [DOI] [PMC free article] [PubMed] [Google Scholar]
- 6.Rosenberg, M. J., Koslovsky, M., Noyes, M., Reschke, M. F. & Clément, G. Tandem walking in simulated Martian gravity and visual environment. Brain Sci.12, 1268 (2022). 10.3390/brainsci12101268 [DOI] [PMC free article] [PubMed] [Google Scholar]
- 7.Berthoz, A. & Pozzo, T. Intermittent head stabilization during postural and locomotory tasks in humans. In Posture and Gait: Development, Adaptation and Modulation (eds Amblard, B., Berthoz, A. & Clarac, F.) 189–198 (Elsevier, Amsterdam, 1988).
- 8.Guedry, F. E. Perception of motion and position relative to the earth. Overv. Ann. N. Y. Acad. Sci.656, 315–328 (1992). 10.1111/j.1749-6632.1992.tb25218.x [DOI] [PubMed] [Google Scholar]
- 9.Mittelstaedt, H. The subjective vertical as a function of visual and extraretinal cues. Acta Psychol.63, 63–85 (1986). 10.1016/0001-6918(86)90043-0 [DOI] [PubMed] [Google Scholar]
- 10.Guedry, F. E. Psychophysics of vestibular sensation. In Vestibular SystemPart 2: Psychophysics, Applied Aspects and General Interpretations (ed. Kornhuber, H. H.) 3–154 (Springer, Berlin, Heidelberg, 1974).
- 11.Gundry, A. J. Thresholds of perception for periodic linear motion. Aviat. Space Environ. Med.49, 679–686 (1978). [PubMed] [Google Scholar]
- 12.Arrott, A. P., Young, L. R. & Merfeld, D. M. Perception of linear acceleration in weightlessness. Aviat. Space Environ. Med.61, 319–326 (1990). [PubMed] [Google Scholar]
- 13.Diaz-Artiles, A. & Karmali, F. Vestibular precision at the level of perception, eye movements, posture, and neurons. Neuroscience468, 282–320 (2021). 10.1016/j.neuroscience.2021.05.028 [DOI] [PMC free article] [PubMed] [Google Scholar]
- 14.Fitzpatrick, R. & McCloskey, D. I. Proprioceptive, visual and vestibular thresholds for the perception of sway during standing in humans. J. Physiol.478, 173–186 (1994). 10.1113/jphysiol.1994.sp020240 [DOI] [PMC free article] [PubMed] [Google Scholar]
- 15.Horak, F. B. (2006) Postural orientation and equilibrium: what do we need to know about neural control of balance to prevent falls? Age Ageing35, 7–11 (2006). 10.1093/ageing/afl077 [DOI] [PubMed] [Google Scholar]
- 16.Juras, G., Słomka, K., Fredyk, A., Sobota, G. & Bacik, B. Evaluation of the limits of stability (LOS) balance test. J. Hum. Kinet.19, 39–52 (2008). 10.2478/v10078-008-0003-0 [DOI] [Google Scholar]
- 17.Scheuring, R. A., Jones, J. A. & Polk, J. D. The Apollo Medical Operations Project: Recommendations to Improve Crew Health and Performance for Future Exploration Missions and Lunar Surface Operations NASA TM-2007-214755 (NASA, Houston, 2007).
- 18.Newman, D. J., Alexander, H. L. & Webbon, B. W. Energetics and mechanics for partial gravity locomotion. Aviat. Space Environ. Med.65, 815–823 (1994). [PubMed] [Google Scholar]
- 19.Donelan, J. M. & Kram, R. The effect of partial gravity on the kinematics of human walking: a test of the dynamic similarity hypothesis for locomotion. J. Exp. Biol.200, 3193–3201 (1997). 10.1242/jeb.200.24.3193 [DOI] [PubMed] [Google Scholar]
- 20.Cavagna, G., Willems, P. & Heglund, N. Walking on Mars. Nature393, 636 (1998). 10.1038/31374 [DOI] [PubMed] [Google Scholar]
- 21.Hawkey, A. Small step or giant leap? Human locomotion on Mars. J. Br. Interplanet. Soc.57, 262–270 (2004). [PubMed] [Google Scholar]
- 22.Clark, T. K., Newman, M. C., Oman, C. M., Merfeld, D. M. & Young, L. R. Modeling human perception of orientation in altered gravity. Front. Syst. Neurosci.9, 68 (2015). 10.3389/fnsys.2015.00068 [DOI] [PMC free article] [PubMed] [Google Scholar]
- 23.Lacquaniti, F. et al. Human locomotion in hypogravity: from basic research to clinical applications. Front. Physiol.8, 893 (2017). 10.3389/fphys.2017.00893 [DOI] [PMC free article] [PubMed] [Google Scholar]
- 24.Reschke, M. F., Anderson, D. J. & Homick, J. L. Vestibulospinal reflexes as a function of microgravity. Science225, 212–214 (1984). 10.1126/science.6729475 [DOI] [PubMed] [Google Scholar]
- 25.Newman, D. J., Jackson, D. K. & Bloomberg, J. J. Altered astronaut lower limb and mass center kinematics in downward jumping following space flight. Exp. Brain Res.117, 30–42 (1997). 10.1007/PL00005788 [DOI] [PubMed] [Google Scholar]
- 26.Meskers, A. J., Houben, M. M., Pennings, H. J., Clément, G. & Groen, E. L. Underestimation of self-tilt increases in partial gravity conditions. J. Vestib. Res.31, 345–352 (2021). 10.3233/VES-201512 [DOI] [PubMed] [Google Scholar]
- 27.Weber, B. & Proske, U. Limb position sense and sensorimotor performance under conditions of weightlessness. Life Sci. Space Res.32, 63–69 (2022). 10.1016/j.lssr.2021.11.003 [DOI] [PubMed] [Google Scholar]
- 28.Lowrey, C. R. et al. Selective skin sensitivity changes and sensory reweighting following short-duration space flight. J. Appl. Physiol.116, 683–692 (2014). 10.1152/japplphysiol.01200.2013 [DOI] [PubMed] [Google Scholar]
- 29.Karmali, F., Bermúdez Rey, M. C., Clark, T. K., Wang, W. & Merfeld, D. M. Multivariate analyses of balance test performance, vestibular thresholds, and age. Front. Neurol.8, 578 (2017). 10.3389/fneur.2017.00578 [DOI] [PMC free article] [PubMed] [Google Scholar]
- 30.Macaulay, T. R. et al. Developing proprioceptive countermeasures to mitigate postural and locomotor control deficits after long-duration spaceflight. Front. Syst. Neurosci.15, 658985 (2021). 10.3389/fnsys.2021.658985 [DOI] [PMC free article] [PubMed] [Google Scholar]
- 31.Lee, S. M. C., Feiveson, A. H., Stein, S., Stenger, M. B. & Platts, S. H. Orthostatic intolerance after ISS and space shuttle missions. Aerosp. Med. Hum. Perform.86, A54–A67 (2015). 10.3357/AMHP.EC08.2015 [DOI] [PubMed] [Google Scholar]
- 32.Shipov, A. A. Artificial gravity. In: Space Biology and Medicine Vol. 3, Book 2 (eds Nicogossian, A., Mohler, S. R., Gazenko, O. G. & Grigoriev, A. I.) 349–363 (AIAA and Nauka Press, Moscow, 1977).
- 33.Paloski, W. H., Oman, C. M., Bloomberg, J. J. & Reschke, M. F. Risk of sensory-motor performance failures affecting vehicle control during space missions: a review of the evidence. J. Gravit. Physiol.15, 1–29 (2008). [Google Scholar]
- 34.Godwin, R. Apollo 14. The NASA Mission Reports (Apogee Books, Burlington, ON, 2000).
- 35.Godwin, R. Apollo 16. The NASA Mission Reports Vol. 1 (Apogee Books, Burlington, ON, 2002).
- 36.De Winkel, K. N., Clément, G., Groen, E. L. & Werkhoven, P. J. The perception of verticality in lunar and Martian gravity conditions. Neurosci. Lett.529, 7–11 (2012). 10.1016/j.neulet.2012.09.026 [DOI] [PubMed] [Google Scholar]
- 37.Harris, L. R., Jenkin, M. R. & Dyde, R. T. The perception of upright under lunar gravity. J. Gravit. Physiol.19, 9–16 (2012). [Google Scholar]
- 38.Ferrè, E. R., Frett, T., Haggard, P. & Longo, M. R. A gravitational contribution to perceived body weight. Sci. Rep.9, 11448 (2019). 10.1038/s41598-019-47663-x [DOI] [PMC free article] [PubMed] [Google Scholar]
- 39.Groen, E. et al. Human perception of verticality in partial gravity conditions. In Proc. 90th Annual Meeting of the Aerospace Medical Association (AsMA), Las Vegas, NV, May 2019.
- 40.Dyde, R. T., Jenkin, M. R., Jenkin, H. L., Zacher, J. E. & Harris, L. R. The effect of altered gravity states on the perception of orientation. Exp. Brain Res.194, 647–660 (2009). 10.1007/s00221-009-1741-5 [DOI] [PubMed] [Google Scholar]
- 41.Wade, C. E. Responses across the gravity continuum: Hypergravity to microgravity. In Advances in Space Biology and Medicine, Vol. 10. Experimentation with Animal Models in Space (ed Sonnenfeld, G.) 225–245 (Elsevier, Binghamton, 2005). [DOI] [PubMed]
- 42.Clément, G & Bukley, A. P. Artificial Gravity. (Springer: New York, NY), 2007.
- 43.Clément, G. International roadmap for artificial gravity research. NPJ Microgravity3, 29 (2017). 10.1038/s41526-017-0034-8 [DOI] [PMC free article] [PubMed] [Google Scholar]
- 44.Bloomberg, J. J., Peters, B. T., Cohen, H. S. & Mulavara, A. P. Enhancing astronaut performance using sensorimotor adaptability training. Front. Syst. Neurosci.9, 129 (2015). 10.3389/fnsys.2015.00129 [DOI] [PMC free article] [PubMed] [Google Scholar]
- 45.De Martino, E., Green, D. A., Ciampi de Andrade, D., Weber, T. & Herssens, N. Human movement in simulated hypogravity—bridging the gap between space research and terrestrial rehabilitation. Front. Neurol.14, 1062349 (2023). 10.3389/fneur.2023.1062349 [DOI] [PMC free article] [PubMed] [Google Scholar]
- 46.Fregly, A. R., Graybiel, A. & Smith, M. J. Walk on floor eyes closed (WOFEC): a new addition to an ataxia test battery. Aerosp. Med.43, 395–399 (1972). [PubMed] [Google Scholar]
- 47.Bergland, A. & Wyller, T. B. Risk factors for serious fall related injury in elderly women living at home. Inj. Prev. J. Int. Soc.10, 308–313 (2004). 10.1136/ip.2003.004721 [DOI] [PMC free article] [PubMed] [Google Scholar]
- 48.Clark, S. & Rose, D. J. Evaluation of dynamic balance among community-dwelling older adult fallers: a generalizability study of the limits of stability test. Arch. Phys. Med. Rehabil.82, 468–474 (2001). 10.1053/apmr.2001.21859 [DOI] [PubMed] [Google Scholar]
- 49.R Core Team. R: A Language and Environment for Statistical Computing (R Foundation for Statistical Computing, Vienna, Austria, 2022).
Associated Data
This section collects any data citations, data availability statements, or supplementary materials included in this article.
Data Availability Statement
Data will be made available on reasonable request.


