Abstract
Glycyl-tRNA synthetase (GARS1) is differentially expressed across cancers. In this study, the value of GARS1 in the diagnosis and prognosis of various cancers was comprehensively evaluated by multiple omics integrative pan-cancer analysis and experimental verification. Through Kaplan–Meier, ROC and multiple databases, we explored GARS1 expression and prognostic and diagnostic patterns across cancers. The GARS1 relative reaction network was identified in PPI, GO, KEGG, methylation models and the genetic mutation atlas. Further research on the GARS1 value in bladder urothelial carcinoma (BLCA) was conducted by regression and nomogram models. We further analyzed the correlation between GARS1 and immune markers and cells in BLCA. Finally, in vitro experiments were used to validate GARS1 the oncogenic function of GARS1 in BLCA. We found that GARS1 was highly expressed across cancers, especially in BLCA. GARS1 expression was correlated with poor survival and had high diagnostic value in most tumor types. GARS1 is significantly associated with tRNA-related pathways whose mutation sites are mainly located on tRNA synthetase. In addition, Upregulation of GARS1 was connected with immune cell infiltration and five key MMR genes. M2 macrophages, TAMs, Th1 and T-cell exhaustion, and marker sets associated with GARS1 expression indicated specific immune infiltration in BLCA. Finally, in vitro experiments validated that GARS1 expression promotes BLCA cell proliferation and metastasis and inhibits apoptosis. Overall, GARS1 can be a novel prognostic and immunological biomarker through multiple omics integrative pan-cancer analysis. The expression of GARS1 in BLCA was positively correlated with specific immune infiltration, indicating that GARS1 might be related to the tumor immune microenvironment.
Keywords: GARS1, Pan-cancer, Bladder cancer, Multiple omics, Immune infiltration
Subject terms: Cancer, Immunology, Urology
Introduction
Cancer remains the leading cause of death worldwide, highlighting the urgent need for prognostic biomarkers to guide treatment decisions1. Platinum-based chemotherapy is the standard regimen for bladder cancer; however, approximately 50% of patients are not suitable candidates due to various issues, including renal insufficiency, complications, age, and poor physical condition2. Immune checkpoint inhibitors (ICIs) have been approved as a first-line treatment for PD-L1-positive metastatic bladder urothelial cancer (mBLCA) in patients who cannot tolerate cisplatin, as well as for use as a second-line therapy following progression after cisplatin treatment3. Despite bladder cancer being a highly immunogenic tumor, only a subset of mBLCA patients benefit from ICI therapy. The underlying mechanisms for this variability in response to ICI treatment remain poorly understood4. Additionally, immune-related adverse events, such as liver function impairment, can adversely affect treatment outcomes5,6. Currently, many clinicians rely on biomarkers of immunotherapy response, such as PD-L1 expression in specific malignant tumors, to predict treatment efficacy7. However, due to the heterogeneity of PD-L1 expression and the lack of standardized detection methods, the predictive value of PD-L1 positivity in mBLCA patients is considered unreliable8. Recent research suggests that serum albumin levels may serve as a prognostic biomarker for patients with advanced cancer undergoing ICI treatment9. In 2019, the Bladder Cancer Molecular Taxonomy Group10 classified bladder cancer into six subtypes: luminal papillary (24%), luminal nonspecified (8%), luminal unstable (15%), stroma-rich (15%), basal/squamous (35%), and neuroendocrine-like (3%). This classification requires further clinical validation. Therefore, there is an urgent need to identify significant and effective biomarkers to predict immune efficacy in mBLCA patients.
Aminoacyl-tRNA synthetases (ARSs) are an ancient family of 20 important enzymes. In the process of protein synthesis, ARSs link tRNAs to corresponding amino acids11,12. ARSs play essential roles in various cells, and catalyze the tRNA substrate aminoacylation in a two-step reaction. The first step is to juxtapose ATP, amino acids, and tRNAs. Then, ARSs produce aminoacylate tRNAs for protein synthesis through the ribosome13–15. Glycyl-tRNA synthetase (GARS1) belongs to the class II type, which is characterized by three conserved signature motifs, and unlike other ARSs, the quaternary structure of GARS1 is not phylogenetically conserved16,17. In recent years, increasing evidence has indicated that the multiple functions of Ars are controlled by complex mechanisms to respond to different cellular stimuli as translational components and important factors in controlling rapidly emerging tumorigenesis18,19. GARS1, as an ancient enzyme, may provide new insights into the cancer process and has become a potential therapeutic target20. However, the possible roles and function of GARS1 in tumor types have not been reported before.
The tumor microenvironment (TME) has different types of cells, including immune cells, stromal cells, cancer-associated fibroblasts and endothelial cells. To some extent, the TME influences the therapeutic response and clinical outcome21,22. Current studies have illustrated the important roles and prognostic value of infiltrating immune cells in malignant tumor progression23,24. Immunotherapy has been developed as an increasing alternative anticancer treatment strategy to stimulate and adapt the innate immune systems for a strong antitumoral immune response25,26. For instance, in the clinic, cytotoxic T lymphocyte-associated antigen 4 (CTLA4) and programmed death-1 (PD-1) are usually employed as small-molecule anticancer inhibitors27,28. Unfortunately, immunotherapies now only respond well to certain types of cancer and are limited to some patients29. Thus, it is necessary to explore potential targets for further treatment. The relationship between GARS1 expression and the infiltrating immune situation has not been explored.
In this study, we performed multiple omics integrative analyses of GARS1 across cancers using The Cancer Genome Atlas (TCGA) and GTEx databases. Potential relationships between GARS1 expression and immune infiltration levels and immune co-expression analysis were investigated. Furthermore, we tested and verified GARS1 as a novel prognostic and immunological biomarker in bladder cancer and.
Methods and materials
GARS1 Expression Level
The Cancer Genome Atlas (TCGA) (https://portal.gdc.cancer.gov/) provides pan-cancer RNA sequencing information from 11,069 samples for free30. GTEx (https://commonfund.nih.gov/) provides 31 types of normal tissue gene expression data31. The cell line expression level matrix of GARS1 was obtained from the CCLE database (https://portals.broadinstitute.org/ccle/) which provided models for studying cancer biology and validating cancer targets32. Gene Expression Profiling Interactive Analysis 2 (GEPIA2) (http://gepia2.cancer-pku.cn) was designed as an online tool to analyze RNA sequencing, including 60,498 genes and 198,619 isoforms33. We used GEPIA2 to evaluate GARS1 expression 33 types of tumor tissues matched with 31 standard normal tissues based on TCGA and GTEx. Data about GARS1 expression levels in 21 tumor cell lines were obtained from the Cancer Cell Line Encyclopedia (CCLE) (https://www.broadinstitute.org/ccle)34.
Immunohistochemistry (IHC) and protein expression of GARS1
The Human Protein Atlas (HPA) (https://www.proteinatlas.org/) is designed as a database using integrated omics technologies to offer proteomic and transcriptome information, including cell, tissue and pathology Atlas35. Protein immunohistochemistry (IHC) images were downloaded from HPA to evaluate GARS1 protein expression on specific tumors and normal tissues. Then, we used a web tool of UALCAN (http://ualcan.path.uab.edu/analysis-prot.html) to access various cancer protein expressions consisting of Colon, Breast cancer, Ovarian Renal and Uterine corpus endometrial from Clinical Proteomic Tumor Analysis Consortium (CPTAC) Confirmatory/Discovery database36.
Prognosis, diagnosis and relative clinical phenotype analysis
We obtained information including survival data and relative clinical phenotypes from the TCGA database, which was downloaded from the UCSC Xena (https://xenabrowser.net/datapages/) database37. We used three indicators, OS, DSS and PFI, to access the prognostic ability of GARS1. The K-M was employed for survival analyses, and ROC curves were employed for diagnostic performance using the pROC package.
Regression analysis in BLCA estimated the risk of death using Cox modeling and p < 0.05 was considered statistically significant. Based on clinical phenotype, we constructed a nomogram for predicting BLCA OS and validated the results by the Calibration model.
Protein–protein interaction network
We used the Search Tool for the Retrieval of Interacting Genes/Proteins (STRING) website (https://string-db.org/) as another online tool to predict potential protein–protein interactions. STRING contains a large host of protein–protein integrated and consolidated data, including direct (physical) and indirect (functional) correlations. We imported GARS1 into STRING to construct a PPI network with no more than 10 interactors. We selected confidence scores > 0.9, which means highly significant.
Genetic feature analysis
cBioportal for Cancer Genomics (http://www.cbioportal.org) was used to evaluate the genetic features of GARS1 including deep deletion, somatic mutations and amplification38. We first queried GARS1 into “TCGA Pan-Cancer Atlas Studies” to assess GARS1 genetic alteration frequencies and visualized the results via the “Cancer Types Summary” module. Then, we used the “Mutations” module to determine the mutation type and mutation site of GARS1. We also drew the mutation spectrum of GARS1 across the TCGA pan-caner dataset via the “OncoPrint” module. R software and package tidyverse were used to conduct the co-expression analysis between GARS1 and five key MMR genes.
DNA methylation analysis
DNA methylation influences gene expression and function, which impacts the clinical outcome, prognosis and carcinogenesis. MethSurv (https://biit.cs.ut.ee/methsurv/) is a web portal that analyses DNA methylation biomarkers39. DNA methylation of GARS1 at CpG sites in BLCA was analyzed by MethSurv. The promoter methylation level of GARS between various types of BLCA samples was analyzed by the UALCAN database.
Gene pathway analysis
Gene Ontology (GO) functional analysis aims to annotate genes to identify characteristic biological attributes based on high-flux transcriptome and gene data40. The Kyoto Encyclopedia of Genes and Genomes (KEGG) is a substant database that includes genes, biological pathways, drugs and disease information41–44. GO and KEGG analyses were conducted for 50 GARS1-binding proteins, visualized by the ggplot2 package for visualization and statistically analyzed by the cluster-Profiler package. GSEA was used as a computational method to determine whether gene expression was statistically significant and concordant between various biological states45. The package Cluster Profiler was used to identify excessive functions and pathway varieties between different GARS1 expression levels in BLCA. Each analysis was repeated 5000 times. FDR < 0.05 and higher NES results were considered potential pathways that were chosen.
Immune infiltration analysis
Pan-cancer analysis of the correlation between GARS1 expression and infiltrating immune cells was conducted by ssGSEA with the R package GSVA (version 3.6)46. Twenty-four types of immune cell infiltration levels were quantified from 33 types of cancers. Spearman and Wilcoxon rank-sum tests were used to identify relationships between pan-cancers and immune cell subsets. Then, Pearman correlation analysis was performed to assess the co-expression of GARS1 with immune genes including immune-associated genes, MHC genes, chemokines, chemokine receptors, immune activation genes and immunosuppressive genes in 33 cancer types. The results were displayed as heatmaps using the R package “pheatmap”. GEPIA2 contains 9736 tumor and 8587 normal sample RNA sequencing expression data and 60,498 gene and 198,619 isoform information. The Tumor Immune Estimation Resource (TIMER2) is a systemic database that includes 10,897 samples for immune infiltrate analysis (http://cistrome.org/TIMER/)47. We used GEPIA2 to investigate GARS1 expression in connection with immune cell markers and then we identified the gene with a significant correlation with GARS1 through TIMER2.
Reverse transcription-quantitative PCR
TRIzol reagent was used to extract RNA (Invitrogen, Carlsbad, CA, USA) and reverse transcribed into cDNA using the iScript cDNA synthesis kit (Bio-Rad, Hercules, CA, USA). qRT-PCR was performed with ChamQ SYBR qPCR Master Mix (Vazyme, Nanjing, China) with a StepOne Plus real-time PCR system (Life Technologies, CA, USA). After standardization of the GAPDH gene, the gene expression was calculated according to the 2−ΔΔCt method. The sequences of primer used in the present study are listed in Supplementary Table S1.
Cell culture and transfection
We purchased cell lines, including RT4, T24, and T24T from ATCC, EJ-1 from JCRB which were confirmed by STR profiling. Cell lines were incubated in DMEM with 10% 1% penicillin–streptomycin plus FBS (Hyclone, USA). Jima Biotech (Suzhou, China) constricted GARS1 overexpression plasmids and shRNA against GARS1. The cell lines were transfected with Lipofectamine 2000 reagent (Invitrogen, USA) according to the manufacturer’s protocols.
Migration, proliferation, invasion, and apoptosis assays
CCK-8 and colony formation assays were used to monitor cell proliferation in vitro. EJ, RT4, T24, and T24T cell lines were seeded in 96-well plates (2500 cells/well) for 24 h. We recorded the optical density (OD) absorption value at 450 nm daily. Then, we seeded the cell line in a 6-well plate at 1000 cells/well for colony formation and changed the medium every 4 days.
We used 24-well Transwell chambers (Corning Life Sciences) to evaluate cell invasion and migration ability. We added 500 μl complete medium in the lower chambers and 200 μl serum-free medium with 4 × 10⁴ cells in the upper chamber. In the invasion assay, chamber inserts were precoated with 50 μl Matrigel matrix (BD Biosciences, Sparks, MD). After incubation for 24 h or the migration assay and 48 h of invasion assay at 37 °C, we removed cells remaining in the upper chamber. The invasive and migratory cells were fixed and stained with 0.1% crystal violet at the lower surface of the chamber. Invasive or migratory cells were counted under an inverted phase-contrast microscope (Olympus, Tokyo, Japan) at 200× magnification.
In the apoptosis assay, we seeded cells in 6-well plates at 90% confluency. Then, we resuspended the collected cells in binding buffer at a concentration of 1 × 10⁶ cells/mL. We mixed 5 mL Annexin V-PE and 5 mL 7-AAD for 15 min. The results of apoptotic cells were analyzed by FACSVerse (Becton, Dickinson, and Company) in BD FACSuite software.
Western blot
We extracted total protein of seven cell lines and SV cell using RIPA lysis buffer. Subsequently, the proteins were incubated overnight at 4 °C on a PVDF membrane with the following primary antibodies: anti-β-Actin (1:1000, Abcam, USA) and anti-GARS1 (1:1000, Abcam, USA).
Statistical analysis
We normalized gene expression data by log2 transformation. t-tests were used to evaluate comparisons between normal and cancer tissues. Kaplan–Meier analysis, and Cox, and log-rank tests were used to conduct survival analysis. Spearman's test or Pearson's test was used to conduct correlation analysis; p < 0.05 was defined as significant difference. R software was used to conduct all statistical analyses (Version 4.0.2).
Results
GARS1 expression levels across various cancers
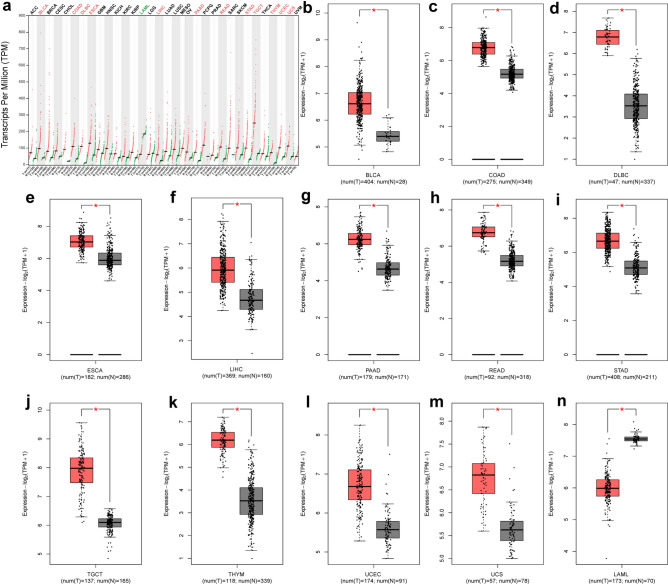
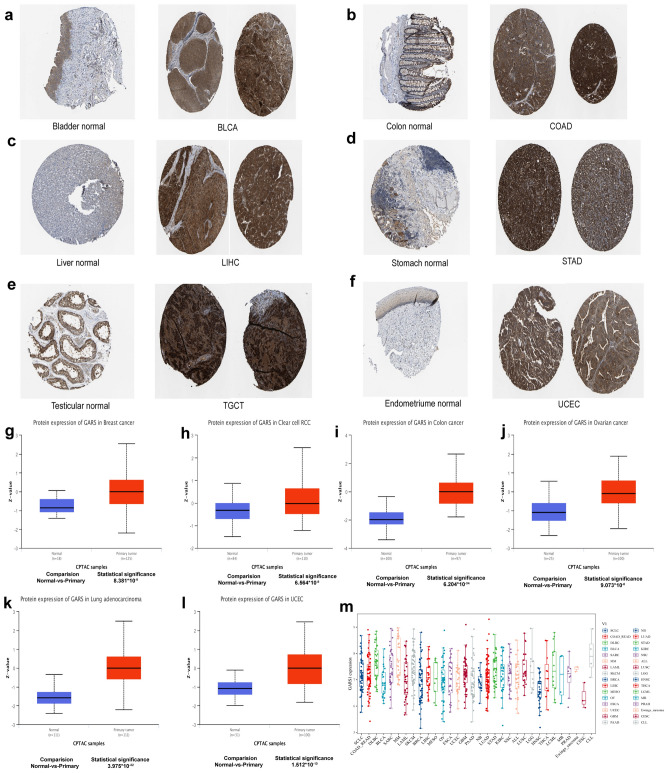
The GARS1 expression levels were assessed between pan-cancer and normal tissues from the TCGA and GTEx datasets using GEPIA2 database (Fig. 1a). The expression level was higher in 12 tumors compared with the normal tissues, including Bladder Urothelial Carcinoma (BLCA), Colon-Adenocarcinoma (COAD), Lymphoid neoplasm diffuse B-cell lymphoma (DLBC), Esophageal carcinoma (ESCA), Liver Hepatocellular Carcinoma (LIHC), Pancreatic adenocarcinoma (PAAD), Rectum adenocarcinoma (READ), Stomach adenocarcinoma (STAD), Testicular germ cell tumors (TGCT), Thymoma (THYM), Uterine Corpus Endometrial Carcinoma (UCEC), and Uterine carcinosarcoma (UCS) (Fig. 1b–m). Interestingly, the expression level of GARS1 in Acute myeloid leukemia (LAML) was lower than that in normal tissue (Fig. 1n). Research based on CCLE database showed that GARS1mRNA is highly expressed in many cancer cell lines, which is consistent with tissue expression (Fig. 2m).
Figure 1.
Pan-cancer expression analysis of GARS1. (a) GARS1 expression level between tumor and normal tissues in pan-cancer data of TCGA and GTEx using GEPIA2. (b–n) The expression level of GARS1 in Bca, COAD, DLBC, ESCA, LIHC, PAAD, READ, STAD, TGCT, THYM, UCEC, UCS and LAML. * was considered statistically significant.
Figure 2.
Immunohistochemistry images. GARS1 expression was higher in (a) Bladder Urothelial Carcinoma (BLCA), (b) Colon-Adenocarcinoma (COAD), (c) Liver Hepatocellular Carcinoma (LIHC), (d) Stomach adenocarcinoma (STAD), (e) Testicular germ cell tumors (TGCT), (f) Uterine Corpus Endometrial Carcinoma (UCEC); Based on the CPTAC dataset, the expression level of GARS1 total protein was analyzed between normal tissue and primary tissue of (g) Breast Cancer, (h) Clear Cell RCC, (i) Colon Cancer, (j) Ovarian Cancer, (k) Lung adenocarcinoma and (l) UCEC. p < 0.001 was considered statistically significant, (m) The expression level of GARS1 in tumor cell lines.
GARS1 protein expression levels between tumor and normal tissue samples
From the images in the HPA database, we found that normal bladder, liver and endometrioma tissues had weak or no GARS1 IHC staining, while tumor tissues had strong staining. Normal colon, stomach and testicular tissues had moderate GARS1 staining, which was located in mucous membrane, but COAD, STAD, TGCT had strong GARS1 staining and hard to identify the normal structure (Fig. 2a–f). From the results of the CPTAC dataset, higher expression of GARS1 total protein was observed in breast cancer, clear cell RCC, colon cancer, ovarian cancer, lung adenocarcinoma and UCEC than in normal tissues (Fig. 2g–l).
Pan-cancer prognostic value of GARS1
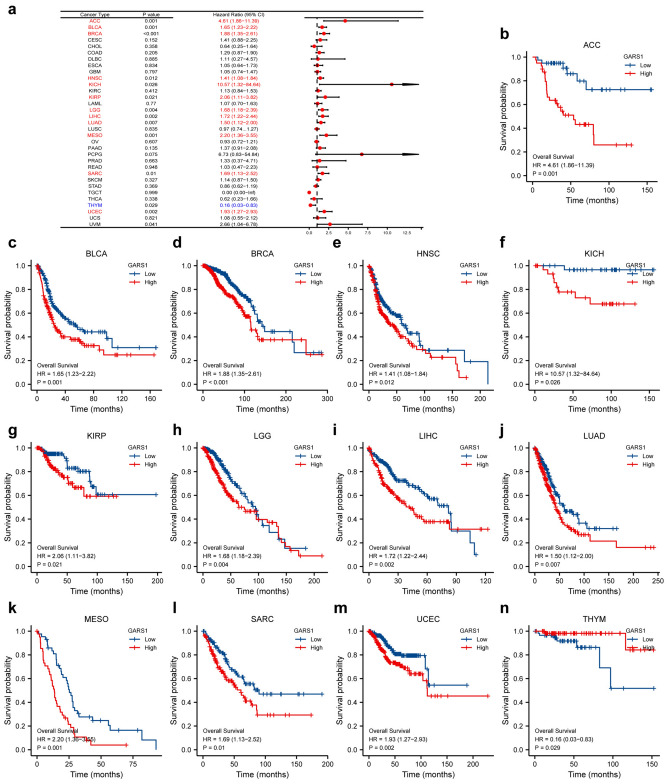
Overall survival (OS) Cox analysis showed that GARS1 expression was correlated with OS in ACC (p = 0.001), BLCA (p = 0.001), BRCA (p < 0.001), Head and neck squamous cell carcinoma (HNSC) (p = 0.012), Kidney chromophobe (KICH) (p = 0.026), Kidney renal clear cell carcinoma (KIRP) (p = 0.021), lower grade glioma (LGG) (p = 0.004), LIHC (p = 0.002), Lung adenocarcinoma (LUAD) (p = 0.007), mesothelioma (MESO) (p = 0.001), Sarcoma (SARC) (p = 0.004), UCEC (p = 0.004), and THYM (p = 0.029) (Fig. 3). We found that GARS1 expression was a high-risk indicator in ACC, BLCA, BRCA, HNSC, KICH, KIRP, LGG, LIHC, LUAD, MESO, PAAD, SARC, UCEC, especially in ACC (Fig. 3a, hazard ratio = 4.61) and KICH (Fig. 3a, hazard ratio = 10.57). Additionally, patients with high GARS1 expression displayed decreased survival in ACC (Fig. 3b, p = 0.001), BLCA (Fig. 3c, p = 0.001), BRCA (Fig. 3d, p < 0.001), HNSC (Fig. 3e, p = 0.012), KICH (Fig. 3f, p = 0.026), KIRP (Fig. 3g, p = 0.021), LGG (Fig. 3h, p = 0.004), LIHC (Fig. 3i, p = 0.002), LUAD (Fig. 3j, p = 0.007), MESO (Fig. 3k, p = 0.001), SARC (Fig. 3l, p = 0.004), UCEC (Fig. 3m, p = 0.004) as analyzed by Kaplan–Meier analyses. Conversely, high GARS1 expression levels were associated with increased survival in THYM (Fig. 3n, p = 0.029).
Figure 3.
The expression of GARS1 associated with OS. (a) Forest plots between OS and GARS1 in pan-cancer. (b) Kaplan–Meier curves of ACC, (c) BLCA, (d) BRCA, (e) HNSC, (f) KICH, (g) KIRP, (h) LGG, (i) LIHC, (j) LUAD, (k) MESO, (l) SARC, (m) UCEC, (n) UVM, and (o) THY.
Moreover, we also constructed models of disease-specific survival (DSS) (Supplementary Fig. 1), which revealed a correlation between higher GARS1 expression and poor prognosis in ACC, BLCA, BRCA, CESC, KIRP, LGG, LIHC, MESO, SARC, UCEC, and UVM. Furthermore, forest plots and KM survival analysis showed associations between the high expression of GARS1 and poor PFI in various cancers including ACC, BLCA, BRCA, NHSC, KICH, KIRP, LGG, LIHC, LUAD, MESO, PRAD, SARC, and UVM (Supplementary Fig. 2).
Pan-cancer diagnostic value of GARS1
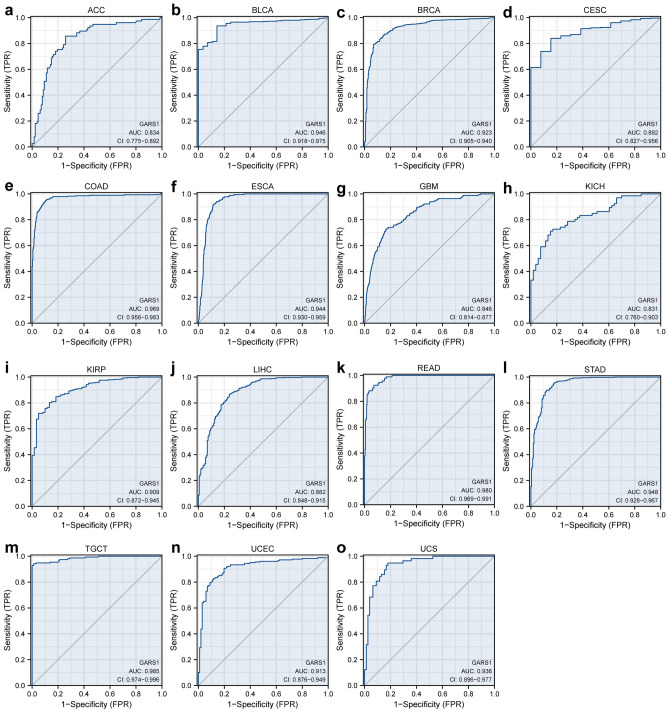
The receiver operating characteristic (ROC) curve was used to access discriminative power in identifying tumors from normal cells across cancers. The expression of GARS1 had AUC values of 0.946, 0.923, 0.969, 0.944, 0.909, 0.980, 0.948, 0.985, 0.913, and 0.936 in BLCA, BRCA, COAD, ESCA, KIRP, READ, STAD, TGCT, UCEC, and UCS respectively, which indicated high accuracy. The expression of GARS1 had AUC values of 0.834, 0.892, 0.846, 0.831, and 0.882 in ACC, CESC, GBM, KICH, and LIHC, respectively, which indicated a certain accuracy (Fig. 4).
Figure 4.
Correlation between GARS1 expression and receiver operating characteristic (ROC) curve for GARS1 expression in pan-cancer. (a) ACC, (b) BLCA, (c) BRCA, (d) CESC, (e) COAD, (f) ESCA, (g) GBM, (h) KICH, (i) KIRP, (j) LIHC, (k) READ, (l) STAD, (m) TGCT, (n) UCEC, (o) UCS.
Construction of the GARS1 protein–protein interaction network in pan-cancer
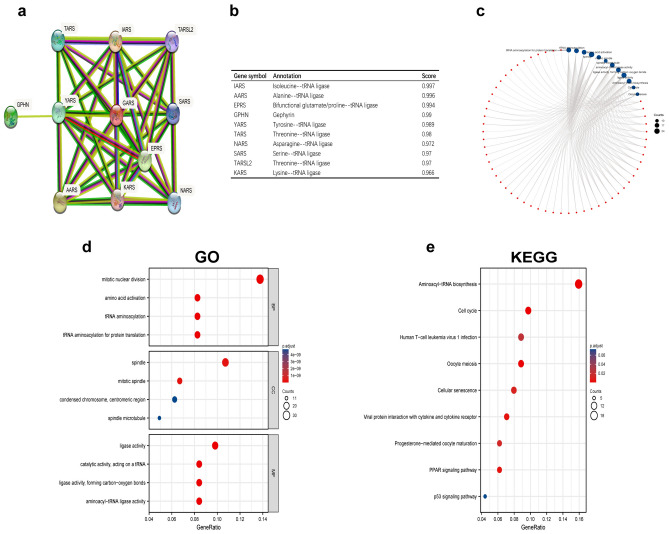
To further explore possible GARS1-related metabolism and molecular mechanisms, we constructed the GARS1 protein–protein interaction network across cancers based on the STRING database (Fig. 5a). The PPI network showed the relationships and annotations of GARS1-related proteins. We listed the top 10 related gene corresponding gene names with their annotation scores (Fig. 5b). IARS, AARS, EPRS, GPHN, YARS, TARS, NARS, SARS, TARSL2, and KARS were the top 10 proteins related to GARS1. These proteins are almost all the aminoacyl-tRNA synthetases that participate in protein synthesis.
Figure 5.
(a) Protein–protein interaction (PPI) network, (b) annotation of GARS1-interacting proteins and their co-expression scores, (c) Visual network of GO and KEGG analyses, (d) GO analysis, and (e) KEGG analysis.
Gene ontology and Kyoto encyclopedia of genes and genomes enrichment analyses
We conducted Kyoto Encyclopedia of Genes and Genomes (KEGG) enrichment analysis and Gene Ontology (GO) analysis of GARS1-binding proteins to identify possible signaling pathways. The results were visualized by the ggplot2 package, and the cluster Profiler package was used for statistical analysis (Fig. 5c–e). Pathways of mitotic nuclear division and Aminoacyl-tRNA biosynthesis were the pathways most related to GARS1.
The genetic features of GARS1 in pan-cancers
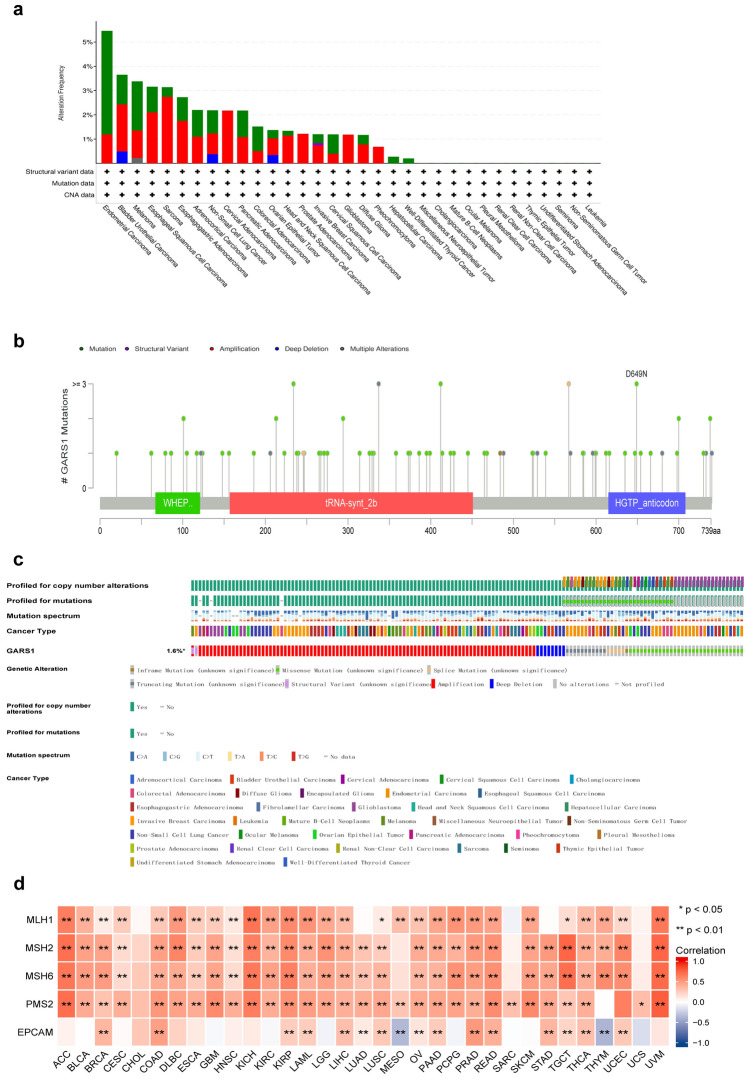
Next, we have examined the genetic alterations of GARS1 in cbioportal for Cancer Genomics (http://www.cbioportal.org), which includes TCGA pan-cancer datasets. The overall genetic alteration rate of GARS1 is relatively low (1.6%) across cancers. Endometrial Carcinoma demonstrated the highest genetic alteration rate of GARS1 (5.46%), followed by Bladder Urothelial Carcinoma (3.65%) (Fig. 6a). The mutation site of GARS1 was mainly located on the tRNA synthetase class II core domain but no hot spot mutation site of GARS1 was detected in pan-caner (Fig. 6b). Missense mutations were the main genetic alterations type of GARS1 and most mutations were C>T (Fig. 6c). We observed copy number variations (CNVs) of GARS1, and amplification was frequently observed in colorectal adenocarcinoma (2.75%), esophagogastric adenocarcinoma (2.11%) and bladder urothelial carcinoma (1.95%) (Fig. 6c). Furthermore, correlation analysis indicated that the expression of GARS1 was significantly and positively associated with the mutation levels of four of five key mismatch repair (MMR), MLH1, MSH2, MSH6 and PMS2, across the cancers (Fig. 6d).
Figure 6.
Pan-cancer analysis of GARS1 genetic features. (a) Frequencies of GARS1 genetic alterations across cancers from TCGA. (b) The mutation type and mutation site of GARS1 from cBioportal. (c) Mutation spectrum of GARS1 across TCGA pan-caner by cBioPortal Oncoprint. (d) Association between the expression of GARS1 and five key MMR genes that indicate mutation levels (MLH1, PMS2, MSH6, EPCAM, MSH2). Correlations were calculated by Pearson’s test. p-value. *p < 0.05; **p < 0.01.
Pan-cancer analysis of GARS1 expression and infiltrating immune cells
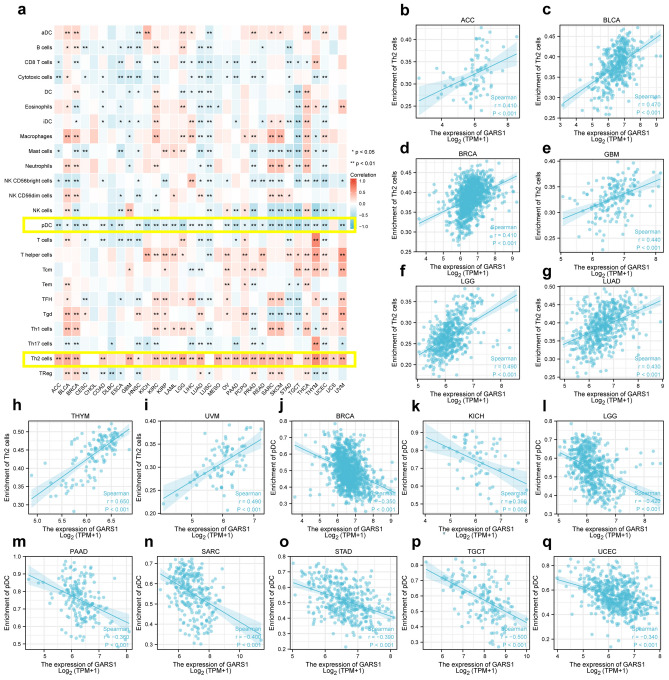
We first performed a pan-cancer analysis of the correlation between GARS1 expression levels and 24 immune cells (Fig. 7a). The correlation analysis between the expression of GARS1 and immune cells was analyzed by ssGSEA based on Spearman’s R. From the heatmap of the correlation analysis, we found that the expression of GARS1 was positively associated with Th2 cells across the pan-caner with significant differences except TGCT, KICH, LUSC, CESC and CHOL (Fig. 7b–i). In contrast, pDCs were negatively associated with GARS1 expression across cancers, with significant differences except for CHOL and UCS (Fig. 7j–q).
Figure 7.
(a) Heatmap of the relationship between the different immune cell infiltration levels and GARS1 expression in various cancers. (b–i) Positive association of GARS1 expression and Th2 cells in the heatmap. (j–q) Negative association of GARS1 expression with pDCs in various cancers. Correlations were calculated by Pearson’s test. p-value. *p < 0.05; **p < 0.01.
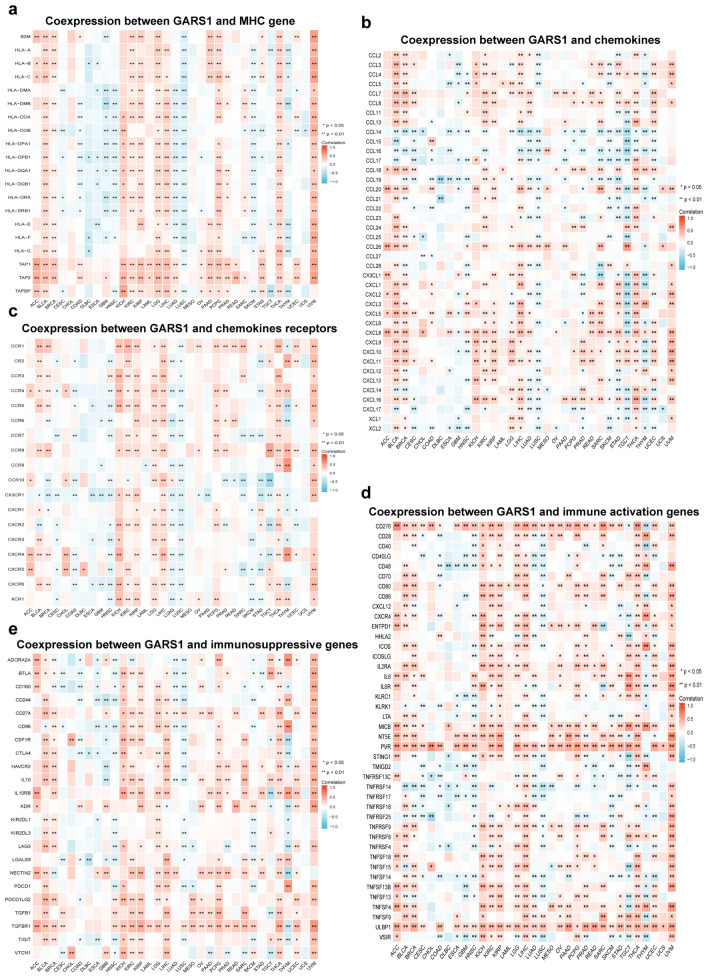
Then, we have performed the co-expression of GARS1with immune-associated genes in 33 cancer types. The immune associated genes included MHC genes, chemokines, chemokine receptors, immune activation genes and immunosuppressive genes. From the results, we found GARS1 was associated with the majority of immune-associated genes except CESC, CHOL, LAML, MESO, OV and PAAD (p < 0.05) (Fig. 8). We found that MHC genes, chemokines and chemokine receptors were positively associated with GARS1 especially in BLCA, BRCA, KICH, KIRC, KIRP, LGG, LIHC, PRAD, and UVM (Fig. 8a–c). We also found that immune activation genes were co-expressed with GARS1 in almost all cancer types (besides CESC, CHOL, DLBC, ESCA, MESO, and SARC). In particular, the immune activation genes PVR, NTSE, ULBP1 and CD276 were widely associated with the expression of GARS1 (Fig. 8d). In addition, immunosuppressive genes were positively correlated with GARS1 including TGFB1, TGFBR1, IL10, IL10RB, and CD274 particularly in BLCA, BRCA, KICH, KIRC, KIRP, LIHC, THCA, UCEC and UVM (Fig. 8e).
Figure 8.
Immune-associated co-expression of GARS1 across cancers. (a) Co-expression of GARS1 with MHC genes. (b) Co-expression between GARS1 and chemokines. (c) Co-expression of GARS1 with chemokine receptors. (d) Co-expression of GARS1 with immune activation genes. (e) Co-expression between GARS1 and immunosuppressive genes. Correlations were calculated by Pearson’s test. p-value. *p < 0.05; **p < 0.01.
Regression analyses of GARS1 expression with OS in BLCA
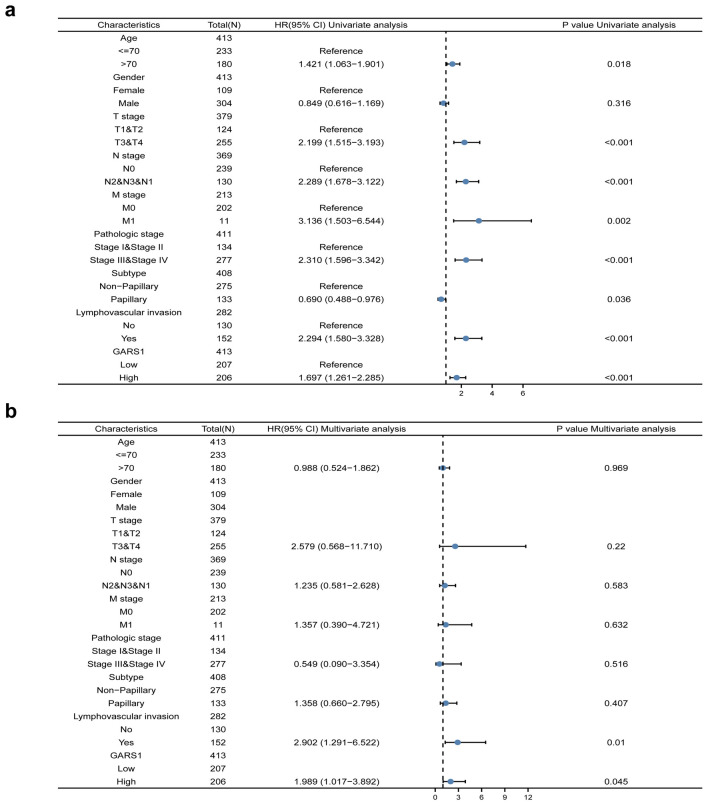
By conducting univariate Cox regression analysis, we found that high GARS1 expression, lymphovascular invasion, high pathologic grade (stage III&IV) and stage (T, N, and M) were poor predictors of OS events in BLCA patients. Meanwhile, multivariate cox proportional-hazards model analysis showed that higher expression of GARS1 was an independent factor associated with worse OS (Fig. 9).
Figure 9.
Univariate (a) and multivariate (b) regression analyses of GARS1 and other clinicopathologic parameters with OS in BLCA patients.
Nomogram for predicting OS and validation by calibration
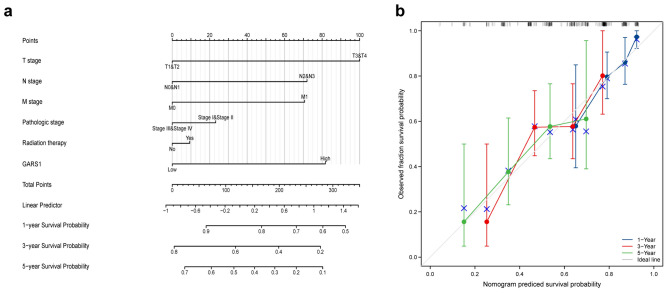
A nomogram was constructed to predict the prognosis of BLCA in specific clinical situations, which integrates the relative clinical characteristics with the OS of BLCA patients. The nomogram assigned a specific point to the clinical situation, and we summed and recorded the total points to evaluate patient outcomes. By matching the total points and absolute axis below, we can determine the probability of survival at 1, 3 and 5 years in BLCA patients (Fig. 10a). The nomogram results showed that GARS1 expression contributes secondarily to the total points compared with other specific clinical situations which are lower than the T pathologic grade. To validate the results of nomogram, we constructed a calibration model and the plot was close to the ideal curve (45-degree) line, which indicated that the predicted and observed values were consistent (Fig. 10b).
Figure 10.
The relationship of GARS1 expression with other clinical factors and overall survival (OS). (a) Nomogram for predicting the probability of 1-, 3-, and 5-year OS for BLCA patients; (b) calibration plot of the nomogram for predicting the OS likelihood.
GSEA identified GARS1-related signaling pathways in BLCA
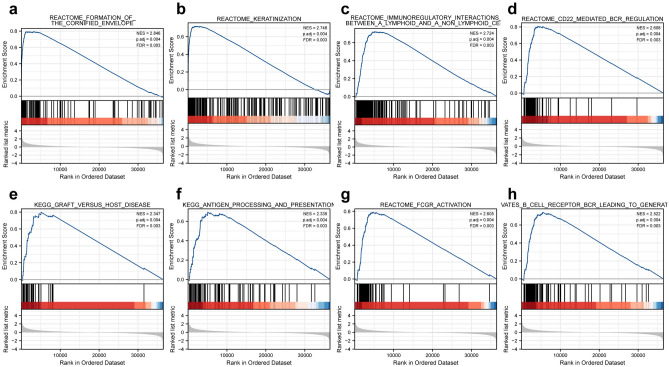
Based on the MSigDB Collection enrichment (c2.all.v7.0.symbols.gmt), GSEA was used to identify GARS1 related signaling pathways between the different GARS1 expression levels with significant difference in BLCA (adjusted p-value < 0.001 and FDR < 0.005). The eight signaling pathways included formation of the cornified envelope, keratinization, immunoregulatory interactions between a lymphoid and a non-lymphoid cell, CD22 mediated bcr-regulation, KEGG-graft versus host disease, KEGG-antigen processing and presentation, Fcgr-activation, and antigen activates b cell receptor bcr leading to generation of second messengers (Fig. 11).
Figure 11.
Enrichment plots from GSEA. Several pathways were differentially enriched in BLCA patients according to different GARS1 expression levels; (a) formation of the cornified envelope; (b) keratinization; (c) immunoregulatory interactions between a lymphoid and a non-lymphoid cell; (d) CD22 mediated bcr-regulation; (e) KEGG-graft versus host disease; (f) KEGG-antigen processing and presentation; (g) Fcgr-activation; (h) antigen activates b cell receptor bcr leading to generation of second messengers; ES enrichment score, NES normalized enrichment score, ADJ p-Val adjusted p-value, FDR false discovery rate.
Correlation between GARS1 and infiltrating immune cells with specific gene marker in BLCA
The public databases TIMER2 and GEPIA2 were used to further explore the role of GARS1 expression in the process of immune cell infiltration with various gene markers. We analyzed the correlation between the expression of GARS1 and immune cell with different markers. From the results, M2 macrophages, TAM, Th1 and T cell exhaustion set markers were greatly associated with the expression of GARS1 in BLCA patients (Table 1).
Table 1.
Correlation analysis between GARS1 and markers of immune cells in BLCA patients in TIMER2 and GEPIA2.
| Cell type | Gene marker | None Cor |
p | Purity Cor |
p | Tumor R |
p | Normal R |
p |
|---|---|---|---|---|---|---|---|---|---|
| B cell | CD19 | 0.118 | * | 0.01 | 0.85 | − 0.025 | 0.62 | 0.48 | * |
| CD20 (KRT20) | − 0.137 | ** | − 0.061 | 0.246 | − 0.055 | 0.27 | 0.21 | 0.4 | |
| CD38 | 0.318 | *** | 0.213 | *** | 0.062 | 0.21 | 0.42 | 0.073 | |
| CD8+ T cell | CD8A | 0.233 | *** | 0.108 | * | 0.096 | 0.055 | 0.21 | 0.38 |
| CD8B | 0.192 | *** | 0.11 | * | 0.41 | * | 0.28 | 0.25 | |
| Tfh | BCL6 | − 0.22 | *** | − 0.195 | *** | − 0.16 | ** | − 0.36 | 0.13 |
| ICOS | 0.252 | *** | 0.124 | * | 0.077 | 0.12 | 0.53 | * | |
| CXCR5 | 0.09 | 0.0708 | − 0.07 | 0.183 | 0.1 | * | 0.45 | 0.056 | |
| Th1 | T-bet (TBX21) | 0.199 | *** | 0.064 | 0.22 | 0.08 | 0.11 | 0.36 | 0.13 |
| STAT4 | 0.213 | *** | 0.081 | 0.119 | 0.076 | 0.13 | 0.27 | 0.27 | |
| IL12RB2 | 0.369 | *** | 0.305 | *** | 0.079 | 0.11 | 0.31 | 0.2 | |
| WSX1 (IL27RA) | 0.357 | *** | 0.302 | *** | 0.17 | *** | 0.46 | * | |
| STAT1 | 0.369 | *** | 0.293 | *** | 0.049 | 0.32 | − 0.051 | 0.84 | |
| IFN-γ (IFNG) | 0.23 | *** | 0.138 | ** | 0.13 | ** | − 0.19 | 0.43 | |
| TNF-α (TNF) | 0.225 | *** | 0.145 | ** | 0.11 | * | 0.064 | 0.79 | |
| Th2 | GATA3 | − 0.244 | *** | − 0.174 | *** | − 0.0075 | 0.88 | − 0.16 | 0.52 |
| CCR3 | 0.142 | ** | 0.108 | 0.0386 | 0.1 | * | 0.27 | 0.27 | |
| STAT6 | − 0.198 | *** | − 0.171 | *** | − 0.25 | *** | − 0.7 | *** | |
| STAT5A | 0 | 0.999 | − 0.094 | 0.0702 | − 0.089 | 0.075 | − 0.37 | 0.12 | |
| Th9 | TGFBR2 | 0.176 | *** | 0.116 | * | 0.037 | 0.45 | − 0.53 | * |
| IRF4 | 0.171 | *** | − 0.001 | 0.983 | − 0.015 | 0.77 | 0.36 | 0.13 | |
| PU.1 (SPI1) | 0.259 | *** | 0.127 | * | 0.17 | *** | 0.24 | 0.31 | |
| Th17 | STAT3 | 0.272 | *** | 0.208 | *** | − 0.098 | * | − 0.33 | 0.17 |
| IL-21R | 0.247 | *** | 0.114 | * | 0.051 | 0.31 | 0.48 | * | |
| IL-23R | − 0.068 | 0.172 | − 0.123 | * | − 0.069 | 0.17 | 0.22 | 0.36 | |
| IL-17A | − 0.0029 | 0.553 | − 0.038 | 0.462 | − 0.0069 | 0.89 | 0.021 | 0.93 | |
| Th22 | CCR10 | − 0.059 | 0.236 | − 0.07 | 0.181 | 0.019 | 0.71 | 0.062 | 0.8 |
| AHR | − 0.033 | 0.51 | 0.015 | 0.774 | 0.073 | 0.14 | − 0.25 | 0.3 | |
| Treg | FOXP3 | 0.255 | *** | 0.145 | ** | 0.084 | 0.093 | 0.51 | * |
| CD25 (IL2RA) | 0.351 | *** | 0.264 | *** | 0.14 | ** | 0.21 | 0.39 | |
| CCR8 | 0.275 | *** | 0.174 | *** | − 0.0069 | 0.89 | 0.4 | 0.093 | |
| T cell exhaustion | PD-1 (PDCD1) | 0.195 | *** | 0.053 | 0.313 | 0.065 | 0.19 | 0.44 | 0.061 |
| CTLA4 | 0.223 | *** | 0.084 | 0.106 | 0.15 | ** | 0.48 | * | |
| LAG3 | 0.302 | *** | 0.193 | *** | 0.18 | *** | 0.34 | 0.15 | |
| TIM-3 (HAVCR2) | 0.34 | *** | 0.235 | *** | 0.18 | *** | 0.14 | 0.58 | |
| Macrophage | CD68 | 0.226 | *** | 0.13 | * | 0.078 | 0.12 | 0.2 | 0.42 |
| CD11b (ITGAM) | 0.29 | *** | 0.19 | *** | 0.004 | 0.94 | − 0.15 | 0.55 | |
| M1 | INOS (NOS2) | 0.097 | 0.0512 | 0.08 | 0.127 | − 8.80E−05 | 1 | 6.80E−02 | 0.78 |
| IRF5 | − 0.128 | ** | − 0.135 | ** | − 0.045 | 0.36 | 0.18 | 0.47 | |
| COX2 (PTGS2) | 0.057 | 0.249 | 0.012 | 0.816 | − 0.0043 | 0.93 | − 0.19 | 0.44 | |
| M2 | CD16 | 0.393 | *** | 0.313 | *** | 0.15 | ** | 0.0035 | 0.99 |
| ARG1 | − 0.046 | 0.354 | 0.013 | 0.8 | − 0.014 | 0.78 | 0.47 | * | |
| MRC1 | 0.354 | *** | 0.277 | *** | 0.12 | * | − 0.32 | 0.19 | |
| MS4A4A | 0.358 | *** | 0.268 | *** | 0.22 | *** | − 0.3 | 0.21 | |
| TAM | CCL2 | 0.259 | *** | 0.143 | ** | 0.18 | ** | − 0.094 | 0.7 |
| CD80 | 0.358 | *** | 0.271 | *** | 0.15 | ** | 0.34 | 0.16 | |
| CD86 | 0.342 | *** | 0.251 | *** | 0.2 | *** | 0.24 | 0.33 | |
| CCR5 | 0.269 | *** | 0.146 | ** | 0.095 | 0.055 | 0.34 | 0.15 | |
| Monocyte | CD14 | 0.327 | *** | 0.226 | *** | 0.18 | *** | 0.0061 | 0.98 |
| CD16 (FCGR3B) | 0.219 | *** | 0.153 | ** | 0.011 | 0.83 | 0.059 | 0.81 | |
| CD115 (CSF1R) | 0.293 | *** | 0.174 | *** | 0.18 | *** | − 0.18 | 0.47 | |
| Neutrophil | CD66b (CEACAM8) | 0.001 | 0.987 | 0.03 | 0.57 | − 0.052 | 0.29 | 0.2 | 0.41 |
| CD15 (FUT4) | 0.302 | *** | 0.248 | *** | 0.018 | 0.72 | − 0.32 | 0.18 | |
| CD11b (ITGAM) | 0.29 | *** | 0.19 | *** | 0.004 | 0.94 | − 0.15 | 0.55 | |
| Natural killer cell | XCL1 | 0.052 | 0.293 | 0.064 | 0.221 | 0.068 | 0.17 | 0.59 | 0.13 |
| CD7 | 0.192 | *** | 0.041 | 0.429 | 0.096 | 0.053 | 0.46 | * | |
| KIR3DL1 | 0.119 | 0.0162 | 0.037 | 0.48 | 0.019 | 0.71 | 0.55 | * | |
| Dendritic cell | CD1C (BDCA-1) | − 0.055 | 0.271 | − 0.17 | ** | − 0.022 | 0.66 | 0.41 | 0.085 |
| CD141 (THBD) | 0.143 | ** | 0.08 | 0.123 | 0.016 | 0.75 | 0.071 | 0.77 | |
| CD11c (ITGAX) | 0.321 | *** | 0.203 | *** | 0.079 | 0.11 | 0.21 | 0.38 |
BLCA bladder urothelial carcinoma, Tfh follicular helper T cell, Th T helper cell, Treg regulatory T cell, TAM tumor-associated macrophage.
None, Correlation without adjustment; Purity, correlation conditioned on tumor purity; Tumor, correlation analysis in tumor tissue of TCGA; Normal, correlation analysis in normal tissue of TCGA.
Cor, R value of Pearman’s correlation *p < 0.05; **p < 0.01; ***p < 0.001.
DNA methylation status of GARS1 in BLCA
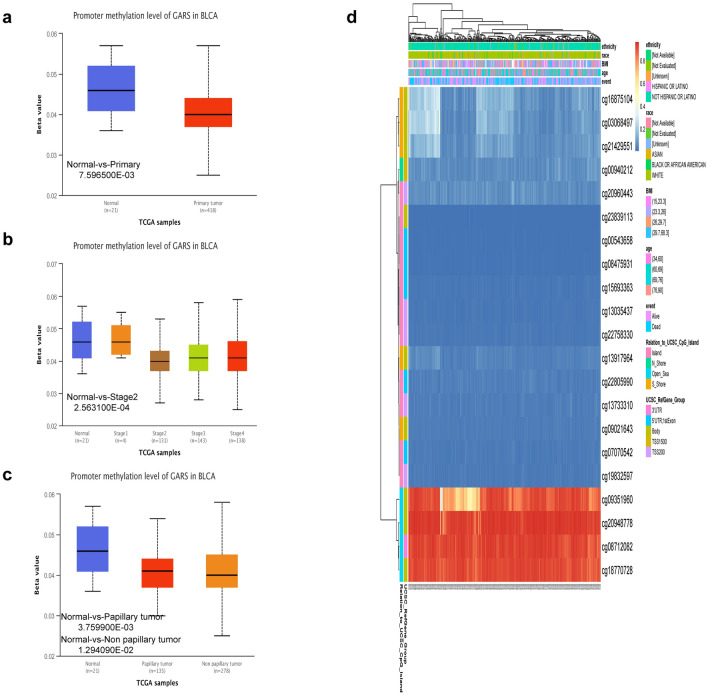
Compared with those in normal tissues, the DNA methylation levels of GARS1 were significantly lower (Fig. 12a). From the results, we found high-grade tumors with a low methylation status of GARS1 (Fig. 12b). In addition, historical subtypes of papillary and non- papillary GARS1 methylation were both lower than those in normal tissues but there was no statistical difference between the two subtypes (Fig. 12c). Through a heatmap from the MethSurv database, we found that CpG sites of GARS1, including cg09351960, cg20948778, cg08712082, and cg18770728, showed higher methylation levels in BLCA (Fig. 12d).
Figure 12.
DNA methylation levels of GARS in BLCA. (a) Promoter methylation level of GARS in normal tissues and primary tumor tissues by the UALCAN database. (b) Promoter methylation level of GARS in BLCA tissues of various tumor stages. (c) Promoter methylation level of GARS in BLCA tissues by historical subtypes. (d) The heatmap of DNA methylation at CpG sites in the GARS gene by the MethSurv database.
GARS1 expression promotes BLCA cells proliferation, and metastasis and inhabits apoptosis in vitro
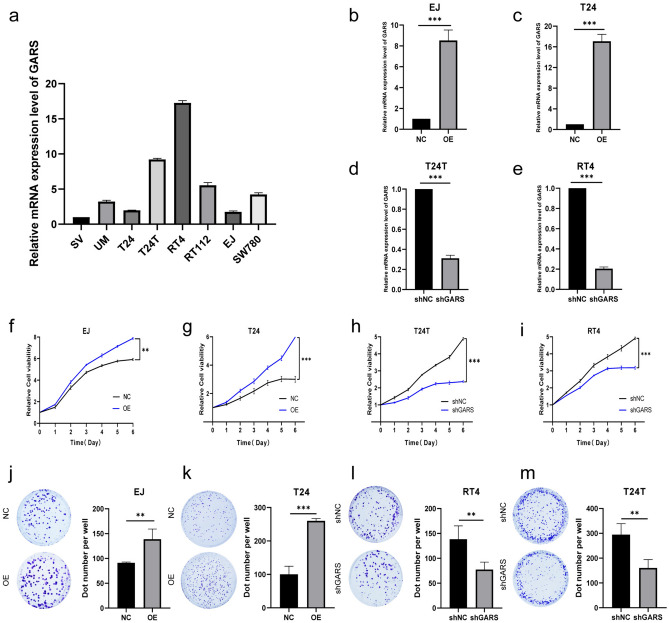
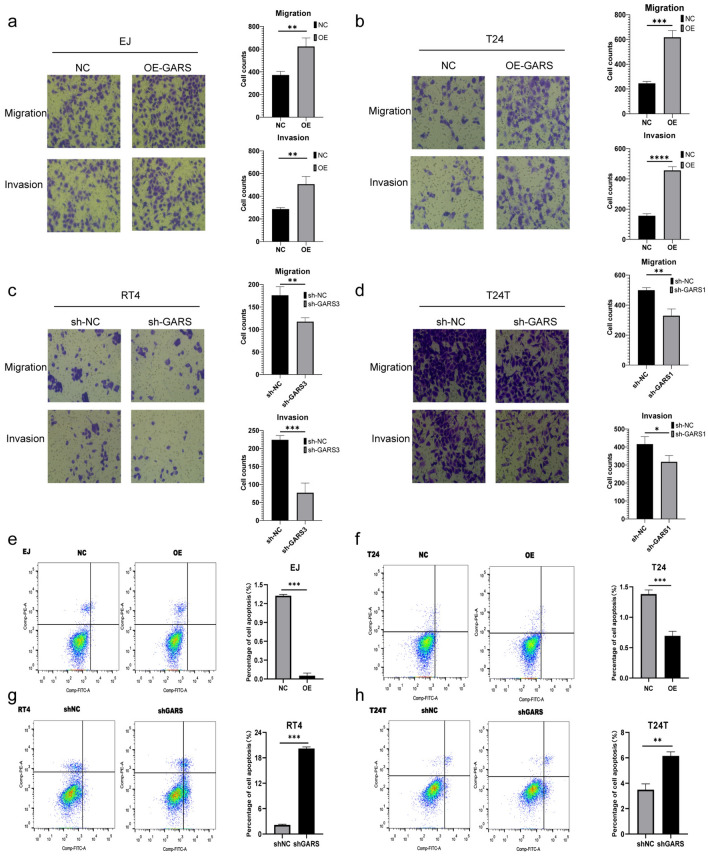
The expression level of GARS1 was remarkably higher in T24T, and RT4 cells than in human bladder epithelium immortalized cells (SV) by RT-qPCR analysis, and the expression of GARS1 was relatively low in the EJ and T24 cell lines (Fig. 13a). To explore the potential function of GARS1 in BLCA, we constructed GARS1-overexpressing BLCA cells in EJ and T24 cells by transfecting the GARS1 overexpression plasmid into GARS1-depleted BLCA cells in T24T and RT4 cells by transfection with GARS shRNA (Fig. 13b–e). We further used the CCK-8 assay to evaluate the proliferation ability of cell lines in vitro. Experiments showed that the OD values were higher in the GARS1 overexpressing groups than in the control groups, with significant differences at the end of the experiments in the EJ and T24 cell lines (Fig. 13f,g). We also found that OD values were lower in the GARS1 depletion groups in T24 and RT4 (Fig. 13h,i). Experiments showed us that overexpression improved the viability of EJ and T24 cells (Fig. 13j,k), and the depletion of GARS inhibited RT4 and T24T cell viability (Fig. 13l,m). We used Transwell assays to further confirm the function of GARS1 in BLCA metastasis. In EJ and T24 cells, the number of migrated and invaded cell in the overexpression groups were higher than those in the NC group (Fig. 14a,b). Meanwhile, in RT4 and T24T cells, the sh-GARS1 groups migrated and invaded cell numbers were dramatically less than those in the shNC group (Fig. 14c,d). The results indicated that silencing GARS1 could damage migration and invasion of BLCA cells. Conversely, overexpressing GARS1 improves the ability to migrate and invade. Annexin V-PE/7-AAD double staining was further employed for apoptosis examination combined with flow cytometry. In EJ and T24 cells, the apoptotic rates of the GARS1-overexpressing groups were lower than those of the control groups (Fig. 14e,f). In contrast, the GARS1 apoptotic rates of the depletion groups were higher than those of the control groups (Fig. 14g,h). Overall, the expression of GARS1 improves the ability of BLCA cells to proliferate, metastasize, and inhibit apoptosis in vitro.
Figure 13.
(a) mRNA level of GARS1 in human bladder epithelium immortalized Cells (SV) and seven BLCA cell lines, including UM, T24, T24T, RT4, RT112, EJ, and SW780. (b–e) The mRNA level of GARS1 in EJ, T24, T24T, and RT4 cells after GARS1 overexpression or depletion. (f–g) The viability of EJ and T24 cells after GARS1 overexpression. (h,i) The viability of T24T and RT4 cells after GARS1 depletion. (j,k) Images exhibited the colony formation and the colony quantification number. *p < 0.05, **p < 0.01, ***p < 0.001, ****p < 0.0001.
Figure 14.
Images and number of migrated cells and invaded cells of (a) EJ, (b) T24, (c) RT4, (d) T24T. Cell apoptosis of (e) EJ, (f) T24, (g) RT4, and (h) T24T cells detected by flow cytometry (magnification ×200). **p < 0.001, ***p < 0.0001.
Discussion
Some studies illustrated that GARS1 missense mutations were associated with Charcot–Marie–Tooth (CMT) subtype 2D (CMT-2D) and distal hereditary motor neuropathy-V (dHMN-V). CMT-2D and dHMN-V are peripheral nervous system hereditary diseases48,49. One study found that extracellular vesicles from macrophages display GARS1 and show anticancer activity20, and one study explored the function of secreted GARS1 in defense against ERK-activated tumorigenesis50. Increasing evidence shows that the multiple functions of GARS1 are systematic factors and are controlled through sophisticated mechanisms in respond to different cellular stimuli in the progression of cancers19,51–53. However, the specific functions of GARS1 have not been extensively studied across cancers. Therefore, it is urgent to explore the function of GARS1 in the progression of tumors through multiple omics integrative pan-cancer analysis.
In our study, we explored the expression pattern, and prognostic and diagnostic value of GARS1 in across cancers through Kaplan–Meier Plotter, ROC curves and multiple databases including TCGA, GTEx, CCLE, and HPA. From the results, we found that GARS1 expression level was higher than in 12 tumors compared with the normal tissues, including BLCA, COAD, DLBC, ESCA, LIHC, PAAD, READ, STAD, TGCT, THYM, UCEC and UCS, while the expression level of GARS1 in LAML was lower than that in normal tissue (Fig. 1). Further investigation of GARS1 protein expression through the HPA and CPTAC databases revealed that BLCA, COAD, LIHC, TGCT, RCC, OV, LUAD, and UCEC had higher expression of GARS1 total protein (Fig. 2). The differences in GARS1 gene and protein expression in various tumor types reflect the underlying functions and mechanisms of tumor progression and development. Then, we found that GARS1 expression was a high-risk indicator poor prognosis in ACC, BLCA, BRCA, HNSC, KICH, KIRP, LGG, LIHC, LUAD, MESO, PAAD, SARC, UCEC, and UVM (Fig. 3). The ROC curve also indicated that the expression of GARS1 was highly accurate in the diagnosis of BLCA, BRCA, COAD, ESCA, KIRP, READ, STAD, TGCT, UCEC, and UCS (Fig. 4). These results indicate that GARS1 is a diagnostic and prognostic biomarker for some types tumors. We also constructed a genetic features atlas, a PPI network, and GO and KEGG analyses of GARS1 to comprehensively understand the functional mechanisms of GARS1 (Figs. 5, 6).
The tumor microenvironment (TME) contains various types of cells, including immune cells, stromal cells, cancer-associated fibroblasts and endothelial cells which constitute vital elements of tumors. Increasing evidence has revealed that the TME influences the therapeutic response and clinical outcome54,55. From the results, the expression of GARS1 was positively associated with Th2 cells across all cancers except TGCT, KICH, LUSC, CESC and CHOL. In contrast, pDCs were negatively associated with GARS1, except for CHOL and UCS (Figs. 7, 8). Our results proved that GARS1 has a positive relationship with Th2 cell infiltration, which may disrupt the Th1/Th2 balance and contribute to tumor progression and immune system weakening56. Then, we performed co-expression analysis of GARS1 expression with immune-associated genes across cancers. We found MHC genes, chemokines and chemokine receptors were positively associated with GARS1 especially in BLCA, BRCA, KICH, KIRC, KIRP, LGG, LIHC, PRAD, UVM and immune activation genes were co-expressed with GARS1 in almost all cancer types (except for CESC, CHOL, DLBC, ESCA, MESO, and SARC). In particular, the immune activation genes PVR, NTSE, ULBP1 and CD276 were widely associated with the expression of GARS1. Surprisingly, immunosuppressive genes were positively correlated with GARS1, including TGFB1, TGFBR1, IL10, IL10RB, and CD274. Our results show that GARS1 might play an essential role in the tumor microenvironment, especially in immunosuppression-relative genes, The high expression of GARS1 associated with immunosuppression suggests that GARS1 might be a potential target for immunotherapy.
Furthermore, we tested and verified GARS1 as a novel prognostic and immunological biomarker in BLCA. The multivariate Cox proportional hazards model57 showed that the higher expression of GARS1 was an the independent factor associated with worse OS (Fig. 9). A nomogram and calibration curve were constructed to predict the prognosis of BLCA in specific clinical situations, integrating the relative clinical characteristics with the OS of BLCA patients58. The results showed that GARS1 expression predicted poor survival in BLCA patients and accurately predicted 1-, 3-, and 5-year OS in BLCA patients to screen and identify high-risk patients (Fig. 10). From the DNA methylation atlas, BLCA tissues expressed a low methylation status as well as a high grade of tumors, which indicated that GARS1 methylation changes may lead to BLCA progression (Fig. 12). T-cell exhaustion is the T-cell dysfunction that occurs in many chronic cancers, and exhaustion prevents optimal control of infection and tumors59. Moreover, we found that M2 macrophages, TAMs, Th1 and T cell exhaustion sets marking were greatly associated with the expression of GARS1 in BLCA patients (Table 1). GARS1 may be a potential target in adjusting the tumor microenvironment. In vitro experiments showed that GARS1 is a potential oncogene promotes BLCA cells proliferation, metastasis and inhabits apoptosis (Figs. 13, 14).
We demonstrate that GARS1 can serve as a novel prognostic and immunological biomarker through multiple omics integrative pan-cancer analysis, especially in BLCA. GARS1 could serve as an oncogene which was validated by in vitro experiments. Immune infiltration was significantly associated with high GARS1 expression, and we constructed immune-association heatmaps to show that GARS1 correlated with specific immune-related genes. Our research was the first to illustrate the potential functional role of GARS1, which might guide us to a novel biomarker that influences T-cell exhaustion infiltration and immunosuppressive gene expression. In vitro experiments validated that GARS1 expression promotes BLCA cell proliferation and metastasis and inhibits apoptosis. Our results show that GARS1 is a valuable diagnostic, prognostic biomarker and a potential target for immunotherapy in BLCA.
This study developed a pan-cancer biomarker related to tumor immunity to predict tumor survival and immune efficacy, with a particular focus on bladder cancer. Unfortunately, we have not yet collected data on bladder cancer cases from our center for external validation of the model's accuracy. In the next phase of our research, we will utilize our own data on bladder cancer to assess the discrimination and conformity of the GARS1 model. As tumor immunotherapy continues to advance, the mechanisms by which GARS1 influences immune infiltration and the tumor microenvironment will be explored further, particularly in relation to its interaction with ICI and bladder cancer.
Conclusions
GARS1 can serve as a novel prognostic and immunological biomarker through multiple omics integrative pan-cancers analysis especially in BLCA. The expression of GARS1 was positively correlated with immune infiltration which indicated that GARS1 may be related to the tumor immune microenvironment. GARS1 functions in vitro were validated by experiments.
Supplementary Information
Acknowledgements
This research was funded by Natural Science Foundation of Fujian Province (No. 2021J01276, No. 2021J01266, No. 2022J01273) and Quanzhou City Science and Technology Program of China (No. 2023C008YR).
Author contributions
W.L., C.W. and Q.H. organized the article writing and critically modified the manuscript. Z.C. modified the manuscript and drafted the manuscript and was responsible for the acquisition of data. W.Z. check and correct language expression. X.X. and Y.G: Conceptualization, Methodology, Supervision, Writing—review and editing. All authors read and approved the manuscript and agree to be accountable for all aspects of the research in ensuring that the accuracy or integrity of any part of the work are appropriately investigated and resolved.
Data availability
The cancer genome database (TCGA) (https://portal.gdc.cancer.gov); GTEx (https://commonfund.nih.gov/ GTEx); CCLE database (https://portals.broadinstitute.org/ccle/); Gene Expression Profiling Interactive Analysis 2 (GEPIA2) (http://gepia2.cancer-pku.cn/#index); The Human Protein Atlas (HPA) (https://www.proteinatlas.org/); UALCAN (http://ualcan.path.uab.edu/analysis-prot.html); Search Tool for the Retrieval of Interacting Genes/Proteins (STRING) website (https://cn.string-db.org/); MethSurv (https://biit.cs.ut.ee/methsurv/); All the databases used in our study are publicly available/open-access.
Competing interests
The authors declare no competing interests.
Footnotes
The original online version of this Article was revised: The original version of this Article omitted an affiliation for Weihui Liu. The correct affiliations are listed in the correction notice.
Publisher's note
Springer Nature remains neutral with regard to jurisdictional claims in published maps and institutional affiliations.
These authors contributed equally: Weihui Liu and Chengcheng Wei.
Change history
10/24/2024
A Correction to this paper has been published: 10.1038/s41598-024-76904-x
Contributor Information
Yihong Guo, Email: hotniu@fmu.edu.cn.
Xueyi Xue, Email: cmd15205014314@163.com.
Supplementary Information
The online version contains supplementary material available at 10.1038/s41598-024-70041-1.
References
- 1.Sahin, T. K., Rizzo, A., Aksoy, S. & Guven, D. C. Prognostic significance of the Royal Marsden Hospital (RMH) score in patients with cancer: A systematic review and meta-analysis. Cancers (Basel)16(10), 1835 (2024). [DOI] [PMC free article] [PubMed] [Google Scholar]
- 2.Rizzo, A., Mollica, V. & Massari, F. Expression of programmed cell death ligand 1 as a predictive biomarker in metastatic urothelial carcinoma patients treated with first-line immune checkpoint inhibitors versus chemotherapy: A systematic review and meta-analysis. Eur. Urol. Focus8(1), 152–159 (2022). [DOI] [PubMed] [Google Scholar]
- 3.Jain, R. K. et al. Immunotherapy advances in urothelial carcinoma. Curr. Treat. Options Oncol.19(12), 79 (2018). [DOI] [PubMed] [Google Scholar]
- 4.Rosenberg, J. E. et al. Atezolizumab in patients with locally advanced and metastatic urothelial carcinoma who have progressed following treatment with platinum-based chemotherapy: A single-arm, multicentre, phase 2 trial. Lancet387(10031), 1909–1920 (2016). [DOI] [PMC free article] [PubMed] [Google Scholar]
- 5.Rizzo, A. et al. Hypertransaminasemia in cancer patients receiving immunotherapy and immune-based combinations: The MOUSEION-05 study. Cancer Immunol. Immunother.72(6), 1381–1394 (2023). [DOI] [PMC free article] [PubMed] [Google Scholar]
- 6.Dall’Olio, F. G. et al. Immortal time bias in the association between toxicity and response for immune checkpoint inhibitors: A meta-analysis. Immunotherapy13(3), 257–270 (2021). [DOI] [PubMed] [Google Scholar]
- 7.Suzman, D. L. et al. FDA approval summary: Atezolizumab or pembrolizumab for the treatment of patients with advanced urothelial carcinoma ineligible for cisplatin-containing chemotherapy. Oncologist24(4), 563–569 (2019). [DOI] [PMC free article] [PubMed] [Google Scholar]
- 8.Stühler, V. et al. Molecular predictors of response to PD-1/PD-L1 inhibition in urothelial cancer. World J. Urol.37(9), 1773–1784 (2019). [DOI] [PubMed] [Google Scholar]
- 9.Guven, D. C. et al. The association between albumin levels and survival in patients treated with immune checkpoint inhibitors: A systematic review and meta-analysis. Front. Mol. Biosci.9, 1039121 (2022). [DOI] [PMC free article] [PubMed] [Google Scholar]
- 10.Kamoun, A. et al. A consensus molecular classification of muscle-invasive bladder cancer. Eur. Urol.77(4), 420–433 (2020). [DOI] [PMC free article] [PubMed] [Google Scholar]
- 11.Srinivasan, G., James, C. M. & Krzycki, J. A. Pyrrolysine encoded by UAG in Archaea: Charging of a UAG-decoding specialized tRNA. Science (New York, NY)296(5572), 1459–1462 (2002). [DOI] [PubMed] [Google Scholar]
- 12.Sauerwald, A. et al. RNA-dependent cysteine biosynthesis in archaea. Science (New York, NY)307(5717), 1969–1972 (2005). [DOI] [PubMed] [Google Scholar]
- 13.Eriani, G., Delarue, M., Poch, O., Gangloff, J. & Moras, D. Partition of tRNA synthetases into two classes based on mutually exclusive sets of sequence motifs. Nature347(6289), 203–206 (1990). [DOI] [PubMed] [Google Scholar]
- 14.Delarue, M. & Moras, D. The aminoacyl-tRNA synthetase family: Modules at work. BioEssays15(10), 675–687 (1993). [DOI] [PubMed] [Google Scholar]
- 15.Guo, M., Yang, X. L. & Schimmel, P. New functions of aminoacyl-tRNA synthetases beyond translation. Nat. Rev. Mol. Cell Biol.11(9), 668–674 (2010). [DOI] [PMC free article] [PubMed] [Google Scholar]
- 16.Freist, W., Logan, D. T. & Gauss, D. H. Glycyl-tRNA synthetase. Biol. Chem. Hoppe-Seyler377(6), 343–356 (1996). [PubMed] [Google Scholar]
- 17.Mazauric, M. H. et al. An example of non-conservation of oligomeric structure in prokaryotic aminoacyl-tRNA synthetases. Biochemical and structural properties of glycyl-tRNA synthetase from Thermusthermophilus. Eur. J. Biochem.241(3), 814–826 (1996). [DOI] [PubMed] [Google Scholar]
- 18.Silvera, D., Formenti, S. C. & Schneider, R. J. Translational control in cancer. Nat. Rev. Cancer10(4), 254–266 (2010). [DOI] [PubMed] [Google Scholar]
- 19.Kim, S., You, S. & Hwang, D. Aminoacyl-tRNA synthetases and tumorigenesis: More than housekeeping. Nat. Rev. Cancer11(10), 708–718 (2011). [DOI] [PubMed] [Google Scholar]
- 20.Goughnour, P. C. et al. Extracellular vesicles derived from macrophages display glycyl-tRNA synthetase 1 and exhibit anti-cancer activity. J. Extracell. Vesicles10(1), e12029 (2020). [DOI] [PMC free article] [PubMed] [Google Scholar]
- 21.Wu, T. & Dai, Y. Tumor microenvironment and therapeutic response. Cancer Lett.387, 61–68 (2017). [DOI] [PubMed] [Google Scholar]
- 22.Bindea, G. et al. Spatiotemporal dynamics of intratumoral immune cells reveal the immune landscape in human cancer. Immunity39(4), 782–795 (2013). [DOI] [PubMed] [Google Scholar]
- 23.Lee, K. H. et al. The prognostic and predictive value of tumor-infiltrating lymphocytes and hematologic parameters in patients with breast cancer. BMC Cancer18(1), 938 (2018). [DOI] [PMC free article] [PubMed] [Google Scholar]
- 24.Lee, N., Zakka, L. R., Mihm, M. C. Jr. & Schatton, T. Tumour-infiltrating lymphocytes in melanoma prognosis and cancer immunotherapy. Pathology48(2), 177–187 (2016). [DOI] [PubMed] [Google Scholar]
- 25.Topalian, S. L., Drake, C. G. & Pardoll, D. M. Immune checkpoint blockade: A common denominator approach to cancer therapy. Cancer Cell27(4), 450–461 (2015). [DOI] [PMC free article] [PubMed] [Google Scholar]
- 26.Gordon, S. R. et al. PD-1 expression by tumour-associated macrophages inhibits phagocytosis and tumour immunity. Nature545(7655), 495–499 (2017). [DOI] [PMC free article] [PubMed] [Google Scholar]
- 27.Pai, C. S. et al. Tumor-conditional anti-CTLA4 uncouples antitumor efficacy from immunotherapy-related toxicity. J. Clin. Investig.129(1), 349–363 (2019). [DOI] [PMC free article] [PubMed] [Google Scholar]
- 28.Sharpe, A. H. & Pauken, K. E. The diverse functions of the PD1 inhibitory pathway. Nat. Rev. Immunol.18(3), 153–167 (2018). [DOI] [PubMed] [Google Scholar]
- 29.Riley, R. S., June, C. H., Langer, R. & Mitchell, M. J. Delivery technologies for cancer immunotherapy. Nat. Rev. Drug Discov.18(3), 175–196 (2019). [DOI] [PMC free article] [PubMed] [Google Scholar]
- 30.Tomczak, K., Czerwińska, P. & Wiznerowicz, M. The Cancer Genome Atlas (TCGA): An immeasurable source of knowledge. Contemp. Oncol. (Poznan, Poland)19(1a), A68-77 (2015). [DOI] [PMC free article] [PubMed] [Google Scholar]
- 31.GTEx Consortium. The Genotype-Tissue Expression (GTEx) project. Nat. Genet.45(6), 580–585 (2013). [DOI] [PMC free article] [PubMed] [Google Scholar]
- 32.Barretina, J. et al. The Cancer Cell Line Encyclopedia enables predictive modelling of anticancer drug sensitivity. Nature483(7391), 603–607 (2012). [DOI] [PMC free article] [PubMed] [Google Scholar]
- 33.Tang, Z., Kang, B., Li, C., Chen, T. & Zhang, Z. GEPIA2: An enhanced web server for large-scale expression profiling and interactive analysis. Nucleic Acids Res.47(W1), W556–W560 (2019). [DOI] [PMC free article] [PubMed] [Google Scholar]
- 34.Nusinow, D. P. et al. Quantitative proteomics of the cancer cell line encyclopedia. Cell180(2), 387-402.e16 (2020). [DOI] [PMC free article] [PubMed] [Google Scholar]
- 35.Colwill, K. & Gräslund, S. A roadmap to generate renewable protein binders to the human proteome. Nat. Methods8(7), 551–558 (2011). [DOI] [PubMed] [Google Scholar]
- 36.Chandrashekar, D. S. et al. UALCAN: A portal for facilitating tumor subgroup gene expression and survival analyses. Neoplasia (New York, NY)19(8), 649–658 (2017). [DOI] [PMC free article] [PubMed] [Google Scholar]
- 37.Wang, S. et al. UCSCXenaShiny: An R/CRAN package for interactive analysis of UCSC Xena data. Bioinformatics (Oxford, England)38(2), 527–529 (2021). [DOI] [PMC free article] [PubMed] [Google Scholar]
- 38.Gao, J. et al. Integrative analysis of complex cancer genomics and clinical profiles using the cBioPortal. Sci. Signal.6(269), pl1 (2013). [DOI] [PMC free article] [PubMed] [Google Scholar]
- 39.Modhukur, V. et al. MethSurv: A web tool to perform multivariable survival analysis using DNA methylation data. Epigenomics10(3), 277–288 (2018). [DOI] [PubMed] [Google Scholar]
- 40.Fan, Y. et al. Exosomal PD-L1 retains immunosuppressive activity and is associated with gastric cancer prognosis. Ann. Surg. Oncol.26(11), 3745–3755 (2019). [DOI] [PubMed] [Google Scholar]
- 41.Kanehisa, M., Furumichi, M., Tanabe, M., Sato, Y. & Morishima, K. KEGG: New perspectives on genomes, pathways, diseases and drugs. Nucleic Acids Res.45(D1), D353–D361 (2017). [DOI] [PMC free article] [PubMed] [Google Scholar]
- 42.Kanehisa, M. & Goto, S. KEGG: Kyoto encyclopedia of genes and genomes. Nucleic Acids Res.28(1), 27–30 (2000). [DOI] [PMC free article] [PubMed] [Google Scholar]
- 43.Kanehisa, M. Toward understanding the origin and evolution of cellular organisms. Protein Sci.28(11), 1947–1951 (2019). [DOI] [PMC free article] [PubMed] [Google Scholar]
- 44.Kanehisa, M., Furumichi, M., Sato, Y., Kawashima, M. & Ishiguro-Watanabe, M. KEGG for taxonomy-based analysis of pathways and genomes. Nucleic Acids Res.51(D1), D587–D592 (2023). [DOI] [PMC free article] [PubMed] [Google Scholar]
- 45.Subramanian, A. et al. Gene set enrichment analysis: A knowledge-based approach for interpreting genome-wide expression profiles. Proc. Natl. Acad. Sci. USA102(43), 15545–15550 (2005). [DOI] [PMC free article] [PubMed] [Google Scholar]
- 46.Hänzelmann, S., Castelo, R. & Guinney, J. GSVA: Gene set variation analysis for microarray and RNA-seq data. BMC Bioinform.14, 7 (2013). [DOI] [PMC free article] [PubMed] [Google Scholar]
- 47.Li, T. et al. TIMER2.0 for analysis of tumor-infiltrating immune cells. Nucleic Acids Res.48(W1), W509–W514 (2020). [DOI] [PMC free article] [PubMed] [Google Scholar]
- 48.Jani-Acsadi, A., Krajewski, K. & Shy, M. E. Charcot–Marie–Tooth neuropathies: Diagnosis and management. Semin. Neurol.28(2), 185–194 (2008). [DOI] [PubMed] [Google Scholar]
- 49.Sambuughin, N. et al. Autosomal dominant distal spinal muscular atrophy type V (dSMA-V) and Charcot–Marie–Tooth disease type 2D (CMT2D) segregate within a single large kindred and map to a refined region on chromosome 7p15. J. Neurol. Sci.161(1), 23–28 (1998). [DOI] [PubMed] [Google Scholar]
- 50.Park, M. C. et al. Secreted human glycyl-tRNA synthetase implicated in defense against ERK-activated tumorigenesis. Proc. Natl. Acad. Sci. USA109(11), E640–E647 (2012). [DOI] [PMC free article] [PubMed] [Google Scholar]
- 51.Schwarz, R. E. et al. Antitumor effects of EMAP II against pancreatic cancer through inhibition of fibronectin-dependent proliferation. Cancer Biol. Ther.9(8), 632–639 (2010). [DOI] [PubMed] [Google Scholar]
- 52.Awasthi, N., Schwarz, M. A. & Schwarz, R. E. Enhancing cytotoxic agent activity in experimental pancreatic cancer through EMAP II combination therapy. Cancer Chemother. Pharmacol.68(3), 571–582 (2011). [DOI] [PubMed] [Google Scholar]
- 53.Reznikov, A. G., Chaykovskaya, L. V., Polyakova, L. I. & Kornelyuk, A. I. Antitumor effect of endothelial monocyte-activating polypeptide-II on human prostate adenocarcinoma in mouse xenograft model. Exp. Oncol.29(4), 267–271 (2007). [PubMed] [Google Scholar]
- 54.Bai, X. et al. Development and validation of a genomic mutation signature to predict response to PD-1 inhibitors in non-squamous NSCLC: A multicohort study. J. Immunother. Cancer8(1), e000381 (2020). [DOI] [PMC free article] [PubMed] [Google Scholar]
- 55.Guo, L. et al. TOX correlates with prognosis, immune infiltration, and T cells exhaustion in lung adenocarcinoma. Cancer Med.9(18), 6694–6709 (2020). [DOI] [PMC free article] [PubMed] [Google Scholar]
- 56.Kidd, P. Th1/Th2 balance: The hypothesis, its limitations, and implications for health and disease. Altern. Med. Rev.8(3), 223–246 (2003). [PubMed] [Google Scholar]
- 57.George, B., Seals, S. & Aban, I. Survival analysis and regression models. J. Nucl. Cardiol.21(4), 686–694 (2014). [DOI] [PMC free article] [PubMed] [Google Scholar]
- 58.Iasonos, A., Schrag, D., Raj, G. V. & Panageas, K. S. How to build and interpret a nomogram for cancer prognosis. J. Clin. Oncol.26(8), 1364–1370 (2008). [DOI] [PubMed] [Google Scholar]
- 59.Wherry, E. J. T cell exhaustion. Nat. Immunol.12(6), 492–499 (2011). [DOI] [PubMed] [Google Scholar]
Associated Data
This section collects any data citations, data availability statements, or supplementary materials included in this article.
Supplementary Materials
Data Availability Statement
The cancer genome database (TCGA) (https://portal.gdc.cancer.gov); GTEx (https://commonfund.nih.gov/ GTEx); CCLE database (https://portals.broadinstitute.org/ccle/); Gene Expression Profiling Interactive Analysis 2 (GEPIA2) (http://gepia2.cancer-pku.cn/#index); The Human Protein Atlas (HPA) (https://www.proteinatlas.org/); UALCAN (http://ualcan.path.uab.edu/analysis-prot.html); Search Tool for the Retrieval of Interacting Genes/Proteins (STRING) website (https://cn.string-db.org/); MethSurv (https://biit.cs.ut.ee/methsurv/); All the databases used in our study are publicly available/open-access.


