Abstract
Clinical trials seeking to delay or prevent the onset of type 1 diabetes (T1D) face a series of pragmatic challenges. Despite more than 100 years since the discovery of insulin, teplizumab remains the only FDA‐approved therapy to delay progression from Stage 2 to Stage 3 T1D. To increase the efficiency of clinical trials seeking this goal, our project sought to inform T1D clinical trial designs by developing a disease progression model‐based clinical trial simulation tool. Using individual‐level data collected from the TrialNet Pathway to Prevention and The Environmental Determinants of Diabetes in the Young natural history studies, we previously developed a quantitative joint model to predict the time to T1D onset. We then applied trial‐specific inclusion/exclusion criteria, sample sizes in treatment and placebo arms, trial duration, assessment interval, and dropout rate. We implemented a function for presumed drug effects. To increase the size of the population pool, we generated virtual populations using multivariate normal distribution and ctree machine learning algorithms. As an output, power was calculated, which summarizes the probability of success, showing a statistically significant difference in the time distribution until the T1D diagnosis between the two arms. Using this tool, power curves can also be generated through iterations. The web‐based tool is publicly available: https://app.cop.ufl.edu/t1d/. Herein, we briefly describe the tool and provide instructions for simulating a planned clinical trial with two case studies. This tool will allow for improved clinical trial designs and accelerate efforts seeking to prevent or delay the onset of T1D.
INTRODUCTION
Type 1 diabetes (T1D) is a chronic disorder resulting from the dysfunction and immune‐mediated destruction of insulin‐releasing beta cells in the pancreatic islets of Langerhans. The incidence of T1D as well as its prevalence is increasing worldwide. 1 , 2 The number of new‐onset T1D cases per year is estimated at 65,000 children. 3 Though it is not a cure, insulin replacement therapy continues to be the principal management tool for T1D. While the progression and pathophysiology of T1D have been subject to extensive investigation over many decades, there exists only one FDA‐approved therapy (i.e., teplizumab) to delay the onset of T1D.
A T1D disease progression joint model, using individual‐level data from the TrialNet Pathway to Prevention and TEDDY natural history studies, was developed, externally validated, and published by Morales et al. 4 This model's parameters were estimated for individuals at risk of developing T1D. It links the longitudinal glycemic measure to the timing of T1D diagnosis, quantitatively accounting for potential sources of variability. The longitudinal change in glycemic measures was modeled with a nonlinear mixed‐effects modeling approach, and the time‐to‐T1D diagnosis utilized a parametric time‐to‐event modeling approach. These modeling techniques allow running simulations accounting for different sources of variability, approaching a real‐world scenario. Therefore, a T1D Prevention clinical trial simulator (CTS) has been developed based on this disease progression model, 4 leveraging its capacity and accessibility to inform T1D prevention trials through simulations. The web‐based tool is publicly available and user‐friendly: https://app.cop.ufl.edu/t1d/.
KEY QUESTIONS AND ASSUMPTIONS
This manuscript presents the developed CTS tool along with two case examples to help users to navigate its use. The drug effects are based on proportional changes in model parameters chosen by the user instead of real drug data. These clinical trial simulations are designed to assist in the development of strategies for trial enrichment, stratification, timing of clinical assessments, trial duration, and determination of sample sizes for studies assessing potential treatments for the prevention of T1D. However, these simulations are not intended to replace actual clinical trials for assessing drug safety and efficacy.
OVERALL LAYOUT
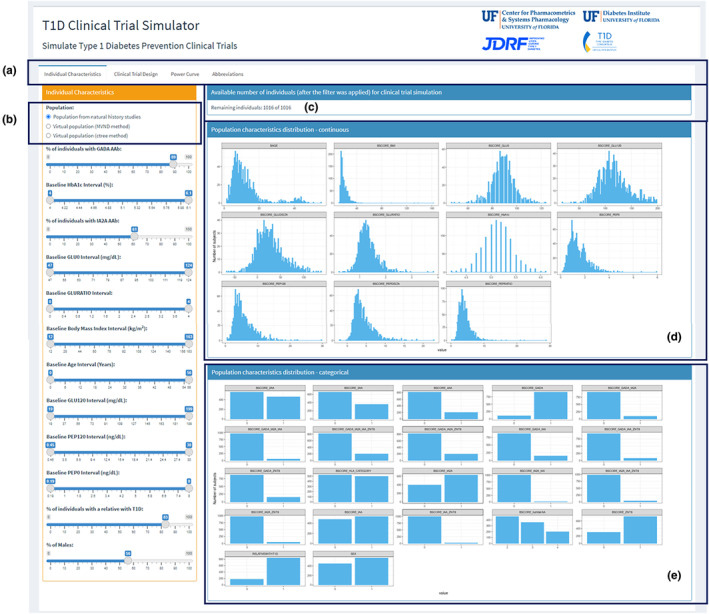
The graphical user interface (GUI) of the T1D CTS tool contains four tabs: (i) Individual Characteristics, (ii) Clinical Trial Design, (iii) Power Curve, and (iv) Abbreviations (Figure 1a). In the first tab, users can specify the population characteristics they want to simulate according to their inclusion/exclusion criteria. The next tab permits the users to specify other trial design components and define an assumed drug effect. In the third tab, power curves are generated using additional variables within a range on top of the pre‐specified selections from the first two tabs. The last tab summarized the abbreviations used in the GUI.
FIGURE 1.

Overall layout and available selection for inclusion/exclusion criteria.
Individual Characteristics Tab
The Individual Characteristics tab allows the users to define inclusion/exclusion criteria by selecting a subpopulation from three options: a population from the natural history studies used in the model 4 and two virtual populations (Figure 1b). The virtual populations, which mimic the original observed real‐world dataset, were created using two different techniques: the MVND method 5 and the ctree method. 6 The MVND method creates synthetic individuals using a multivariate normal function, while the ctree method uses classification and regression trees (CART)/machine learning. The virtual populations enlarge the number of available individuals while maintaining the statistical properties of the covariate distributions. The selected covariates in the T1D disease progression model were five: baseline presence of glutamic acid decarboxylase 65 autoantibody, baseline presence of insulinoma associated protein‐2 autoantibody, baseline value of HbA1c, baseline value of 0 min of oral glucose tolerance test, and baseline value of the ratio of 2‐h oral glucose tolerance test measurement and 0 min of oral glucose tolerance test. 4 Therefore, the simulation results could be more sensitive to this individual characteristics; however, since all the features are correlated, the other parameters could affect indirectly the simulation outcomes.
Clinical Trial Design Tab
The Clinical Trial Design tab can specify additional clinical trial parameters. We implemented the options for the number of subjects as inputs for the placebo and treatment arms separately to add more user flexibility. Users can also add a dropout rate in each arm (Figure S1A). Dropouts will be drawn from the user‐selected distribution, either exponential or uniform, assuming a missing completely at random mechanism. 7 Users can specify the total duration of follow‐up after randomization and the assessment interval (Figure S1B). A significance level to compare the placebo and treatment arms statistically using a log‐rank test can be defined as well (Figure S1C).
The predicted trajectories of the two arms can be differentiated based on the user‐defined Assumed Drug Effect (Figure S1D). Users can increase x‐times of the magnitude of DP50 parameter value representing the time producing 50% of the maximum change in GLU120. The increase in the DP50 parameter translates into a projected delay in the onset of T1D. 4 The simulation will be repeated using the defined clinical trial design and assumed drug effect based on the chosen number of replicates (Figure S1E). The power result indicates the ratio of the number of replicates in which the placebo and treatment arms are statistically different over the total number of replicates. Also, time‐to‐event plots and other simulation summaries will be shown.
Power Curve Tab
Users can further analyze the impact of changes in three parameters on the power of the simulated clinical trials more continuously, with simultaneous simulation of multiple scenarios. On this tab, there are three dropdown boxes where users can select values from a series of options to explore (Figure S2A). Users will select a range of the values of each of the selected three parameters and the number of samples within the range (Figure S2B). The resulting stratified power curves are shown in a grid plot. The utility of the power curve function is the ability to look at multiple scenarios simultaneously based on sensitivity to relevant patient characteristics and trial design parameters.
CASE STUDY I: ORAL INSULIN TRIAL
The results from a phase III T1D prevention clinical trial were published in 2017, designed to test the efficacy of oral insulin in relatives of individuals with T1D. 8 Although there was no significant difference between placebo and treatment groups, the trial nonetheless provided a framework to explore different if‐scenarios. We reproduced the trial using this developed CTS tool with the assumption that there is a drug producing statistically significant efficacy.
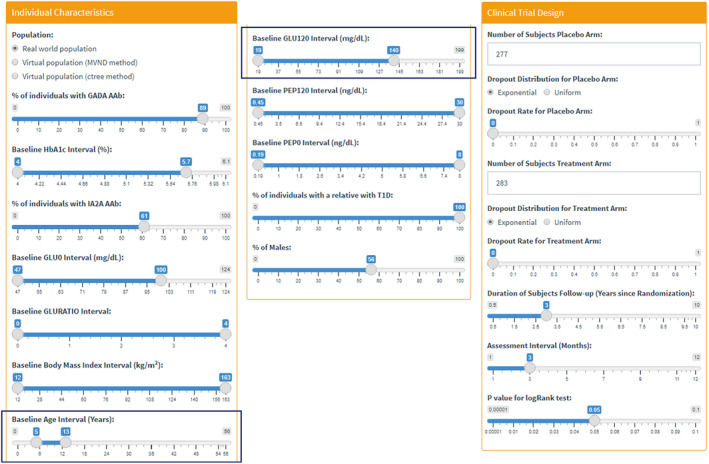
Based on the oral insulin trial information, we set up the inclusion/exclusion criteria and other clinical trial design parameters under the first two tabs: Individual Characteristics and Clinical Trial Design (Figure 3). Using this setting, we ran several exploratory simulations with 100 replicates by varying the drug effect slider bar under the Clinical Trial Design tab to find the value of the effective assumed drug (power cutoff: 85%). The value of 1.6 was chosen as the drug effect, which showed a power of 88%.
FIGURE 3.

Input parameters used for Case Study I.
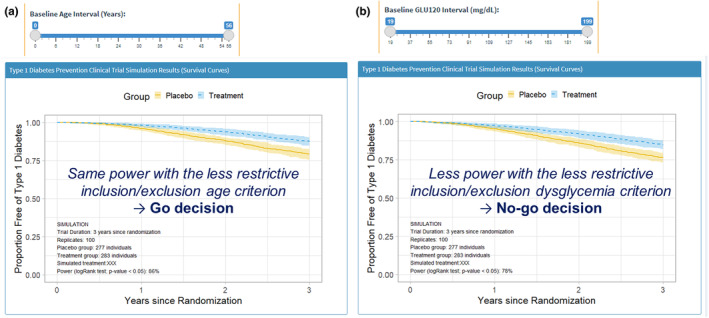
The inclusion criteria for the participants' baseline age range was 5.4–12.5 years in age. An exploratory analysis was performed to examine the impact of a wider age range on the power. In other words, this expanded inclusion criteria could help the recruitment phase of such trials since it is less restrictive and would reduce the time needed for recruiting. Baseline Age Interval (Years) was modified from 0 to 56 years of age as the new age range (cf. Figures 3 and 4a). The power for this proposed scenario was 89% when 100 replicates were simulated, meaning that there was no detrimental effect on the power. The results of the simulated trial suggest that the inclusion criteria could be modified to provide a simplified recruitment phase (Figure 4a: Go decision).
FIGURE 4.

Results from Case Study I.
An additional exploratory analysis was performed by assessing the impact of enrolling subjects with dysglycemia, on top of the broader inclusion criterion with respect to age. In this case, the 2‐h oral glucose tolerance test value at baseline (GLU120) range was changed to include high values up to 199 mg/dL from previously 140 mg/dL (cf. Figures 3 and 4b). As a result, the power decreased to 78%, below the cutoff value of 85%. Therefore, in this example, the results with the CTS tool showed that adding individuals with dysglycemia to the designed study would not be desired (Figure 4b: No‐go decision).
CASE STUDY II: ANTI‐CD3 MONOCLONAL ANTIBODY TRIAL
For this second case study, we reproduced the TN10 trial that was conducted to determine whether the anti‐CD3 monoclonal antibody teplizumab can help prevent or delay the onset of T1D in relatives at high risk. 9 As noted earlier, the FDA has approved teplizumab as an effective drug delaying the onset of stage 3 T1D. Under the first tab of the GUI, the ranges of the individual characteristics were adjusted according to the inclusion/exclusion criteria used in the TN10 trial (e.g., dysglycemic individuals). When the “Real world population” option was selected (Figure 1b), the pop‐up message warned that the number of individuals who met the criteria was below 50. To generate realistic simulation results assuring properly accounted variability, the virtual population generated using the ctree method was selected. In the next tab, the assumed drug effect was tuned by exploring different values. A desired power above 85% was established during the search for the increment of the DP50 parameter. Finally, a 10‐time increment was suitable for this scenario, providing a power of 91% with 100 replicates.
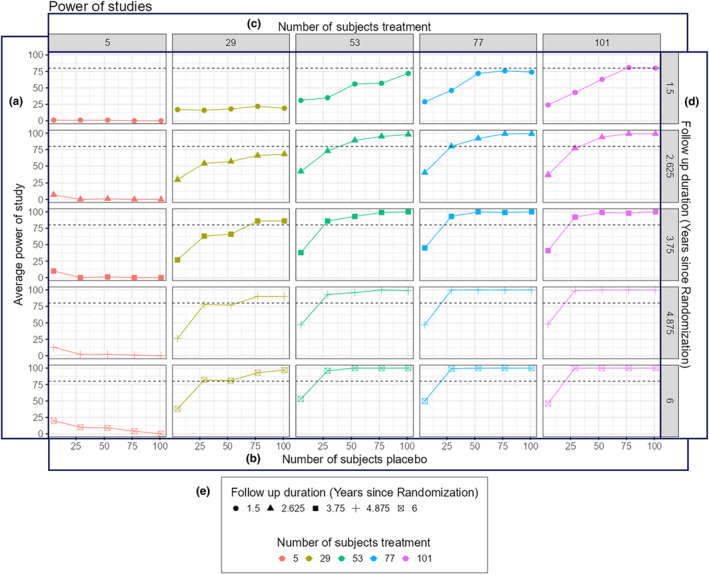
Following this, a wider inclusion criterion was explored to simplify the recruitment phase. For this reason, dysglycemic and normoglycemic individuals were included in this hypothetical virtual trial scenario by expanding the baseline HbA1c interval (4%–6.1%), GLU0 interval (47–124 mg/dL) and GLU120 interval (19–199 mg/dL). After changing the individual characteristics, the power of the new trial design remained the same (91%). Therefore, a broader inclusion criterion could facilitate the recruitment phase without impacting the trial output based on the simulation results (Go decision). In the Power Curve tab, we further explored changes in the study duration and the number of subjects in the placebo and treatment arms. Figure 2 presents the resulting power curves. Our simulation results suggested that an increase of ~50 individuals in each arm could lead to a trial duration reduction to ~2.6 years, while maintaining a power value above 80%. Therefore, an increment of ~33% on the total number of participants could decrease the duration of the trial by ~48%. Providing such quantitative estimates holds considerable value for investigators in calculating benefit–risk calculation for trial design.
FIGURE 2.

Representative power curves from Case Study II.
IMPACT ASSESSMENT AND CONCLUSION
We believe the presented web‐based CTS tool developed based on disease‐drug‐trial modeling can help inform decision‐making for T1D drug developers through data‐driven simulations before actual trial execution. As part of our description, we provided two case examples using this tool with a walk‐through instruction, starting from realistic clinical trial scenarios. While we believe this represents a significant advance for clinical T1D research, some limitations of this tool should be considered. Given that no data were available to quantify specific drug effects, we implemented a function that modifies the magnitude of disease progression model parameters based on a user‐selected drug effect value (Figure S1D). For optimal use of our application, users should adjust this value by comparing resulting plots from available data showing actual drug effects. In some cases, it will not be feasible to obtain a reasonable estimate of the drug effect, particularly in the early stages of drug development. Since this parameter strongly influences the interpretation of the simulated output, the sensitivity to it should be considered when performing simulations. In addition, this tool is limited to simulating scenarios for participants with two or more diabetes‐related AAbs because the model parameters were estimated for those individuals at risk of developing T1D, which is the case for most T1D prevention trials focusing on this population. 4
Despite these limitations, this T1D CTS tool will help pave the way for advancing drug development in settings seeking to delay/prevent this disease. We leveraged the available data from natural history studies and modeling and simulation approaches. The clinical trial designs can be evaluated using the tool, including inclusion/exclusion criteria, sample size, and study duration with go/no‐go outputs. The power curve tab allows us to explore the outcome more continuously. This information will increase confidence in planned clinical trials by reducing the risk of possible study failures and the overall costs of drug development.
FUNDING INFORMATION
This work was funded by Breakthrough T1D, Grant/Award Number: 2‐SRA‐2020‐903‐A‐N and 3‐SRA‐2022‐1157‐S‐B. (Additional Funding Acknowledgement: The Type 1 Diabetes TrialNet Study Group is a clinical trials network currently funded by the National Institutes of Health (NIH) through the National Institute of Diabetes and Digestive and Kidney Diseases, the National Institute of Allergy and Infectious Diseases, and The Eunice Kennedy Shriver National Institute of Child Health and Human Development, through the cooperative agreements U01 DK061010, U01 DK061034, U01 DK061042, U01 DK061058, U01 DK085461, U01 DK085465, U01 DK085466, U01 DK085476, U01 DK085499, U01 DK085509, U01 DK103180, U01 DK103153, U01 DK103266, U01 DK103282, U01 DK106984, U01 DK106994, U01 DK107013, U01 DK107014, UC4 DK106993, UC4 DK117009, and Breakthrough T1D).
CONFLICT OF INTEREST STATEMENT
The authors declared no competing interests for this work.
Supporting information
Figure S1
Figure S2
ACKNOWLEDGMENTS
The content of this publication does not necessarily reflect the views or policies of Breakthrough T1D. The data from the TEDDY (The Environmental Determinants of Diabetes in the Young) and TrialNet studies reported here were supplied by the National Institutes of Health (NIH) National Institute of Diabetes and Digestive and Kidney Diseases (NIDDK) Central Repository. This publication does not necessarily reflect the opinions or views of the TEDDY Study Group, TrialNet, the NIH NIDDK, or the NIDDK Central Repository. The authors have no relevant conflicts of interest to disclose. The authors wish to thank David Hemond (Systems Admin/Programmer 3, University of Florida) for the GUI server setup, Sarah David (Associate Director, C‐Path Pediatrics Program) for administrative support, and Amanda Posgai, PhD (Research Coordinator III/Medical Writer, University of Florida) for editorial assistance. We thank Simulations Plus for the free usage of Simulx, which runs the simulation in the app.
Morales JF, Klose M, Hoffert Y, et al. Type 1 diabetes prevention clinical trial simulator: Case reports of model‐informed drug development tool. CPT Pharmacometrics Syst Pharmacol. 2024;13:1309‐1316. doi: 10.1002/psp4.13193
REFERENCES
- 1. Mobasseri M, Shirmohammadi M, Amiri T, Vahed N, Hosseini Fard H, Ghojazadeh M. Prevalence and incidence of type 1 diabetes in the world: a systematic review and meta‐analysis. Health Promot Perspect. 2020;10(2):98‐115. (In Eng). doi: 10.34172/hpp.2020.18 [DOI] [PMC free article] [PubMed] [Google Scholar]
- 2. Gale EA. The rise of childhood type 1 diabetes in the 20th century. Diabetes. 2002;51(12):3353‐3361. (In Eng). doi: 10.2337/diabetes.51.12.3353 [DOI] [PubMed] [Google Scholar]
- 3. Usher‐Smith JA, Thompson M, Ercole A, Walter FM. Variation between countries in the frequency of diabetic ketoacidosis at first presentation of type 1 diabetes in children: a systematic review. Diabetologia. 2012;55(11):2878‐2894. (In Eng). doi: 10.1007/s00125-012-2690-2 [DOI] [PMC free article] [PubMed] [Google Scholar]
- 4. Morales JF, Muse R, Podichetty JT, et al. Disease progression joint model predicts time to type 1 diabetes onset: optimizing future type 1 diabetes prevention studies. CPT Pharmacometrics Syst Pharmacol. 2023;12(7):1016‐1028. (In Eng). doi: 10.1002/psp4.12973 [DOI] [PMC free article] [PubMed] [Google Scholar]
- 5. Tannenbaum SJ, Holford NH, Lee H, Peck CC, Mould DR. Simulation of correlated continuous and categorical variables using a single multivariate distribution. J Pharmacokinet Pharmacodyn. 2006;33(6):773‐794. (In Eng). doi: 10.1007/s10928-006-9033-1 [DOI] [PubMed] [Google Scholar]
- 6. Nowok B, Raab GM, Dibben C. Synthpop: bespoke creation of synthetic data in R. J Stat Softw. 2016;74(11):1‐26. doi: 10.18637/jss.v074.i11 [DOI] [Google Scholar]
- 7. Dziura JD, Post LA, Zhao Q, Fu Z, Peduzzi P. Strategies for dealing with missing data in clinical trials: from design to analysis. Yale J Biol Med. 2013;86(3):343‐358. (In Eng). [PMC free article] [PubMed] [Google Scholar]
- 8. Krischer JP, Schatz DA, Bundy B, Skyler JS, Greenbaum CJ. Effect of oral insulin on prevention of diabetes in relatives of patients with type 1 diabetes: a randomized clinical trial. JAMA. 2017;318(19):1891‐1902. (In Eng). doi: 10.1001/jama.2017.17070 [DOI] [PMC free article] [PubMed] [Google Scholar]
- 9. Herold KC, Bundy BN, Long SA, et al. An anti‐CD3 antibody, teplizumab, in relatives at risk for type 1 diabetes. N Engl J Med. 2019;381(7):603‐613. (In Eng). doi: 10.1056/NEJMoa1902226 [DOI] [PMC free article] [PubMed] [Google Scholar]
Associated Data
This section collects any data citations, data availability statements, or supplementary materials included in this article.
Supplementary Materials
Figure S1
Figure S2


