

Abstract
Immunoglobulin-based positron emission tomography (ImmunoPET) is making increasingly significant contributions to the nuclear imaging toolbox. The exquisite specificity of antibodies combined with the high-resolution imaging of PET enables clinicians and researchers to localize diseases, especially cancer, with a high degree of spatial certainty. This review focuses on the radiopharmaceutical preparation necessary to obtain those images — the work behind the scenes, which occurs even before the patient or animal is injected with the radioimmunoconjugate. The focus of this methods review will be the chelation of four radioisotopes to their most common and clinically relevant chelators.
Keywords: ImmunoPET, antibody radiolabeling, radioimmunoconjugate, chelator, 89Zr, 64Cu, 86Y, 124I
I. Introduction
ImmunoPET is a novel imaging technique that blends two areas of science, immunology and nuclear imaging, taking advantage of each of their strengths. Rather than using small molecules, such as FDG, immunoPET uses the exquisite specificity of antibodies to deliver the radionuclide to a given target tissue. Antibodies are part of a class of proteins called immunoglobulins.[1] The specificity of these antibodies and other related targeted biologicals is crucial for the identification of their target, enabling the precise detection of the disease site in the affected tissue.[2] Antibodies are Y-shaped, in which a highly specific and variable region is present in the inside part of the bifurcation. The potential for high variation gives researchers the capacity to customize the antibody to a specific antigen. Antigens contain defined chemical signatures, which are usually found in the surface layers of xenobiotic agents, such as bacteria. However, antigens are also present in disease sites such as cancer cells, where they can be detected by immunoPET. For targeted imaging purposes — be it optical, nuclear or any other modality — antigens should be either exclusively expressed or overexpressed, ideally in the cell surface, of the cancer cells, thus decreasing background signal in the resulting image and increasing the contrast between healthy tissue and disease.
Antibodies are not the only strategy for the development of immunoPET imaging. Other targeting strategies that have recently emerged include the use of antibody fragments such as minibodies.[3–6] These have the potential to decrease the blood half-life of the compound, thus reducing overall bodily exposure to the radioisotope.
Several isotopes have been used for the development of immunoPET as an imaging technique in the clinical setting.[7] The focus of this paper will be the complexation of four positron-emitting radioisotopes (89Zr, 64Cu, 86Y, and 124I) to their most common chelators and the provision of adaptions from the literature with some chelate–antibody examples. The methodology described in examples below for each ligand, chelator, and radionuclide combination could be seamlessly adapted to a variety of macromolecules where the described chelator–radionuclide combination is used.
2. Materials
2.1. Radionuclides
89Zr can be obtained from commercial sources or produced by in-house cyclotrons.[8]
64Cu can be produced in an in-house cyclotron [9] or obtained from commercial/academic sources.
86Y can be produced in an in-house cyclotron [10] or obtained from commercial/academic sources.
124I can be produced in an in-house cyclotron or obtained from commercial sources.
2.2. Bifunctional Chelators
2.3. Antibodies (Ligands)
Trastuzumab (HERCEPTIN®; Roche).
Pembrolizumab (Merck).
Cetuximab (Merck).
Onartuzumab (Genentech).
L19-SIP (Bayer Schering Pharma).
B43.13 antibody from B43.13 hybridoma.
J591.
9E7.4 was produced by the researchers using a hybridoma model.
Hu3S193.
2.4. Buffer preparation
General instructions on how to make 1L of any buffer:
Weigh the required amount of buffering compound (see below for amounts).
Dissolve it in around 800 mL of Ultrapure water (18 MΩ-cm at 25 °C; see Note 1) in a 1 L beaker or Erhlenmeyer flask (see Note 2).
Using a pH-meter, measure the pH of the solution and adjust it to the desired pH by adding aliquots of 1 M HCl (to lower the pH) or 1 M NaOH (to increase the pH).
Transfer the solution to a volumetric flask and add water up to the line to make 1 L and mix gently (see Note 3).
Transfer 250 mL of the buffer to a 500 mL beaker or Erhlenmeyer flask and place a magnetic stirring bar.
Add 12.5 g of the Chelex resin to the buffer and place the flask on a magnetic stir plate for a minimum 1 hour (see Note 4).
Decant or filter the buffer to a clean flask to remove the resin (see Note 5).
2.5. Buffers
0.1 M sodium bicarbonate, pH 8.7: Weigh 8.401 g for 1 L, or 0.8401 g for 100 mL.
50 mM Ethylenediaminetetraacetic acid (EDTA), pH 5 and pH 6: Weigh 14.612 g EDTA for 1 L, or 1.4612 g EDTA for 100 mL.
50 mM sodium acetate, 200 mM sucrose, pH 5.4–5.6: Weigh 4.1015 g sodium acetate and 68.460 g sucrose for 1 L, or 0.4102 g sodium acetate and 6.8460 g sucrose for 100 mL.
0.5 M 4-(2-Hydroxyethyl)piperazine-1-ethanesulfonic acid, N-(2-Hydroxyethyl)piperazine-N′-(2-ethanesulfonic acid) (HEPES) buffer, pH 7, pH 7.4, and pH 7.5: Weigh 119.15 g HEPES for 1 L, or 11.915 g HEPES for 100 mL.
50 mM Diethylenetriaminepentaacetic acid (DTPA). Weigh 19.6675 g DTPA for 1 L, or 1.9668 g DTPA for 100 mL.
0.9% saline, 5 mg/mL hydroquinonecarboxylic acid (gentisic acid).
0.25 M sodium acetate, 5 mg/mL gentisic acid: Weigh 20.5075 g sodium acetate for 1 L, or 2.0508 g sodium acetate for 100 mL.
1 M HEPES buffer, 0.1 M sodium carbonate, pH 8.5: Weigh 238.3 g HEPES and 10.599 g sodium carbonate for 1 L, or 23.83 g HEPES and 1.0599 g sodium carbonate for 100 mL.
1 M HEPES buffer, pH 7.5 – 8.0: Weigh 238.3 g HEPES for 1 L, or 23.83 g HEPES for 100 mL.
0.1 M ammonium acetate buffer, pH 5.5, pH 6, pH 8.0, and pH 8.2: Weigh 7.708 g ammonium acetate for 1 L, or 0.7708 g ammonium acetate for 100 mL.
0.1 M EDTA, pH 8: Weigh 29.224 g EDTA for 1 L, or 2.9224 g EDTA for 100 mL.
0.1 M HEPES buffer, pH 8.5: Weigh 23.83 g HEPES for 1 L, or 2.383 g HEPES for 100 mL.
0.3 M sodium carbonate: Weigh 31.797 g sodium carbonate for 1 L, or 3.1797 sodium carbonate for 100 mL.
0.3 M sodium acetate, pH 7: Weigh 24.609 g sodium acetate for 1 L, or 2.4609 g sodium acetate for 100 mL.
2.5 M ammonium acetate, pH 7: Weigh 192.7 g ammonium acetate for 1 L, or 19.27 g ammonium acetate for 100 mL.
10 mM EDTA, pH 7: Weigh 2.9224 g EDTA for 1 L, or 0.2922 g EDTA for 100 mL.
0.1 M citrate, pH 4.5: Weigh 29.410 g sodium citrate dihydrate for 1 L, or 2.9410 g sodium citrate dihydrate for 100 mL.
0.1 M sodium acetate, pH 5: Weigh 8.203 g sodium acetate for 1 L, or 0.8203 g sodium acetate for 100 mL.
3 M ammonium acetate, pH 5: Weigh 231.24 g ammonium acetate for 1 L, or 23.124 g ammonium acetate for 100 mL.
0.5 M disodium phosphate, pH 7.4: Weigh 70.98 g disodium phosphate for 1 L, or 7.098 g disodium phosphate for 100 mL.
0.1 M disodium phosphate, pH 6.8: Weigh 14.196 g disodium phosphate for 1 L, or 1.4196 g disodium phosphate for 100 mL.
0.9 % NaCl, 5 mg/mL ascorbic acid, pH 5.
0.02 M citrate, pH 5: Weigh 5.882 g sodium citrate dihydrate for 1 L, or 0.5882 g sodium citrate dihydrate for 100 mL.
0.05 M disodium phosphate, 0.15 M NaCl, pH 6.8: Weigh 7.098 g disodium phosphate and 8.766 g NaCl for 1L, or 0.7098 g disodium phosphate and 0.8766 g NaCl for 100 mL.
2.6. Other aqueous solutions
10 mM EDTA: Weigh 2.9224 g EDTA for 1 L, or 0.29224 g EDTA for 100 mL.
1 M sodium carbonate: Weigh 105.99 g sodium carbonate for 1 L, or 10.599 g sodium carbonate for 100 mL.
0.1 M sodium carbonate: Weigh10.599 g sodium carbonate for 1 L, or 1.0599 g sodium carbonate for 100 mL.
2 M sodium carbonate: Weigh 211.98 g sodium carbonate for 1 L, or 21.198 g sodium carbonate for 100 mL.
0.9 % NaCl.
Phosphate Buffered Saline (PBS) pH 7.4 (137 mM NaCl, 2.7 mM KCl, 10 mM Na2HPO4, and 1.8 mM KH2PO4).
25 mg/mL ascorbic acid.
2.7. General reagents
Water.
Sodium bicarbonate.
Dimethyl sulfoxide (DMSO).
Sodium carbonate.
Ethylenediaminetetraacetic acid (EDTA).
Sodium acetate.
Sucrose.
4-(2-Hydroxyethyl)piperazine-1-ethanesulfonic acid, N-(2-Hydroxyethyl)piperazine-N′-(2-ethanesulfonic acid) HEPES.
Diethylenetriaminepentaacetic acid (DTPA).
Hydroquinonecarboxylic acid (gentisic acid).
Ammonium acetate.
Sodium citrate dihydrate.
Ascorbic acid.
Disodium Hydrophosphate.
Sodium Chloride.
Chelex-100.
2.8. Consumables
Centrifugal filters Vivaspin 30 kDa.
Centricon 100.
Amicon Ultra-4.
IODO-GEN.
Acrodisc filters.
Silica-gel impregnated glass fibers.
10-DG columns.
Sephadex G-25M PD10 desalting columns.
Superdex™ 200 10/300 GL size exclusion column.
Instant thin layer chromatography (iTLC) silica glass fiber paper.
Lo-bind protein tubes.
2.9. Instruments
Thermomixer.
Nanodrop or similar spectrophotometric device.
3. Methods
3.1. How to perform a radio-TLC and determine the radiochemical yield (Adapted from Zeglis, et al. [13])
Spot 37 kBq (1 μCi) of the radiolabeling reaction mixture on a 1 cm-wide silica-impregnated TLC strip (see Note 6).
Allow the sample dot to dry.
Gently, place the strip in a chamber containing the mobile phase (usually EDTA or DTPA at pH 5.5).
Allow the solvent to run until the leading edge reaches around 1 cm from the top edge of the paper (see Note 7).
Analyze the TLC strip using a radio-TLC scanner (see Note 8).
Radiolabeled immunoconjugates will remain at or close to the spotted location. Free unbound radioactive isotopes will travel with the solvent front.
- Calculate the radiolabeling yield of the reaction by integrating the radio-chromatogram using the following equation:
3.2. Getting your reaction mixture ready for syringes:
If your reaction mixture shows a labeling of 100%, you may not need further workup in the reaction mixture to prepare the syringes (see Note 9).
If your radiolabeling yield is not 100%, two methods could be used to get rid of the free radioactive ions in the reaction mixture: filtering the reaction using a centrifugal filter system with an appropriate molecular weight cutoff (MWCO) or a prepackaged PD-10 desalting column to exchange the buffer system (see Note 10).
Pipette the reaction mixture into the filter part of the centrifugal filter system, add buffer to reach 500 μL, snap close and place in the centrifuge with the appropriate counterweight (if needed). Run the centrifuge up to a maximum of 14000 × g for 10 minutes. Around 100 μL of radiolabeled antibody solution will remain in the filter part.
To check the purity and the efficiency of the filtering part, run an iTLC of the antibody fraction to assure that there is no longer free radionuclide ions.
Usually one to two washes through the filter gets rid of all free ions.
3.3. Preparation of syringes
The syringes can become a source of lost activity by attracting antibodies to stick to the plastic. A way to overcome this is to “block” or pretreat the syringes with PBS with 1% FBS.
Running the radioimmunoconjugate solution through a 0.2 μm filter is a good practice to assure that injection can be as sterile as possible.
As a delivery control for immunoPET studies, an isotype control IgG similarly modified with the chelator and labeled with the radioisotope choice should be used for in vitro and in vivo studies.
3.4. Storing antibody and antibody conjugates
Upon receipt of the antibody, thaw and spin the vial to assure that any antibody present in the cap or in the walls is pulled down to the bottom of the vial.
A good lab practice is to measure the concentration and compare it to the one recorded in the documentation provided by the supplier or the collaborators providing the antibody.
Freeze-thaw cycles affect the integrity of the antibody or the antibody conjugate. It is important to aliquot the bulk stock solution. A good rule of thumb amount should be to aliquot the amount that you would use per experiment. In other words, aliquot the amount of antibody that could be used in one in vivo experiment and freeze. Usually a cage of mice has 5 mice, thus aliquots could be made to be used per cage of mice.
The abcam Antibody Storage guide notes that storing the antibodies in a −20°C freezer vs a −80°C one has no particular advantage. However, they recommend that antibody storage should be in a freezer area with minimal fluctuations in temperature (think the back of the freezer rather than the door).
Once aliquots are thawed, they should not be refrozen. According to the abcam Antibody Storage guide, these aliquots should remain stable and usable for 1–2 weeks when stored at +4°C.
If the concentration of the antibody or antibody-chelator is too diluted for either the chelator addition to the antibody or the radiolabeling step, a centrifugation step with an ultrafiltration tube with an appropriate MWCO can help concentrate the sample.
3.5. Further considerations for ImmunoPET experiments
As a delivery control for immunoPET studies, an isotype control IgG similarly modified with the chelator and labeled with the radioisotope choice should be used for in vitro and in vivo studies.
To determine the number of chelators per antibody, a MALDI-TOF-MS analysis can be performed to compare the immunoconjugate vs. the unreacted antibody.
For in vivo experiments, unlabelled antibody can be added to achieve a total mAb dose of 100 μg per mouse.
3.6. Making a calibration curve
Calibration curves are a great way to determine the concentration of a sample by comparing with a standard measurement of stock solutions at a set range of concentrations. The way a calibration curves works is by determining the linear correlation between concentration of an analyte and a certain physical measurement such as absorbance. For this specific method, the Nanodrop will be the instrument referenced.
Make 7 solutions of the desired antibody in different concentrations. Usually a good spread of concentrations should be between 5 mg/mL and 0.1 mg/mL. For example: 5, 2.5, 1.25, 0.625, 0.3125, 0.156, 0.08 mg/mL.
Place 2 μL in the measurement pedestal and gently lower the arm of the instrument. The drop should bead up. If it flattens out, the pedestal should be delicately cleaned with deionized water and a KimWipe.
Measure the absorbance of the sample at 280 nm.
Raise the arm, and clean the pedestal with water and a kimwipe.
Repeat the steps 2–4 for the other concentrations.
Once all samples are measured, plot the data in a graph with x-axis “Concentration” and y-axis “absorbance” and add a linear regression to determine the equation of the linear regression.
The equation will be used to determine the concentration of an unknown sample.
The figures referenced in the title of each complexation methods shows a representative PET image of the probe.
3.7. [89Zr]Zr-DFO-MAb-B43.13 [14] (Figure 1)
Figure 1:
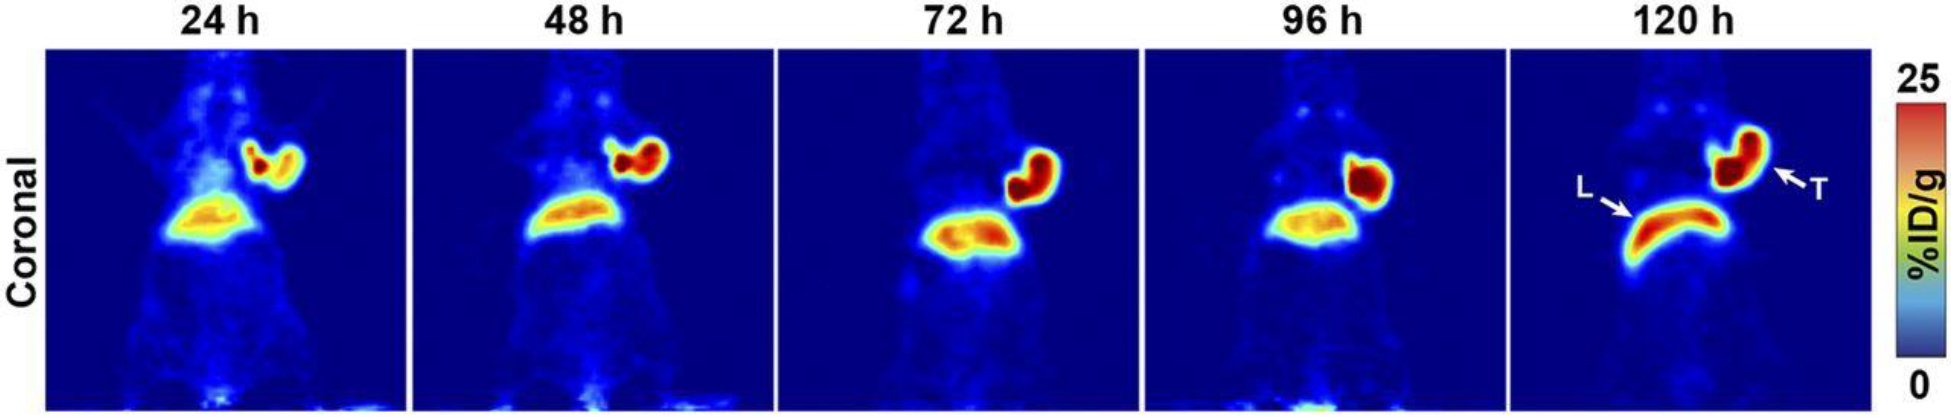
PET imaging with 89Zr-DFO-mAb-B43.13. PET images of an athymic nude mouse bearing a CA125-positive OVCAR3 xenograft after the administration of 89Zr-DFO-mAb-B43.13 via tail vein injection (10.2–12.0 MBq). Coronal planar images intersect the middle of the tumor. L = liver; T = tumor. This adapted figure was originally published in the Journal of Nuclear Medicine, issue 57(5). (Sharma et al. 2016)
Mix a known amount of the B43.13 antibody with a 10-times molar excess of p-SCN-DFO in a 0.1 M sodium bicarbonate buffer at pH 8.7 (see Note 11).
Allow the antibody-DFO mixture to react for 1 hour at 37 °C.
Purify the reaction mixture using a Sephadex G-25 M PD-10 desalting column previously equilibrated with phosphate buffered saline (PBS) at pH 7.4 (see Note 12).
Measure between 74–95 MBq (2–2.5 mCi) of zirconium-89 oxalate ([89Zr]Zr(C2O4)2) in oxalic acid.
Adjust the [89Zr]Zr(C2O4)2 solution to pH 7.0–7.5 using small aliquots of 1.0 M sodium carbonate solution. To adjust the pH of the 89Zr solution, start by adding 250 μL of 1.0 M Na2CO3 followed by smaller (< 10 μL) aliquots of the Na2CO3 solution.
Dissolve 300–400 μg of DFO-MAb-B43.13 in 200 μL of PBS buffer at pH 7.4.
Pipette the pH-adjusted zirconium solution into the DFO-labeled B43.13 solution and incubate this reaction mixture for 1 hour at room temperature.
Monitor the reaction via radio-thin layer chromatography (radio-TLC) using silica-impregnated paper and 50 mM EDTA at pH 5.
After 1 hour, quench the reaction with 50 μL of 50 mM EDTA at pH 5 (see Note 13).
Assess the radiochemical purity of the eluate by radio-TLC using 50 mM EDTA at pH 5 as the mobile phase (see Section 3.1).
3.8. [89Zr]Zr-DFO-trastuzumab [15] (Figure 2)
Figure 2: Site-specific 89Zr-DFO-trastuzumab PET/CT imaging in PDX models with varying HER2 expression.
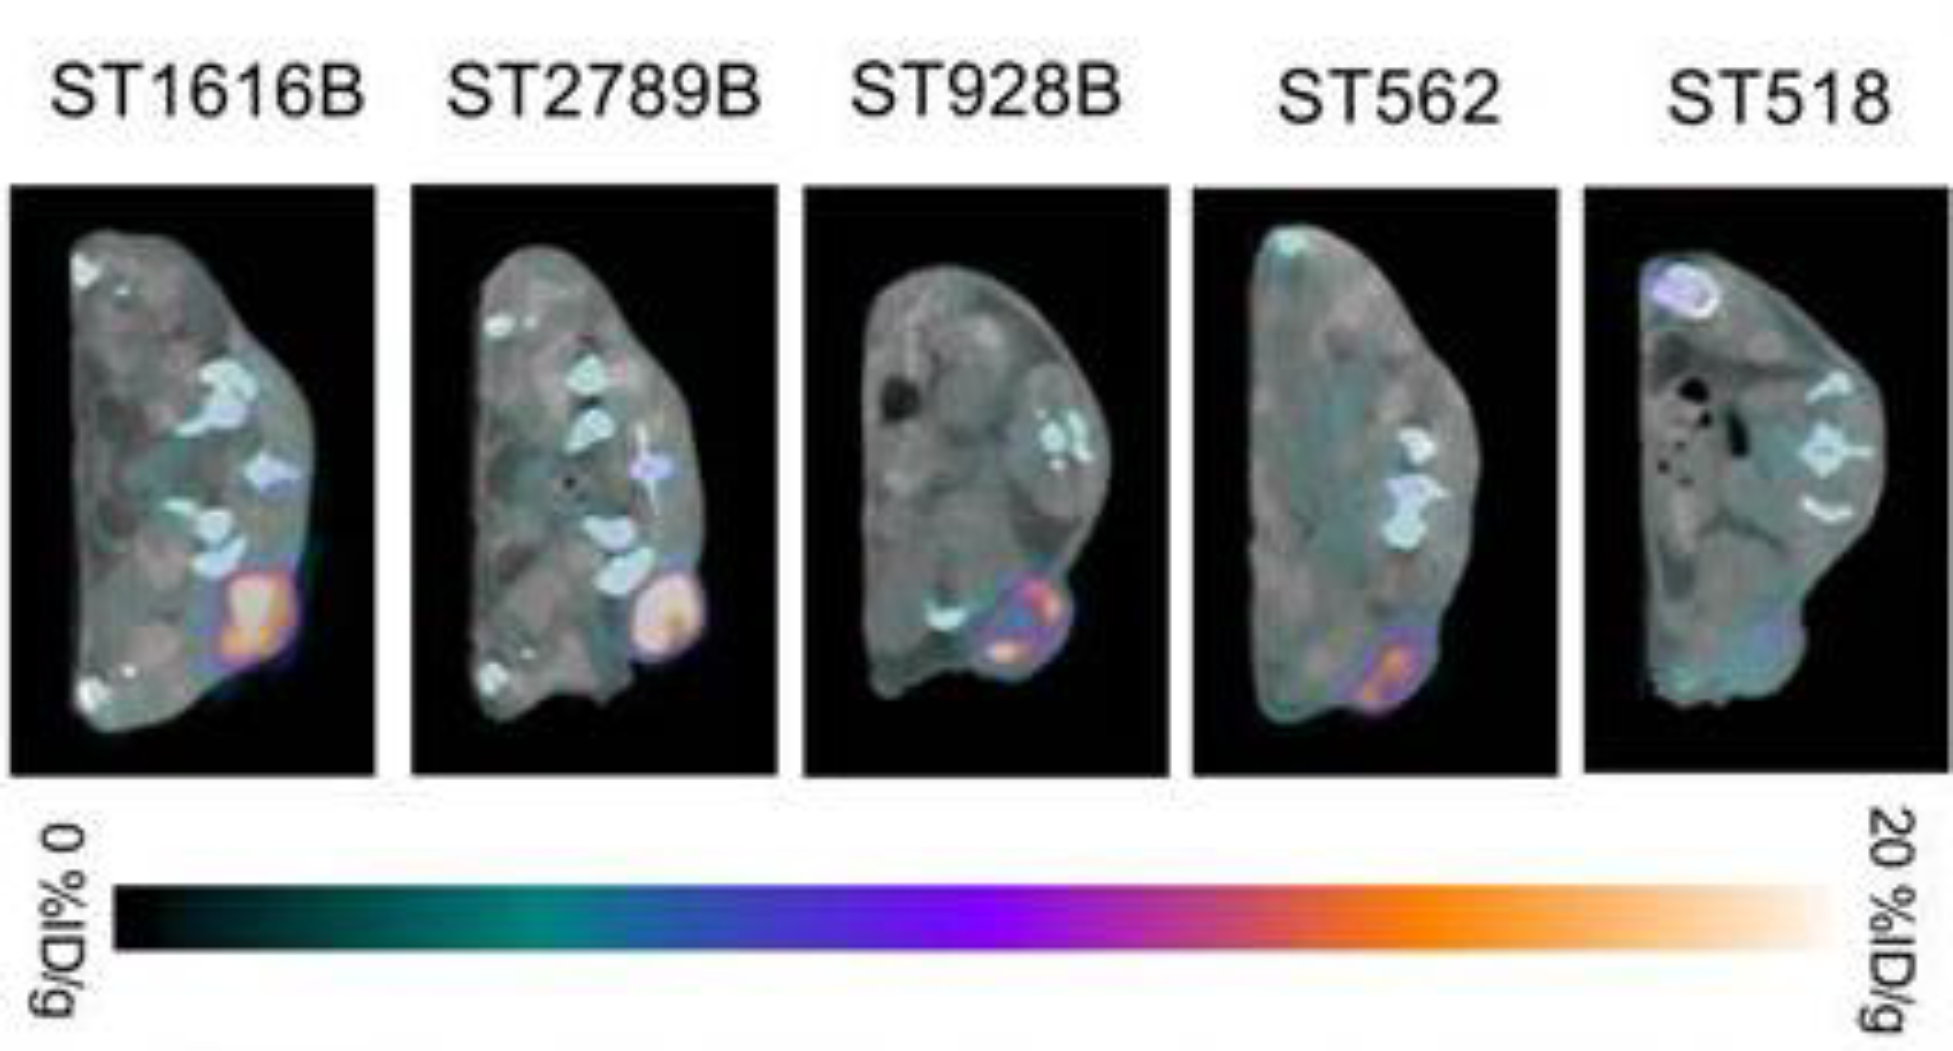
Representative axial PET/CT images of 89Zr-DFO-trastuzumab (endoS2) tumor uptake in ST518 (breast), ST562 (gastric), ST928B (breast), ST2789B (breast) and ST1616B (breast) PDX models 70 hours post-injection. This adapted figure was originally published in the journal Theranostics, issue 9(15). (Kristensen et al. 2019)
Dissolve 5 mg of trastuzumab (33 nmol) in 1 mL of 0.9% NaCl to a concentration of 5 mg/mL and adjust the pH of the solution to 8.9–9.1 with 0.1 M sodium carbonate.
Add 20 μL of a 5 mM p-SCN-DFO in DMSO to the trastuzumab solution. (see Note 11)
Allow the mixture to react for 45 mins at 37 °C. Keep the DMSO concentration below 2% in all the reaction mixtures.
Purify the reaction mixture using a PD-10 column and 50 mM sodium acetate and 200 mM sucrose (pH 5.4–5.6) buffer as the solvent. Collect fractions of the eluent.
Measure the concentration of DFO-trastuzumab using a Nanodrop and a previously-established calibration curve (see Section 3.6).
Mix 200 μL of [89Zr]-Zr oxalate in 1 M oxalic acid solution with 90 μL of a 2 M sodium carbonate solution and allow to equilibrate for 3 minutes.
Dissolve around 1.5 mg of DFO-NCS-trastuzumab in 0.5 M HEPES buffer (pH 7.0) to reach a volume of 1.71 mL.
Mix the [89Zr]-Zr oxalate solution and the DFO-NCS-trastuzumab solution and allow the reaction to progress for 60 minutes at room temperature under constant agitation.
Purify the [89Zr]Zr-DFO-NCS-trastuzumab immunoconjugate reaction mixture using a PD-10 column and collect in 2 mL of 50 mM sodium acetate and 200 mM sucrose buffer at pH 5.4–5.6. Using HPLC, the radiolabelling yield is usually 80–85 % with a concentration of 0.6 mg/mL.
3.9. [89Zr]Zr-DFO-SCN-cetuximab [16] (Figure 3)
Figure 3:
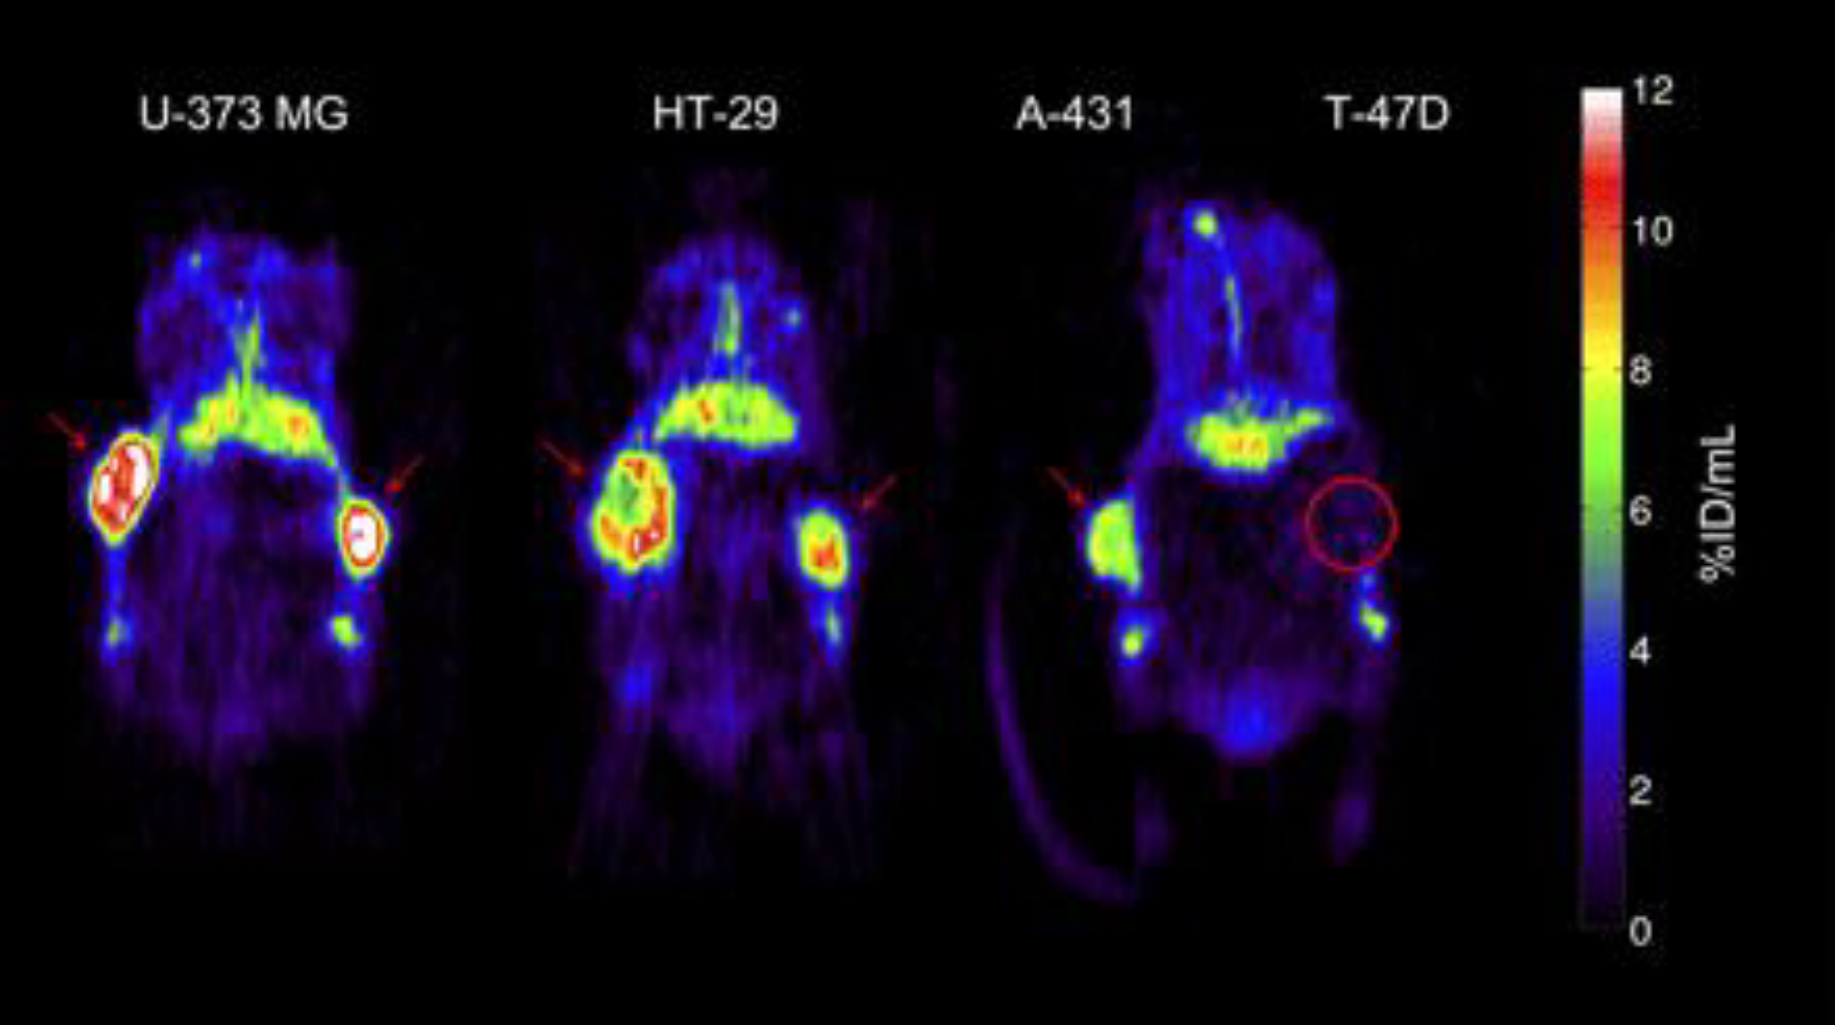
Representative small-animal PET images 72 h after injection of 89Zr-cetuximab. Mouse bearing U-373 MG (left) or HT-29 (center) tumors in both flanks. Mouse (right) bearing A-431 and T-47D (circled) tumor in right and left flanks, respectively. Red arrows indicate tumors. Images at mid-plane cross-section through tumor are shown. Images are corrected for injected dose and decay, represented as %ID/mL. High uptake is found in EGFR-expressing tumors (HT-29, U-373 MG, A-431), whereas uptake of low-expression tumor (T-47D) is comparable with overall uptake in surrounding normal tissue. 89Zr-cetuximab uptake was also found in catabolic organs: in liver and kidneys (below tumors). This adapted figure was originally published in the Journal of Nuclear Medicine, issue 50(1). (Aerts et al. 2009)
Add 30 mg of cetuximab to a PD-10 column and run through a 0.9% NaCl solution to exchange with the storage buffer (see Note 14).
Concentrate the eluate using a 30 kDa ultrafiltration centrifuge tube at 14,000 × g for 16 minutes.
Determine the final concentration using a Nanodrop or a similar spectrophotometric device and a previously established calibration curve with a cetuximab reference standard (see Section 3.6.).
Dilute 10 mg of cetuximab (66 nmol) in 1 mL with 0.9% NaCl and adjust the pH to 8.9–9.0 with 0.1 M sodium carbonate.
Add 40 μL of a 5 mM solution of p-SCN-DFO in DMSO (3 equivalents) to the cetuximab solution and allow this mixture to react for 45 minutes at 37 °C (see Note 11).
Purify the DFO-SCN-cetuximab reaction mixture using a PD-10 column and a 50 mM sodium acetate, 200 mM sucrose buffer at pH 5.4 – 5.6.
Determine the concentration of the DFO-SCN-cetuximab following Section 3.9 Step 3.
Mix 200 μL of [89Zr]-Zr oxalate in 1 M oxalic acid solution with 90 μL of 2 M sodium carbonate and allow to equilibrate for 3 minutes.
Dissolve around 1.5 mg of DFO-SCN-cetuximab in up to 1.71 mL of 0.5 M HEPES buffer at pH 7.0.
Mix both solutions and allow to react for 60 minutes at room temperature under constant agitation.
Purify the reaction mixture in a PD-10 column using a 50 mM sodium acetate and 200 mM sucrose buffer (pH 5.4–5.6).
3.10. [89Zr]Zr-DFO-J591 [13] (Figure 4)
Figure 4:
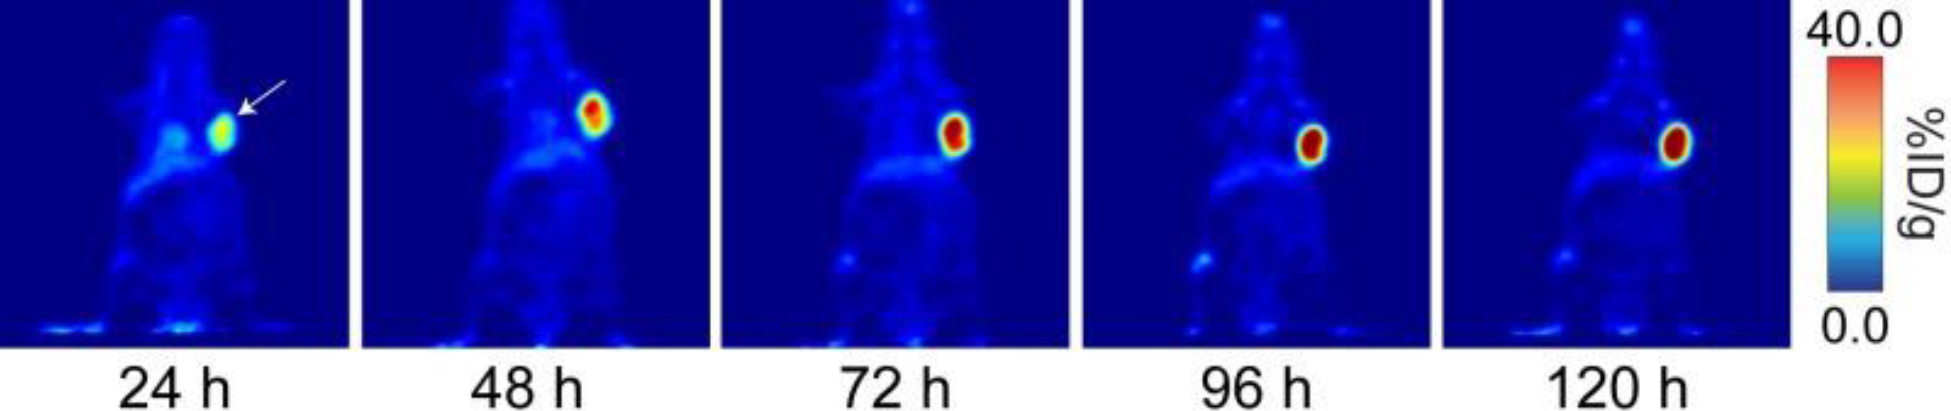
Coronal PET images of 89Zr-DFO-J591 (11.1–12.9 MBq [300–345 μCi] injected via tail vein in 200 μl 0.9% sterile saline) in athymic nude mice bearing subcutaneous, PSMA-expressing LNCaP prostate cancer xenografts (white arrows) between 24 and 120 hr post-injection. This adapted figure was originally published in the Journal of Visualized Experiments, issue 96. (Zeglis and Lewis 2015)
Prepare a 2–5 mg/mL solution of J591 in 1 mL of PBS pH 7.4 or in 1 mL of 0.5 M HEPES buffer pH 7.4 (see Note 15).
Prepare a 5–10 mM solution of DFO-NCS in dry DMSO (see Note 11).
Increase the pH of the antibody solution to 8.8–9.0 using small aliquots of 0.1 M Na2CO3.
Add a 3–4 molar excess of the DFO-NCS solution to the antibody solution and incubate for 30 min at 37 °C on a thermomixer at 350 rpm.
Purify the immunoconjugate using a pre-packed disposable size exclusion desalting column with a 50,000 kDa Molecular Weight Cut Off (MWCO) and 0.5 M HEPES buffer at pH 7.4 as the mobile phase. Measure the concentration using a spectrophotometer or NanoDrop. The J591-DFO immunoconjugate solution can be stored at −20 °C in the dark.
Prepare a solution of 0.5–2.0 mg of the immunoconjugate in 200 μL of 0.5 M HEPES buffer at pH 7.5.
Add between 37–222 MBq (1.0–6.0 mCi) of the 89Zr stock solution into a screw-cap centrifuge tube and add 1.0 M oxalic acid to reach a total volume of 300 μL.
Adjust the pH of the radioactive solution to between 6.8–7.5 using 1.0 M Na2CO3.
Add the desired amount of 89Zr4+ solution to the immunoconjugate solution and incubate for 60 min at RT on a thermomixer at 350 rpm.
Measure the radiochemical yield of the reaction using radio-TLC. If the radiolabeling yield is around 74 MBq/mg (2 mCi/mg), quench the reaction with 5 μl of 50 mM DTPA at pH 5.5 (see Section 3.1).
Run the radioimmunoconjugate reaction mixture through a pre-packed disposable size exclusion desalting column with a 50,000 MWCO with one of the following as mobile phase: 0.9% sterile saline with 5 mg/ml gentisic acid and 0.25 M sodium acetate (pH 5.5) with 5 mg/ml gentisic acid (see Note 16).
Rerun the radio-TLC to check the radiochemical purity of the 89Zr-DFO-J591 (see Section 3.1).
3.11. Copper-64 [64Cu]Cu-DOTA-Pembrolizumab [17,18] (Figure 5)
Figure 5:
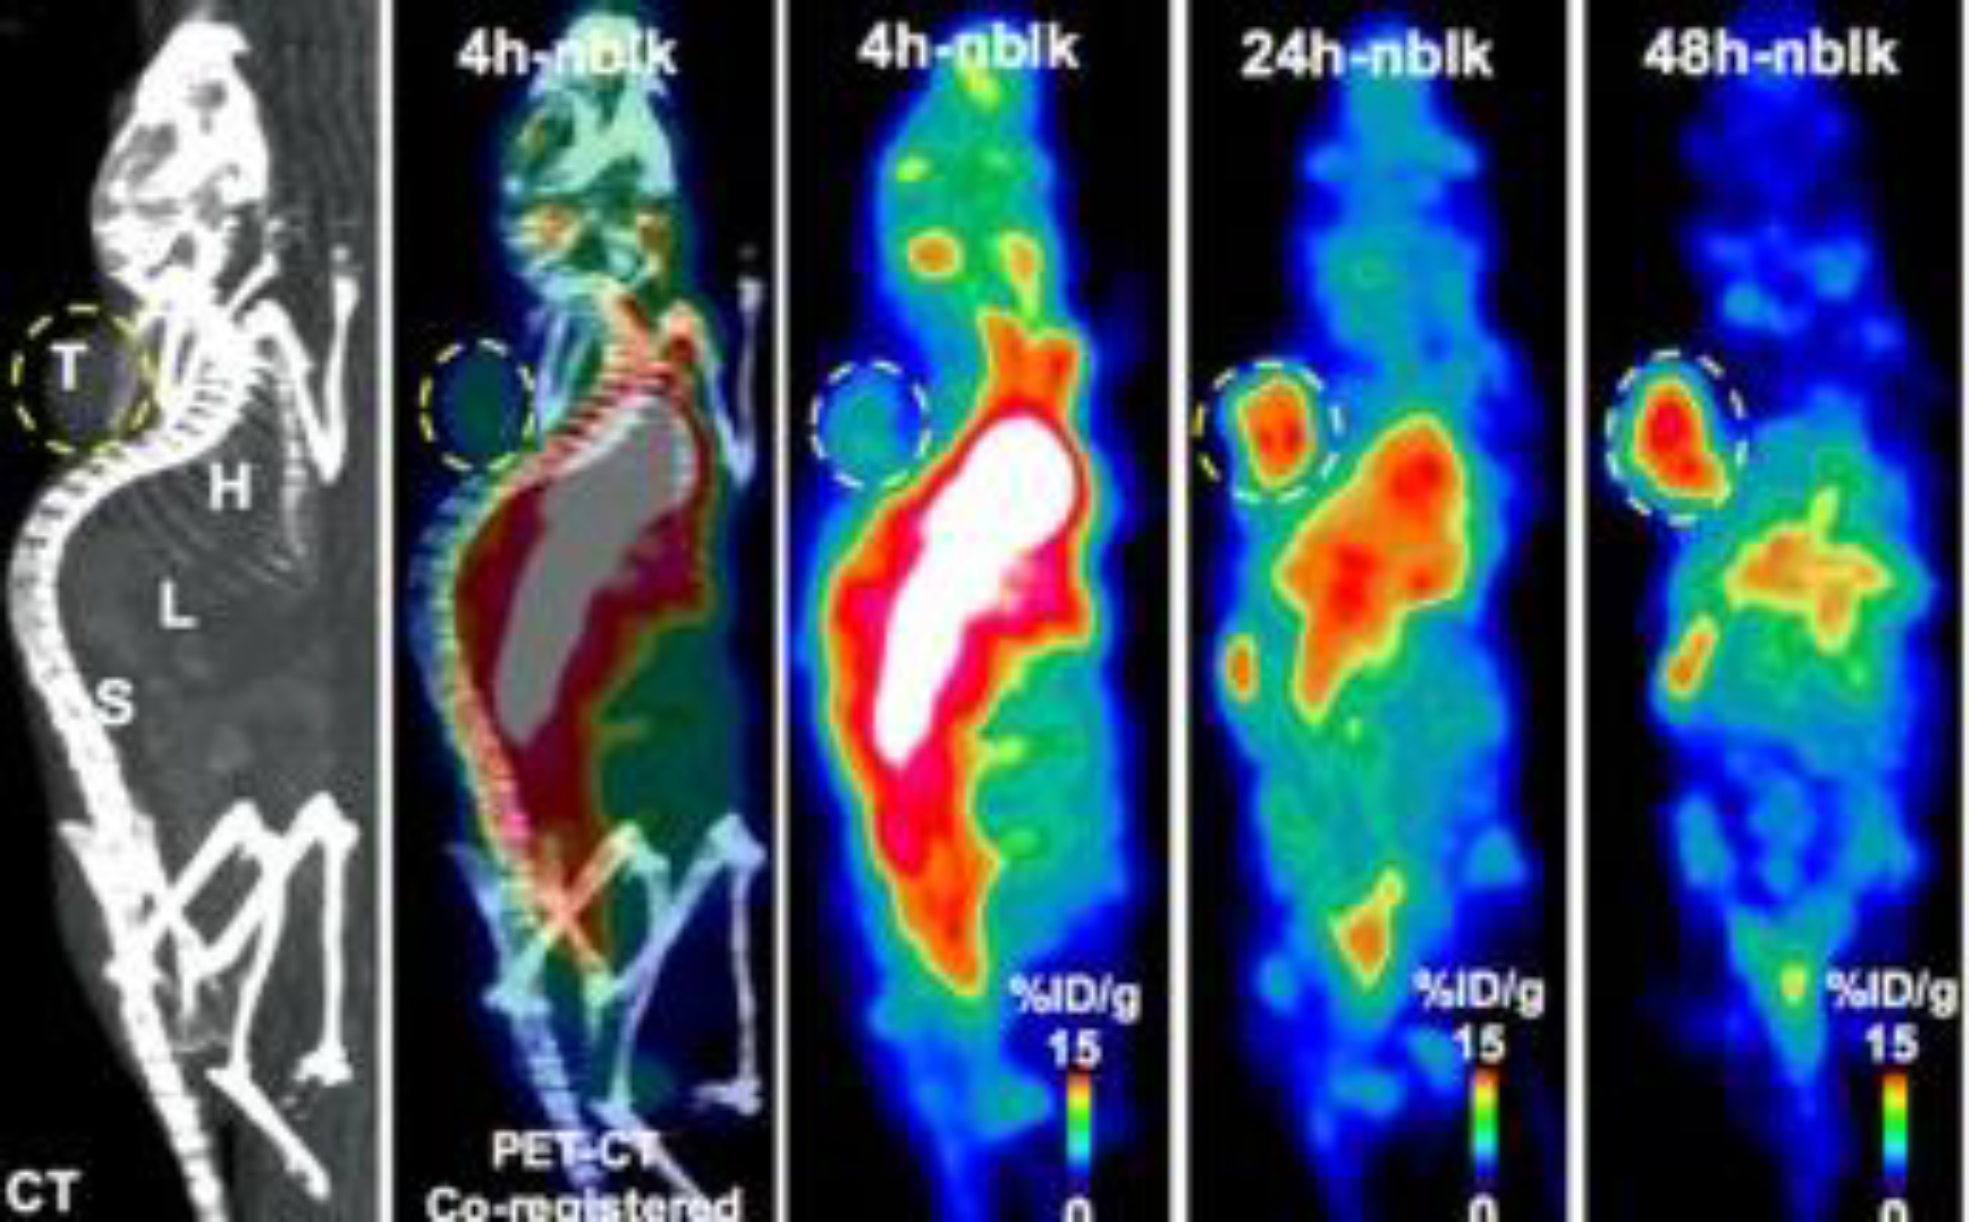
PET-CT image showing 64Cu-pembrolizumab immunoPET in NSG/293 T/hPD-1 mouse model. Representative PET images scanned at 4, 24, and 48 h post-injection of 64Cu-pembrolizumab tracer (7.4 MBq/200 μL) in NSG/293 T/hPD-1-nblk (non-blocking) mice. L liver, H heart, X xenograft, S spleen. This adapted figure was originally published in the journal Scientific Reports, issue 8(1). (Natarajan et al. 2018)
The most common chelators of copper-64 for antibody applications are DOTA, NOTA, TE2A, TE1A1P and sarcophagine.[19]
Purify the antibody using a size exclusion column HPLC with PBS at pH 8.0 (see Note 12).
Exchange the buffer of the antibody solution using 1 M HEPES and 0.1 M sodium carbonate buffer (pH 8.5 ± 0.5) (see Note 14).
Concentrate the pembrolizumab to 5 mg/mL with a 30 kDa centrifugal filter (see Note 17).
Mix 5 mg of pembrolizumab in 1 mL of 1 M HEPES buffer at pH 7.5–8.0 with 34 μL of 10 mM DOTA-NHS in DMSO using molar excess of the chelator (see Note 11).
Allow the reaction to progress for 60 min at 37°C.
Purify the antibody–chelator reaction mixture with a SEC 2000 HPLC using a mobile phase of 0.1 M ammonium acetate buffer (pH 5.5) eluted at 1 mL/min. Store the immunoconjugate in 200 μl aliquots after the centrifugal concentration in 0.1 M ammonium acetate buffer (pH 5.5) at −20 °C.
Concentrate the eluate with a 30 kDa MWCO centrifugal filter to 3–5 mg/mL (see Note 17).
Add 0.5 mg of DOTA-pembrolizumab to a reaction vial (~100 μL) and 750 μL [64Cu]CuCl2 (260–270 MBq) at pH 5.5 ± 0.5. .
Incubate the reaction mixture at 37 °C for 1 hour.
Add around 90 μL of a 0.1 M EDTA at pH 8.0 to the reaction vial for a final concentration of 10 mM and allow to react for 15 min (see Note 13).
Purify the radioimmunoconjugate, 64Cu-DOTA-pembrolizumab, using a SEC-2000 HPLC with PBS buffer as the mobile phase at a flow rate of 1 mL/min. Collect the radioimmunoconjugate at 8 ± 2 min.
Concentrate the product to 5 mg/mL using a 30 kDa MWCO centrifugal filter (see Note 17).
3.12. [64Cu]Cu-NOTA-trastuzumab [20] (Figure 6)
Figure 6:
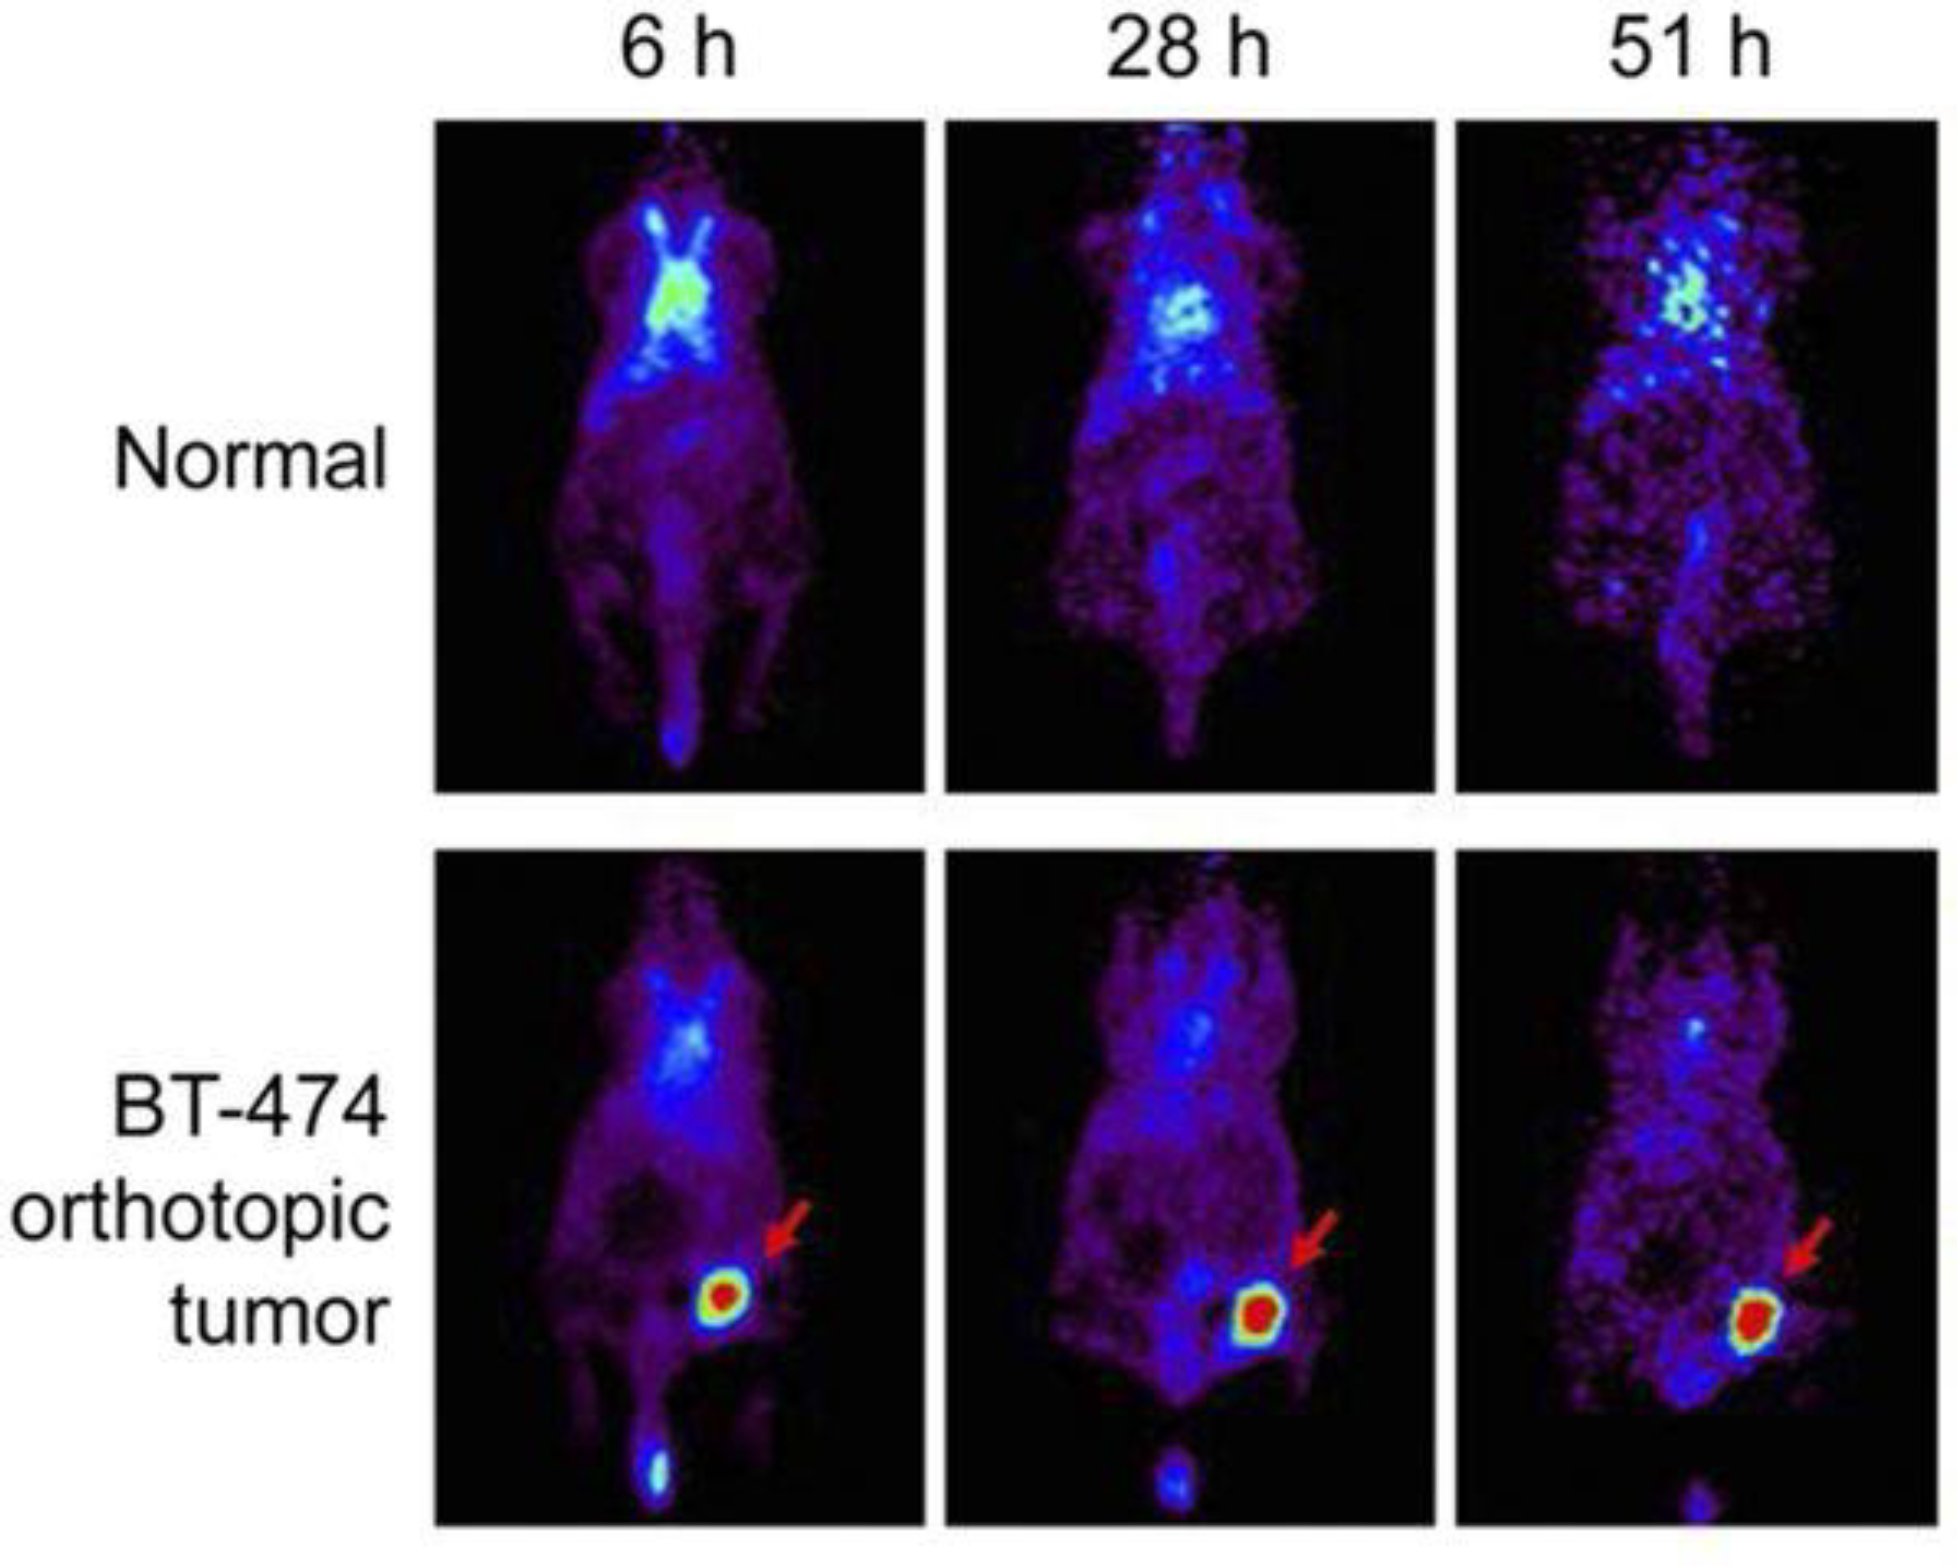
64Cu-NOTA-trastuzumab PET in orthotopic HER2-positive BT-474 breast tumor model. Tumor uptake of 64Cu-NOTA-trastuzumab was clearly visible at 6 h and peaked at 51 h. This adapted figure was originally published in the Journal of Nuclear Medicine, issue 60(1). (Woo et al. 2019)
Exchange the buffer of the trastuzumab antibody solution with 0.1 M HEPES buffer at pH 8.5 and concentrate the resulting solution to 10 mg/mL using a centrifugal concentrator (see Notes 14 and 17).
Mix the trastuzumab solution in HEPES buffer with a 20-fold molar excess of p-SCN-Bn-NOTA in 100% ethanol. Addition of ethanol solution should be done dropwise.
Incubate the reaction overnight at 4 °C.
Exchange the buffer of the reaction mixture with 0.1 M ammonium acetate buffer at pH 6 and concentrate it to 5 mg/mL using a Vivaspin-20 filter (see Notes 14 and 17).
Mix 1 mg of the newly synthesized NOTA-trastuzumab with 74 MBq (2 mCi) of [64Cu]CuCl2 and incubate the reaction mixture for 1 hour at room temperature with constant agitation.
Determine the radiolabeling yield and purity with radio-TLC using silica gel and a mobile phase of 0.1 M ammonium acetate buffer and 0.05 M EDTA at pH 6 (see Section 3.1).
3.13. [64Cu]Cu-TE2A-9E7.4 [21] (Figure 7)
Figure 7:
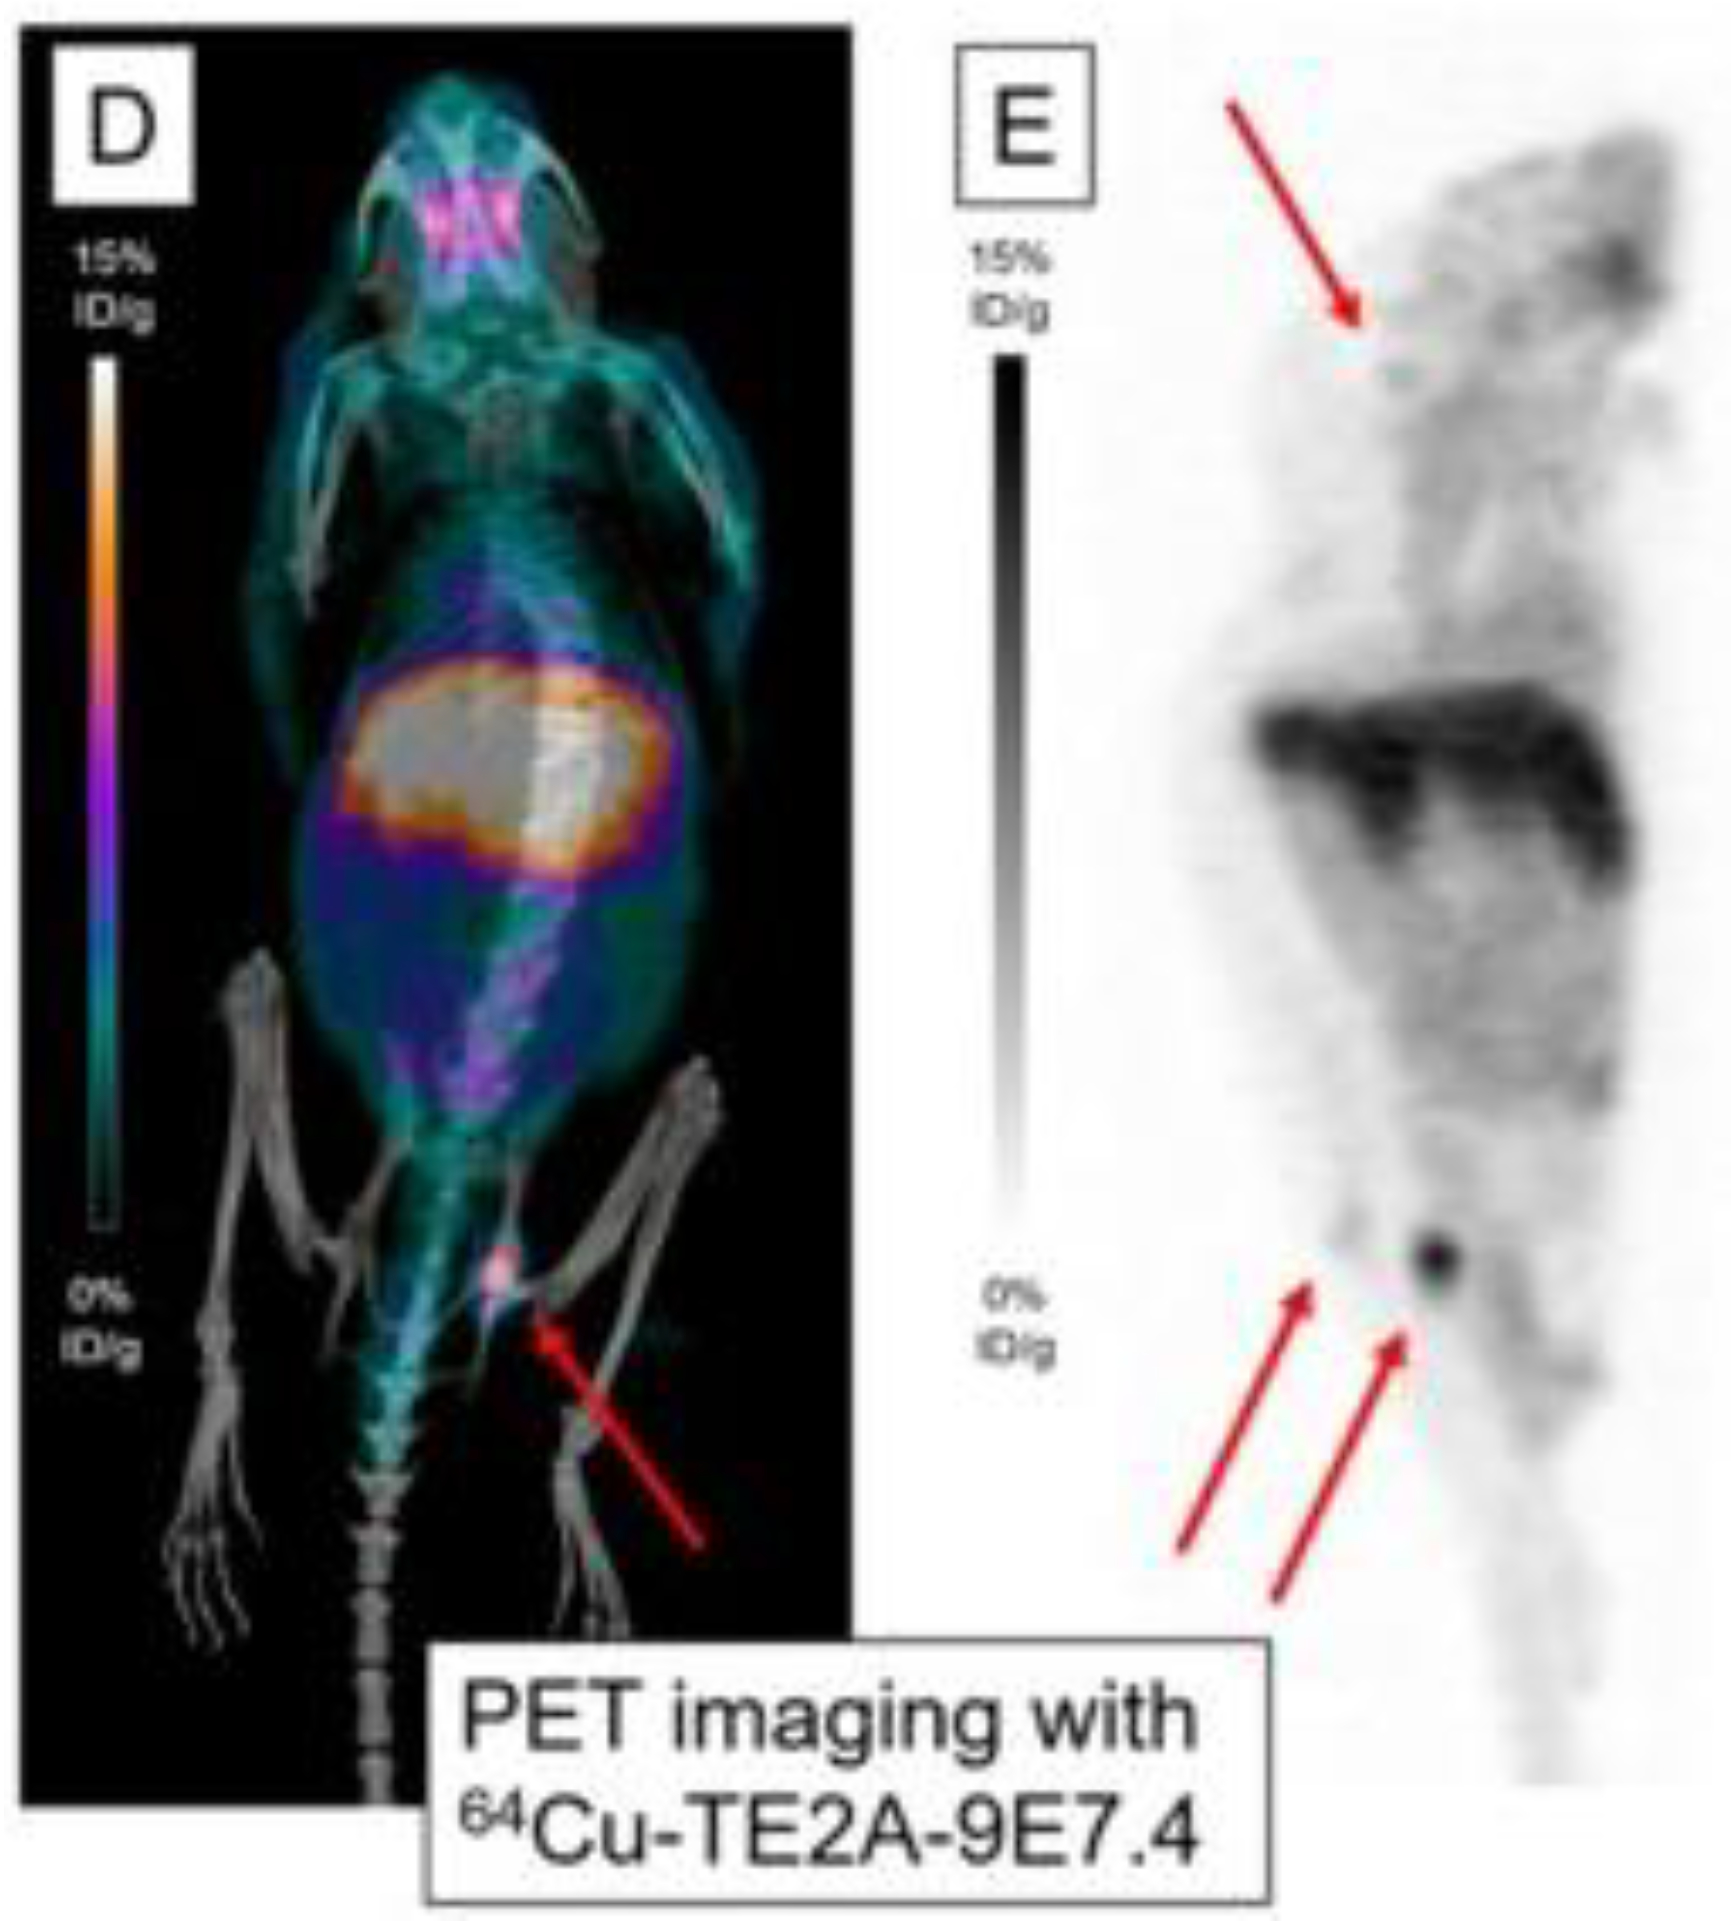
PET imaging with m showing maximum intensity projections of PET and CT imaging with 64Cu-TE2A-9E7.4 at 24 h post-injection. This research was originally published in the International Journal of Molecular Sciences, issue 20(10). (Bailly et al. 2019)
Incubate the antibody for 2 hours in a solution of 0.1 M EDTA to chelate contaminant metals.
Exchange the buffer with 0.3 M carbonate buffer at pH 8.6 and concentrate the antibody solution to 4 mg/mL using a disposable Amicon Ultra-4 filter (see Note 17).
Add 20 molar excess of TE2A-benzyl isothiocyanate (usually in a 12 mg/mL solution) to the antibody and incubate overnight at 4 °C (see Note 11).
Purify the immunoconjugate using a PD-10 disposable gel filtration column with 0.3 M ammonium acetate buffer at pH 7 and concentrate the solution using a disposable Amicon Ultra-4 filter (see Notes 12 and 17).
Add 408 MBq of [64Cu]CuCl2 in 0.1 M HCl (around 244 μL) and 60 μL of 2.5 M ammonium acetate buffer at pH 7.0 to the immunoconjugate solution and incubate for 20 minutes at 40°C.
Add 10 μL of 10 mM EDTA at pH 7 to the reaction mixture and stir for 5 minutes at 40°C (see Note 13).
Determine the radiochemical purity by thin layer chromatography radio-TLC-SG using a 0.1 M citrate buffer at pH 4.5 as the mobile phase (see Section 3.1).
Further purify the radio immunoconjugate using a Sephadex PD-10 column (see Note 12).
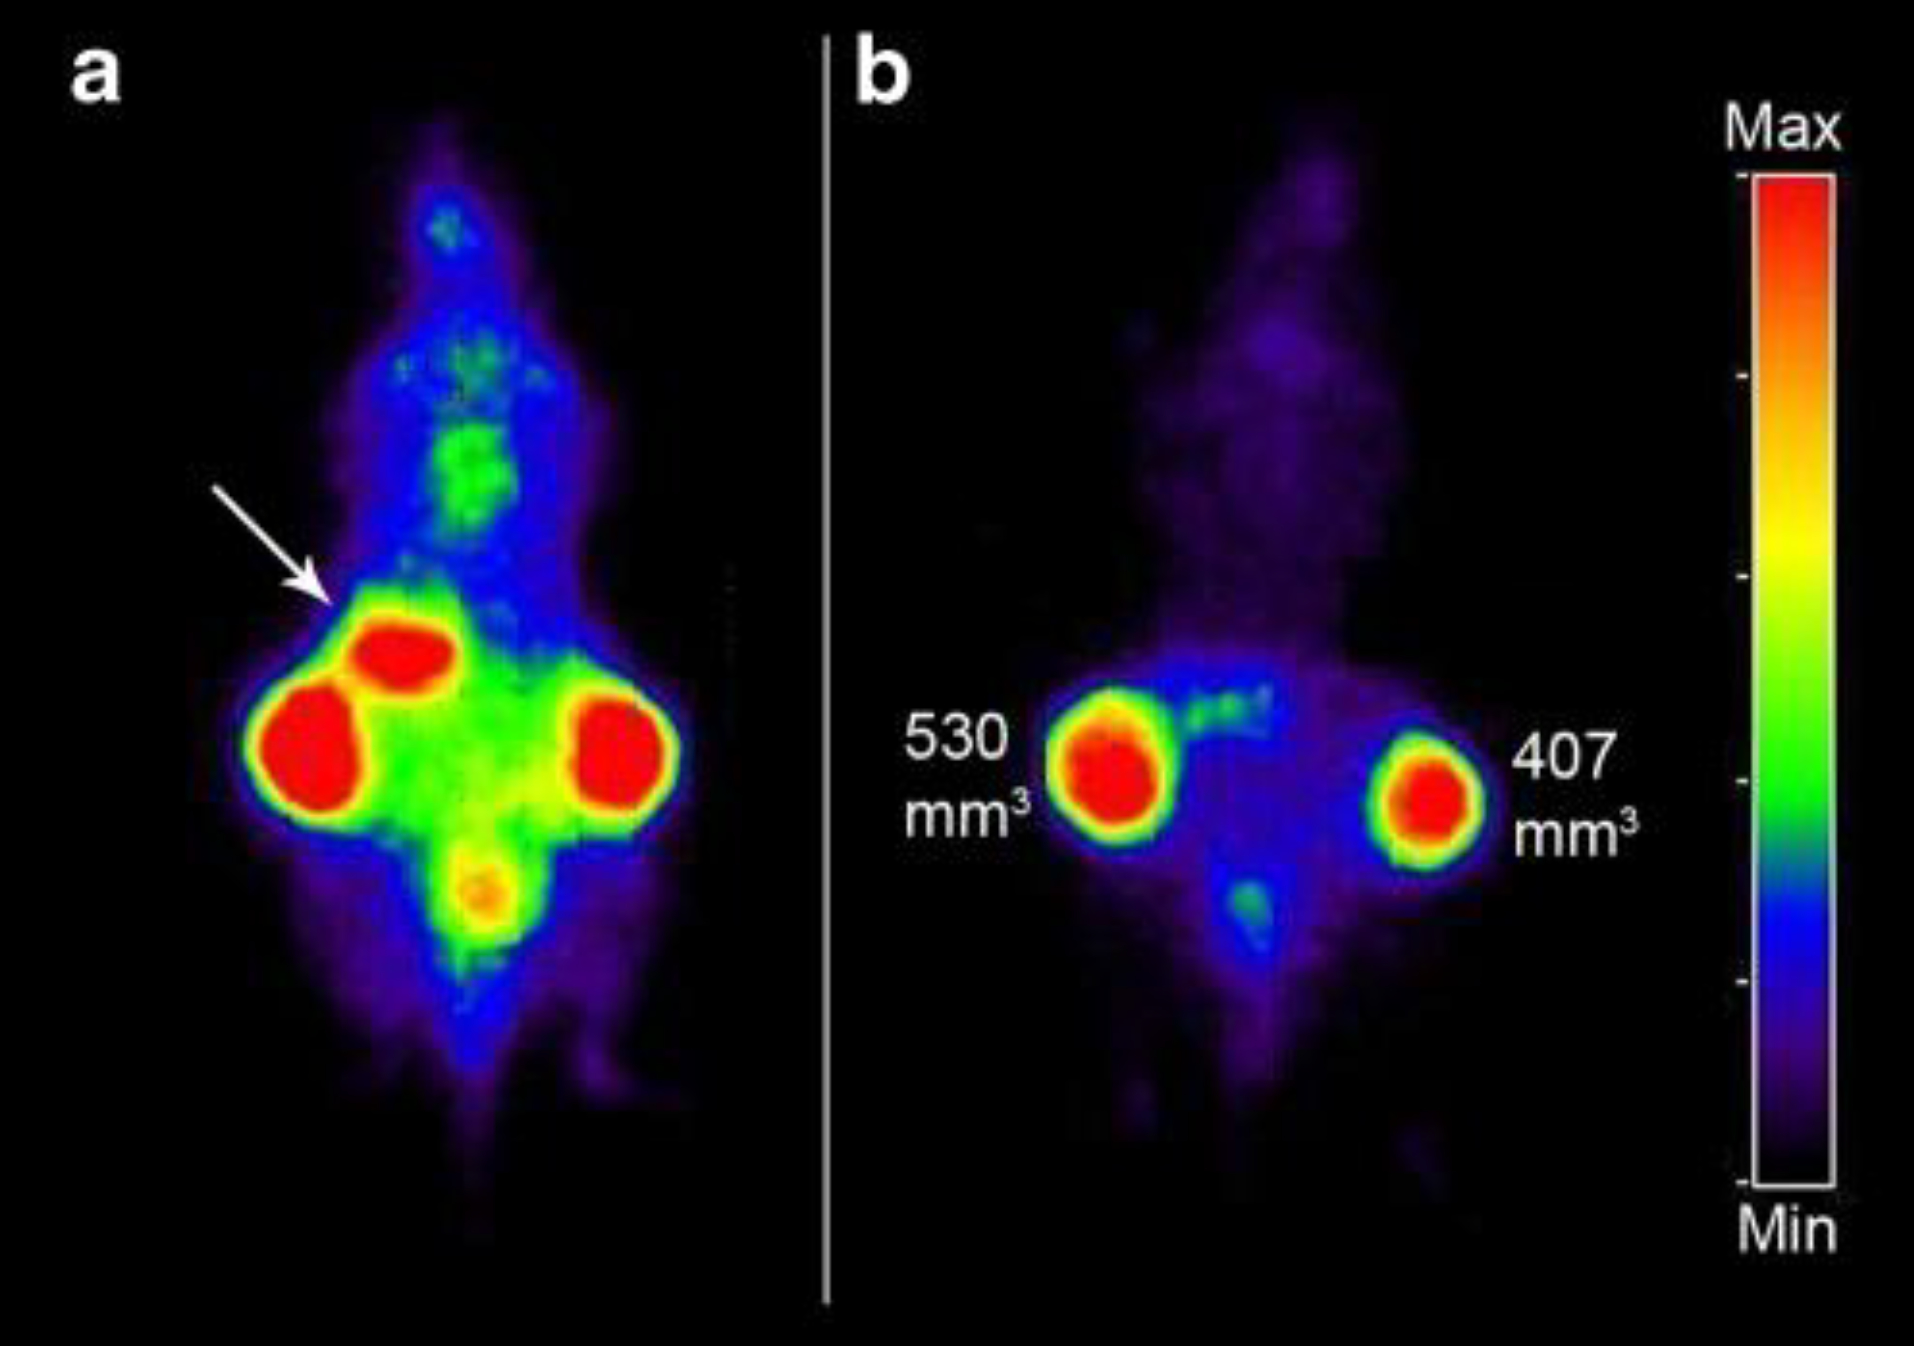
3.14. [64Cu]Cu-CB-TE1A1P-cetuximab [22] (Figure 8)
Figure 8:
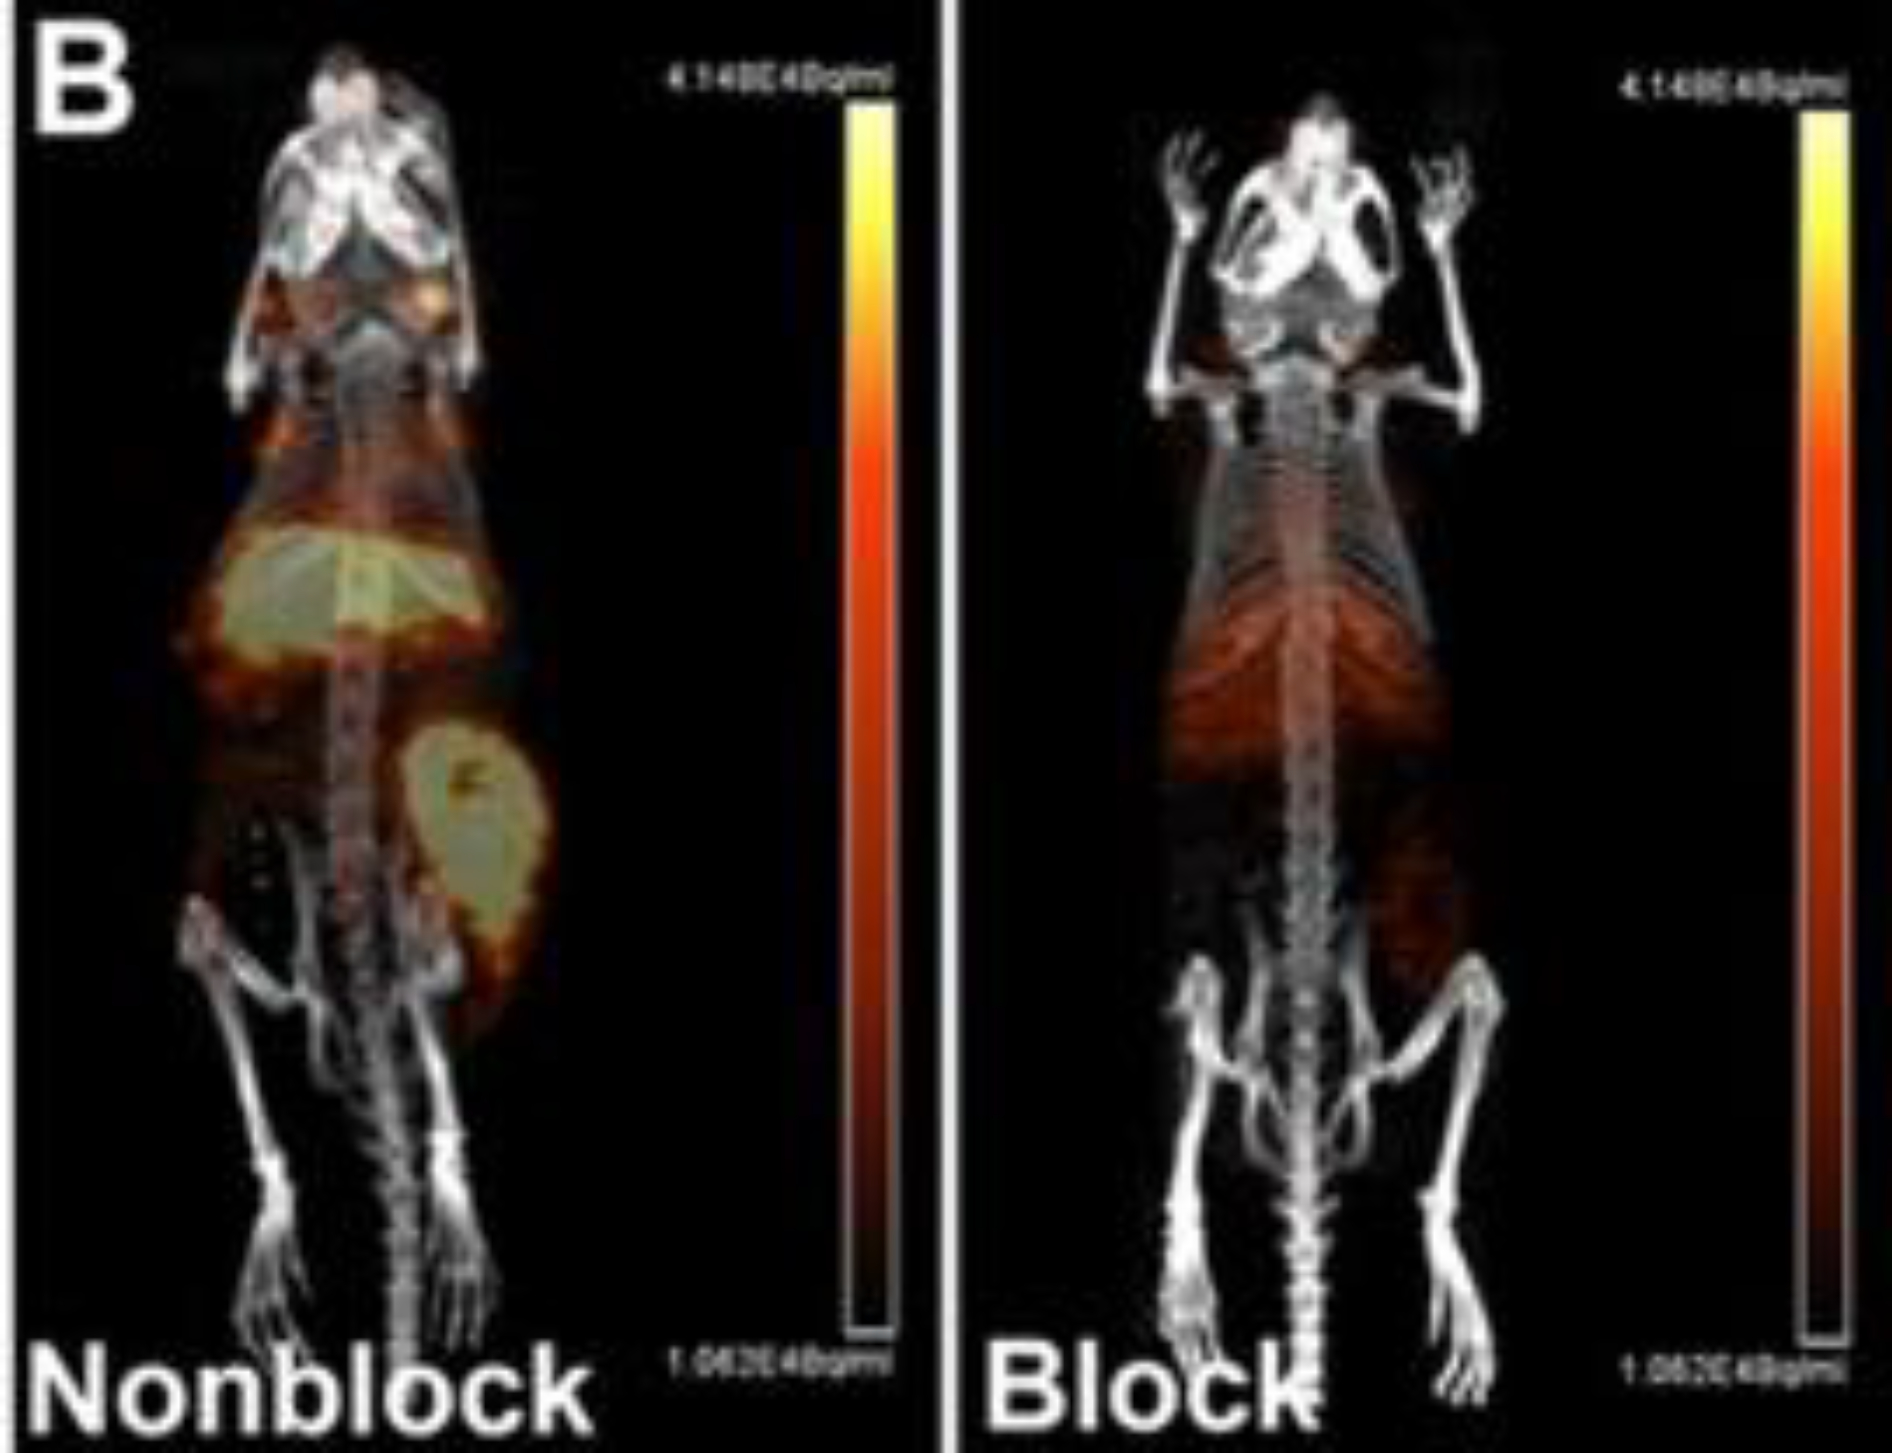
Small animal PET/CT maximum intensity projection images of HCT116 tumor bearing female nude mice at 48 h post-injection 64Cu-CB-TE1A1P–cetuximab. One group of mice was pretreated with ~166–33 equiv of unlabeled cetuximab 24 h prior to probe injection (right panel) while the other group was not pretreated (left panel). This adapted figure was originally published in Molecular Pharmaceutics, issue 11(11). (Zeng et al. 2014)
Mix 5.8 mg of CB-TE1A1P, 1.7 mg of sulfo-N-hydroxysuccinimide, and 2.0 mg of hydroxybenzotriazole (HOBT) in 1 mL of DMF and place the reaction on ice (see Note 11).
Add 2.9 mg of 1-ethyl-3-(3-(dimethylamino)propyl) carbodiimide hydrochloride (EDC) to the reaction mixture. Stir for 30 minutes to evaporate the DMF. The proportion of this activation reaction in Steps 1 and 2 is 1:1:1:1. The EDC solution degrades quickly. Therefore, the solution must be used immediately post-preparation.
Mix 2.9 mL concentrated solution of cetuximab (20 mg/mL) with the activated CB-TE1A1P to achieve a molar ration of 100:1 (CB-TE1A1P:cetuximab) and incubate the reaction for 2 days at 4 °C using an end-over-end rotation mixing method.
Transfer the reaction mixture to a Centricon 100 filter unit, wash twice with 0.1 M ammonium acetate at pH 8.0 and concentrate the immunoconjugate solution (see Note 17).
Extract unreacted small molecules by flowing the mixture through a desalting column 2–3 times (see Note 12).
Mix ~70 μL CB-TE1A1P−cetuximab (2.0 mg/mL) and 250 μL of 0.1 M ammonium acetate at pH 8.2 in a 1.5 mL tube.
Add 18.5 MBq (500 μCi) [64Cu]CuCl2 in 0.1 M ammonium acetate buffer, vortex for 10 s and incubate the reaction for 2 hours at 40 °C.
Determine the radiolabeling yield by FPLC.
3.15. [64Cu]Cu-Sar-ch14.18-ΔCH2 [23] (Figure 9)
Figure 9:
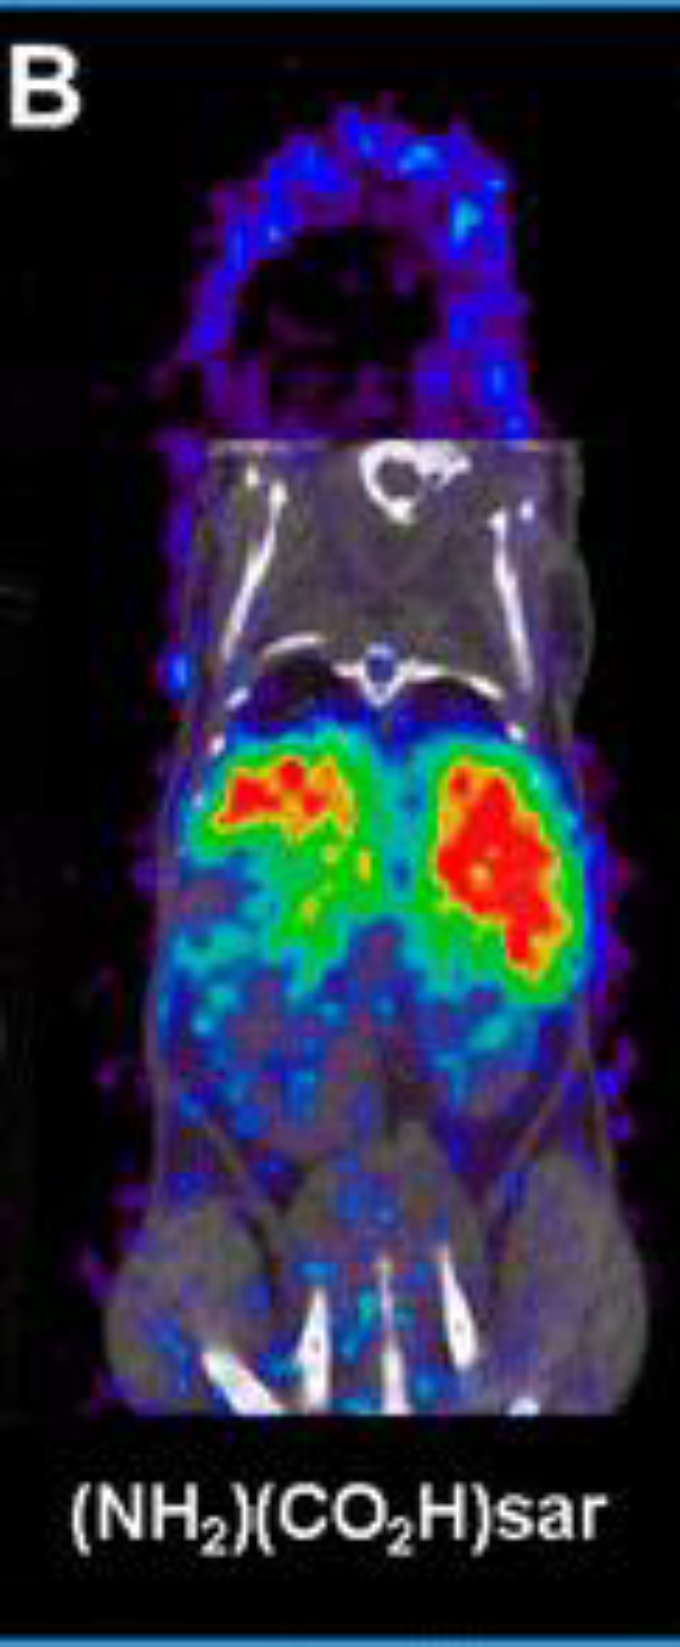
Coronal small animal PET/CT images of mice injected with ch14.18-ΔCH2 labeled with 64Cu via (NH2)(CO2H)sar at 48 h postinjection. PET data is in color scale; CT data is in gray scale. This adapted figure was originally published in Bioconjugate Chemistry, issue 26(4). (Dearling et al. 2015)
Exchange the buffer of the ch14.18-ΔCH2 antibody to sodium acetate and concentrate using Centricon centrifugal filter units with 30 kDa MWCO (see Note 17).
Mix 50 μL of a 400 mg/mL solution of (NH2)(CO2H)sar in DMSO with 150 μL of 0.1 M sodium acetate buffer at pH 5.0 for a final sarcophagine concentration of 100 mg/mL (see Note 11).
Adjust the pH to 5.0 by addition of small aliquots of 1 N NaOH.
Add 200 μL of chelator to the ch14.18-ΔCH2 solution at a molar ratio of 250:1 and add sodium acetate buffer to achieve a final antibody concentration of 5 mg/mL (see Note 11).
Add 500 molar equivalents of EDC to the reaction mixture and allow the reaction to progress for 30 minutes. The EDC solution must be prepared right before it is going to be used in a concentration of 50 mg/mL using ultrapure water (see Note 1).
Purify the immunoconjugate by size-exclusion HPLC using a BioSep SEC-S3000 column with 0.1 M sodium acetate at pH 5.0 as the solvent at a flow rate of 1 mL/min. The retention time of the Sar-ch14.18-ΔCH2 is around 8.1 min. Fractions containing the immunoconjugate can be mixed together, concentrated using Centricon filters and stored at −80 °C.
Mix 74 MBq (2 mCi) [64Cu]CuCl2 in 5−10 μL HCl (0.04 N) with 15–30 mL of sodium acetate buffer 0.1 M at pH 5.0.
Add 75 μL of the immunoconjugate at a concentration of 3.33 mg/mL to the [64Cu]CuCl2 solution and incubate the reaction for 30 minutes at 25 °C.
Confirm radiolabeling efficiency using radio-iTLC (see Section 3.1).
Purify the [64Cu]Cu-Sar-ch14.18-ΔCH2 radioimmunoconjugate using a centrifugal filter and dilute the purified solution to achieve a final concentration of 0.5 mg/mL (see Note 17).
Before injection, filter the radioimmunoconjugate through a 0.2 μm sterile filter.
3.16. Yttrium-86 [86Y]Y-DTPA-hu3S193 [24] (Figure 10)
Figure 10:
Serial coronal PET images of 2 mice injected with 86Y-hu3S193. This adapted figure was originally published in Journal of Nuclear Medicine, issue 42(8). (Lovqvist et al. 2001)
Conjugation of the 3S193 to DTPA is adapted from [25].
Incubate the humanized 3S193 (hu3S193) overnight in EDTA at a final concentration of 1 mM in an Amicon filter with a cutoff of 30 kDA MWCO (see Note 17).
Add 40 mL of carbonate buffer to the humanized 3S193 solution and connect the reservoir and the filter unit.
Exchange buffer of the antibody solution with an carbonate buffer by dropwise dilution with 800 mL of carbonate buffer over ~2 h (see Note 14).
Concentrate the antibody solution to around 20 mL using a flow of N2.
Dissolve between 3–11 mg of the chelator (2-p-SCN-Bz)-cyclohexyl-DTPA into an antibody solution containing around 60–100 mg.
Allow the reaction mixture to react for 19 hours at room temperature.
Exchange the buffer of immunoconjugate reaction mixture to an acetate buffer by continuous dilution with 750 mL of buffer over ~2h.
Concentrate the DTPA-hu3S193 immunoconjugate to 12–21 mL using a ultracentrifuge filter. Transfer into 15 mL vials and store at 4 °C.
Mix between 51.8–148 MBq 86Y with 3 M ammonium acetate to a final pH of around 5.
Add around 100–250 μg of the DTPA-hu3S193 and incubate the reaction mixture for 30 min at room temperature.
Quench the reaction by adding 50 nmol EDTA.
Purify the radioimmunoconjugate with 0.050 M PBS using a 10-DG desalting column pre-equilibrated with 0.050 M PBS (see Note 12).
To assess the radiolabeling, perform a radio-TLC on silica gel using a solution of EDTA 10 mmol/L at pH 4.5 as a mobile phase (see Section 3.1).
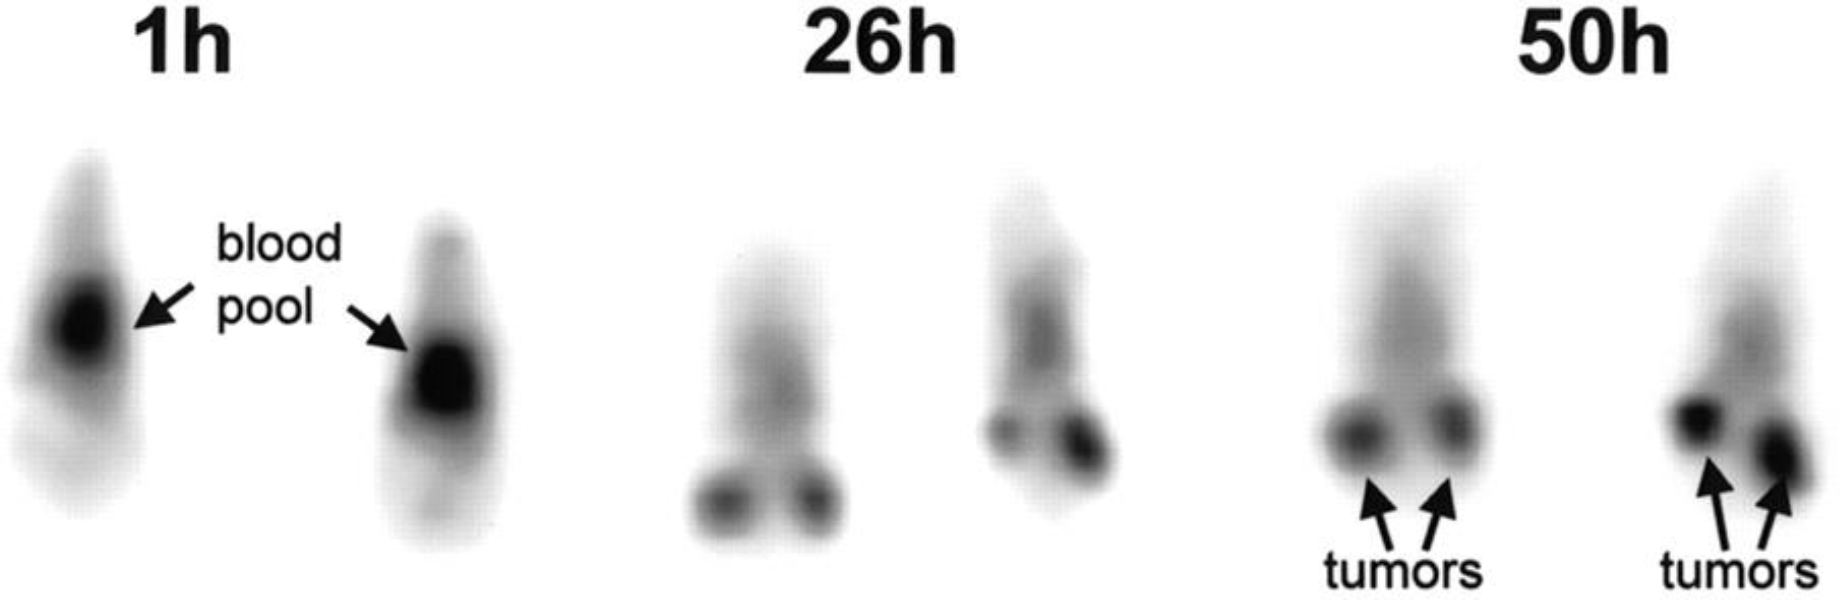
3.17. 124I-L19-SIP [26] (Figure 11)
Figure 11:
PET images of FaDu xenograft-bearing nude mouse injected with 124I-L19-SIP (3.7 MBq, 25 μg). Coronal images were acquired at 24 (a) and 48 h (b) after injection. Image planes have been chosen where both tumours were visible. Uptake of 124I in the stomach (arrow) and to some extend in bladder (urine) is visible at 24 h p.i., but has disappeared at 48 h p.i. This adapted research was originally published in the European Journal of Nuclear Medicine and Molecular Imaging, issue 36(8). (Tijink et al. 2009)
Currently, the method of choice for iodination of antibodies is the direct radioiodination of tyrosine residues of the antibodies with I+ species created by oxidation of 124I with oxidizing agents such as IODOGEN or chloramine-T.[27]
Pipette 25 μg of IODO-GEN in dichloromethane in a scintillation vial and dry the solution under a gentle flow of N2 gas to achieve a thin coat in the bottom of the vial (see Note 18).
Using the prepared IODO-GEN glass vial, add 50 μL of 0.5 M Na2HPO4 at pH 7.4, 218 μL of 0.1 M Na2HPO4 at pH 6.8, 142 μL (175 μg, 2.33 nmol) of L19-SIP and 90 μL 124I solution (38.5 MBq, 232 pmol NaI) and gently shake the mixture for 4 minutes at room temperature.
Add 0.1 mL of ascorbic acid (25 mg/mL) at pH 5 and gently shake for 5 minutes (see Note 19).
Transfer the reaction mixture to a syringe connected to an Acrodisc 0.22 μm filter and wash the reaction vessel with 400 μL of 0.1 M Na2HPO4 at pH 6.8. Combine this washout with the reaction mixture in the syringe.
Filter the solution through a PD-10 column using 0.9% NaCl/ascorbic acid buffer solution (5 mg/ml, pH 5) as the mobile phase.
Discard the first 2.5 mL of eluate and collect the radiolabeled antibody in the following 1.5 mL.
Perform radio-TLC analysis using silica gel glass fiber sheets using 20 mM citrate buffer (pH 5) as a mobile phase.
Run an HPLC of the final product using a size exclusion column and 0.05 M sodium phosphate/0.15 M sodium chloride (pH 6.8) mixture at a flow rate of 0.5 mL/min.
4. Notes
Water should be distilled and deionised using a MilliQ water filtration system or similar system to achieve the 18 MΩ-cm.
If the compound is not dissolving, place the solution on a heating plate and increase the temperature. Heating up the solution will help to dissolve the compound if there are issues getting it into solution. However, it is important to wait until the solution cools down to room temperature (25 °C) before measuring and adjusting the pH.
The buffer is now ready. However, due to the possible presence of heavy metals traces in the solution, adding Chelex to the solution and will remove these contaminants that can affect the chelation steps.
When labeling biomolecules with radiometals, it is important to use metal-free or trace-metals-grade solvents and buffers to prevent the presence of any unwanted metal ions in the working solutions. These metal contaminant ions can compete for the same chelator as the radiometal, resulting in lower radiolabeling yield.
Turn the stirring off and allow the Chelex resin to accumulate in the bottom of the flask. There are two ways to remove the chelex polymer from the solution, depending on the supplies available in the lab. One is to decant the the chelexed buffer through a filter paper in a funnel in a clean flask and allow for gravity filtration. The other more faster way is to use a Millipore filtering unit (or similar device) to remove the traces of chelex resin in solution. Though the Chelex should have no effect on the pH of the buffer, it is good practice to verify the pH of the final solution.
Silica-impregnated paper is very fragile – it can crack and crease very easily. Cut it carefully. Once cut to the desired width (between 0.5–1 cm should be enough), a dot of ink from a pen (we use red ink) around 1–2 cm from the edge of the iTLC paper – the sample should be place around the same paper height. The color dot is used to monitor the progress of the iTLC.
The iTLC chamber should contain mobile phase solvent around 1–2 cm from the bottom of the chamber. If a glass TLC chamber is unavailable, a 50 mL conical tube can be used as a replacement.
To prevent the instrument from radioactive contamination from the samples, the iTLC paper should be covered with either cling wrap or parafilm.
Some chelations are reacted in a buffer that is approved for injection into mice. Each antibody usually has a specific buffer system that works optimally for mouse injection. Some mouse-safe buffers are PBS and 0.9% buffered saline, among others. However, the buffers to be used in muse studies need to be confirmed with theose approved in the animal protocol in each lab and institution.
Rather than a quick selection between two methods, the determination between one or both methods should be based on the situation. To inject into mice radiolabeled antibodies should be the only source of radiation in the sample, thus no free radioactive ions can linger in the solution. Free ions affect the final images obtained, due to usually having a different distribution to that of the radiolabeled antibody. For example, free iodine-124 ends up in the thyroid, free zirconium-89 in the bones and copper-64 in the liver, among other examples. Once the radiolabeled antibody solution is 100% radioactively pure, another question must be asked. Is the buffer system the compound is in compatible with in vivo tail vein injection. If yes, then the sample just needs to be diluted into the full volume needed and then, the syringes prepared. If no, then a buffer exchange column (size exclusion column) should be run. Sometimes, if the biological probe (antibody, minibody, monobody, targetting peptide) is considered “sticky” (it easily gets adsorbed or stuck in the stationary phase) several filtration steps might be a better option to prevent loss of product.
Compounds like p-SCN-DFO can be tricky to dissolve in DMSO, sonication or vortexing can be used. Ideally, a concentrated working solution of the chelator in DMSO will prevent the reaction solution to have a percentage of DMSO higher than 1–2%. When adding the DMSO solution to the antibody sample, a dropwise addition followed by gentle agitation reassures the reaction solution remains homogeneous, the compounds are well mixed. This prevents the chelator to crash out of solution, thus affecting the yield of the reaction.
Pretreating your PD-10 column with the elution buffer is a key step in the purification of both the modified antibody and the radioimmunoconjugate. Pretreatment involves replacing the solution in the column with the buffer appropriate for the antibody. Run around 20 mL of the antibody buffer through the column to get it ready for use.
Adding EDTA to the reaction scavenges any unchelated radionuclides in the reaction mixture and stops the reaction.
The storage buffer of an antibody may not be optimal for the reaction to occur. Exchanging the buffer of an antibody using a PD10 column removes the buffer used for storage and replaces it with the ideal buffer for the conjugation step.
Either buffer can be used and have been used in the past. The main goal of using these buffers is to get the reaction to pH ~7.0.
Gentisic acid is used to stabilize and protect the radiolabeled molecule.
Centrifugal filters are a very useful tool to concentrate antibodies and other biological material. These filters have MWCOs which are rated to a certain size of molecule which would not pass through the filter. To select a filter for your antibody or protein of interest. To prevent loss of product, select a filter with a MWCO that appropriate for weight of your antibody. A good practice is to select a filter that has a MWCO of around ½ the size of your biological of interest.
The vials containing thin layers of IODO-GEN can be stored under a nitrogen atmosphere for future use.
Ascorbic acid reduces the IODO-GEN and protects the L19-SIP against radiation damage.
Acknowledgements:
We gratefully acknowledge the Radiochemistry and Molecular Imaging Probes Core (RMIP Core) at MSK, which is supported by NIH grant P30 CA08748. This work was also supported by NIH NCI R35 CA232130 (JSL).
References
- 1.Schroeder HW Jr., Cavacini L (2010) Structure and function of immunoglobulins. J Allergy Clin Immunol 125 (2 Suppl 2):S41–52. doi: 10.1016/j.jaci.2009.09.046 [DOI] [PMC free article] [PubMed] [Google Scholar]
- 2.Ljungars A, Martensson L, Mattsson J, Kovacek M, Sundberg A, Tornberg UC, Jansson B, Persson N, Emruli VK, Ek S, Jerkeman M, Hansson M, Juliusson G, Ohlin M, Frendeus B, Teige I, Mattsson M (2018) A platform for phenotypic discovery of therapeutic antibodies and targets applied on Chronic Lymphocytic Leukemia. NPJ Precis Oncol 2:18. doi: 10.1038/s41698-018-0061-2 [DOI] [PMC free article] [PubMed] [Google Scholar]
- 3.Sundaresan G, Yazaki PJ, Shively JE, Finn RD, Larson SM, Raubitschek AA, Williams LE, Chatziioannou AF, Gambhir SS, Wu AM (2003) 124I-labeled engineered anti-CEA minibodies and diabodies allow high-contrast, antigen-specific small-animal PET imaging of xenografts in athymic mice. J Nucl Med 44 (12):1962–1969 [PMC free article] [PubMed] [Google Scholar]
- 4.Lepin EJ, Leyton JV, Zhou Y, Olafsen T, Salazar FB, McCabe KE, Hahm S, Marks JD, Reiter RE, Wu AM (2010) An affinity matured minibody for PET imaging of prostate stem cell antigen (PSCA)-expressing tumors. Eur J Nucl Med Mol Imaging 37 (8):1529–1538. doi: 10.1007/s00259-010-1433-1 [DOI] [PMC free article] [PubMed] [Google Scholar]
- 5.Pandit-Taskar N, Postow MA, Hellmann MD, Harding JJ, Barker CA, O'Donoghue JA, Ziolkowska M, Ruan S, Lyashchenko SK, Tsai F, Farwell M, Mitchell TC, Korn R, Le W, Lewis JS, Weber WA, Behera D, Wilson I, Gordon M, Wu AM, Wolchok JD (2020) First-in-Humans Imaging with (89)Zr-Df-IAB22M2C Anti-CD8 Minibody in Patients with Solid Malignancies: Preliminary Pharmacokinetics, Biodistribution, and Lesion Targeting. J Nucl Med 61 (4):512–519. doi: 10.2967/jnumed.119.229781 [DOI] [PMC free article] [PubMed] [Google Scholar]
- 6.Farwell M, Gamache R, Pandit-Taskar N, Postow M, Gordon M, Wilson I, Mascioni A, Wu A, Le W, Weiss A, Korn R (2020) 294 CD8 PET imaging of tumor infiltrating T cells in advanced solid tumors: a phase I first-in-human study of 89Zr-IAB22M2C, a radiolabeled anti-CD8 minibody. Journal for ImmunoTherapy of Cancer 8 (Suppl 3):A179–A180. doi: 10.1136/jitc-2020-SITC2020.0294 [DOI] [Google Scholar]
- 7.Wei W, Rosenkrans ZT, Liu J, Huang G, Luo QY, Cai W (2020) ImmunoPET: Concept, Design, and Applications. Chem Rev 120 (8):3787–3851. doi: 10.1021/acs.chemrev.9b00738 [DOI] [PMC free article] [PubMed] [Google Scholar]
- 8.Holland JP, Sheh Y, Lewis JS (2009) Standardized methods for the production of high specific-activity zirconium-89. Nucl Med Biol 36 (7):729–739. doi: 10.1016/j.nucmedbio.2009.05.007 [DOI] [PMC free article] [PubMed] [Google Scholar]
- 9.Anderson CJ, Ferdani R (2009) Copper-64 radiopharmaceuticals for PET imaging of cancer: advances in preclinical and clinical research. Cancer Biother Radiopharm 24 (4):379–393. doi: 10.1089/cbr.2009.0674 [DOI] [PMC free article] [PubMed] [Google Scholar]
- 10.Sadeghi M, Aboudzadeh M, Zali A, Zeinali B (2009) (86)Y production via (86)Sr(p,n) for PET imaging at a cyclotron. Appl Radiat Isot 67 (7–8):1392–1396. doi: 10.1016/j.apradiso.2009.02.038 [DOI] [PubMed] [Google Scholar]
- 11.Halime Z, Frindel M, Camus N, Orain PY, Lacombe M, Bernardeau K, Cherel M, Gestin JF, Faivre-Chauvet A, Tripier R (2015) New synthesis of phenyl-isothiocyanate C-functionalised cyclams. Bioconjugation and (64)Cu phenotypic PET imaging studies of multiple myeloma with the te2a derivative. Org Biomol Chem 13 (46):11302–11314. doi: 10.1039/c5ob01618e [DOI] [PubMed] [Google Scholar]
- 12.Ferdani R, Stigers DJ, Fiamengo AL, Wei L, Li BT, Golen JA, Rheingold AL, Weisman GR, Wong EH, Anderson CJ (2012) Synthesis, Cu(II) complexation, 64Cu-labeling and biological evaluation of cross-bridged cyclam chelators with phosphonate pendant arms. Dalton Trans 41 (7):1938–1950. doi: 10.1039/c1dt11743b [DOI] [PMC free article] [PubMed] [Google Scholar]
- 13.Zeglis BM, Lewis JS (2015) The bioconjugation and radiosynthesis of 89Zr-DFO-labeled antibodies. J Vis Exp (96). doi: 10.3791/52521 [DOI] [PMC free article] [PubMed] [Google Scholar]
- 14.Sharma SK, Sevak KK, Monette S, Carlin SD, Knight JC, Wuest FR, Sala E, Zeglis BM, Lewis JS (2016) Preclinical 89Zr Immuno-PET of High-Grade Serous Ovarian Cancer and Lymph Node Metastasis. J Nucl Med 57 (5):771–776. doi: 10.2967/jnumed.115.167072 [DOI] [PMC free article] [PubMed] [Google Scholar]
- 15.Kristensen LK, Christensen C, Jensen MM, Agnew BJ, Schjoth-Frydendahl C, Kjaer A, Nielsen CH (2019) Site-specifically labeled (89)Zr-DFO-trastuzumab improves immune-reactivity and tumor uptake for immuno-PET in a subcutaneous HER2-positive xenograft mouse model. Theranostics 9 (15):4409–4420. doi: 10.7150/thno.32883 [DOI] [PMC free article] [PubMed] [Google Scholar]
- 16.Vugts DJ, Klaver C, Sewing C, Poot AJ, Adamzek K, Huegli S, Mari C, Visser GWM, Valverde IE, Gasser G, Mindt TL, van Dongen G (2017) Comparison of the octadentate bifunctional chelator DFO*-pPhe-NCS and the clinically used hexadentate bifunctional chelator DFO-pPhe-NCS for (89)Zr-immuno-PET. Eur J Nucl Med Mol Imaging 44 (2):286–295. doi: 10.1007/s00259-016-3499-x [DOI] [PMC free article] [PubMed] [Google Scholar]
- 17.Natarajan A, Patel CB, Habte F, Gambhir SS (2018) Dosimetry Prediction for Clinical Translation of (64)Cu-Pembrolizumab ImmunoPET Targeting Human PD-1 Expression. Sci Rep 8 (1):633. doi: 10.1038/s41598-017-19123-x [DOI] [PMC free article] [PubMed] [Google Scholar]
- 18.Natarajan A, Mayer AT, Reeves RE, Nagamine CM, Gambhir SS (2017) Development of Novel ImmunoPET Tracers to Image Human PD-1 Checkpoint Expression on Tumor-Infiltrating Lymphocytes in a Humanized Mouse Model. Mol Imaging Biol 19 (6):903–914. doi: 10.1007/s11307-017-1060-3 [DOI] [PMC free article] [PubMed] [Google Scholar]
- 19.Cai Z, Anderson CJ (2014) Chelators for copper radionuclides in positron emission tomography radiopharmaceuticals. J Labelled Comp Radiopharm 57 (4):224–230. doi: 10.1002/jlcr.3165 [DOI] [PMC free article] [PubMed] [Google Scholar]
- 20.Woo SK, Jang SJ, Seo MJ, Park JH, Kim BS, Kim EJ, Lee YJ, Lee TS, An GI, Song IH, Seo Y, Kim KI, Kang JH (2019) Development of (64)Cu-NOTA-Trastuzumab for HER2 Targeting: A Radiopharmaceutical with Improved Pharmacokinetics for Human Studies. J Nucl Med 60 (1):26–33. doi: 10.2967/jnumed.118.210294 [DOI] [PubMed] [Google Scholar]
- 21.Bailly C, Gouard S, Lacombe M, Remaud-Le Saec P, Chalopin B, Bourgeois M, Chouin N, Tripier R, Halime Z, Haddad F, Faivre-Chauvet A, Kraeber-Bodere F, Cherel M, Bodet-Milin C (2018) Comparison of Immuno-PET of CD138 and PET imaging with (64)CuCl2 and (18)F-FDG in a preclinical syngeneic model of multiple myeloma. Oncotarget 9 (10):9061–9072. doi: 10.18632/oncotarget.23886 [DOI] [PMC free article] [PubMed] [Google Scholar]
- 22.Zeng D, Guo Y, White AG, Cai Z, Modi J, Ferdani R, Anderson CJ (2014) Comparison of conjugation strategies of cross-bridged macrocyclic chelators with cetuximab for copper-64 radiolabeling and PET imaging of EGFR in colorectal tumor-bearing mice. Mol Pharm 11 (11):3980–3987. doi: 10.1021/mp500004m [DOI] [PMC free article] [PubMed] [Google Scholar]
- 23.Dearling JL, Paterson BM, Akurathi V, Betanzos-Lara S, Treves ST, Voss SD, White JM, Huston JS, Smith SV, Donnelly PS, Packard AB (2015) The ionic charge of copper-64 complexes conjugated to an engineered antibody affects biodistribution. Bioconjug Chem 26 (4):707–717. doi: 10.1021/acs.bioconjchem.5b00049 [DOI] [PubMed] [Google Scholar]
- 24.Lovqvist A, Humm JL, Sheikh A, Finn RD, Koziorowski J, Ruan S, Pentlow KS, Jungbluth A, Welt S, Lee FT, Brechbiel MW, Larson SM (2001) PET imaging of (86)Y-labeled anti-Lewis Y monoclonal antibodies in a nude mouse model: comparison between (86)Y and (111)In radiolabels. J Nucl Med 42 (8):1281–1287 [PubMed] [Google Scholar]
- 25.Nikula TK, Curcio MJ, Brechbiel MW, Gansow OA, Finn RD, Scheinberg DA (1995) A rapid, single vessel method for preparation of clinical grade ligand conjugated monoclonal antibodies. Nucl Med Biol 22 (3):387–390. doi: 10.1016/0969-8051(94)00126-5 [DOI] [PubMed] [Google Scholar]
- 26.Tijink BM, Perk LR, Budde M, Stigter-van Walsum M, Visser GW, Kloet RW, Dinkelborg LM, Leemans CR, Neri D, van Dongen GA (2009) (124)I-L19-SIP for immuno-PET imaging of tumour vasculature and guidance of (131)I-L19-SIP radioimmunotherapy. Eur J Nucl Med Mol Imaging 36 (8):1235–1244. doi: 10.1007/s00259-009-1096-y [DOI] [PMC free article] [PubMed] [Google Scholar]
- 27.Kumar K, Ghosh A (2021) Radiochemistry, Production Processes, Labeling Methods, and ImmunoPET Imaging Pharmaceuticals of Iodine-124. Molecules 26 (2). doi: 10.3390/molecules26020414 [DOI] [PMC free article] [PubMed] [Google Scholar]
- 28.Aerts HJWL, Dubois L, Perk L, Vermaelen P, van Dongen GAMS, Wouters BG, Lambin P (2009) Disparity Between In Vivo EGFR Expression and (89)Zr-Labeled Cetuximab Uptake Assessed with PET. Journal of Nuclear Medicine 50 (1):123–131. doi: 10.2967/jnumed.108.054312 [DOI] [PubMed] [Google Scholar]
- 29.Bailly C, Gouard S, Guerard F, Chalopin B, Carlier T, Faivre-Chauvet A, Remaud-Le Saec P, Bourgeois M, Chouin N, Rbah-Vidal L, Tripier R, Haddad F, Kraeber-Bodere F, Bodet-Milin C, Cherel M (2019) What is the Best Radionuclide for Immuno-PET of Multiple Myeloma? A Comparison Study Between (89)Zr- and (64)Cu-Labeled Anti-CD138 in a Preclinical Syngeneic Model. Int J Mol Sci 20 (10). doi: 10.3390/ijms20102564 [DOI] [PMC free article] [PubMed] [Google Scholar]