



Abstract
Platinum-based neoadjuvant chemotherapy (NACT) followed by radical hysterectomy has been proposed as an alternative treatment approach for cervical cancer (CC) in stage Ib2-IIb, who had a strong desire to be treated with surgery. Our study aims to develop a model based on multimodal MRI by using radiomics and deep learning to predict the treatment response in CC patients treated with neoadjuvant chemoradiotherapy (NACRT). From August 2009 to June 2013, CC patients in stage Ib2-IIb (FIGO 2008) who received NACRT at Fujian Cancer Hospital were enrolled in our study. Clinical information, contrast-enhanced T1-weighted imaging (CE-T1WI), and T2-weighted imaging (T2WI) data were respectively collected. Radiomic features and deep abstract features were extracted from the images using radiomics and deep learning models, respectively. Then, ElasticNet and SVM-RFE were employed for feature selection to construct four single-sequence feature sets. Early fusion of two multi-sequence feature sets and one hybrid feature set were performed, followed by classification prediction using four machine learning classifiers. Subsequently, the performance of the models in predicting the response to NACRT was evaluated by separating patients into training and validation sets. Additionally, overall survival (OS) and disease-free survival (DFS) were assessed using Kaplan-Meier survival curves. Among the four machine learning models, SVM exhibited the best predictive performance (AUC=0.86). Among the seven feature sets, the hybrid feature set achieved the highest values for AUC (0.86), ACC (0.75), Recall (0.75), Precision (0.81), and F1-score (0.75) in the validation set, outperforming other feature sets. Furthermore, the predicted outcomes of the model were closely associated with patient OS and DFS (p = 0.0044; p = 0.0039). A model based on MRI images with features from multiple sequences and different methods could precisely predict the response to NACRT in CC patients. This model could assist clinicians in devising personalized treatment plans and predicting patient survival outcomes.
Subject terms: Cervical cancer, Computer science
Introduction
Cervical cancer (CC) is one of the most common malignancies among women globally, ranking as the fourth most common cancer after breast, colorectal, and lung cancers, it is also the leading malignancy among the three major malignant tumors of the female reproductive system1. In 2020, there were over 604,000 new cases and over 341,000 CC-related deaths, with a 5-year overall survival(OS) rate of only 42.1%1,2. Based on NCCN guidelines, except for early disease treated with surgery, the standard treatment strategy for locally advanced cervical cancer (LACC) is concurrent chemoradiotherapy3,4. Recently, immunotherapy has revolutionized cancer treatment5–7. The advent of immune checkpoint inhibitors (ICIs) represents an effective treatment strategy in multiple solid tumors, including LACC6,8,9 with tolerable adverse events10,11. Despite advances in the therapeutic fields, over 50% of cancer patients eventually die of the disease12. In the clinical setting, many CC patients with stage Ib2-IIb, who are recommended to be treated with concurrent chemoradiotherapy, are eager to undergo surgery procedures. Multiple studies have suggested that radical surgery after neoadjuvant chemoradiotherapy (NACRT) may serve as an alternative strategy for treating patients with locally advanced CC13,14. NACRT can reduce tumor size and volume, rendering previously inoperable tumors amenable to surgical resection. However, the bottleneck lies in a few conventional clinical and imaging parameters that could precisely predict patients’ responses to NACRT15. This variability underscores the importance of identifying reliable predictive biomarkers to stratify patients who are sensitive to NACRT.
Radiomics is a rapidly evolving research field involving the extraction of quantitative indicators or radiomic features from medical images to capture different aspects of tumor biology and the microenvironment16. Liu et al. used the Least Absolute Shrinkage and Selection Operator (Lasso)17 during feature selection and Support Vector Machine (SVM)18 to construct a predictive model with an AUC of 0.98 in assessing the therapeutic efficacy for rectal cancer19. By combining multi-parameter MRI and clinical information, Sun et al. also employed Support Vector Machine Recursive Feature Elimination (SVM-RFE)20 to reduce feature dimensions21. Then, he used Random Forest (RF)22 to build a classification model with an AUC of 0.999 in predicting the response to neoadjuvant chemotherapy in CC.
As a powerful machine learning method, deep learning has made significant strides in medical image analysis in the current medical research landscape. More accurate image features can be extracted through deep learning algorithms, enabling individualized analysis of patients, and providing clinicians with more comprehensive information to devise more precise personalized treatment plans23. Liu et al. developed a predictive model that combined clinical, radiomics, and deep features to stratify high-risk and low-risk thymomas using transfer learning24. Deep learning also plays a crucial role in predicting treatment responses. Liu Xiangyu et al. used multicenter data and pre-trained ResNet1825 to predict distant metastasis (DM) in locally advanced rectal cancer (LARC) patients receiving neoadjuvant chemoradiotherapy (nCRT)26. By combining MRI information and clinicopathological factors, they constructed nomograms to achieve better prediction. Integrating deep learning and radiomics can provide a more comprehensive understanding of tumor morphology and biological information27. The combination of radiomics and deep learning models can improve the accuracy and efficiency of feature extraction, providing more powerful tools for predicting cancer treatment efficacy with significant theoretical value and practical application prospects. However, few studies have used radiomics and deep learning to predict the response to neoadjuvant chemotherapy in CC.
Against this backdrop, this study aims to explore the role of deep radiomics based on multimodal MRI in predicting the response to NACRT in LACC patients. By integrating multimodal MRI data with radiomics and deep learning techniques, we seek to develop predictive models that could stratify patients into different risk groups based on their response rate to NACRT. We hope these predictive models could help optimize personalized treatment planning, facilitate treatment monitoring, and improve clinical outcomes for CC patients treated with NACRT.
Results
Characteristics of patients
A total of 360 patients were included in the analysis (responders vs. poor-responders, 203:157). Patients were divided into training and validation sets in a ratio of 6:4. The training set (responders vs. poor-responders, 123:95) was used for model training, while the validation set (responders vs. poor-responders, 80:62) was used for assessing model performance. The baseline characteristics of the patients are presented in Table 1, showing no significant differences in features between the two cohorts.
Table 1.
Characteristics of the patients in different cohorts.
| Characteristics | Total (n = 360) | Training cohort (n = 218) | Validation cohort (n = 142) | P value | ||
|---|---|---|---|---|---|---|
| Responders (n=123) | Poor-responders (n=95) | Responders (n=80) | Poor-responders (n=62) | |||
| Age (years), mean ± SD | 47.54 ± 8.26 | 46.69 ± 7.92 | 48.63 ± 7.76 | 47.26 ± 9.12 | 47.89 ± 8.48 | 0.999 |
| Tumor diameter (cm), mean ± SD | 4.25 ± 0.88 | 4.33 ± 0.91 | 4.28 ± 0.83 | 4.21 ± 0.89 | 4.08 ± 0.88 | 0.102 |
| FIGO stage, n (%) | 0.825 | |||||
| IB | 21 (5.83) | 6 (4.88) | 7 (7.37) | 4 (5.00) | 4 (6.45) | |
| IIA | 150 (41.67) | 49 (39.84) | 39 (41.05) | 25 (31.25) | 37 (59.68) | |
| IIB | 189 (52.50) | 68 (55.28) | 49 (51.58) | 51 (63.75) | 21 (33.87) | |
| LNM, n (%) | < 0.001 | |||||
| Negative | 274 (76.11) | 90 (73.17) | 56 (58.95) | 76 (95.00) | 52 (83.87) | |
| Positive | 86 (23.89) | 33 (26.83) | 39 (41.05) | 4 (5.00) | 10 (16.13) | |
| Histotype, n (%) | 0.595 | |||||
| AC | 24 (6.67) | 5 (4.07) | 11 (11.58) | 4 (5.00) | 4 (6.45) | |
| ASC | 3 (0.83) | 0 (0.00) | 1 (1.05) | 1 (1.25) | 1 (1.61) | |
| SCC | 333 (92.50) | 118 (95.93) | 83 (87.37) | 75 (93.75) | 57 (91.94) | |
| Differentiation grade, n (%) | 0.512 | |||||
| Middle | 276 (76.67) | 86 (69.92) | 77 (81.06) | 63 (78.75) | 50 (80.65) | |
| Low | 76 (21.11) | 36 (29.27) | 13 (13.68) | 16 (20.00) | 11 (17.74) | |
| High | 8 (2.22) | 1 (0.81) | 5 (5.26) | 1 (1.25) | 1 (1.61) | |
| LVSI, n (%) | < 0.001 | |||||
| Negative | 37 (10.28) | 7 (5.69) | 0 (0.00) | 30 (37.50) | 0 (0.00) | |
| Positive | 323 (89.72) | 116 (94.31) | 95 (100.00) | 50 (62.50) | 62 (100.00) | |
Single sequence model construction and validation
Using the defined feature selection methods, 17 and 9 radiomic features were selected from T2WI and CE-T1WI, respectively. At the same time, 28 deep-learning features were selected from both sequences. These features were input into four machine learning classifiers, among which SVM demonstrated the best performance. In the validation set, the AUC values for the T1cRF, T1cHF, T2RF, and T2HF models were 0.6988, 0.7599, 0.7827, and 0.7887, respectively (refer to Table 2). The confusion matrices and ROC curves for these models are illustrated in Fig. 1.
Table 2.
Predictive performance results for models trained with different feature sets.
| Model | AUC | ACC | Recall | Precision | F1-score |
|---|---|---|---|---|---|
| T1ceRF | 0.6989 | 0.5774 | 0.58 | 0.71 | 0.54 |
| T1ceHF | 0.7559 | 0.6901 | 0.69 | 0.71 | 0.69 |
| T2RF | 0.7827 | 0.6338 | 0.63 | 0.77 | 0.61 |
| T2HF | 0.7887 | 0.7042 | 0.70 | 0.71 | 0.71 |
| T1c+T2 RF | 0.8181 | 0.6197 | 0.62 | 0.72 | 0.60 |
| T1c+T2 HF | 0.8204 | 0.7465 | 0.75 | 0.75 | 0.75 |
| Ensembles | 0.8575 | 0.7535 | 0.75 | 0.81 | 0.75 |
Figure 1.

The predictive performance of different feature sets in the validation set is assessed through confusion matrices and ROC curves.
Combined model construction and validation
After the early fusion of selected single-sequence features, SVM-RFE was applied for important feature selection, resulting in 17 features from multi-sequence data, 38 features from the combination of sequences, and 39 features from the mixed feature set. These features were input into four machine learning classifiers, with SVM demonstrating the best performance. In the validation set, the AUC values for the T1c+T2 RF, T1c+T2 HF, and Ensembles models were 0.8181, 0.8204, and 0.8575, respectively (refer to Table 2). The confusion matrices and ROC curves for these models are illustrated in Fig. 2.
Figure 2.

The predictive performance of different feature sets in the validation set is assessed through confusion matrices and ROC curves.
Model comparison
In single-sequence models, the predictive performance of features extracted from T2WI surpassed those from CE-T1WI. According to the confusion matrices, it was evident that the predictive performance of deep learning features was more balanced. For multi-sequence and mixed models, there was a tendency towards improved performance in prediction. Among them, the mixed-model exhibited the best predictive performance (AUC = 0.8575), as shown in Table 2 and Fig. 3.
Figure 3.

Comparison of ROC curves for all models. The left graph is the results from the training set and the right graph is the results from the validation set.
The relationship between models and prognosis
We constructed two nomograms using multiple clinical indicators combined with radiomics scores (Figs. 4 and 5). With the help of the nomograms, clinicians could easily and precisely predict the patient’s response to treatment and prognosis. Fig. 6 confirms significant differences in OS and DFS between the responder and poor-responder groups (p < 0.05). The responder group exhibited a superior prognosis.
Figure 4.

Nomogram for predicting response to NACRT in CC.
Figure 5.

Nomogram for predicting 3-year and 5-year OS in CC patients based on age, FIGO stage, tumor size, and radiomics score.
Figure 6.

Kaplan-Meier survival curves. The left graph represents OS, while the right graph represents DFS.
Discussion
In this study, we used multi-modal MRI-based deep radiomics to build a predictive model, which had significant potential for predicting the response to NACRT in CC patients. The basic workflow of radiomics includes feature extraction, calculation and selection, dimensionality reduction, data processing, and construction of prediction models28. Information regarding tumor structure, function, and perfusion are captured, enhancing the predictive model’s performance and accuracy. Applying deep learning technology facilitates the discovery of potential imaging biomarkers and helps build predictive models with good performance, thus providing clinicians with more accurate prediction tools. With the predictive model developed in this study, we found that the features extracted using T2WI were superior to those extracted using CE-T1WI (AUC 0.783 vs. 0.699; 0.789 vs. 0.756). The features extracted using deep learning models outperformed those extracted using radiomics (AUC 0.756 vs. 0.699; 0.789 vs. 0.783; 0.820 vs. 0.818), and the mixed model exhibited the best predictive performance (AUC = 0.8575). In addition, we combined clinical information and imaging omics scores to create the Nomo chart and KM survival curve and found that the model-predicted score was correlated with the prognosis (p < 0.05).
NACRT holds a significant position in modern oncology treatment. It offers multiple advantages such as tumor shrinkage, increased surgical success rates, and improved prognosis, thereby providing patients with more treatment options and better outcomes. However, due to individual differences, not everyone exhibits sensitivity to NACRT, making the response prediction critically important. In the clinical setting, we could only identify whether a patient would respond to NACRT after the patient finished NACRT, making the timing intervention impossible. By leveraging multimodal-MRI-based radiomics and deep learning techniques, we could, in advance, predict the response to NACRT based on patients’ pretreatment MRI images. Early identification of patients who are non-responsive to NACRT allows for timely adjustment of treatment strategies, potentially incorporating alternative therapies. Accurate prediction of treatment response can optimize therapeutic strategies, potentially enhancing OS and DFS rates. Reducing ineffective treatments and associated healthcare resource wastage can lower medical costs and improve resource utilization efficiency. Our model demonstrated advantages over existing models in predicting the response to NACRT. In comparison to studies without radiomics, our model integrates a rich set of imaging data, enabling more comprehensive and accurate analyses29. Jeong et al. compared the methods of radiomics and deep learning in predicting chemoradiotherapy response in locally advanced CC30. They found that the deep learning approach (AUC = 0.782) outperformed the radiomics method (AUC = 0.676), which was consistent with our findings. Additionally, our model combines radiomics with deep learning techniques, allowing for better exploration of latent information within imaging data, thereby enhancing diagnostic and predictive accuracy.
Additionally, the present study developed a nomogram combining imaging scores and clinical information. It demonstrated satisfactory performance in predicting the likelihood of sensitivity to NACRT and survival outcomes in CC patients. We found that age, tumor size, and FIGO stage were independent risk factors for prognosis, consistent with the findings of existing studies31–33. Moreover, we discovered that patients’ sensitivity to NACRT also influenced prognosis. Finally, by leveraging deep learning technology, our model automatically extracted features from imaging data and integrated them with clinical indicators, enabling faster analysis and saving medical resources and time. Most importantly, our model can identify complex associations and patterns that conventional methods may overlook, thereby providing more accurate diagnostics and predictions, offering reliable support for clinical decision-making.
Recently, radiomics based on multimodal imaging data and deep learning techniques have revolutionized the treatment scenario. With ongoing algorithm optimization and enhanced computational power, the accuracy and reliability of predictive models are expected to improve significantly in the next five years. In addition, more predictive models are likely to be integrated into clinical practice and assist clinicians in creating personalized treatment plans and improving patient survival outcomes. The integration and analysis of multimodal data will promote interdisciplinary collaboration among experts in medicine, computer science, statistics, and other fields.
Despite the encouraging results, this study still faces some challenges and limitations. Firstly, the quality and consistency of imaging data are crucial for model training and prediction. Due to various factors affecting the acquisition of imaging data, including equipment parameters, scanning techniques, and operator experience, measures need to be taken to ensure the reliability and stability of the data. Additionally, the study’s sample size was relatively small, and the data were sourced from a single medical center, which might limit the generalizability of the findings. Future research should focus on expanding the sample size and conducting multi-center validation studies to further validate the stability and generalizability of the model, thereby enhancing its applicability in different populations and institutions. Finally, other potentially valuable data sources (e.g. genomic data, immunotherapy data) were not included in our study. In the next step, we will investigate the role of immunotherapy or other clinical data in developing more robust and accurate predictive models.
Conclusions
In summary, multi-modal MRI-based deep radiomics provides new possibilities for personalized treatment of CC patients who treated with NACRT and lays the foundation for broader clinical applications in the future. With the continuous development of technology and methods, we look forward to further refining predictive models, advancing the application of radiomics in tumor diagnosis, treatment, and monitoring, and providing patients with more precise and effective medical services.
Methods
Materials
A total of 360 CC patients treated with NACRT were enrolled at Fujian Cancer Hospital from August 2009 to June 2013. The inclusion criteria were as follows: (i) FIGO stage IB-IIB; (ii) Complete MRI data before neoadjuvant chemoradiotherapy; (iii) complete clinical and pathological data. The exclusion criteria were as follows (Fig. 7): (i) missing MRI data; (ii) unclear pathological results; (iii) receiving only radiotherapy or chemotherapy; (iv) loss to follow-up.
Figure 7.

Flowchart of the study enrolment patients.
Treatment strategies and pathological assessment
Based on NCCN (National Comprehensive Cancer Network) guidelines4, cisplatin-based chemotherapy was recommended. The chemotherapy regimens included cisplatin (75 mg/) or nedaplatin (80 mg/) combined with paclitaxel (135 mg/) every three weeks. In addition, 0 2Gy individualized high-dose-rate intracavitary brachytherapy (HDR-ICBT) was applied based on patients’ conditions. (Dose: 1.0 Gy per time; Time interval: 7 days for 1 2 weeks).
In addition, follow-up of patients was conducted for survival analysis in this study. OS was defined as the time from the admission date to the last follow-up date or the date of death. DFS was defined as the time from the date of the first surgery to the date of the first recurrence, the last follow-up, or the date of death.
MRI acquisition and tumor segmentation
All MRI examinations were performed using 1.5 T scanners (Signa 1. 5 T EXCITE III HD) with eight-channel phased-array abdominal coils. All patients were injected with the contrast agent gadopentetate glucosamine injection (Gd-DTPA) at a dose of 0.1 0.2 mmol/kg via elbow vein at a rate of 1.5 ml/s. The following criteria were used: TR was 4 ms, TE was 2 ms, the flip angle was , FOV was 400 mm 400 mm, layer thickness/interlayer distance = 7 mm/3.5 mm, number of layers was 88-92, and scanning time was about 15 s.
We used ITK-SNAP (v.3.6.0; www.itksnap.org;open source software) for the segmentation of manual CT images. Regions of interest (ROIs) were manually segmented by a gynecologist with 25 years of experience, and a radiologist with 15 years of experience to validate each processed segmentation.
Feature extraction
The PyRadiomics open-source toolkit was utilized to extract radiomic features from both T2-weighted imaging (T2WI) and contrast-enhanced T1-weighted imaging (CE-T1WI). A total of 1132 radiomic features were extracted from the MRI images, encompassing three image types: original images, Laplacian of Gaussian (LoG), and Wavelet, along with eight feature types: Shape2D, Shape3D, FirstOrder, Gray Level Co-occurrence Matrix (GLCM), Gray Level Run Length Matrix (GLRLM), Gray Level Size Zone Matrix (GLSZM), Gray Level Dependence Matrix (GLDM), and Neighbouring Gray Tone Difference Matrix (NGTDM).
Deep learning features were extracted based on transfer learning using the pre-trained ResNet50 model on ImageNet. The last fully connected layer of the model was removed, and the average pooling layer features were extracted. The features extracted from each ROI in the MRI were stacked and averaged. Hence, 2048 features were extracted from each MRI. Although deep learning models have demonstrated improved accuracy in various tasks, their internal workings are often complex and challenging to interpret. Therefore, Grad-CAM was used to provide visual explanations to aid in understanding how the deep learning model makes predictions, as illustrated in Fig. 8.
Figure 8.

Grad-CAM visualization demonstrates that the deep model pays more attention to the edge features of tumor images.
Feature selection
To mitigate the risk of overfitting and reduce runtime, it’s essential to reduce the dimensionality of the features. Initially, the feature sets underwent data standardization (Z-Score) to ensure comparability between the data. Subsequently, the Elastic Net Regression Algorithm (ElasticNet) was employed to reduce the number of features. ElasticNet retains the feature selection properties of Lasso regression while also considering the stability of ridge regression. Furthermore, Support Vector Machine Recursive Feature Elimination (SVM-RFE) was utilized to further select the most critical features. The feature selection module is illustrated in Fig. 9.
Figure 9.
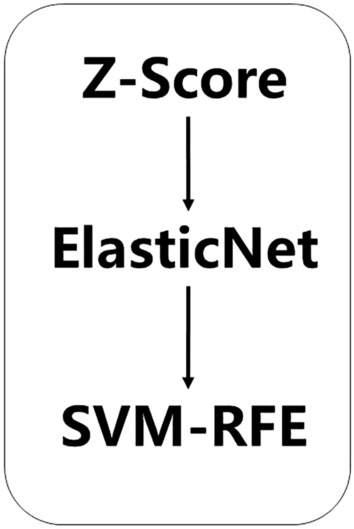
Feature selection block.
Early fusion and combined model construction
Two sequences and two feature extraction methods yielded a total of four single-sequence feature sets. Early fusion of the two sequences formed two multi-sequence feature sets, including T1c+T2 RF and T1c+T2 HF. By integrating multiple sequences and methods, they were amalgamated into one mixed feature set, denoted as Ensembles. The workflow of this study is illustrated in Fig. 10.
Figure 10.

The research design and process.
Evaluation metrics
To evaluate the proposed method, the following evaluation metrics were used: AUC (area under the curve), ACC (accuracy), recall, precision, and F1-score. These metrics were defined as follows: Accuracy = (TP + TN)/(TP + TN + FP + FN); Precision = (TP)/(TP + FP); Recall = (TP)/(TP + FN); F1-Score = (2 × Precision × Recall )/(Precision + Recall); AUC: Area Under the Receiver Operating Characteristic Curve (ROC). Where: TP (true positives) represented the number of instances correctly classified as positive by the model. TN (true negatives) represented the number of instances correctly classified as negative by the model. FP (false positives) represented the number of instances incorrectly classified as positive by the model. FN (false negatives) represented the number of instances incorrectly classified as negative by the model. These metrics comprehensively assessed the model’s performance in classification tasks (Supplementary Information).
Ethics approval and consent to participate
This is an observational and retrospective study and was approved by the Fujian Cancer Hospital Ethics Committee (No. K2024-085-01) and in conformity to the Declaration of Helsinki. The requirement of informed consent was waived for this retrospective study by the Fujian Cancer Hospital Ethics Committee (No. K2024-085-01) based on the retrospective nature of the study.
Supplementary Information
Acknowledgements
The authors sincerely thank patients and doctors at Fujian Cancer Hospital for their efforts.
Author contributions
Cai Z and Li S contributed equally to this study. Conception and design of the study: Cai Z, Li S, Sun Y. Data collection: Cai Z, Li S, Lin J. Analysis and interpretation of data: Cai Z, Li S. Writing - review and editing: Cai Z, Li S, Xiong Z, Lin J, Sun Y. All authors contributed to the article and approved the submitted version.
Funding
This study was supported by the Major Scientific Research Program for Young and Middle-aged Health Professionals of Fujian Province, China(Grant No. 2022ZQNZD008) and the High-level Talents Training Project of Fujian Cancer Hospital (Grant No. 2022YNG04).
Data availability
The datasets used and/or analyzed during the current study available from the corresponding author on reasonable request.
Competing interests
The authors declare no competing interests.
Footnotes
Publisher's note
Springer Nature remains neutral with regard to jurisdictional claims in published maps and institutional affiliations.
These authors contributed equally: Zhihua Cai and Sang Li.
Supplementary Information
The online version contains supplementary material available at 10.1038/s41598-024-70055-9.
References
- 1.Sung, H. et al. Global cancer statistics 2020: Globocan estimates of incidence and mortality worldwide for 36 cancers in 185 countries. CA Cancer J. Clin.71, 209–249 (2021). 10.3322/caac.21660 [DOI] [PubMed] [Google Scholar]
- 2.Ward, Z. J. et al. The role and contribution of treatment and imaging modalities in global cervical cancer management: Survival estimates from a simulation-based analysis. Lancet Oncol.21, 1089–1098 (2020). 10.1016/S1470-2045(20)30316-8 [DOI] [PMC free article] [PubMed] [Google Scholar]
- 3.Bhatla, N., Aoki, D., Sharma, D. N. & Sankaranarayanan, R. Cancer of the cervix uteri. Int. J. Gynecol. Obstetr.143, 22–36 (2018). 10.1002/ijgo.12611 [DOI] [PubMed] [Google Scholar]
- 4.Koh, W.-J. et al. Cervical cancer, version 2.2015. J. Natl. Compr. Cancer Netw.13, 395–404 (2015). 10.6004/jnccn.2015.0055 [DOI] [PubMed] [Google Scholar]
- 5.Santoni, M. et al. Complete remissions following immunotherapy or immuno-oncology combinations in cancer patients: The mouseion-03 meta-analysis. Cancer Immunol. Immunother.72, 1365–1379 (2023). 10.1007/s00262-022-03349-4 [DOI] [PMC free article] [PubMed] [Google Scholar]
- 6.Guven, D. C. et al. The association between albumin levels and survival in patients treated with immune checkpoint inhibitors: A systematic review and meta-analysis. Front. Mol. Biosci.9, 1039121 (2022). 10.3389/fmolb.2022.1039121 [DOI] [PMC free article] [PubMed] [Google Scholar]
- 7.Rizzo, A. et al. Peripheral neuropathy and headache in cancer patients treated with immunotherapy and immuno-oncology combinations: The mouseion-02 study. Expert Opin. Drug Metab. Toxicol.17, 1455–1466 (2021). 10.1080/17425255.2021.2029405 [DOI] [PubMed] [Google Scholar]
- 8.Rizzo, A. et al. Hypertransaminasemia in cancer patients receiving immunotherapy and immune-based combinations: The mouseion-05 study. Cancer Immunol. Immunother.72, 1381–1394 (2023). 10.1007/s00262-023-03366-x [DOI] [PMC free article] [PubMed] [Google Scholar]
- 9.Rizzo, A., Mollica, V., Santoni, M. & Massari, F. Cancer immunotherapy: Harnessing the immune system to fight cancer (2022). [DOI] [PMC free article] [PubMed]
- 10.Dall’Olio, F. G. et al. Immortal time bias in the association between toxicity and response for immune checkpoint inhibitors: A meta-analysis. Immunotherapy13, 257–270 (2021). 10.2217/imt-2020-0179 [DOI] [PubMed] [Google Scholar]
- 11.Guven, D. C. et al. Immune checkpoint inhibitor-related hearing loss: A systematic review and analysis of individual patient data. Support. Care Cancer31, 624 (2023). 10.1007/s00520-023-08083-w [DOI] [PubMed] [Google Scholar]
- 12.Sahin, T. K., Rizzo, A., Aksoy, S. & Guven, D. C. Prognostic significance of the royal marsden hospital (rmh) score in patients with cancer: A systematic review and meta-analysis. Cancers16, 1835 (2024). 10.3390/cancers16101835 [DOI] [PMC free article] [PubMed] [Google Scholar]
- 13.Mariagrazia, D. et al. Preoperative chemoradiotherapy in locally advanced cervical cancer: Long-term outcome and complications. Gynecol. Oncol.99, S166–S170 (2005). 10.1016/j.ygyno.2005.07.074 [DOI] [PubMed] [Google Scholar]
- 14.Cetina, L. et al. Brachytherapy versus radical hysterectomy after external beam chemoradiation with gemcitabine plus cisplatin: A randomized, phase iii study in ib2-iib cervical cancer patients. Ann. Oncol.24, 2043–2047 (2013). 10.1093/annonc/mdt142 [DOI] [PubMed] [Google Scholar]
- 15.Gupta, G. V. Differences between chemotherapy-resistant disease and inoperable disease in cervical cancer treated with neoadjuvant chemotherapy. J. Clin. Oncol.36, 2811–2811 (2018). 10.1200/JCO.2018.78.6632 [DOI] [PubMed] [Google Scholar]
- 16.Balcacer, P., Shergill, A. & Litkouhi, B. Mri of cervical cancer with a surgical perspective: Staging, prognostic implications and pitfalls. Abdom. Radiol.44, 2557–2571 (2019). 10.1007/s00261-019-01984-7 [DOI] [PubMed] [Google Scholar]
- 17.Tibshirani, R. Regression shrinkage and selection via the lasso. J. R. Stat. Soc. Ser. B Stat. Methodol.58, 267–288 (1996). 10.1111/j.2517-6161.1996.tb02080.x [DOI] [Google Scholar]
- 18.Cortes, C. & Vapnik, V. Support-vector networks. Mach. Learn.20, 273–297 (1995). 10.1007/BF00994018 [DOI] [Google Scholar]
- 19.Liu, Z. et al. Radiomics analysis for evaluation of pathological complete response to neoadjuvant chemoradiotherapy in locally advanced rectal cancer. Clin. Cancer Res.23, 7253–7262 (2017). 10.1158/1078-0432.CCR-17-1038 [DOI] [PubMed] [Google Scholar]
- 20.Huang, M.-L., Hung, Y.-H., Lee, W., Li, R.-K. & Jiang, B.-R. Svm-rfe based feature selection and taguchi parameters optimization for multiclass svm classifier. Sci. World J.2014, 795624 (2014). 10.1155/2014/795624 [DOI] [PMC free article] [PubMed] [Google Scholar]
- 21.Sun, C. et al. Radiomic analysis for pretreatment prediction of response to neoadjuvant chemotherapy in locally advanced cervical cancer: A multicentre study. EBioMedicine46, 160–169 (2019). 10.1016/j.ebiom.2019.07.049 [DOI] [PMC free article] [PubMed] [Google Scholar]
- 22.Breiman, L. Random forests. Mach. Learn.45, 5–32 (2001). 10.1023/A:1010933404324 [DOI] [Google Scholar]
- 23.Litjens, G. et al. A survey on deep learning in medical image analysis. Med. Image Anal.42, 60–88 (2017). 10.1016/j.media.2017.07.005 [DOI] [PubMed] [Google Scholar]
- 24.Liu, W. et al. Development and validation of multi-omics thymoma risk classification model based on transfer learning. J. Digit. Imaging36, 2015–2024 (2023). 10.1007/s10278-023-00855-4 [DOI] [PMC free article] [PubMed] [Google Scholar]
- 25.He, K., Zhang, X., Ren, S. & Sun, J. Deep residual learning for image recognition. In Proc. of the IEEE Conference on Computer Vision and Pattern Recognition, 770–778 (2016).
- 26.Liu, X. et al. Deep learning radiomics-based prediction of distant metastasis in patients with locally advanced rectal cancer after neoadjuvant chemoradiotherapy: A multicentre study. EBioMedicine69, 103442 (2021). 10.1016/j.ebiom.2021.103442 [DOI] [PMC free article] [PubMed] [Google Scholar]
- 27.Ning, Z. et al. Pattern classification for gastrointestinal stromal tumors by integration of radiomics and deep convolutional features. IEEE J. Biomed. Health Inform.23, 1181–1191 (2018). 10.1109/JBHI.2018.2841992 [DOI] [PubMed] [Google Scholar]
- 28.Mayerhoefer, M. E. et al. Introduction to radiomics. J. Nucl. Med.61, 488–495 (2020). 10.2967/jnumed.118.222893 [DOI] [PMC free article] [PubMed] [Google Scholar]
- 29.Ou, Z. et al. A preoperative nomogram for predicting chemoresistance to neoadjuvant chemotherapy in patients with locally advanced cervical squamous carcinoma treated with radical hysterectomy. Cancer Res. Treat. Off. J. Korean Cancer Assoc.53, 233 (2021). [DOI] [PMC free article] [PubMed] [Google Scholar]
- 30.Jeong, S. et al. Comparing deep learning and handcrafted radiomics to predict chemoradiotherapy response for locally advanced cervical cancer using pretreatment mri. Sci. Rep.14, 1180 (2024). 10.1038/s41598-024-51742-z [DOI] [PMC free article] [PubMed] [Google Scholar]
- 31.Zeng, S., Yang, P., Xiao, S. & Liu, L. Development and validation of prognostic nomographs for patients with cervical cancer: Seer-based asian population study. Sci. Rep.14, 7681 (2024). 10.1038/s41598-024-57609-7 [DOI] [PMC free article] [PubMed] [Google Scholar]
- 32.Liu, L. et al. A novel nomogram and risk stratification for early metastasis in cervical cancer after radical radiotherapy. Cancer Med.12, 21798–21806 (2023). 10.1002/cam4.6745 [DOI] [PMC free article] [PubMed] [Google Scholar]
- 33.Lin, J. et al. A novel nomogram based on inflammation biomarkers for predicting radiation cystitis in patients with local advanced cervical cancer. Cancer Med.13, e7245 (2024). 10.1002/cam4.7245 [DOI] [PMC free article] [PubMed] [Google Scholar]
Associated Data
This section collects any data citations, data availability statements, or supplementary materials included in this article.
Supplementary Materials
Data Availability Statement
The datasets used and/or analyzed during the current study available from the corresponding author on reasonable request.