

Abstract
Widespread contamination of groundwater with per- and polyfluoroalkyl substances (PFAS) has required drinking water producers to quickly adopt practical and efficacious treatments to limit human exposure and deleterious health outcomes. This pilot-scale study comparatively investigated PFAS adsorption behaviors in granular activated carbon (GAC) and two strong-base gel anion exchange resin (AER) columns operated in parallel over a 441-day period to treat contaminated groundwater dominated by short-chain perfluorocarboxylic acids (PFCA). Highly-resolved breakthrough profiles of homologous series of 2–8 CF2 PFCA and perfluorosulfonic acids (PFSA), including ultrashort-chain compounds and branched isomers, were measured to elucidate adsorption trends. Sample ports at intermediate bed depths could predict 50% breakthrough of compounds on an accelerated basis, but lower empty bed contact times led to conservative estimates of initial breakthrough. Homologous PFAS series displayed linear (GAC) and log-linear (AER) relationships between chain-length and breakthrough, independent of initial concentration. AERs generally outperformed GAC on a normalized bed volume basis, and this advantage widened with increasing PFAS chain-length. As designed, all treatments would have short full-scale service times (≤142 days for GAC; ≤61 days for AERs) before initial breakthrough of short-chain (2–4 CF2) PFCA. However, AER displayed far longer breakthrough times for PFSA compared to GAC (>3× treatment time), and breakthrough was not observed for PFSA with >4 CF2 in AERs. GAC had a finite molar adsorption capacity for total PFAS, leading to a stoichiometric replacement of short-chain PFCA by PFSA and longer-chain PFCA over time. AERs quickly reached a finite adsorption capacity for PFCA, but they showed substantially greater selectivity for PFSA whose capacity was not reached within the duration of the pilot. Breakthrough characteristics of keto- and unsaturated-PFSA, identified in the groundwater by suspect screening, were also evaluated in absence of reference standards. Modified PFAS structures (branched, keto-, unsaturated-) broke through faster than linear and unmodified perfluorinated structures with equal degrees of fluorination, and the effects were more pronounced in GAC compared to AERs. The results highlight that the design of robust PFAS treatment systems should consider facets beyond current PFAS targets including operational complexities and impacts of unregulated and unmonitored co-contaminants.
Keywords: Drinking water treatment, Per- and polyfluoroalkyl substances (PFAS), Ion exchange, Granular activated carbon, Adsorption
1. Introduction
Per- and polyfluoroalkyl substances (PFAS) are a wide-ranging group of persistent fluorine-substituted organic chemicals of worldwide environmental health concern. Widespread PFAS detection in drinking water sources has prompted utilities to implement treatments to meet increasingly stringent health guidelines and regulations (European Union 2020; U.S. EPA 2022). Current drinking water regulatory guidelines emphasize treatment of legacy medium- to long-chain PFAS (≥6 CF2) such as PFHxS, PFOA, and PFOS (Hu et al. 2016; Massachusetts Department of Environmental Protection 2020). However, a shift in production and regulatory scrutiny to short-chain compounds such as PFBA, PFBS, and GenX (Brendel et al. 2018; U.S. EPA 2022) has necessitated treatment consideration of these less hydrophobic substitutes. PFAS, particularly persistent anionic perfluoroalkyl acids (PFAA), are not effectively removed in conventional water treatment processes due to their solubility and the recalcitrance of carbon-fluorine bonds (Appleman et al. 2014; Rahman et al. 2014). However, advanced physical-chemical separation processes including adsorption and high-pressure membranes (e.g., reverse osmosis and nanofiltration), have demonstrated efficacious PFAS removal under a variety of source water conditions (Appleman et al. 2014; Boyer et al. 2021; Liu et al. 2021).
Adsorptive processes are particularly appealing water treatment options due to their low-pressure operating conditions, lack of concentrated aqueous waste streams, and potential for future regeneration and reuse (Franke et al. 2021; Zaggia et al. 2016). Adsorptive media such as granular activated carbon (GAC) and anion exchange resins (AERs) remove PFAS through a combination of electrostatic interactions with charged headgroups and non-electrostatic interactions with hydrophobic fluorinated tail groups (Du et al. 2014). GAC adsorption can be primarily attributed to attraction to hydrophobic pore surfaces with secondary electrostatic attraction or repulsion depending on the net surface charge of the GAC (Park et al. 2020b). AER adsorption is based on a combination of selective ion exchange interactions with cationic resin functional groups and hydrophobic interactions with the resin (Boyer et al. 2021; Zaggia et al. 2016). Despite widespread implementation of GAC treatment for a variety of micropollutants, interest in AERs has grown specifically for PFAS due to their high capacity and selectivity, particularly towards perfluorosulfonic acids (PFSA) and longer-chain perfluorocarboxylic acids (PFCA) (Franke et al. 2021; McCleaf et al. 2017; Murray et al. 2021). Additionally, AER treatments can be designed with shorter empty bed contact times (EBCT; 1.5–3 mins) and vessel footprints compared to GAC (8–13 min) (Murray et al. 2021; Purolite 2021). Because of the influence of hydrophobic interactions, both GAC and AER exhibit higher efficacy treating long-chain PFAS compared to more hydrophilic short-chain homologs (Appleman et al. 2014; McCleaf et al. 2017). These technologies have not been comprehensively compared for treatment of groundwater dominated by shorter-chain PFCA.
Pilot-scale adsorptive treatability studies are crucial to evaluate the efficacy of different treatment technologies under site-specific water matrix characteristics, PFAS contaminant profiles, and treatment goals. Continuous-flow PFAS treatment studies to date have been primarily limited to targeted PFAA, particularly water with substantial fractions of long-chain PFSA (Boyer et al. 2021, Gagliano et al. 2020). Co-occurrence of dozens of additional PFAS classes have been revealed by suspect screening of contaminated groundwater (Barzen-Hanson et al. 2017; Nickerson et al. 2020), however, they are rarely evaluated for treatability once identified (Liu and Sun 2021; Wang et al. 2020). Furthermore, treatability of co-occurring ultrashort-chain (2–3 CF2) and branched PFAA isomers in groundwater are not often considered (Neuwald et al. 2022; Rahman et al. 2014), obscuring a more complete understanding of competitive PFAS adsorption behaviors. Considering the time and cost required to operate pilot-scale treatment studies, it is important to maximize the analytical value of each tested system to develop a more comprehensive understanding of long-term adsorption behavior in complex PFAS mixtures.
This study provides a comparative characterization of PFAS adsorption behaviors onto GAC and AERs based on a 15-month pilot-scale treatment of contaminated groundwater. Using highly-resolved multi-port breakthrough data, systematic treatability trends were elucidated for each adsorbent type based on PFAS chain-length, headgroup functionality, and branching tail structure. New insights into competitive adsorption were determined based on a comprehensive molar balance of adsorbed PFAS including ultrashort-chain compounds. Several PFAS detected by suspect screening were identified and evaluated for adsorptive breakthrough characteristics. These novel approaches offer fundamental and practical insights into the behavior and design of adsorptive PFAS treatments.
2. Materials and methods
2.1. Pilot system
The pilot was conducted onsite at a PFAS-contaminated municipal groundwater well in Minnesota, USA within an enclosed wellhouse. Three columns consisting of one GAC and two AERs were operated in parallel. Columns were constructed out of clear, rigid polyvinyl chloride and sized according to manufacturer-specified contact times suitable for full-scale operation. The GAC column had a 74.7 L bed volume (BV), 7.3 L/min flowrate, 14 m/hr hydraulic loading rate (HLR), and target EBCT of 10 min (10.3 min measured). The selected GAC, Norit® GAC 1240 Plus (Cabot Corp), was an acid-washed virgin bituminous coal-based carbon. AER columns had 4.6 L BVs, 1.7 L/min flowrates, 22 m/hr HLRs, and target 2.5 min EBCT (2.7 min measured). Selected AERs were strong-base polystyrene gel resins shipped in Cl− form. AER1 contained Purofine® PFA694E (Purolite; King of Prussia, PA) and AER2 contained Dowex™ PSR2 Plus (Evoqua Water Technologies; Pittsburgh, PA). Adsorbent specifications supplied by manufacturers, including functionalities, bulk densities, and exchange capacities are listed in Supplementary Table S1. AER columns contained intermediate sample ports at approximately 1/4 and 1/2 of their total 98 cm bed depths. The GAC column contained intermediate ports at approximately 1/3 and 2/3 of the total 234 cm bed depth. Physical and hydraulic properties of each column sample port are given in Fig. 1 and SI Section S1.
Fig. 1.
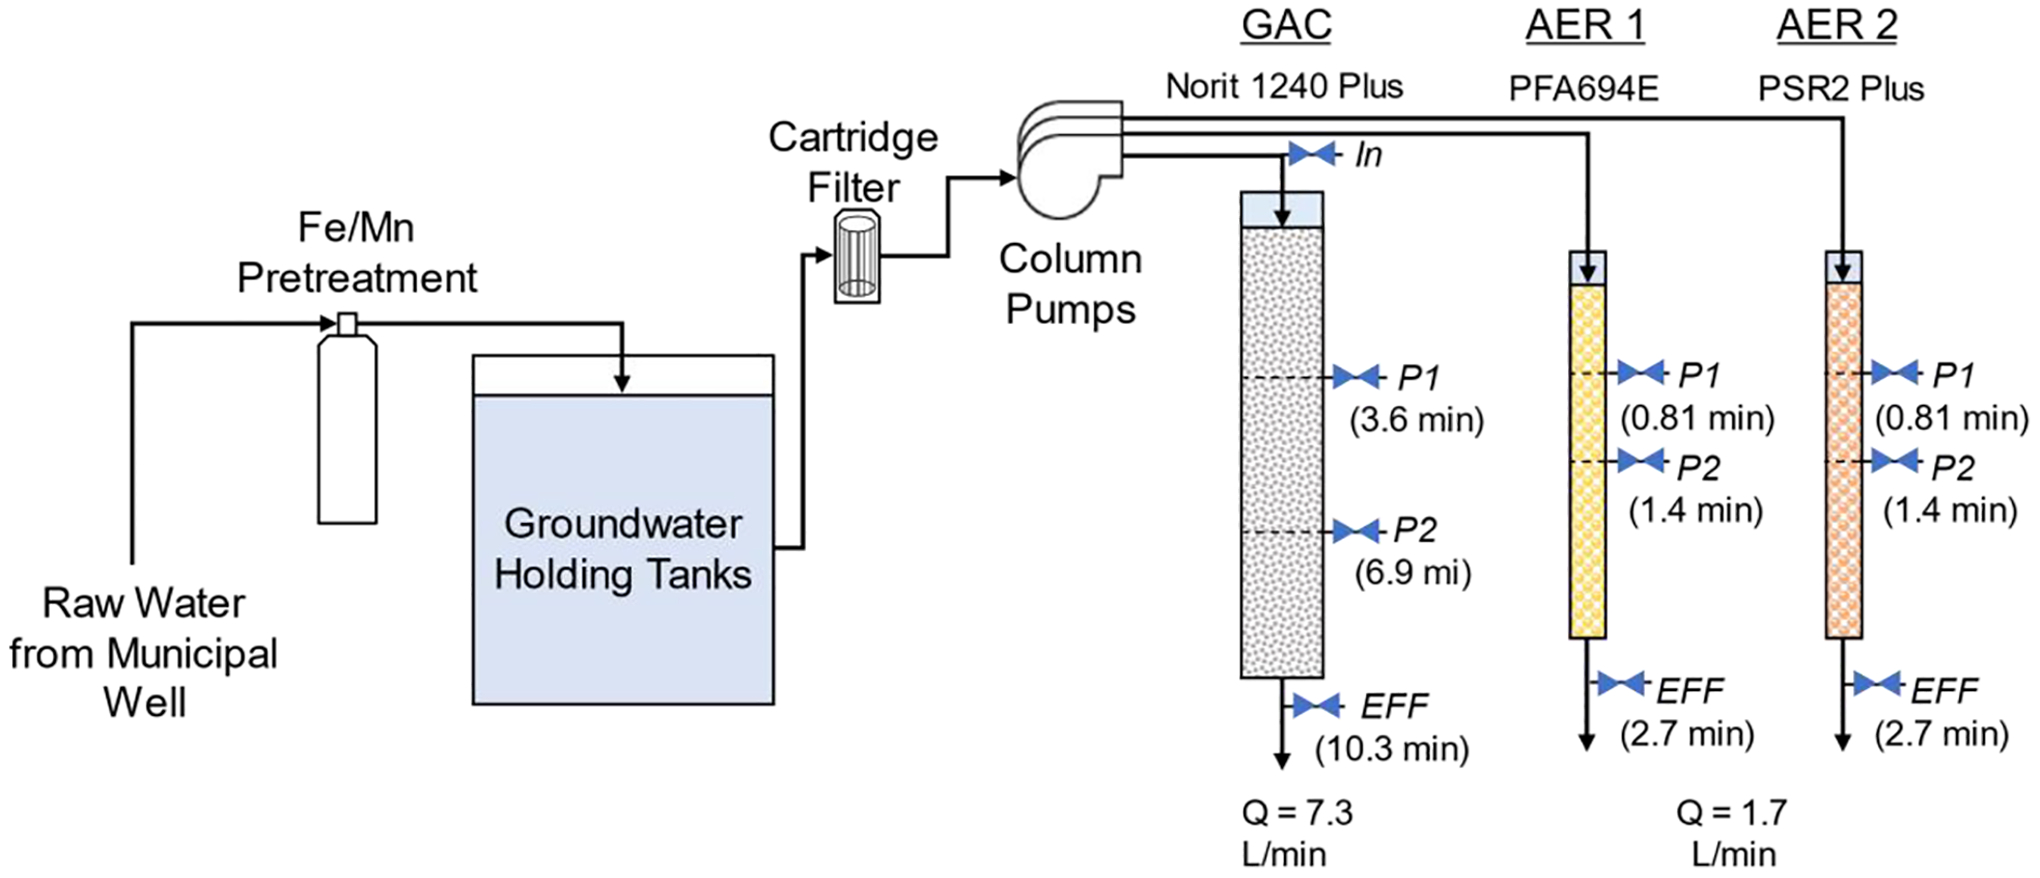
Configuration of pilot system. Column sample ports labeled with name and corresponding empty bed contact time (EBCT) in parentheses.
Feedwater was sourced from a municipal groundwater well, passed through a manganese dioxide granular pretreatment for manganese and iron removal, and stored in level-controlled intermediate holding tanks for pilot use. Water was pumped continuously from the holding tanks through a 1 μm cartridge filter into pilot columns, which were operated over a 15-month (441-day) period with some intermittent pauses in flow for pilot service. During pauses, columns were hydraulically isolated to prevent bed fluidization and de-wetting of column pore space. On two occurrences, isolation failed and led to minor fluidization and re-compaction of column beds. Each column operated with an uptime of over 89%; 57,148 BVs of water were treated in GAC, 211,947 BVs in AER1, and 218,775 BVs in AER2. Further pilot operation details are reported in Section S1.
2.2. Sample collection and analysis
Samples were collected on a weekly basis over the first 159 days of operation, every two weeks for the next 147 days, and every three weeks for 135 days until the end of the pilot. Influent, P1, and effluent samples were collected consistently throughout pilot operation, while P2 sample collection was phased-in over the initial 40 days of operation (after 6 sample time points). The sampling protocol and quality control samples are detailed in the SI (Section S2). Additional water quality parameters were measured periodically during PFAS sample collection (Section S3).
PFAS were extracted from water samples by weak anion exchange (WAX) solid-phase extraction (SPE) followed by liquid chromatography-tandem mass spectrometry (LC-MS/MS) analysis using a previously described protocol (Chow et al. 2021). Briefly, 250 mL water samples were spiked with 2.5 ng of a mixture of 20 isotopically labeled internal standards (Wellington Labs, Guelph, ON) and acidified to pH 3 with 3.5 M H2SO4. Sample were extracted in a fluoropolymer-free vacuum manifold using Oasis WAX SPE cartridges (6 mL, 150 mg; Waters Corporation, Milford, MA), eluted using 0.5% NH4OH/MeOH, and evaporated to a final volume of 0.5 mL under a gentle stream of air. Samples were analyzed for 33 targeted PFAS by LC-MS/MS (Section S4), including 2–13 CF2 PFCA and 2–10 CF2 PFSA. PFAS concentrations were reported in acid form for their linear isomers unless explicitly stated as branched isomers (e.g., br-PFHxS). Branched isomers were identified in chromatograms as peaks with the same MS/MS transitions but earlier retention times as linear isomer reference standards (Fig. S1). In absence of available quantitative standards for most branched isomers, reported concentrations were semi-quantitatively estimated based on linear standards. Calculated method detection limits (MDLs) were used as lower reporting limits for PFAS concentrations. A detailed description of all PFAS analytes, MS/MS parameters, quantitation, and MDLs is given in the SI (Section S4).
2.3. TOP assay and LC-HRMS analysis to elucidate the presence of unknown PFAS
A total oxidizable precursor (TOP) assay (Houtz and Sedlak 2012) was conducted on influent groundwater to determine the abundance of potential unidentified targeted precursors (Section S5). LC-high resolution mass spectrometry (LC-HRMS) was employed to screen influent water for additional PFAS that were not initially targeted in the LC-MS/MS method. A full description of the suspect screening processes is detailed in the SI (Section S6). Briefly, SPE extracts from influent water samples were analyzed in negative mode with full-scan plus data-dependent MS2 acquisition using Orbitrap MS (Thermo Fisher Q-Exactive HF). Exact mass features were screened against two curated mass lists containing over 1400 PFAS (Nickerson et al. 2020, PFAS-STRUCTV3 2022) and MS2 fragmentation was compared with diagnostic and expected fragments using Compound Discoverer software (Thermo Fisher).
The identified compounds were subsequently included in the LC-MS/MS method based on the main MS fragments to investigate their behavior in the pilot system. Select samples were re-analyzed retrospectively to generate suspect breakthrough curves. The breakthrough behavior was determined without reference standards based on relative response of analyte peak area values normalized to a structurally similar internal standard. Details of this suspect analysis are given in the SI (Section S7).
2.4. Data analysis
PFAS breakthrough was reported as a nondimensional percentage of pilot influent concentration (C/C0) measured on the same date. Throughput of each column was reported in terms of non-dimensional BVs as the cumulative product of online flow measurement Q and the pilot runtime t within recorded data intervals i, normalized by the superficial empty bed volume Vbed (Eq. 1). Initial breakthrough (C/C0=10%) and half-breakthrough (C/C0=50%) were reported in terms of BVs as BV10 and BV50 respectively using interpolation of measured datapoints).
| (1) |
Breakthrough data were fitted to the dose-response model (Eq. 2), which had been shown fit a variety of asymmetric PFAS breakthrough curves well compared to other descriptive models (Croll et al. 2022). Measured breakthrough data were fitted to model shaping coefficients a and b using a Levenberg-Marquardt nonlinear regression algorithm (minpack.lm R package). Models were only fitted to data points where C/C0 did not exceed 100% to exclude desorption regions of certain breakthrough curves not well-described without model modification (Croll et al. 2022). In select cases where interpolated datapoints did not follow a smooth curve, modeled data were used to calculate BV10 and BV50 values as noted in the SI.
| (2) |
Cumulative mass loadings M(t) of PFAS onto adsorbents were calculated based on a mass balance of influent C0 and effluent concentrations Cx at a given adsorbent bed depth x integrated over a column’s cumulative volumetric throughput Vrun. This was approximated using trapezoidal-rule integration of removal across defined BV intervals between sample points (Eq. 3). Bed adsorption density was calculated by normalizing mass loading to the mass of adsorbent mads using the packed bed density ρbed of a given bed (Eq. 4).
| (3) |
| (4) |
Physical-chemical properties of PFAS used to investigate breakthrough patterns (pKa and octanol-water coefficient at pH 7 log Dow) were calculated in Supplementary Table S7 using MarvinSketch 21.16 (ChemAxon Ltd.). Calculated log Dow values showed strong correlation (R2>0.98) with measured LC retention time within respective functional classes independent of fluorinated tail structure (Fig. S5).
3. Results and discussion
3.1. Characterization of groundwater PFAS contamination
The groundwater used in the pilot was contaminated by production and disposal of PFAS in the surrounding region. Historic PFOA and PFOS production and contemporary PFBS production resulted in localized plumes of long-chain PFAS proximal to disposal sites and more widespread plumes of short-chain PFAS that extended to the study location. Measured groundwater pH was circumneutral (pH 7.51), and background constituents included 0.71 mg/L total organic carbon (TOC), 37.1 mg/L chloride, 0.77 mg/L nitrate, and 58.0 mg/L sulfate (Supplementary Table S8).
Among the 33 targeted PFAS, 15 were detected consisting of linear 2–7 CF2 PFCA, 2–8 CF2 PFSA, and 4, 6 CF2 perfluorosulfonamides (FASA) (Table 1). These included ultrashort-chain PFPrA and PFEtS, which have not previously been assessed for packed-bed adsorptive treatment. Branched isomers of 4–7 CF2 PFCA (br-PFCA) and 4–8 CF2 PFSA (br-PFSA) co-occurred with linear isomers, comprising an increasing fraction of total compound with increasing chain-length (Table 1). The presence of branched isomers was indicative of legacy production of long-chain PFAS by electrochemical fluorination (ECF; Benskin et al. 2009). The TOP assay results revealed a negligible increase (1.3%) in total measured PFAS mass post-oxidation compared to untreated samples (Supplementary Table S9), suggesting the majority of PFAS mass in the pilot groundwater were PFAA identified and measured in this study (see Section 3.6 for further details on the identification of additional, unknown PFAS). The profile of quantified PFAS was uniquely dominated by PFCA (79%) and short-chain (2–4 CF2) PFAA (89%), with concentrations of short-chain compounds nearly 2 orders of magnitude greater than their 7–8 CF2 homologs (Table 1). The most abundant PFAS detected in groundwater were PFBA (915 ng/L), PFPrA (435 ng/L), PFBS (130 ng/L), and PFPrS (95 ng/L), compounds expected to be extremely mobile in groundwater (Neuwald et al. 2022). Influent PFAS concentrations remained generally stable throughout the pilot study (Table 1, Fig. S6), with coefficients of variation less than 27% for all analytes.
Table 1.
PFAS detected in groundwater and monitored in pilot system.
| Compound | Abbreviation | Chain-length | Concentration ± 2 S.D. (ng/L)c | ||
|---|---|---|---|---|---|
| #C a | #CF2 b | Linear | Branched Isomers d | ||
| Perfluorocarboxylic Acids (PFCA) | |||||
| Perfluoropropanoic acid | PFPrA | 3 | 2 | 435.0 ± 126.6 | n.d. |
| Perfluorobutanoic acid | PFBA | 4 | 3 | 914.6 ± 92.7 | n.d. |
| Perfluoropentanoic acid | PFPeA | 5 | 4 | 59.1 ± 8.5 | 9.3 ± 3.4 |
| Perfluorohexanoic acid | PFHxA | 6 | 5 | 44.3 ± 4.6 | 8.7 ± 1.2 |
| Perfluoroheptanoic acid | PFHpA | 7 | 6 | 6.0 ± 0.8 | 2.3 ± 0.3 |
| Perfluorooctanoic acid | PFOA | 8 | 7 | 14.5 ± 1.9 | 6.1 ± 1.4 |
| Perfluorosulfonic Acids (PFSA) | |||||
| Perfluoroethane sulfonic acid | PFEtS e | 2 | 2 | 24.1 ± 13.1 | n.d. |
| Perfluoropropane sulfonic acid | PFPrS | 3 | 3 | 95.4 ± 20.6 | n.d. |
| Perfluorobutane sulfonic acid | PFBS | 4 | 4 | 130.4 ± 18.3 | 2.7 ± 0.6 |
| Perfluoropentane sulfonic acid | PFPeS | 5 | 5 | 82.9 ± 10.7 | 11.4 ± 3.2 |
| Perfluorohexane sulfonic acid | PFHxS | 6 | 6 | 48.2 ± 7.7 | 28.0 ± 3.9 |
| Perfluorheptane sulfonic acid | PFHpS | 7 | 7 | 0.9 ± 0.2 | 2.1 ± 0.6 |
| Perfluorooctane sulfonic acid | PFOS | 8 | 8 | 1.5 ± 0.4 | 1.3 ± 0.2 |
| Perfluorosulfonamides (FASA) | |||||
| Perfluorobutane sulfonamide | FBSA | 4 | 4 | 3.5 ± 1.2 | n.d. |
| Perfluorohexane sulfonamide | FHxSA | 6 | 6 | 0.8 ± 0.4* | n.d. |
n.d. – not detected.
Number of carbons in compound including functional group.
Number of perfluorinated carbons in compound including CF3 tail.
Average concentration measured in pilot influent throughout duration of test (n=34, ± 2 standard deviations).
Branched isomer concentrations were estimated based on linear standards, except for PFHxS and PFOS.
PFEtS concentration was estimated based on PFPrS calibration.
Compound was not tracked for breakthrough in pilot due to low concentration.
3.2. Linear PFAS breakthrough characteristics
Breakthrough curves of targeted PFAS showed several common characteristics across the tested adsorbents. At full bed depths, minimal breakthrough occurred for compounds with ≥5 CF2 chain-lengths, thus indicating efficient removal of longer-chain compounds within the designed pilot operating period (Fig. 2a). Sample port data at intermediate bed depths (P1, Fig. 2b; P2, Fig. S7) yielded more complete breakthrough curves for all PFAS, enabling analysis of 1.5–4 times greater BV throughput but at reduced EBCT (discussed further in Section 3.5). Breakthrough curves at all sample ports generally followed an asymmetric sigmoidal shape, illustrating initial periods of complete removal, rapid loss of removal efficiency, and eventual saturation as BV throughput progressed. Desorption (C/C0>100%) also occurred for the shorter compounds (≤4CF2) in all columns, suggesting a competitive adsorption process between different PFAS (discussed in Section 3.4). Intermittent nitrate and sulfate (Fig. S8) and TOC (Fig. S9) measured at sample ports did not reveal discernable adsorption patterns over the duration of the pilot that could be compared to PFAS breakthrough. Discontinuous breaks in the breakthrough curves (denoted in Fig. 2) can be attributed to failed hydraulic isolation disrupting bed packing, described in Section 2.1. All columns displayed an increasing number of BVs to breakthrough with increasing PFCA and PFSA chain-length (Fig. 2), characteristic of both GAC and AER columns (McCleaf et al. 2017; Park et al. 2020b).
Fig. 2.
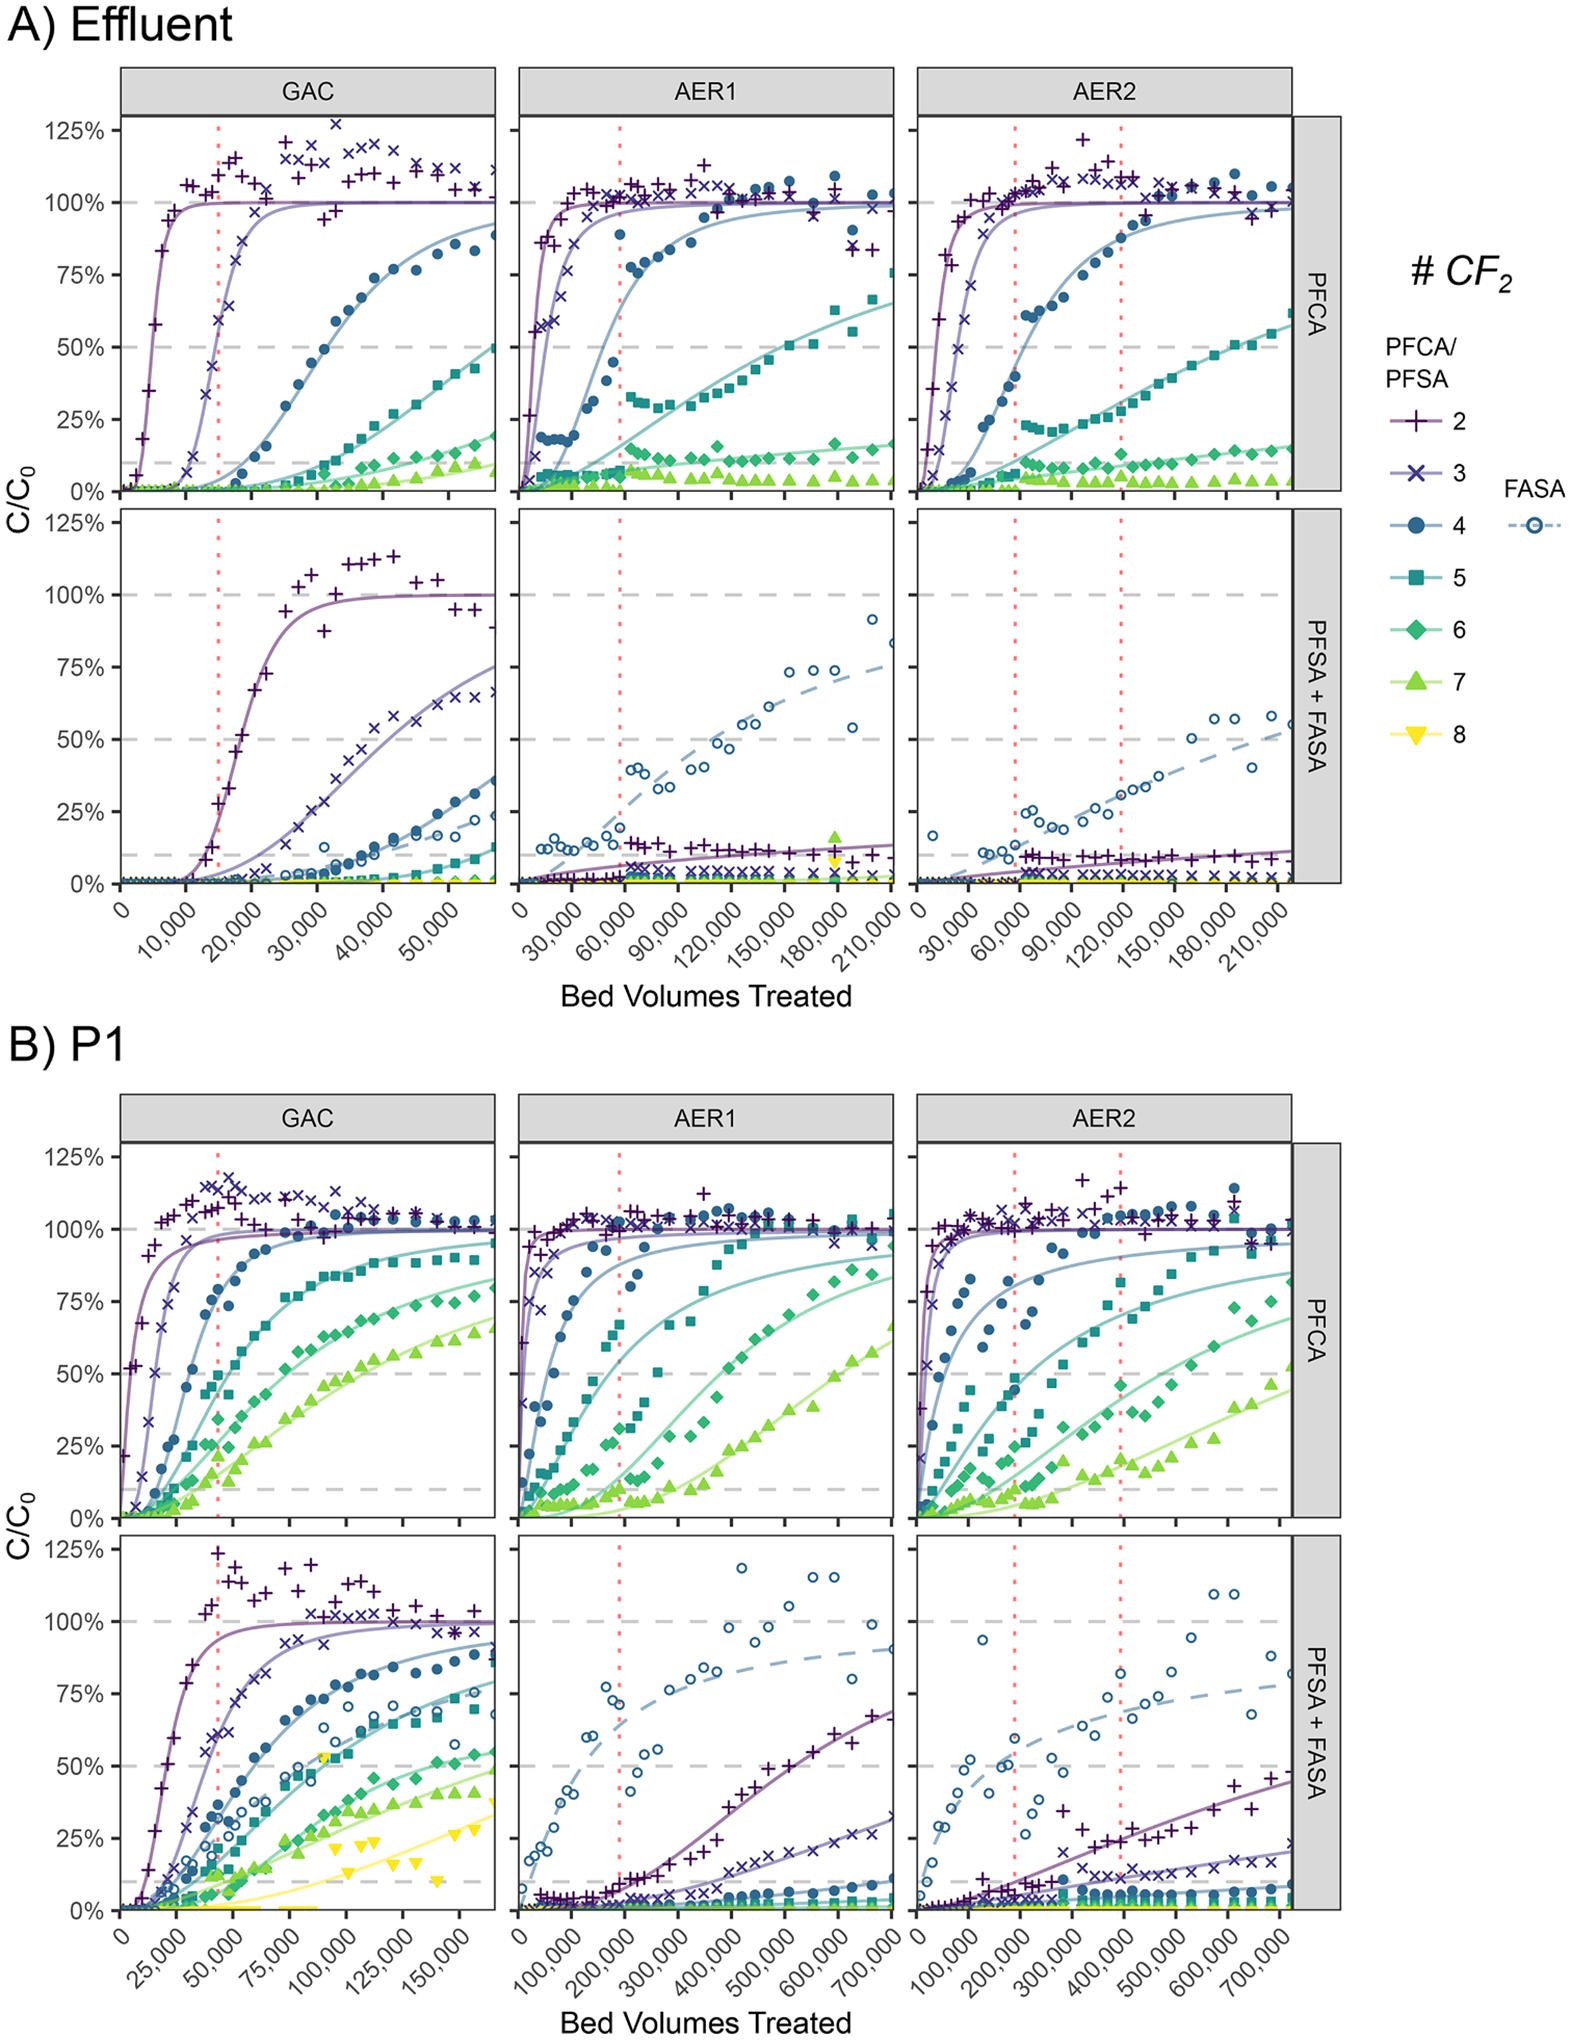
Influent-normalized breakthrough of linear PFAS in each tested column at A) effluent port (GAC EBCT=10.3 min; AER EBCT=2.7 min) and B) intermediate sample port P1 (GAC EBCT=3.6 min; AER EBCT=0.81 min). Modeled dose-response breakthrough curves are shown with measured data for visual aid. Breakthrough at 10%, 50%, and 100% are shown for reference. Dotted red vertical lines correspond to BVs of bed disruptions from pilot interruptions that led to discontinuous breaks in some breakthrough curves at days 111 and 264.
There were noticeable differences in breakthrough characteristics between PFAS classes. PFSA breakthrough occurred more slowly than equivalent-length PFCA breakthrough in all columns (Fig. 2). In GAC, PFSA systematically broke through after PFCA analogs containing n+1 CF2 units (e.g., PFBS>PFHxA). In contrast, PFSA breakthrough was drastically delayed in both AERs. PFSA compounds broke through after n+4 CF2 PFCA (e.g., PFEtS>PFHpA). Breakthrough of FBSA, a short-chain FASA, occurred much later than equivalent-length PFPeA and marginally later than PFBS in GAC (Fig. 2). This was in agreement with previously reported adsorption affinity of FASA≥PFSA>PFCA from other GAC pilot studies (FHxSA, Rodowa et al. (2020); PFOSA, McCleaf et al. (2017)). In both AERs, FBSA breakthrough closely tracked that of PFHxA and preceded all PFSA. This suggested relative class affinity for AERs was PFSA>>FASA>PFCA. Retention of FBSA on AERs suggests that it was present in a deprotonated R-NH− form in order to undergo anion exchange (Wang et al. 2020).
3.3. Impacts of PFAS branching on breakthrough
Branched PFAA systematically exhibited faster breakthrough compared to their linear isomers. Fig. 3 illustrates overlaid breakthrough curves of linear and branched isomers from GAC and AER1 sampled at P1. For GAC, breakthrough of both branched PFCA and PFSA substantially overlapped those of n-1 CF2 linear homologs (e.g., br-PFHpA=PFHxA). In AER1, breakthrough curves of branched isomers were between those of their linear isomers and n-1 homologs (e.g., PFHxA<br-PFHxA<PFHpA). Nearly identical patterns were observed in AER2 (Fig. S10). Branching generally results in a reduction in hydrophobicity (Wang et al. 2011), however, hydrophobicity would not fully explain the observed reduction in adsorption. The calculated hydrophobicity of mono-methyl br-PFHxS isomers (log Dow=1.39; Supplementary Table S10), known to predominate ECF-derived PFAS mixtures (Wang et al. 2011), was marginally lower than for linear PFHxS (log Dow=1.65). However, when compared to the Dow value of linear PFPeS (log Dow=0.95), the effects of isomeric structure were substantially smaller than reduction in chain-length. Other factors including steric hinderance (Wang et al. 2011) and variations in atomic charge (Park et al. 2020a) may also play a role in determining branched isomer adsorption.
Fig. 3.
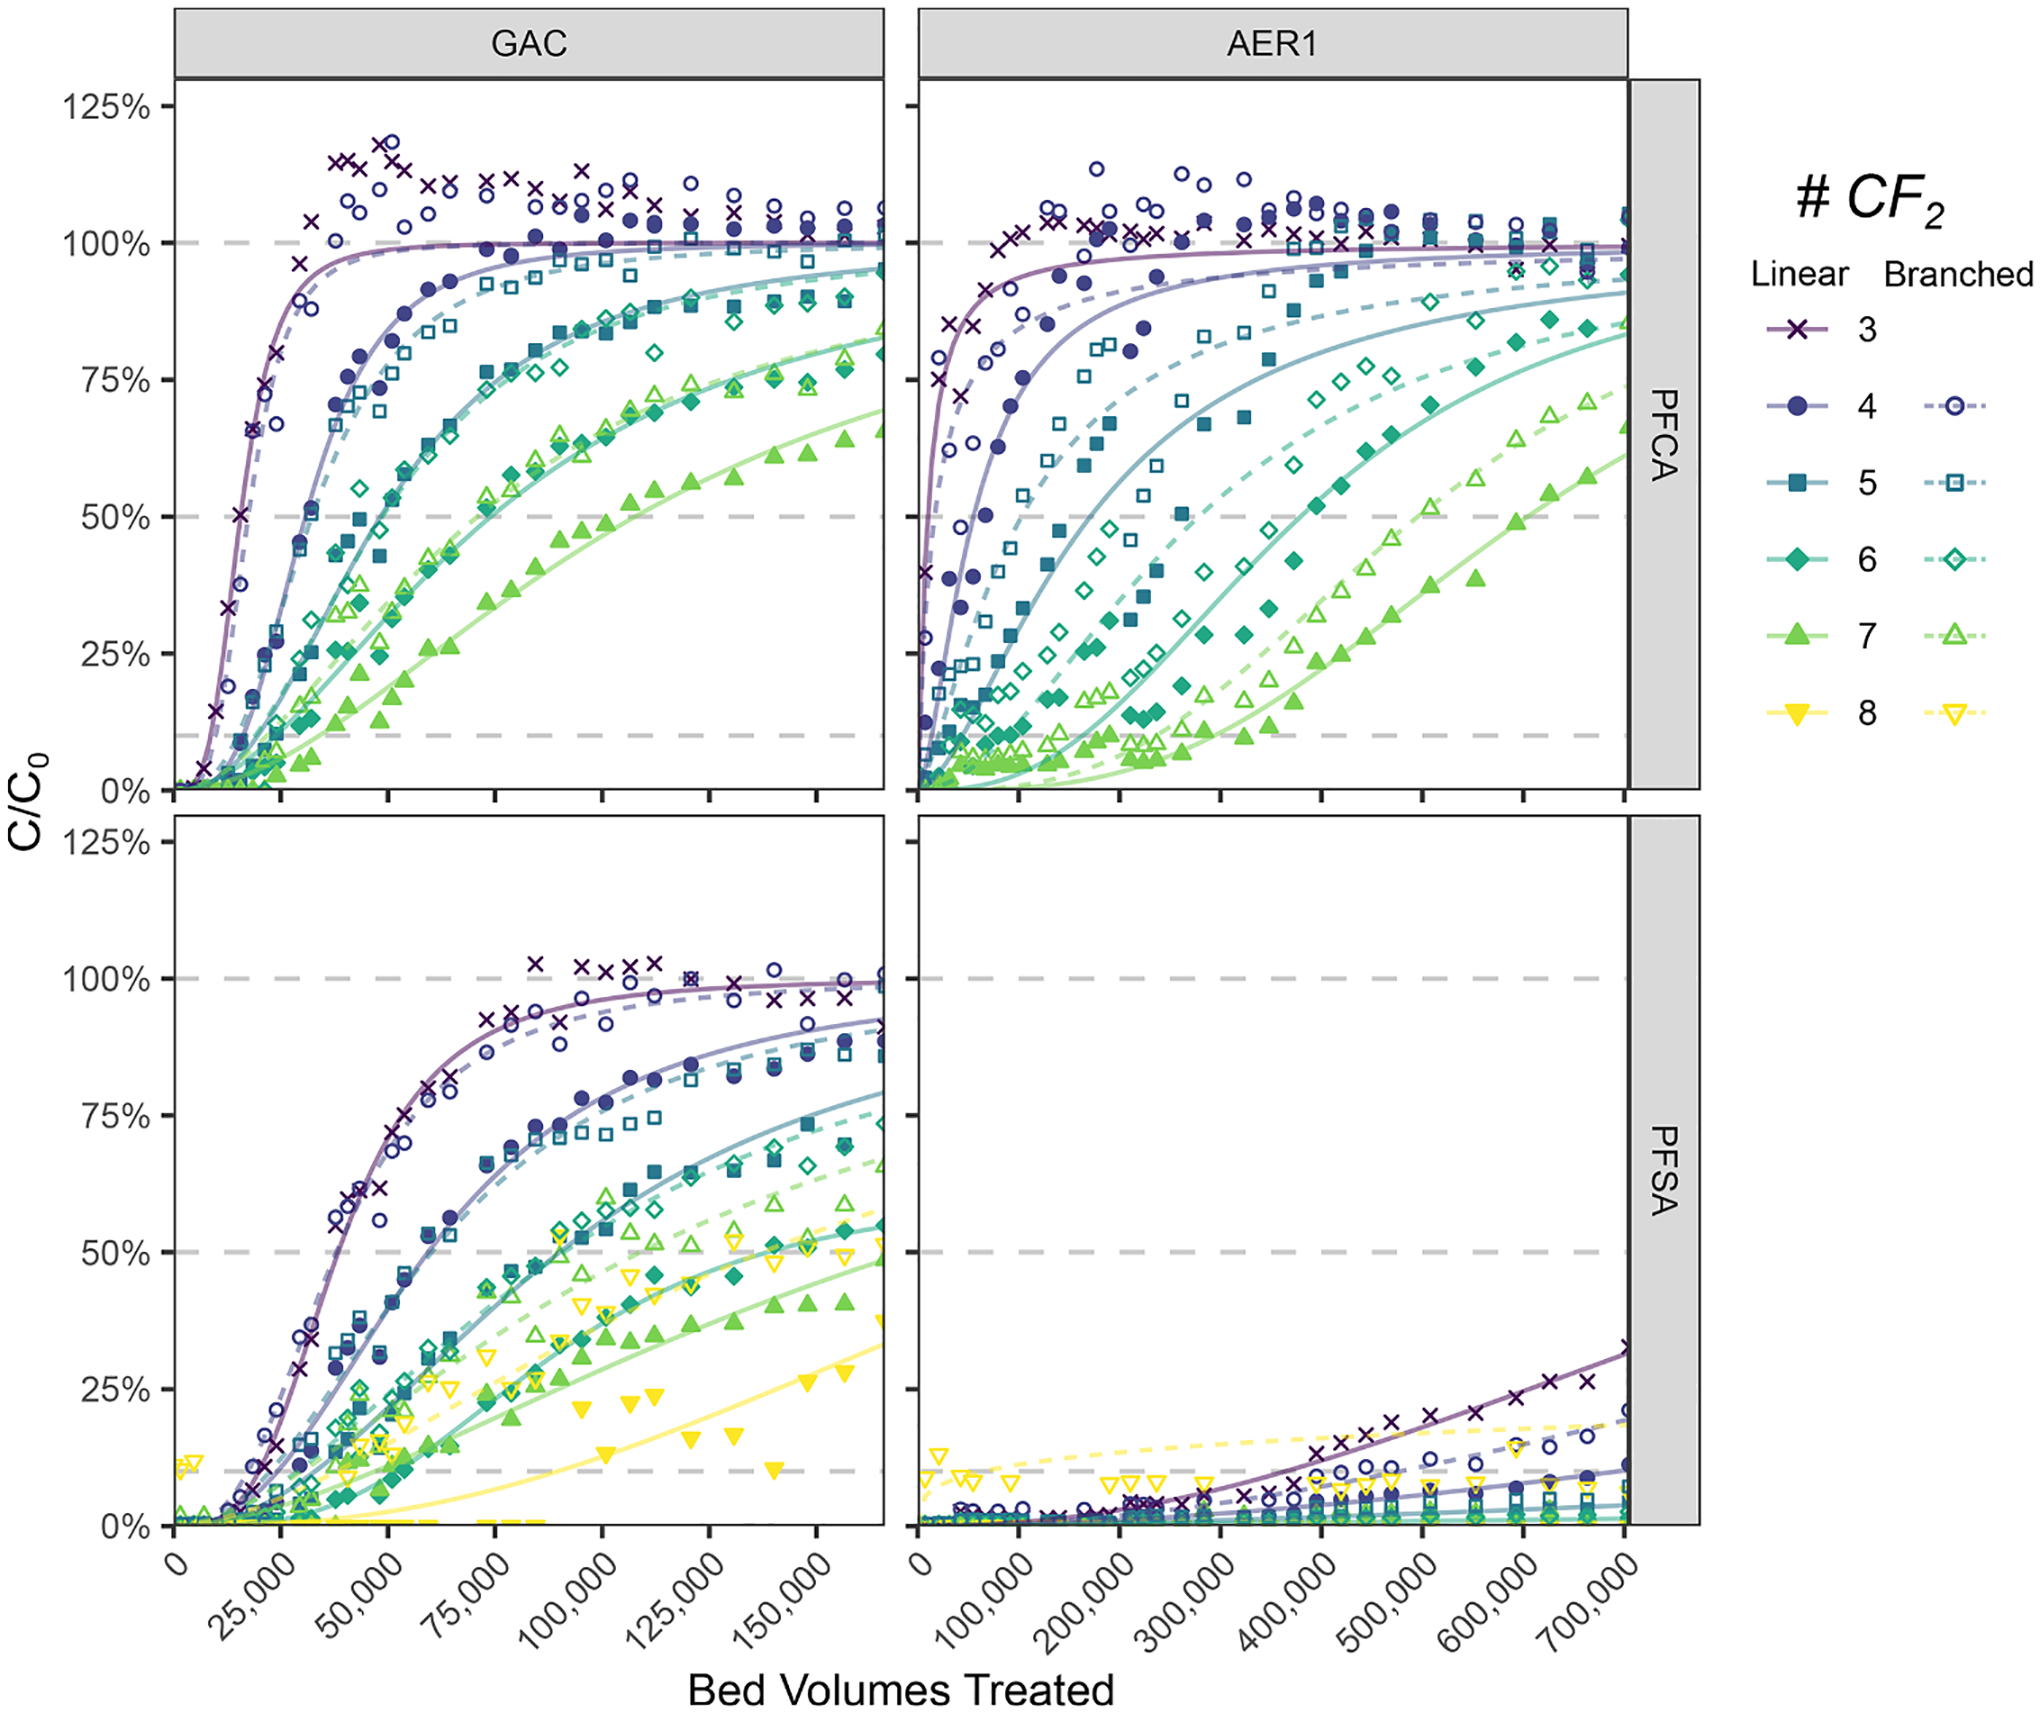
Comparison of linear and branched PFAA breakthrough at sample port P1 in GAC and AER1. Modeled dose-response breakthrough curves are shown with measured data for visual aid. Breakthrough at 10%, 50%, and 100% are shown for reference.
Although branched PFAS breakthrough has frequently been reported to occur earlier than linear isomers in adsorptive treatment (McCleaf et al. 2017, Rodowa et al. 2020), to the authors’ knowledge, this is the first study demonstrating a consistent pattern in adsorptive breakthrough among homologous series. The obtained results demonstrate a potential advantage of AERs in treating both branched and linear isomers more equally compared to GAC, which may be important when treating ECF-derived PFAS sources, where branched isomers are prevalent. Continued consideration and differentiation of branched isomer treatability in future studies is warranted as toxicological understanding and regulation of these compounds evolves (Schulz et al. 2020).
3.4. Comparison of PFAS mass loading profiles
Temporal profiles of PFAS mass adsorbed to columns during pilot operation were developed using a mass balance at P1 (Fig. S11) and effluent ports (Fig. S12). Using accelerated throughput data from P1, mass loadings for all individual PFAS (branched and linear) at the end of the pilot were evaluated (Supplementary Table S11). GAC retained 85 μg PFAS/g adsorbent after passing 165,662 BVs, composed of 28% PFCA and 71% PFSA mass (compared to 79% PFCA and 20% PFSA in untreated water). AER1 and AER2 passed 704,646 and 724,340 BVs, respectively, and retained very similar masses of 441 and 460 μg/g. Adsorbed PFSA accounted for 88–89% of adsorbed PFAS mass on AERs versus only 11–12% for PFCA, over a 7-fold difference. Total adsorbed PFAS onto AER was over 5 times greater than GAC on an adsorbent mass basis; this difference would be expected to increase were the pilot to continue operation. Greater PFAS capacity in AERs compared to GAC has been generally reported in continuous-flow systems (Franke et al. 2021; Murray et al. 2021); however, actual adsorbent performance may be highly dependent on the presence of competing groundwater constituents such as natural organic matter (NOM) and nitrate (Appleman et al. 2013; Dixit et al. 2020). For example, Murray et al. (2021) found an order of magnitude greater mass loading capacity for long- and short-chain PFAS in a low-background groundwater (Σ10PFAS=18.9 μg/L; TOC=2.6 mg/L; ) with macroporous Calres® 2301 AER compared to F400 GAC (Calgon Corporation). On the other hand, Franke et al. (2021) reported only a two-fold greater PFAS mass loading (37 μg/g) onto PFA694 AER (also employed in AER1) resin compared to two different GACs (15–18 μg/g) treating nanofiltration concentrate (Σ11PFAS=570 ng/L; DOC=16 mg/L; ). Although only a single water source was investigated in this pilot, our results should be considered in the context of having low levels of competing constituents (TOC=0.71 mg/L; ) that may have had a minimal impact on adsorbent performance.
A comparison of mass loadings on a molar concentration basis identified distinct adsorption behaviors not obvious on a strict mass basis. Fig. 4 illustrates the molar loading of PFAS onto GAC and AER1 beds at P1 over the course of the pilot. For GAC, all measured PFAA appeared to compete for a finite number of adsorption sites as indicated by an asymptotic limit of 270 nmol PFAS/g adsorbent (Fig. 4). Weakly-adsorbing short-chain PFCA initially occupied the majority of adsorption sites but were slowly displaced over time by more strongly adsorbing PFAS (PFSA and longer-chain PFCA). This competitive replacement can also explain the asymmetric breakthrough curve shapes observed for longer-chain PFAS, where the time to complete breakthrough is delayed relative to initial breakthrough (Fig. 2). This phenomenon has been previously attributed to enhanced PFAS adsorption through agglomeration or hemi-micelle formation (McCleaf et al. 2017), which has been observed previously in high-concentration batch studies (Zaggia et al. 2016). However, the lack of increasing total PFAS adsorption capacity within the mass balance does not support that this process is of importance for environmentally relevant PFAS concentrations. Instead, competitive replacement offers a more plausible explanation for such behavior.
Fig. 4.
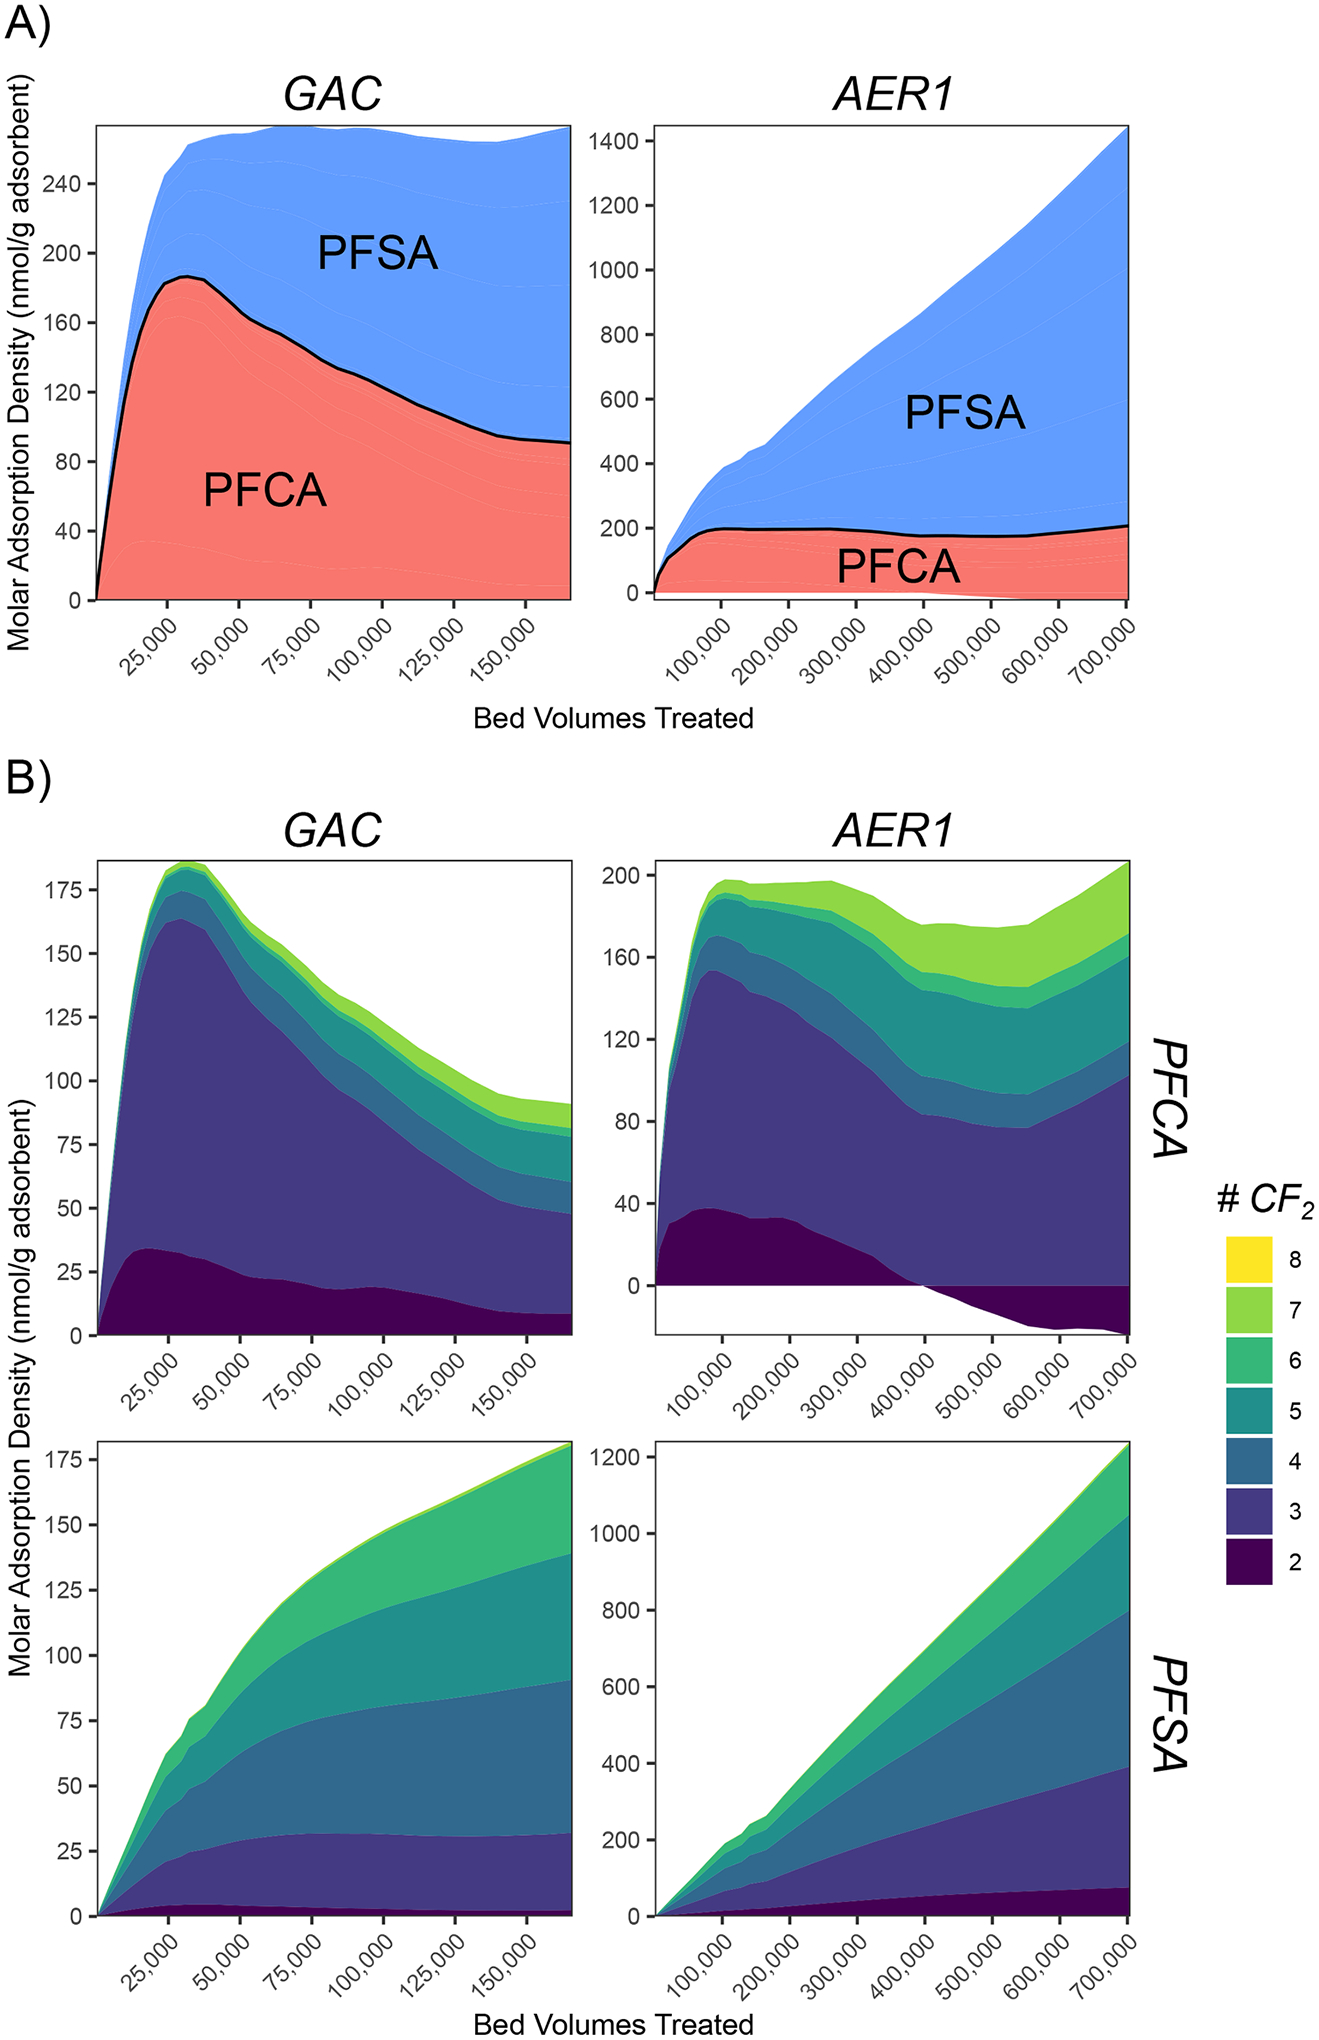
Molar adsorption density profiles of PFAA for intermediate bed depth at sample port P1 in GAC and AER1 column. A) Total density categorized by compound class. B) Compositional profile of homologs within each compound class. Data were interpolations of individual sample points, which were not plotted for visual clarity. Adsorbed mass includes both linear and branched isomers.
In contrast to GAC, AERs did not reach a finite total PFAA adsorption capacity in the duration of the pilot (Fig. 4a; Fig. S13). AERs quickly became saturated with PFCA at approximate loadings of 175–200 nmol/g (Fig. 4b; Fig. S13b). PFSA loading increased nearly linearly for the duration of the pilot (1240–1290 nmol/g at the final timepoint), and low PFSA breakthrough (Fig. 2b) suggests substantially greater unused PFSA exchange capacity were the pilot to continue. The observed selectivity for PFSA over PFCA has been attributed to more negative atomic charges in the sulfonate headgroup compared to carboxylate due to inductive effects from oxygen resonance (Park et al. 2020a). Based on the observed results, the degree to which competitive replacement of more weakly adsorbing PFAS occurred in AER was not clear. AER2 displayed a loss of adsorbed PFPrA and PFBA mass over runtime at P1 (Fig. S13) and the effluent (Fig. S11), but AER1 maintained more variable loadings (Fig. 4b). The mass balance on PFPrA onto AERs was negative at P1, indicating poor accounting of this compound. This demonstrated a limitation of the mass balance approach to quantify adsorption density where the rapid breakthrough profile of a poorly retained compound such as PFPrA may not be adequately captured by a limited number of sample datapoints (Fig. 2b). Based on the high observed PFSA selectivity, it hypothesized that after long operating times PFSA would eventually competitively displace previously adsorbed PFCA once unused PFSA exchange capacity was reached.
These results highlight a potential application of AERs as high-capacity PFSA-selective treatments compared to less-selective, lower-capacity GAC. To maximize usable bed life, a treatment configuration could utilize a combination of AER and GAC in series. A lead AER bed would initially remove the most selectively adsorbed PFSA from water, reserving the full capacity of a lag GAC bed for non-selective adsorption of PFCA without competitive replacement by PFSA.
3.5. Utility and limitations of intermediate sample port data with reduced EBCT
A key limitation to pilot-scale studies is the duration for which data can be collected. At the end of this pilot, high PFAS removal in AER columns led to limited effluent breakthrough data to evaluate performance. Intermediate sample ports such as P1 (Fig. 2b) and P2 (Fig. S7) can help fill data gaps through accelerated throughput on a BV-basis but at reduced EBCTs. However, reduced contact times can lower non-equilibrium capacity of an adsorbent and lead to early initial breakthrough (BV10) and decreased steepness of breakthrough curves (Murray et al. 2021; Park et al. 2020b). In contrast, half-breakthrough (BV50) should represent apparent adsorption capacity that is less impacted by EBCT effects (Corwin and Summers 2011). To assess the magnitude of these EBCT effects on this pilot, BV10 and BV50 data for varying-length PFCA were compared across all tested sample ports (Fig. 5, Supplementary Table S12).
Fig. 5.
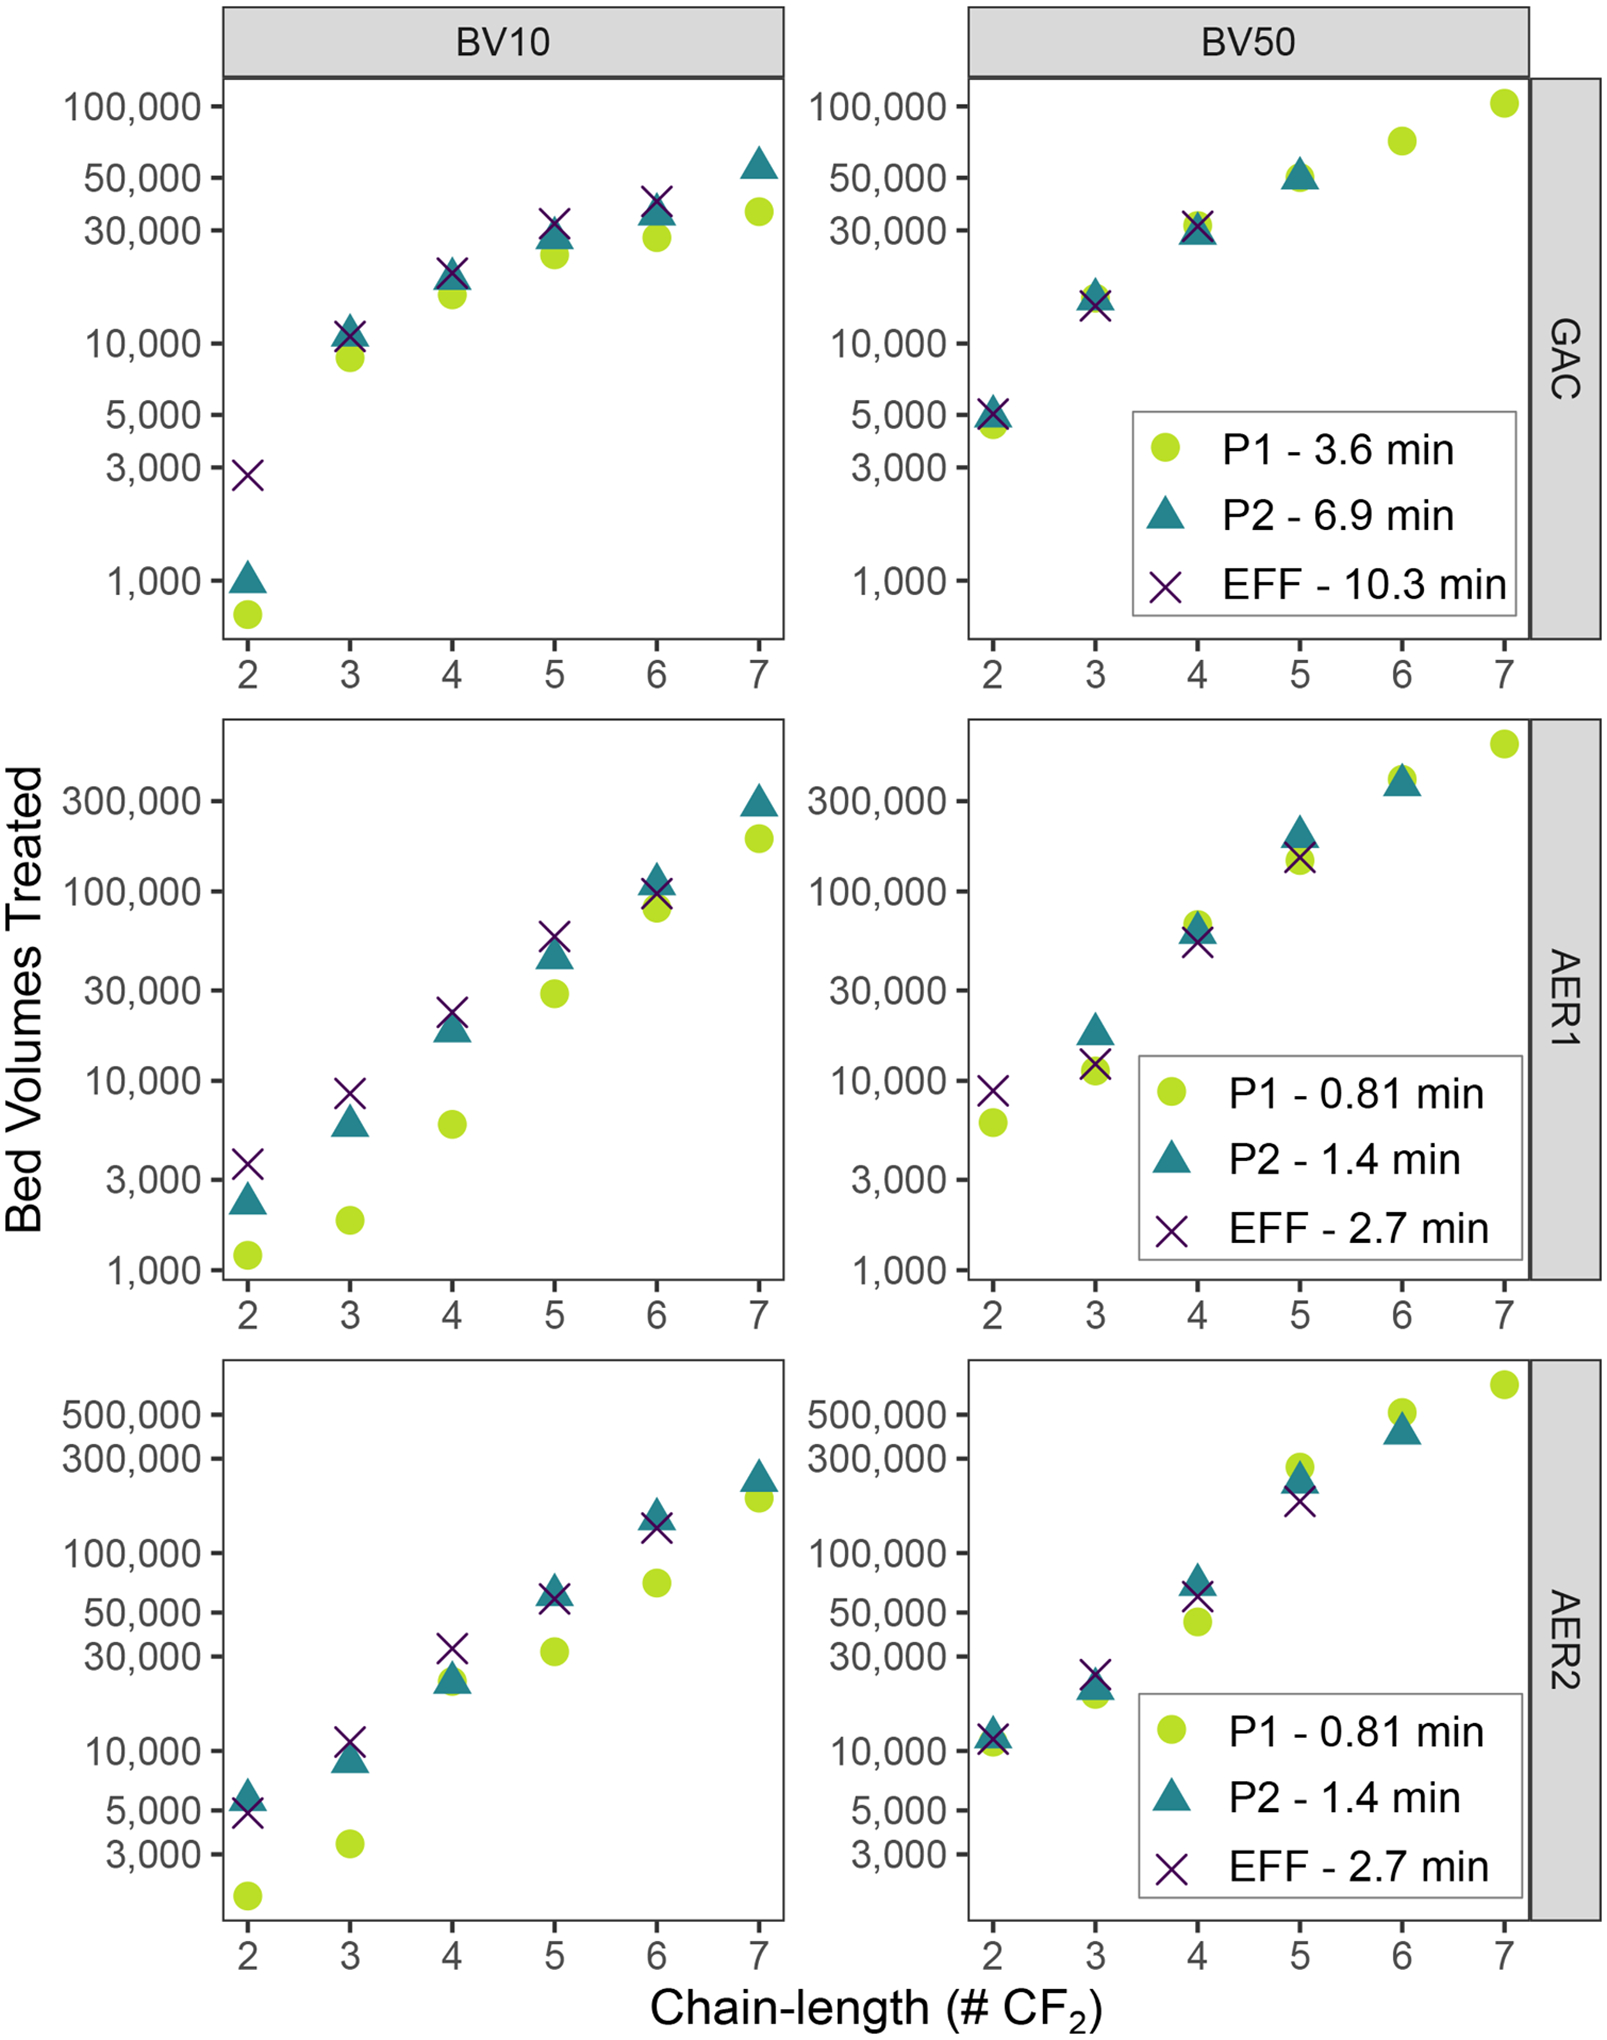
Comparative 10% and 50% breakthrough for linear PFCA at varied EBCT measured at each column sample port. Bed volumes treated displayed on log-scale to better highlight differences across a wide breakthrough range. Missing data points indicate level of breakthrough did not occur at a particular sample port during the pilot.
BV10 values across all columns decreased at lower EBCT values, indicating that intermediate sample ports consistently underestimated initial breakthrough compared to full-length data. Effects were most pronounced at the lowest EBCTs. P1 BV10 values for 3–7 CF2 PFCA were 70–81% of effluent values for GAC (P1 EBCT=3.6 min) and 21–84% for AERs (P1 EBCT=0.81 min). P2 BV10 values were 87–101% of effluent in GAC (P2 EBCT=6.9 min) and 67–112% in AERs (P2 EBCT=1.4 min). BV10 values of PFPrA (2 CF2) showed a substantially higher variability (26–116%). PFPrA results can be attributed to the low sample BV-resolution that poorly captured the shape of the initial breakthrough curve at intermediate sample ports, thus leading to an inaccurate interpolation of BV10. Interestingly, agreement between lower EBCT and higher EBCT values decreased with chain-length for GAC but increased with chain-length for AERs. For GAC, these effects could be related to mass transfer limitations within internal pore structure where pore blocking (Appleman et al. 2013) and decreased diffusivity of higher molecular weight compounds (Park et al. 2020b) can negatively affect long-chain PFAS more than short-chain PFAS. For AERs, an explanation for this opposite trend is less clear. Both increased (Park et al. 2020a) and decreased (Dixit et al. 2020) AER adsorbent kinetics have been observed with PFAS chain length, and results may be dependent on AER structure such as hydrophobicity and matrix structure. Further investigation of structure-related trends in breakthrough curve shape is warranted, particularly for AERs.
BV50 values were independent of EBCT for all columns (Fig. 5), which reflects an apparent equilibrium adsorption capacity independent of when initial breakthrough occurs (Park et al. 2020b). GAC BV50 values overlapped closely between the different sample ports. In contrast, AER data showed greater variability between ports, but no pattern with EBCT. The AER variability can most likely be attributed to operational differences such as bed disruptions. These results suggest intermediate ports at reduced EBCT can provide accurate estimates of half-breakthrough and equilibrium adsorption capacity (BV50) but conservative (lower) estimates of initial breakthrough (BV10) for full-length GAC and AER columns in an accelerated manner. When multiple intermediate port data are available, ports with EBCT closest to the full-length design can minimize this underestimation of initial breakthrough.
3.6. Assessment of substituted PFSA treatability using suspect screening
LC-HRMS analysis revealed the presence of three additional PFAS that were not included in the targeted LC-MS/MS analysis. Exact mass, retention time, and MS2 data (Section S6) provide strong evidence that the compounds were unsaturated-chain perfluorohexane sulfonic acid (U-PFHxS; m/z=360.9396), keto-substituted perfluoropentane sulfonic acid (K-PFPeS; m/z=326.9378) and perfluorohexane sulfonic acid (K-PFHxS; m/z=376.9346). PFAS were identified with a confidence level of 3a (positional isomer candidates), since the exact positions of substituent double bond and keto groups in these compounds could not be determined (Charbonnet et al. 2022). Each of these substituted PFSA contain two fewer F atoms than their unsubstituted PFSA analog of equivalent chain-length. These compounds persisted after oxidation in the TOP assay (data not shown), suggesting substituted PFAS had a similar chemical recalcitrance to their unsubstituted analogues. Keto-substituted and unsaturated PFSA have been shown to co-occur in PFAS-impacted groundwater and are presumed to be impurities formed during manufacturing (Barzen-Hanson et al. 2017; Wang et al. 2020; Xiao et al. 2017). Furthermore, they have also been detected in human serum from communities consuming such groundwater (McDonough et al. 2021).
Breakthrough curves for the newly identified substituted PFSA were generated to demonstrate how treatability of suspect compounds can be assessed for screened compounds in absence of reference standards. Fig. 6 illustrates breakthrough curves generated for GAC at P2 relative to similar-length PFSA. Here, distinct differences between compounds were apparent when comparing the obtained BV50 values. The suspected substituted PFSA compounds all broke through the GAC column more quickly than PFSA of equivalent CF2 length with the breakthrough trend of unsaturated-PFSA<keto-PFSA<PFSA (e.g., U-PFHxS<K-PFHxS<PFPeS). This trend is in agreement with Xiao et al. (2017) who reported lower batch GAC adsorption for K-PFOS and U-PFOS compared to PFHpS in groundwater.
Fig. 6.
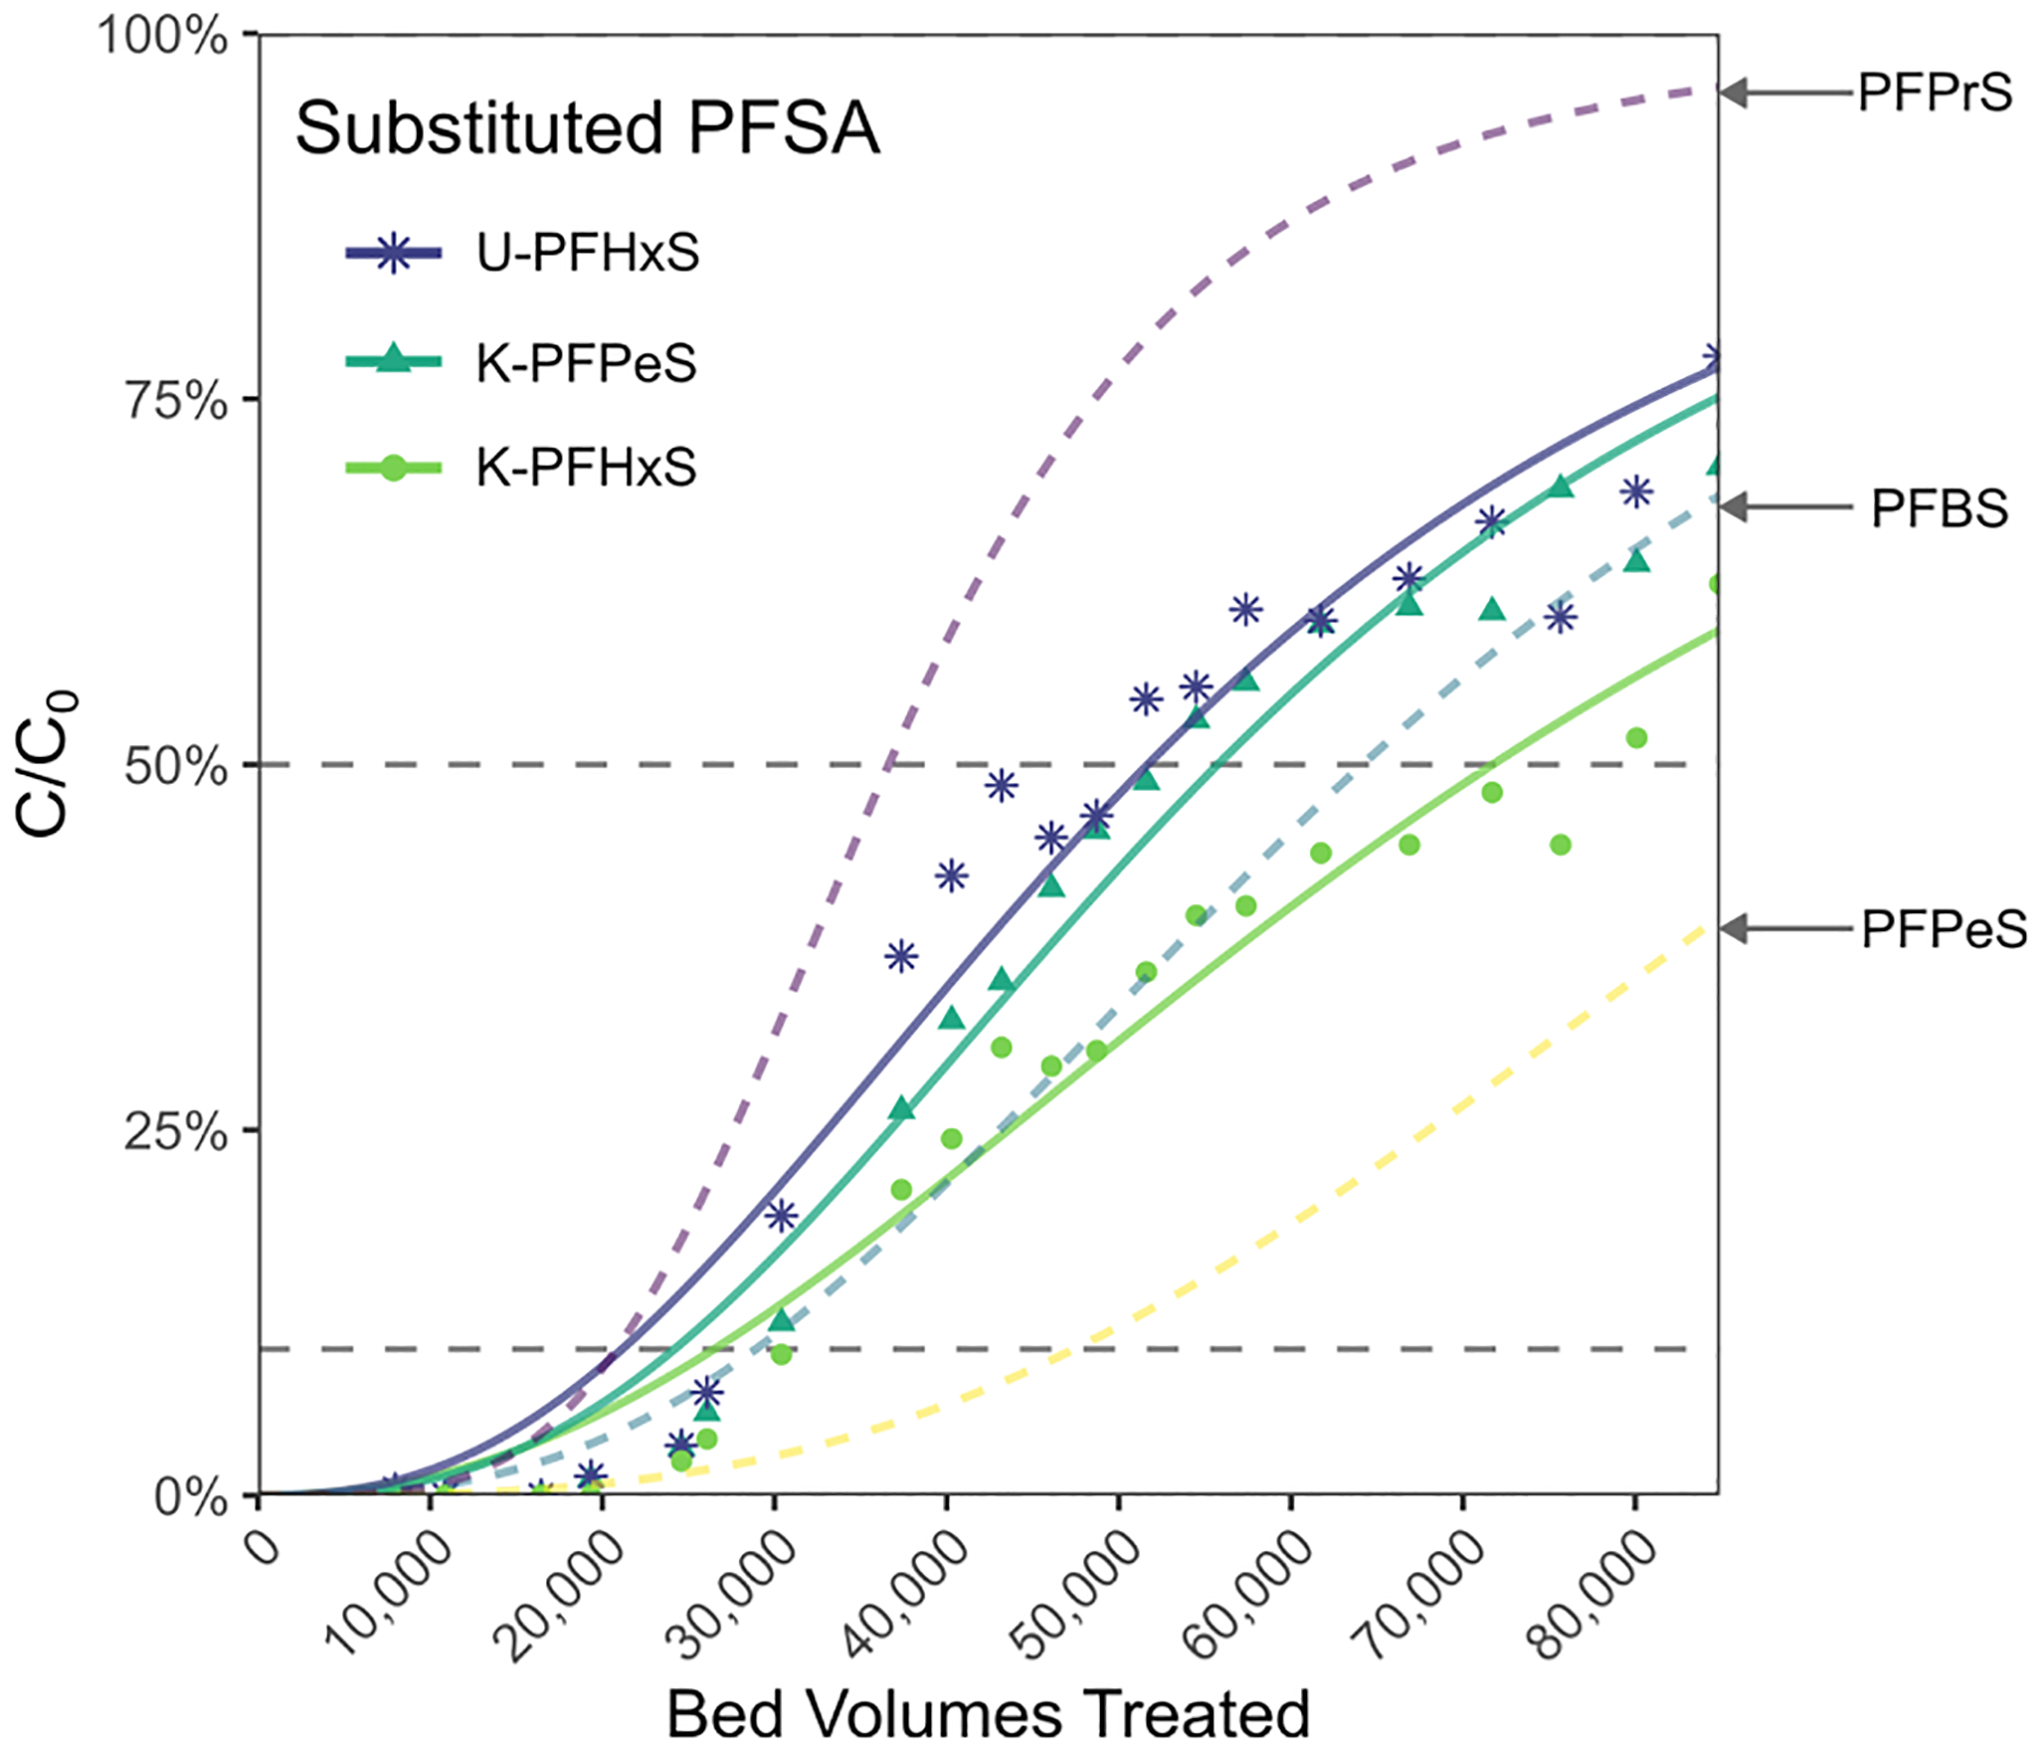
Comparative breakthrough of three substituted PFSA compounds identified by suspect screening in GAC column at P2. Modeled dose response breakthrough curves, including 3 unmodified PFSA (individual data points not shown) are shown for comparison.
In the AERs, limited breakthrough data (C/C0<10%) of the substituted PFSA suggested equally efficacious treatment compared to unsubstituted PFSA (Fig. S14). Initial breakthrough for both keto- and unsaturated-PFSA closely tracked their equivalent unsubstituted PFSA with equal CF2 (e.g., U-PFHxS=K-PFHxS=PFPeS). Although this trend necessitates validation at more substantial breakthrough thresholds, it indicates a potential advantage of AER relative to GAC in treating alternative PFAS structures that co-occur in contaminated water.
3.7. Quantitative PFAS breakthrough trends
Using the port selection criteria described in Section 3.5, estimated BV10 and BV50 values for all investigated PFAS (Supplementary Table S13) were compiled across all sample ports of each column to quantitatively compare estimated bed lives among the tested columns (Fig. 7). A summary of all calculated values and associated sample ports is presented in Supplementary Table S12. For all homologous series, BV10 and BV50 values were positively associated with chain-length. GAC BV10 values for br-PFHpS and br-PFOS were outliers to this trend, which may have been artifacts of estimating initial breakthrough of low influent concentration (C0≤2.1 ng/L). GAC BV10 values ranged from 2782 for ultrashort-chain PFPrA to 85,811 for PFOS. BV10 values ranged 3629–683,810 for PFPrA to PFBS in AER1 and 4852–353,571 for PFPrA to PFPrS in AER2; breakthrough of longer-chain PFSA did not occur in the duration of the study and were therefore at least 700,000 BVs.
Fig. 7.
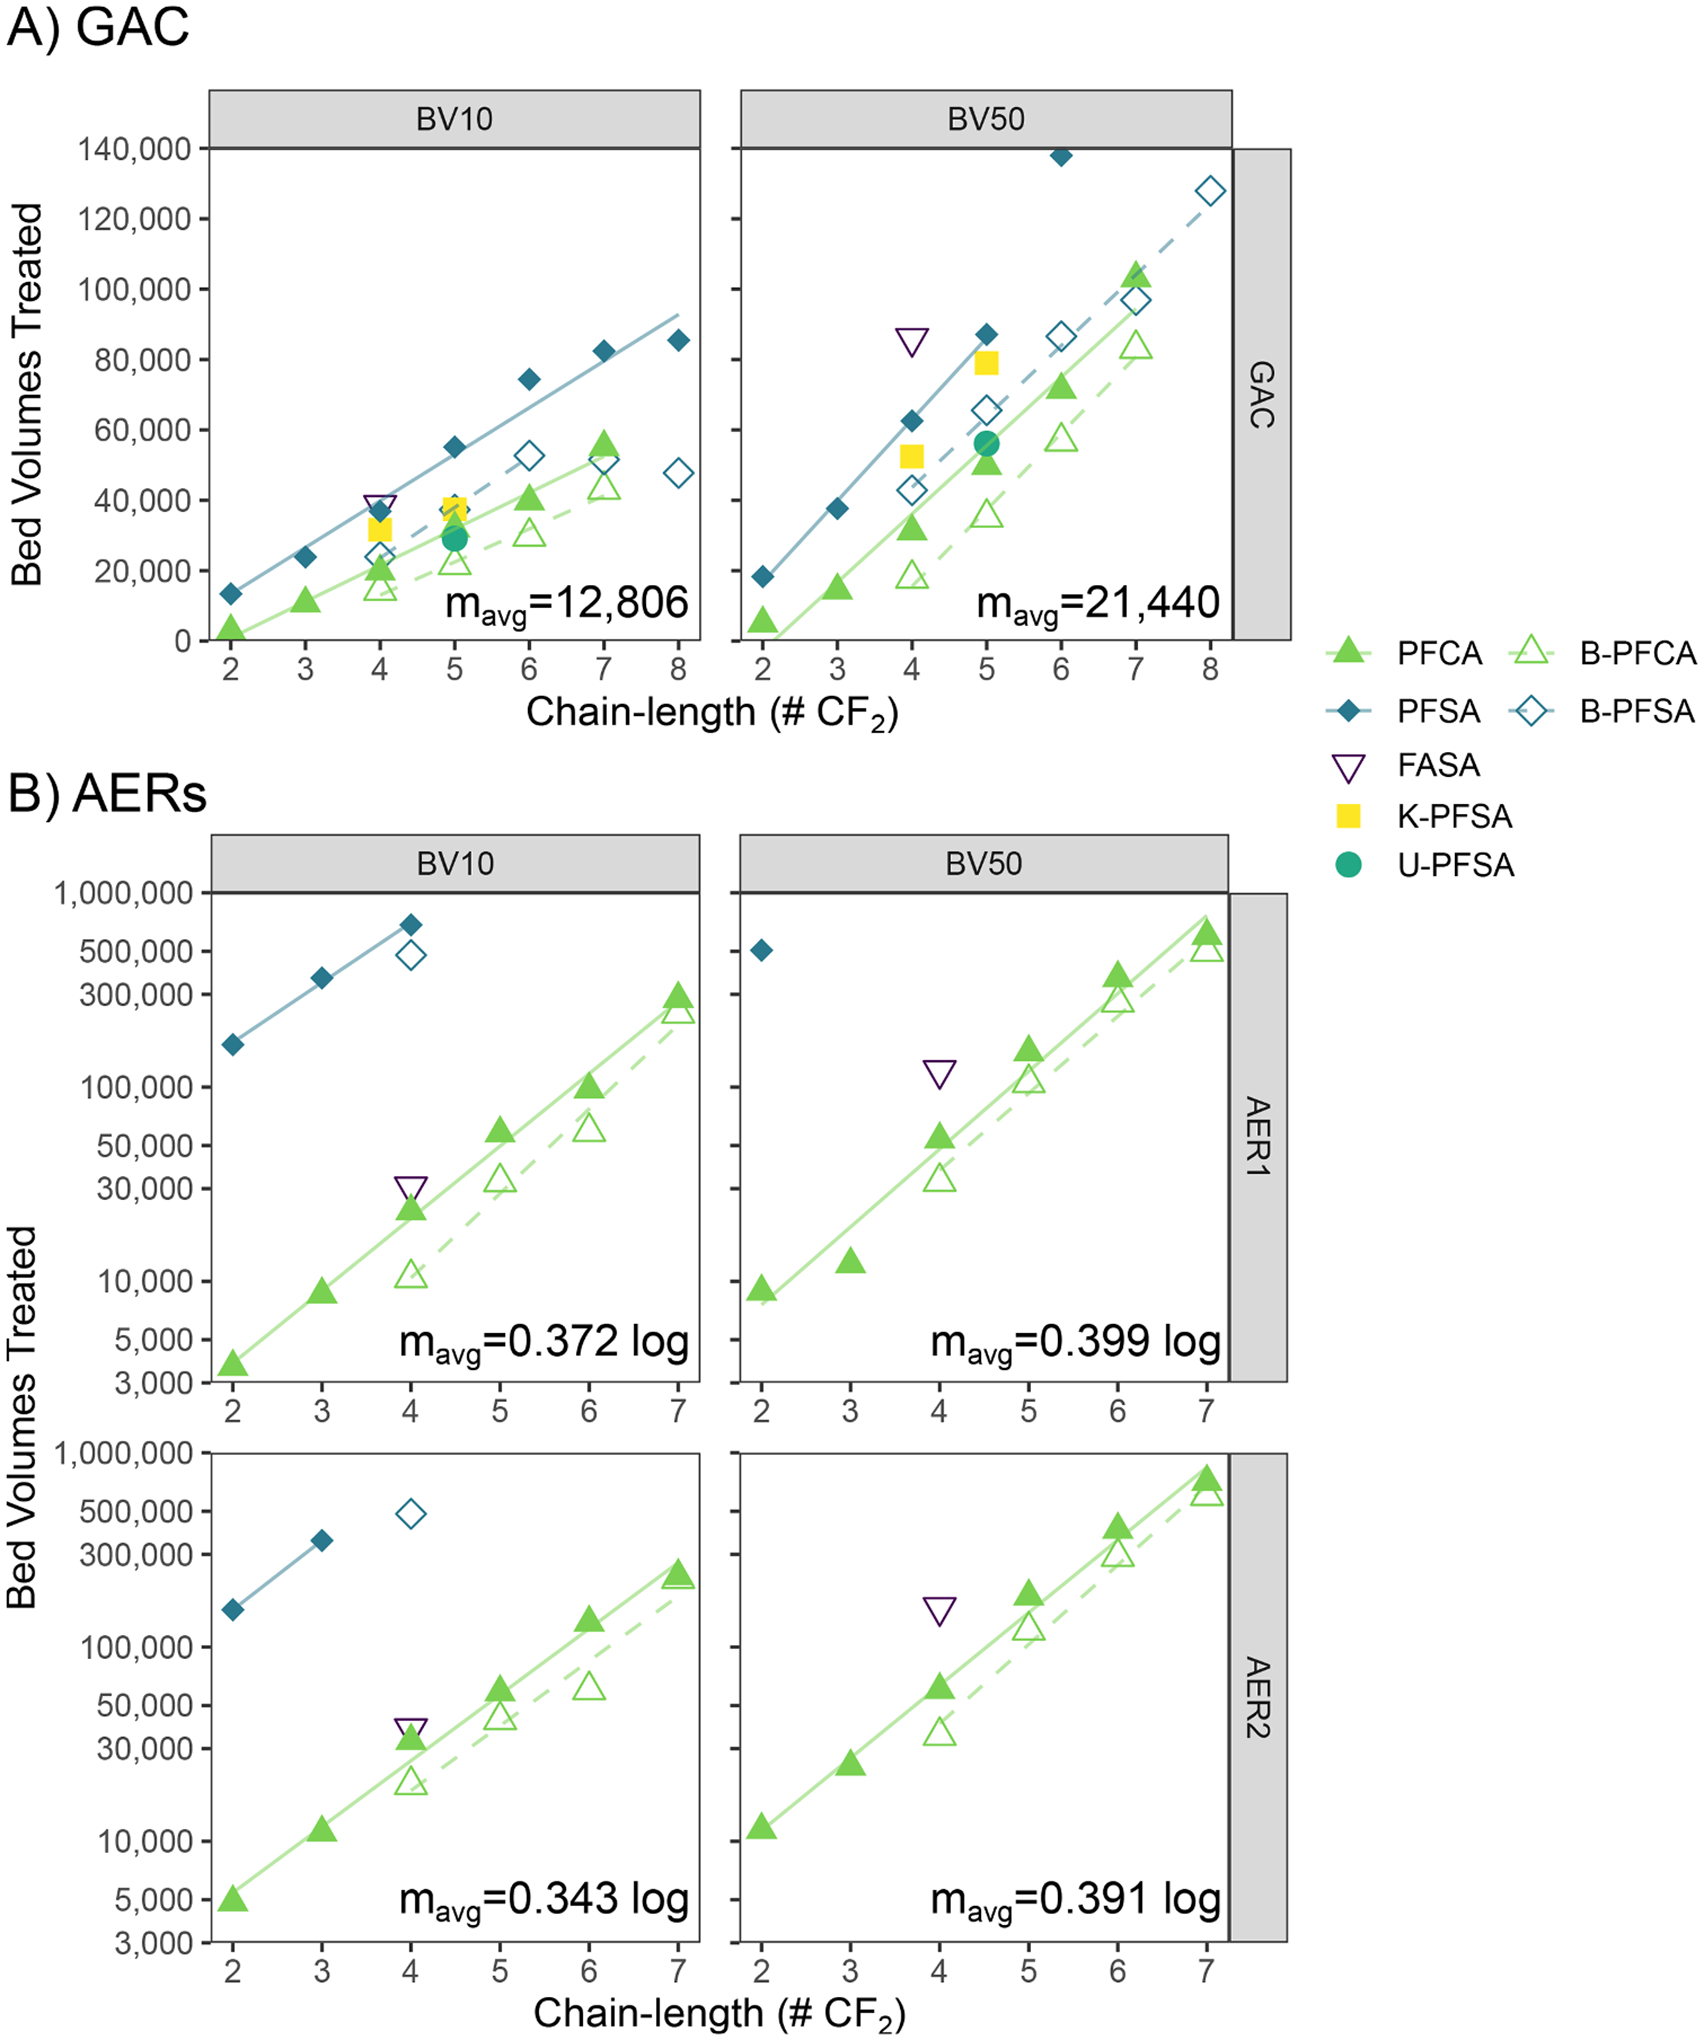
BV10 and BV50 breakthrough values of tested PFAS as function of chain-length. Linear regressions plotted for PFCA and PFSA homologous series for each BV value and column. A) GAC data plotted on linear scale with linear regression (7–8 CF2 B-PFSA excluded from GAC BV10 linear regression; 6 CF2 PFSA excluded from GAC BV50 linear regression). B) AER data plotted on log-linear scale with log-linear regression. Regression parameters for each homologous series are shown in Supplementary Table S13. Average slopes (mavg) of chain-length trends reported in each plot.
Between tested adsorbents, BV10 values for the shortest chain PFCA and FBSA (2–4 CF2) were comparable between GAC and both AERs; AER BV10 values surpassed GAC for PFHxA and were increasingly larger for longer-chain PFCA and all PFSA (Supplementary Table S13). Similarly, AER BV50 values were greater for all compounds except ultrashort-chain PFPrA and PFBA (2–3 CF2). These results agree with pilot results reported by McCleaf et al. (2017), which showed greater AER BV10 values compared to GAC for all PFSA and PFCA with ≥5 CF2. In contrast, BV50/BV10 ratios were lower for all compounds in GAC (1.2–2.7) compared to either AER (1.4–4.9; Supplementary Table S13), describing steeper breakthrough curves for GAC under the tested conditions. Steeper breakthrough curves indicate greater utilization of adsorbent capacity before initial breakthrough compared to more gradual breakthrough curves with mass transfer limitations. Practically, greater BV10 values and adsorbent utilization may be achieved by increasing overall EBCT through larger-sized treatment vessels or multiple columns in series (a “lead-lag” configuration). Despite nominally different resin functionalities indicated by manufacturers, AER1 (complex amino groups) and AER2 (tributyl amino groups) breakthrough characteristics were very similar (Fig. 7b). Marginally longer BV values for AER2 (Supplementary Table S13) can likely be attributed to operational variability from single replicate columns rather than true performance improvements.
Correlating breakthrough performance with physical descriptors has potential utility to extrapolate data for compounds with unmeasured breakthrough in a treatment system. Using readily available log Dow and LC retention time data, both of which reflect hydrophobicity, GAC BV10 values showed reasonable linear association (R2 of 0.80 and 0.76 respectively; Fig. S15). However, these had poor association for AER (R2<0.24). For both adsorbents, PFSA breakthrough was underpredicted and PFCA overpredicted, highlighting a limitation for hydrophobicity to account for differences between classes. As previously mentioned in Section 3.3, total negative molecular charge has been suggested as a descriptor capable of predicting adsorption to AERs between classes (Park et al. 2020a), however these values require computationally intensive calculations to estimate nor have they been previously published for PFAS.
Given the ubiquity of homologous PFAS series in contaminated waters, and consistent differences in calculated hydrophobicities between homologs (ΔlogD=0.7 per CF2 unit; Supplementary Table S7), a simpler approach is to correlate class-specific chain-length with breakthrough. In GAC, the relationship between breakthrough (BV10 and BV50) and chain-length for different classes was approximately linear (R2=0.96–0.99; Fig. 7a). Interestingly, the slopes of the linear correlations between different PFAS classes were similar at each breakthrough level (Supplementary Table S14), with an average increase in breakthrough BV of 12,806 and 21,440 per CF2 unit at BV10 and BV50, respectively. Even though the AER breakthrough data were more limited, class-specific breakthrough showed a log-linear relationship (R2=0.92–0.99) with chain-length (Fig. 7b). Slopes were nearly parallel between both AERs and between PFAS classes (Supplementary Table S14). BV10 increased an average of 0.342–0.371 log per CF2 unit and BV50 0.391–0.399 log. Equivalent slopes between PFAS classes indicate that adsorption affinity increases equally with CF2 addition, independent of functional group. McCleaf et al. (2017) noted previously that percent PFAS removal had a linear relationship with chain length in both GAC and AER columns, and that these trends were parallel between both PFCA and PFSA, which also supports this consistent additive effect. Equivalent slopes between both AERs also suggest very similar functional characteristics between the AER1 and AER2 adsorbents.
An important characteristic of the chain-length trends observed in this study is that they occurred despite differing individual influent homolog concentrations (C0). Micropollutants at trace concentrations (e. g., ng/L and low-μg/L range) have been previously shown to follow linear isotherms in the presence of more abundant adsorbates (e.g., mg/L range NOM), indicating that equilibrium adsorption density increased proportionally with C0 at low concentrations (Graham et al. 2000; Knappe et al. 1998). Although PFAS have been shown to follow nonlinear isotherms on GAC and AER at an elevated concentration (μg/L-mg/L) range (Boyer et al. 2021; Du et al. 2015), PFAS adsorption studies at trace concentrations have supported an independence of percent adsorption from initial concentrations (McCleaf et al. 2017; Wang et al. 2020). These concentration-independent trends could be useful in approximating the bed lives of more strongly adsorbed PFAS based on their shorter-chain homologs when pilot runtime is limited. For example, BV10 relationship for 2–4 CF2 PFSA in AER1 can be leveraged to estimate initial breakthrough times for longer-chain PFHxS and PFOS to be on the order of 3 × 10⁶ and 1 × 10⁷ BVs respectively, throughput values that could not reasonably be achieved in the timespan of the pilot (Fig. 7b). This could be particularly useful in estimating treatment performance in waters where long-chain PFAS predominate and drive treatment goals.
3.8. Practical considerations for adsorbent selection
Although nondimensionalized BVs provide a scalable performance comparison between adsorbents, treatment selection must also consider costs related to adsorptive media usage during operation. From a sizing perspective, a GAC treatment designed with 10 min EBCT would require 4 times more media than an AER treatment (designed with 2.5 min EBCT) for an equal volume of water. This quantity difference may be offset partially by substantially higher bulk media costs of AERs compared to GAC (Franke et al. 2021; Murray et al. 2021). Supplier-provided prices of AERs in this pilot were on average 4 times greater than GAC in 2021 and 3 times greater in 2022 on a bulk volume basis (Supplementary Table S15), which approximately balances the differences in media volume. Spent adsorbent disposal or regeneration costs may vary substantially depending on local regulations but were estimated here and elsewhere (Franke et al. 2021) to be comparable between adsorbent types. Capital costs such as treatment vessels, pretreatment, and pump systems may also substantially influence the life-time cost of each treatment, but they will vary greatly depending on design criteria, supply-chain, and location.
Operational costs are greatly impacted by media changeout frequency (Murray et al. 2021). Actual media service life before requiring changeout can provide important insight into the practical advantages of different technologies, particularly when changeout costs are comparable. Estimated full-scale service times (BVs treated × EBCTEffluent) of individual linear PFAS were compared for all columns at media changeout thresholds of 10% and 50% breakthrough using BV data from Section 3.7 (Fig. 8a). Times to 10% breakthrough of 2–4 CF2 PFCA were under 142 days in GAC and 61 days for AERs, indicating multiple media changeouts would be required every year to manage short-chain PFCA. GAC showed a service time advantage over AER for 10% breakthrough of short-chain FBSA and 2–6 CF2 PFCA; however, its advantage at 50% breakthrough was limited to FBSA and the shortest-chain (2–4 CF2) PFCA. For longer PFCA and all PFSA, AER service times exceeded GAC. Times to 10% breakthrough were at least 3 times greater in AERs and were in excess of 1200 days for PFBS and longer-chain compounds (Fig. 8a).
Fig. 8.
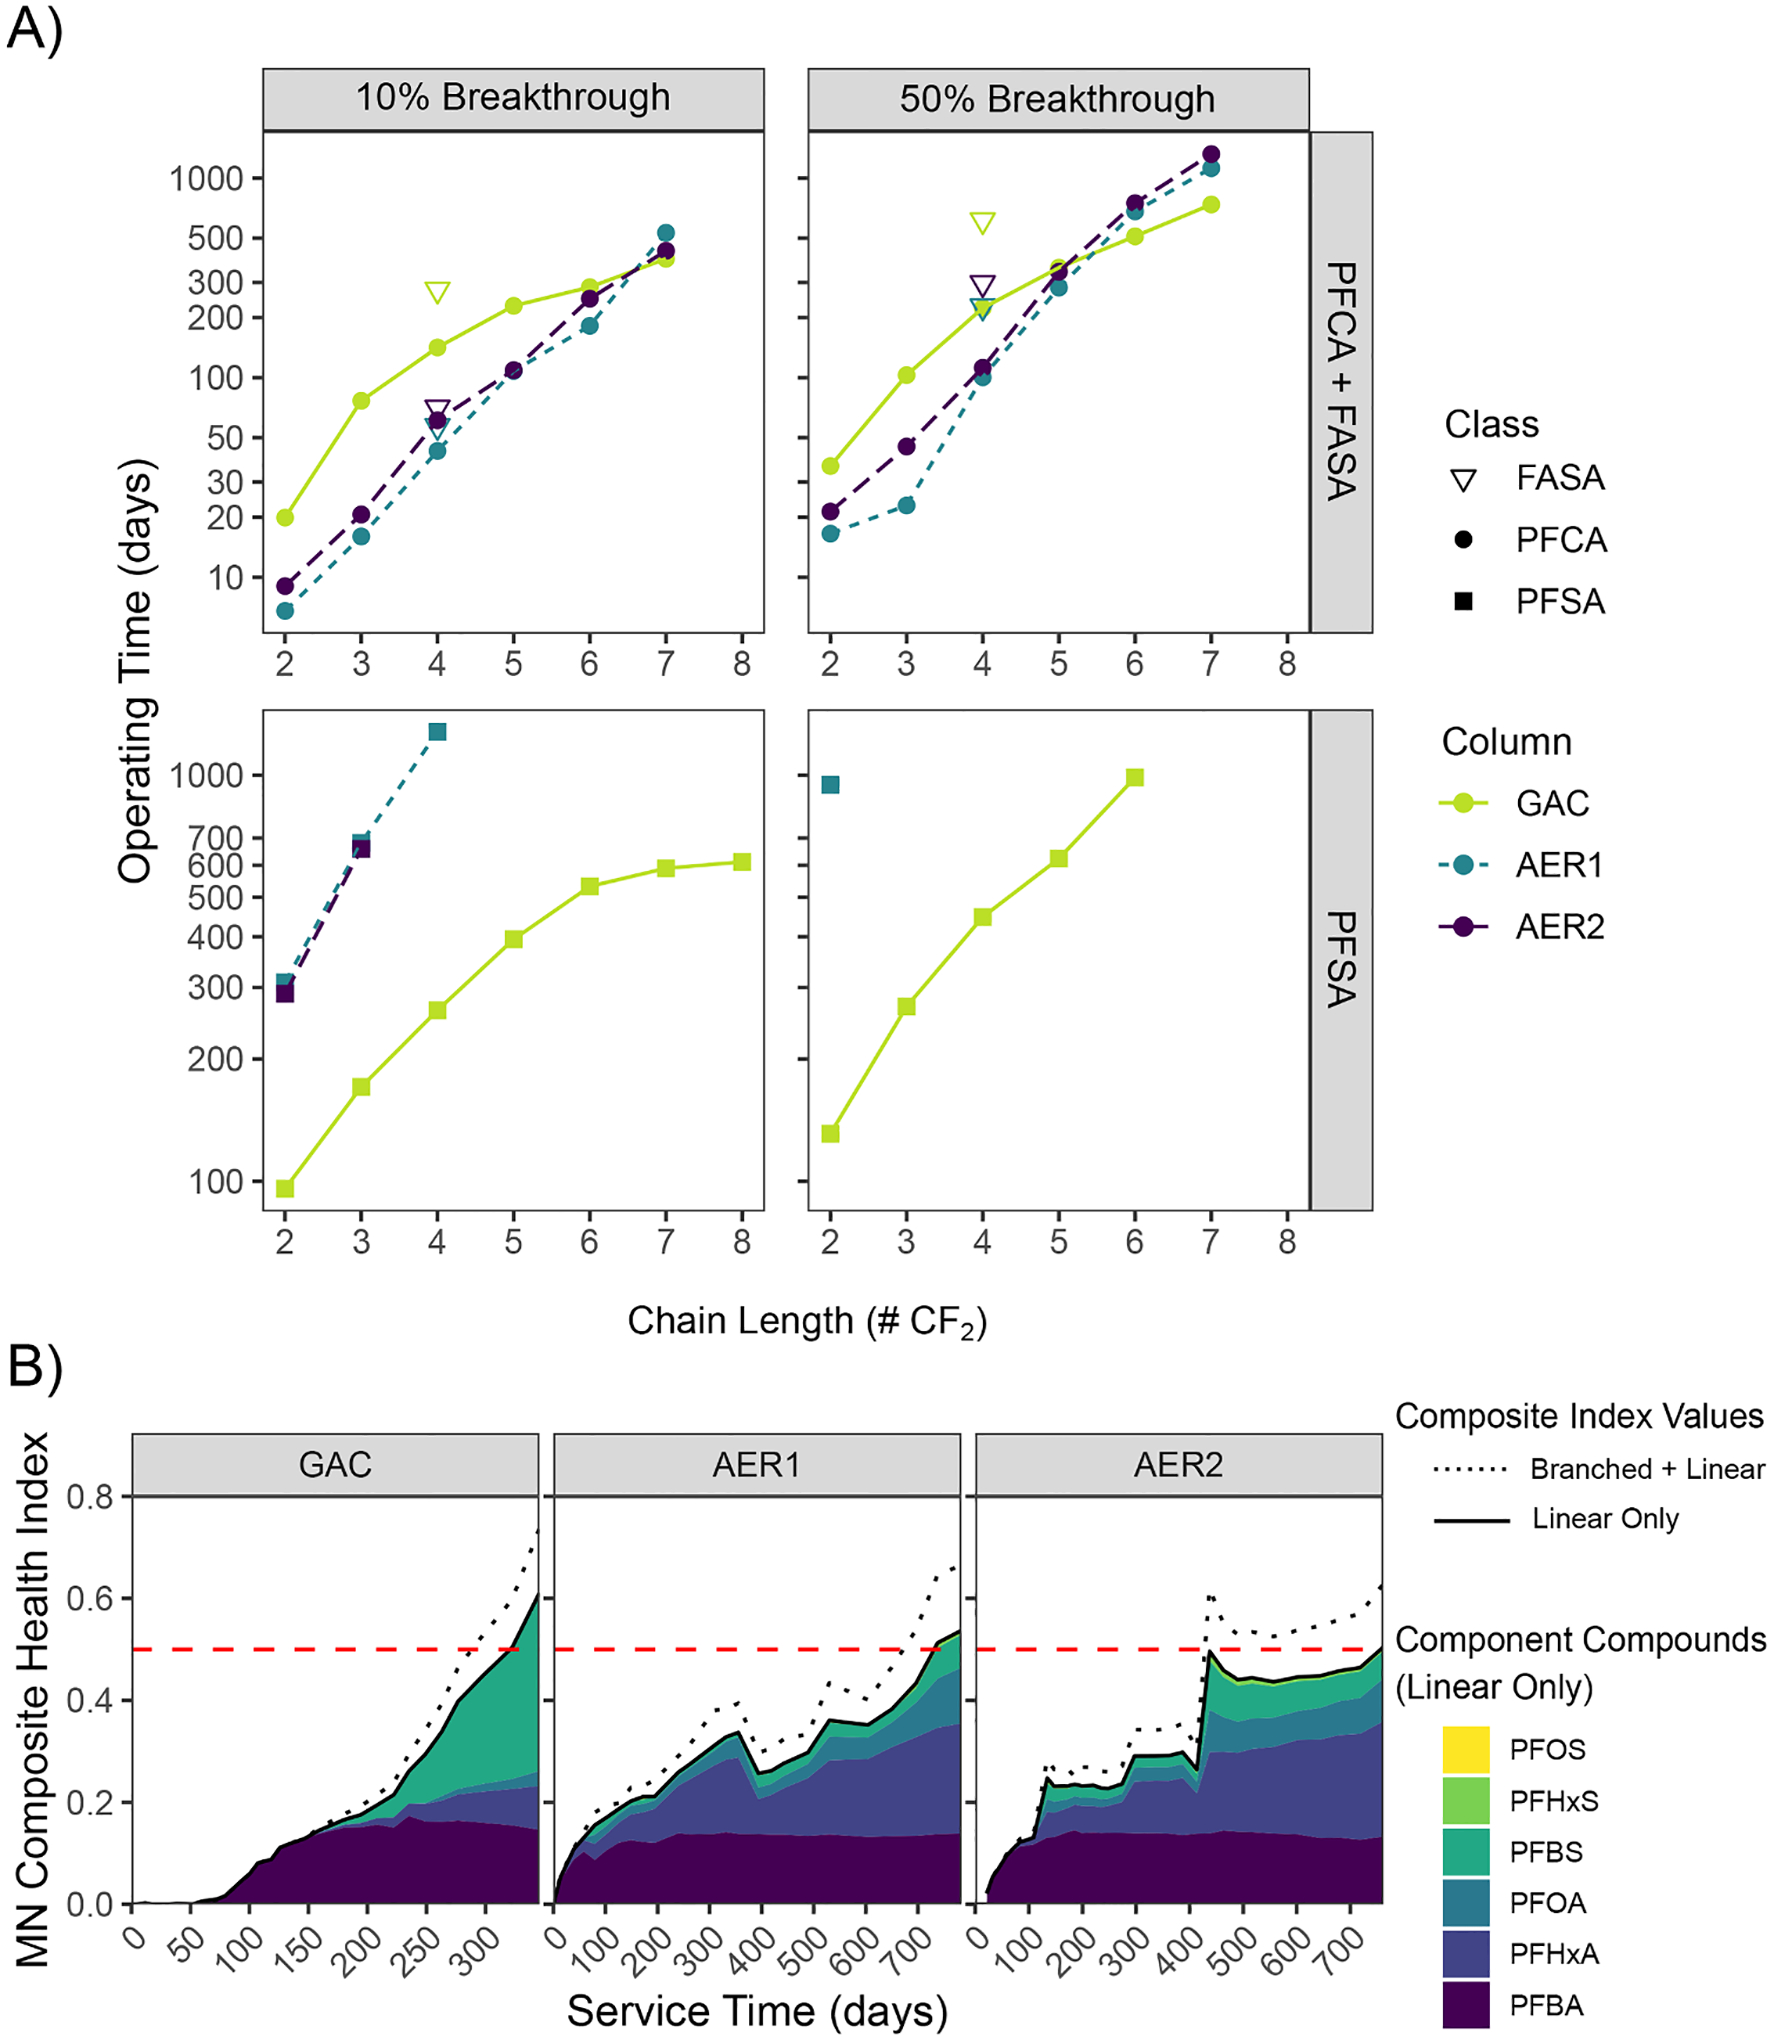
Comparison of full-scale column operational service times under different media changeout scenarios. A) Service time comparison based on theoretical 10% and 50% breakthrough of individual linear PFAS. Lines shown for visual aid. B) Service times based on site-specific composite health index (HI) for 6 PFAA (Supplementary Table S16). Data derived from longest EBCT sample ports to reach changeout threshold value of 0.5: GAC effluent, AER1 P1, AER2 P2. Shaded area shows linear component compounds’ contribution to HI with (solid line) and without inclusion of branched PFAS (dashed line). Individual data points removed for visual clarity.
Under the current regulatory paradigm, treatment goals are often dictated by a summative threshold concentration for multiple compounds. In this pilot, treatments were compared based on a weighed composite health-based index (HI; Equation S3) set by the Minnesota Department of Health (2022) for six PFAA compounds ranging from 15 ng/L (PFOS) to 7 μg/L (PFBA; Supplementary Table S16). Treatment bed service time was determined based on requisite media changeout after an HI value exceeded a value of 0.5 (Fig. 8b). Applying only linear PFAS concentrations to this HI, service times for AER1 (731 days) and AER2 (757 days) were approximately 2.3 times higher than for GAC (321 days), highlighting a clear advantage of AERs for Minnesota’s treatment goal. Notably, the strong retention of short-chain PFBS onto AERs contributed most to their longer service life. If incorporating both branched and linear PFAS concentrations into the HI value (Fig. 8b), service times would decrease approximately 10% (GAC) and over 8% (AERs). The potential for branched isomers to substantially add to HI values and decrease service times highlights the need for explicit guidance on branched PFAS quantitation in analytical methods and regulatory frameworks.
Despite the observed advantages of AER for PFAS removal, there are other important factors that should be considered for adsorbent selection. As noted in Section 3.4, site-specific water characteristics may have a large influence on the performances of AER and GAC. Waters with elevated levels of hydrophobic NOM and inorganic anions have been found to reduce PFAS adsorption to different degrees through adsorption site competition and pore blocking (Appleman et al. 2013; Dixit et al. 2019, 2020). Inorganic particulate and microbial growth can also clog pore space, leading to increased column head loss and a reduction in usable bed life (de Vera et al. 2019). An initial iteration of this pilot setup was aborted after 2 weeks due to iron and manganese particulate causing the system to over-pressurize, necessitating installation of a pretreatment system upstream of the pilot columns in the current study (Section S1). Even with pretreatment, head loss increased 2.6–3.4-fold over the duration of the pilot for all columns (Supplementary Table S17). Although microbial growth was not indicated to play a major role in this pilot due to low TOC and nutrient concentrations, biofouling may be a substantially greater issue in waters with higher organic loadings. Common mitigation measures to reduce backpressure and fouling for GAC, such as backwash and chemical oxidant addition (de Vera et al. 2019), are not suitable for AERs. Backwash is not recommended due to poor stratification of uniform resin beads, leading to bed disruptions that can disturb bed mass transfer zones (Purolite 2021). This effect was visible in AER breakthrough curves when bed disruptions occurred (Fig. 2). The gel AERs used in this study also cannot be exposed to oxidants such as chlorine, which can destroy resin and form nitrosamines (Purolite 2021). The high selectivity of AERs for anionic PFAS may limit their application in treating waters where diverse co-contaminants also require treatment, including nonionic and zwit-terionic PFAS (Wang et al. 2020). In contrast, GAC is well suited to treat a wide range of organic co-pollutants (Redding et al. 2009), which may be valuable from a holistic water quality perspective.
The outcomes of this study highlight several important research needs. Most importantly, there is a need for large-scale continuous-flow treatability data across a wider range of water chemistries, PFAS profiles, and adsorbents. Standardized and transparent reporting of key design and performance metrics such as breakthrough times (e.g., BV10), model parameters, and background water quality can aid inter-study comparisons and heuristics crucial to treatment design improvements. Furthermore, developing validated methods to rapidly test and predict treatability of full-scale systems in abbreviated timespans will aid more widespread continuous-flow data collection. Pilot studies are very time and capital intensive. Robust sampling and analytical efforts are critical to yield sufficient breakthrough data that allow for a meaningful interpretation of the results (Fig. 2a). Although techniques such as rapid small-scale columns have begun to be tested for AERs (Schaefer et al. 2019), validation of scaling models to full-scale data has yet to be achieved. Finally, advances are needed in adsorptive treatment of abundant, but poorly adsorbed short-chain PFCA such as PFBA. Treatment processes that incorporate in situ AER regeneration, which shows greatest efficacy in restoring capacity for short-chain PFCA (Liu and Sun 2021), could be utilized to extend service times for these particularly challenging compounds.
4. Conclusions
Intermediate sample ports provided crucial sample data to comprehensively evaluate a long-running pilot with low effluent breakthrough. Sample port data must be interpreted carefully, as initial breakthrough can be underestimated at lower EBCT. Sample port data provided a more robust estimation of half-breakthrough, which is reflective of equilibrium adsorption capacity.
Molar mass balances across adsorbents revealed different adsorption behaviors. GAC displayed a clear finite capacity for total measured PFAS and exhibited competitive replacement of short-chain PFCA with longer-chain PFCA and PFSA over the course of operation. The AERs reached a finite capacity for PFCA but not PFSA in the duration of this study, evidence of much greater PFSA selectivity.
With all influent PFAS concentrations in the ng/L range, homologous series of PFCA and PFSA followed quantitative relationships between chain-length and breakthrough independent of their individual concentrations. AERs exhibited a log-linear relationship between BV10 and BV50 with chain-length. For GAC, this relationship was less steep and followed an approximately linear trend. Similar slopes between compound classes suggested an equal additive effect of increased CF2 unit independent of head-group functionality. Branched PFAA, keto-PFSA and unsaturated-PFSA exhibited faster breakthrough than their unmodified linear structures.
AER performance was generally superior to GAC. On a breakthrough and mass adsorption basis, tested gel AERs outperformed GAC marginally for long-chain PFCA and substantially for all PFSA. All adsorbents had short bed lives for the shortest-chain (2–4 CF2) PFCA. Both tested AERs had similar mass adsorption and bed lives. Modifications from a linear PFAS structure (branching, keto group, unsaturation) negatively impacted GAC removal more substantially than AERs. For long-term adsorptive design considerations, treatment should be considered more holistically in terms of additional PFAS beyond PFAA and removal of other co-occurring contaminants.
Supplementary Material
Acknowledgements
The authors thank Dr. Matthew Newmeyer for his assistance and expertise with high-resolution mass spectrometry techniques. This work was supported financially by the Minnesota Pollution Control Agency, the Stantec Institute for Water Technology and Policy, and the Johns Hopkins Water Institute.
Footnotes
Declaration of Competing Interest
The authors declare that they have no known competing financial interests or personal relationships that could have appeared to influence the work reported in this paper.
Supplementary materials
Supplementary material associated with this article can be found, in the online version, at doi:10.1016/j.watres.2022.119198.
Data availability
Data will be made available on request.
References
- Appleman TD, Dickenson ER, Bellona C, Higgins CP, 2013. Nanofiltration and granular activated carbon treatment of perfluoroalkyl acids. J. Hazard. Mater 10.1016/j.jhazmat.2013.06.033. [DOI] [PubMed] [Google Scholar]
- Appleman TD, Higgins CP, Quiñones O, Vanderford BJ, Kolstad C, Zeigler-Holady JC, Dickenson ERV, 2014. Treatment of poly- and perfluoroalkyl substances in U.S. full-scale water treatment systems. Water Res 10.1016/j.watres.2013.10.067. [DOI] [PubMed] [Google Scholar]
- Barzen-Hanson KA, Roberts SC, Choyke S, Oetjen K, McAlees A, Riddell N, McCrindle R, Ferguson PL, Higgins CP, Field JA, 2017. Discovery of 40 classes of Per- and Polyfluoroalkyl substances in historical aqueous film-forming foams (AFFFs) and AFFF-impacted groundwater. Environ. Sci. Technol 10.1021/acs.est.6b05843. [DOI] [PubMed] [Google Scholar]
- Benskin JP, De Silva AO, Martin LJ, Arsenault G, McCrindle R, Riddell N, Mabury SA, Martin JW, 2009. Disposition of perfluorinated acid isomers in sprague-dawley rats; Part 1: single dose. Environ. Toxicol. Chem 10.1897/08-239.1. [DOI] [PubMed] [Google Scholar]
- Boyer TH, Fang Y, Ellis A, Dietz R, Choi YJ, Schaefer CE, Higgins CP, Strathmann TJ, 2021. Anion exchange resin removal of per- and polyfluoroalkyl substances (PFAS) from impacted water: a critical review. Water Res 10.1016/j.watres.2021.117244. [DOI] [PubMed] [Google Scholar]
- Brendel S, Fetter É, Staude C, Vierke L, Biegel-Engler A, 2018. Short-chain perfluoroalkyl acids: environmental concerns and a regulatory strategy under REACH. Environ. Sci. Eur 10.1186/s12302-018-0134-4. [DOI] [PMC free article] [PubMed] [Google Scholar]
- Charbonnet JA, McDonough CA, Xiao F, Schwichtenberg T, Cao D, Kaserzon S, Thomas KV, Dewapriya P, Place BJ, Schymanski EL, Field JA, Helbling DE, Higgins CP, 2022. Communicating confidence of Per- and Polyfluoroalkyl substance identification via high-resolution mass spectrometry. Environ. Sci. Technol. Lett 10.1021/acs.estlett.2c00206. [DOI] [PMC free article] [PubMed] [Google Scholar]
- Chow SJ, Ojeda N, Jacangelo JG, Schwab KJ, 2021. Detection of ultrashort-chain and other per- and polyfluoroalkyl substances (PFAS) in U.S. bottled water. Water Res 10.1016/j.watres.2021.117292. [DOI] [PubMed] [Google Scholar]
- Corwin CJ, Summers RS, 2011. Adsorption and desorption of trace organic contaminants from granular activated carbon adsorbers after intermittent loading and throughout backwash cycles. Water Res 10.1016/j.watres.2010.08.039. [DOI] [PubMed] [Google Scholar]
- Croll HC, Chow S, Ojeda N, Schwab K, Prasse C, Capelle R, Klamerus J, Oppenheimer J, Jacangelo JG, 2022. Adaptation of selected models for describing competitive per- and polyfluoroalkyl substances breakthrough curves in groundwater treated by granular activated carbon. J. Hazard. Mater 10.1016/j.jhazmat.2022.128804. [DOI] [PubMed] [Google Scholar]
- de Vera GA, Lauderdale C, Alito CL, Hooper J, Wert EC, 2019. Using upstream oxidants to minimize surface biofouling and improve hydraulic performance in GAC biofilters. Water Res 10.1016/j.watres.2018.10.085. [DOI] [PubMed] [Google Scholar]
- Dixit F, Barbeau B, Mostafavi SG, Mohseni M, 2019. PFOA and PFOS removal by ion exchange for water reuse and drinking applications: role of organic matter characteristics. Environ. Sci. Water Res. Technol 10.1039/C9EW00409B. [DOI] [Google Scholar]
- Dixit F, Barbeau B, Mostafavi SG, Mohseni M, 2020. Efficient removal of GenX (HFPO-DA) and other perfluorinated ether acids from drinking and recycled waters using anion exchange resins. J. Hazard. Mater 10.1016/j.jhazmat.2019.121261. [DOI] [PubMed] [Google Scholar]
- Du Z, Deng S, Bei Y, Huang Q, Wang B, Huang J, Yu G, 2014. Adsorption behavior and mechanism of perfluorinated compounds on various adsorbents—A review. J. Hazard. Mater 10.1016/j.jhazmat.2014.04.038. [DOI] [PubMed] [Google Scholar]
- Du Z, Deng S, Chen Y, Wang B, Huang J, Wang Y, Yu G, 2015. Removal of perfluorinated carboxylates from washing wastewater of perfluorooctanesulfonyl fluoride using activated carbons and resins. J. Hazard. Mater 10.1016/j.jhazmat.2014.12.037. [DOI] [PubMed] [Google Scholar]
- European Union, 2020. Directive (EU) 2020/2184 of the European Parliament and of the Council of 16 December 2020 on the quality of water intended for human consumption (recast) General Secretariat of the Council of the European Union. http://data.europa.eu/eli/dir/2020/2184/oj. [Google Scholar]
- Franke V, Ullberg M, McCleaf P, Wålinder M, Köhler SJ, Ahrens L, 2021. The Price of really clean water: combining nanofiltration with granular activated carbon and anion exchange resins for the removal of Per- And Polyfluoralkyl Substances (PFASs) in drinking water production. ACS ES&T Water 10.1021/acsestwater.0c00141. [DOI] [Google Scholar]
- Gagliano E, Sgroi M, Falciglia PP, Vagliasindi FGA, Roccaro P, 2020. Removal of poly- and perfluoroalkyl substances (PFAS) from water by adsorption: Role of PFAS chain length, effect of organic matter and challenges in adsorbent regeneration. Water Res 10.1016/j.watres.2019.115381. [DOI] [PubMed] [Google Scholar]
- Graham MR, Summers RS, Simpson MR, MacLeod BW, 2000. Modeling equilibrium adsorption of 2-methylisoborneol and geosmin in natural waters. Water Res 10.1016/S0043-1354(99)00390-5. [DOI] [Google Scholar]
- Houtz EF, Sedlak DL, 2012. Oxidative Conversion as a means of detecting precursors to Perfluoroalkyl Acids in urban runoff. Environ. Sci. Technol 10.1021/es302274g. [DOI] [PubMed] [Google Scholar]
- Hu XC, Andrews DQ, Lindstrom AB, Bruton TA, Schaider LA, Grandjean P, Lohmann R, Carignan CC, Blum A, Balan SA, Higgins CP, Sunderland EM, 2016. Detection of poly- and Perfluoroalkyl Substances (PFASs) in U.S. drinking water linked to industrial sites, military fire training areas, and wastewater treatment plants. Environ. Sci. Technol. Lett 10.1021/acs.estlett.6b00260. [DOI] [PMC free article] [PubMed] [Google Scholar]
- Knappe DRU, Matsui Y, Snoeyink VL, Roche P, Prados MJ, Bourbigot M-M, 1998. Predicting the capacity of powdered activated carbon for trace organic compounds in natural waters. Environ. Sci. Technol 10.1021/es970833y. [DOI] [Google Scholar]
- Liu CJ, Strathmann TJ, Bellona C, 2021. Rejection of per- and polyfluoroalkyl substances (PFASs) in aqueous film-forming foam by high-pressure membranes. Water Res 10.1016/j.watres.2020.116546. [DOI] [PubMed] [Google Scholar]
- Liu Y-L, Sun M, 2021. Ion exchange removal and resin regeneration to treat per- and polyfluoroalkyl ether acids and other emerging PFAS in drinking water. Water Res 10.1016/j.watres.2021.117781. [DOI] [PubMed] [Google Scholar]
- Massachusetts Department of Environmental Protection, 2020. PFAS MCL Revisions to 310 CMR 22.00 https://www.mass.gov/lists/development-of-a-pfas-drinking-water-standard-mcl#final-pfas-mcl-regulations-.
- McCleaf P, Englund S, Östlund A, Lindegren K, Wiberg K, Ahrens L, 2017. Removal efficiency of multiple poly- and perfluoroalkyl substances (PFASs) in drinking water using granular activated carbon (GAC) and anion exchange (AE) column tests. Water Res 10.1016/j.watres.2017.04.057. [DOI] [PubMed] [Google Scholar]
- McDonough CA, Choyke S, Barton KE, Mass S, Starling AP, Adgate JL, Higgins CP, 2021. Unsaturated PFOS and Other PFASs in human serum and drinking water from an AFFF-impacted community. Environ. Sci. Technol 10.1021/acs.est.1c00522. [DOI] [PubMed] [Google Scholar]
- Minnesota Department of Health (2022) Human Health-Based Water Guidance Table (https://www.health.state.mn.us/communities/environment/risk/guidance/gw/table.html) Accessed 2022-05-23.
- Murray CC, Marshall RE, Liu CJ, Vatankhah H, Bellona CL, 2021. PFAS treatment with granular activated carbon and ion exchange resin: Comparing chain length, empty bed contact time, and cost. J. Water Process Eng 10.1016/j.jwpe.2021.102342. [DOI] [Google Scholar]
- Neuwald IJ, Hübner D, Wiegand HL, Valkov V, Borchers U, Nödler K, Scheurer M, Hale SE, Arp HPH, Zahn D, 2022. Ultra-short-chain PFASs in the sources of german drinking water: prevalent, overlooked, difficult to remove, and unregulated. Environ. Sci. Technol 10.1021/acs.est.1c07949. [DOI] [PubMed] [Google Scholar]
- Nickerson A, Maizel AC, Kulkarni PR, Adamson DT, Kornuc JJ, Higgins CP, 2020. Enhanced extraction of AFFF-associated PFASs from source zone soils. Environ. Sci. Technol 10.1021/acs.est.0c00792. [DOI] [PubMed] [Google Scholar]
- Park M, Daniels KD, Wu S, Ziska AD, Snyder SA, 2020a. Magnetic ion-exchange (MIEX) resin for perfluorinated alkylsubstance (PFAS) removal in groundwater: Roles of atomic charges for adsorption. Water Res 10.1016/j.watres.2020.115897. [DOI] [PubMed] [Google Scholar]
- Park M, Wu S, Lopez IJ, Chang JY, Karanfil T, Snyder SA, 2020b. Adsorption of Perfluoroalkyl Substances (PFAS) in groundwater by granular activated carbons: Roles of hydrophobicity of PFAS and carbon characteristics. Water Res 10.1016/j.watres.2019.115364. [DOI] [PubMed] [Google Scholar]
- PFASSTRUCTV3 (2022) CompTox chemicals dashboard list: PFAS|EPA: PFAS structures in DSSTox (Update August 2020). (https://comptox.epa.gov/dashboard/chemical-lists/PFASSTRUCTV3) Accessed 2022-05-22.
- Purolite (2021) Design and operational guidelines: PFAS-selective single use ion exchange resin for drinking water systems
- Rahman MF, Peldszus S, Anderson WB, 2014. Behaviour and fate of perfluoroalkyl and polyfluoroalkyl substances (PFASs) in drinking water treatment: A review. Water Res 10.1016/j.watres.2013.10.045. [DOI] [PubMed] [Google Scholar]
- Redding AM, Cannon FS, Snyder SA, Vanderford BJ, 2009. A QSAR-like analysis of the adsorption of endocrine disrupting compounds, pharmaceuticals, and personal care products on modified activated carbons. Water Res 10.1016/j.watres.2009.05.026. [DOI] [PubMed] [Google Scholar]
- Rodowa AE, Knappe DRU, Chiang S-YD, Pohlmann D, Varley C, Bodour A, Field JA, 2020. Pilot scale removal of per- and polyfluoroalkyl substances and precursors from AFFF-impacted groundwater by granular activated carbon. Environ. Sci. Water Res. Technol. 10.1039/C9EW00936A. [DOI] [Google Scholar]
- Schaefer CE, Nguyen D, Ho P, Im J, LeBlanc A, 2019. Assessing rapid small-scale column tests for treatment of Perfluoroalkyl Acids by anion exchange resin. Industr. Eng. Chem. Res 10.1021/acs.iecr.9b00858. [DOI] [Google Scholar]
- Schulz K, Silva MR, Klaper R, 2020. Distribution and effects of branched versus linear isomers of PFOA, PFOS, and PFHxS: a review of recent literature. Sci. Total Environ 10.1016/j.scitotenv.2020.139186. [DOI] [PubMed] [Google Scholar]
- EPA, U.S., 2022. Technical Fact Sheet: Drinking Water Health Advisories for Four PFAS (PFOA, PFOS, GenX chemicals, and PFBS) Office of Water. [Google Scholar]
- Wang R, Ching C, Dichtel WR, Helbling DE, 2020. Evaluating the removal of per- and polyfluoroalkyl substances from contaminated groundwater with different adsorbents using a suspect screening approach. Environ. Sci. Technol. Lett 10.1021/acs.estlett.0c00736. [DOI] [Google Scholar]
- Wang Z, MacLeod M, Cousins IT, Scheringer M, Hungerbühler K, 2011. Using COSMOtherm to predict physicochemical properties of poly- and perfluorinated alkyl substances (PFASs). Environ. Chem 10.1071/EN10143. [DOI] [Google Scholar]
- Xiao X, Ulrich BA, Chen B, Higgins CP, 2017. Sorption of poly- and perfluoroalkyl substances (PFASs) relevant to aqueous film-forming foam (AFFF)-impacted groundwater by Biochars and activated carbon. Environ. Sci. Technol 10.1021/acs.est.7b00970. [DOI] [PubMed] [Google Scholar]
- Zaggia A, Conte L, Falletti L, Fant M, Chiorboli A, 2016. Use of strong anion exchange resins for the removal of perfluoroalkylated substances from contaminated drinking water in batch and continuous pilot plants. Water Res 10.1016/j.watres.2015.12.039. [DOI] [PubMed] [Google Scholar]
Associated Data
This section collects any data citations, data availability statements, or supplementary materials included in this article.
Supplementary Materials
Data Availability Statement
Data will be made available on request.