

Abstract
The 3′ end of the hepatitis C virus genome is terminated by a highly conserved, 98 nt sequence called 3′X. This untranslated structural element is thought to regulate several essential RNA-dependent processes associated with infection. 3′X has two proposed conformations comprised of either three or two stem–loop structures that result from the different base-pairing interactions within the first 55 nt. Here, we used single-molecule Förster resonance energy transfer spectroscopy to monitor the conformational status of fluorescently labeled constructs that isolate this region of the RNA (3′X55). We observed that 3′X55 can adopt both proposed conformations and the relative abundance of them can be modulated by either solution conditions or nucleotide deletions. Furthermore, interconversion between the two conformations takes place over the course of several hours. The simultaneous existence of two slowly interconverting conformations may help prime individual copies of the viral genome for either viral protein or RNA synthesis, thereby minimizing conflicts between these two competing processes.
Keywords: biophysics, hepatitis C virus, regulation, structure, untranslated region
INTRODUCTION
Hepatitis C is a liver inflammatory disease that can frequently result in cirrhosis and cancer. In 2021, the World Health Organization estimated that this disease was affecting 58 million people across the globe (World Health Organization 2021). Hepatitis C is caused by the hepatitis C virus (HCV), a membrane-enveloped particle roughly 50 nm in diameter (Yu et al. 2007; Simmonds et al. 2017). These HCV particles are believed to contain a single copy of the viral genome, which is a positive-sense, single-stranded RNA molecule comprised of ∼9600 nt (Kato 2000). The genome is highly structured, with many intragenomic base-pairing interactions (Wan et al. 2022), and can be divided into three regions based on the presence or absence of protein-coding information (Fig. 1A). The first region is the 5′ untranslated region (UTR), which contains an internal ribosome entry site (IRES) that regulates cap-independent translation of the HCV genome (Tsukiyama-Kohara et al. 1992; Wang et al. 1993; Lukavsky 2009). The second and by far the largest region is an open reading frame (ORF) that encodes for the 3000 amino acid–long HCV polyprotein (Kato 2000). The third region is the 3′ UTR, and unlike the first two, a detailed understanding of the essential molecular functions associated with this region of the genome has yet to be established.
FIGURE 1.

Architecture of the hepatitis C virus (HCV) genome. (A) The HCV genome is highly structured with extensive intragenomic base-pairing interactions and can be partitioned into three regions: the 5′ UTR (nt: 1–341), the ORF (nt: 342–9442), and the 3′ UTR (nt: 9443–9678). Figure adapted from Wan et al. (2022). (B) The 3′ UTR is terminated by a 98 nt sequence known as 3′X. It is highly conserved, with the color of each nucleotide representing the frequency with which it appears in the NCBI GenBank. There are two different experimentally supported secondary structures for this RNA (3′Xb and 3′Xa). The major structural differences between the two conformations are largely confined to the first 55 nt associated with either stem–loops SL2/3 or SL2′. Consequently, the two conformations either present or sequester the 7 nt associated with the k-sequence (yellow), which can participate in a distal interaction with 5BSL3.2 in the ORF (A, inset). (C) The presence of this k-5BSL3.2 interaction (left) leaves the IRES free to promote viral protein synthesis. Alternatively, 5BSL3.2 can also interact with the IRES (right), which leaves 3′X free to adopt a conformation (3′Xa) that favors RNA synthesis.
Perhaps the most intriguing functional element in the 3′ UTR appears at the very end of the genome as a highly conserved, 98 nucleotide-long sequence known as 3′X (Fig. 1B). First identified and sequenced in the mid-1990s (Tanaka et al. 1995; Kolykhalov et al. 1996), in vitro genomic RNA transcripts containing this previously unknown sequence were able to cause disease in primates (Kolykhalov et al. 1997). The inclusion of 3′X also enabled the replication of subgenomic HCV RNAs in a human hepatoma cell line (Lohmann et al. 1999), which paved the way for the development of early HCV cell culture systems (Wakita et al. 2005). Since then, experimental and computational secondary structure analyses of 3′X indicated that this sequence can adopt at least two distinct conformations: a three-stem–loop structure (Tanaka et al. 1995; Kolykhalov et al. 1996; Blight and Rice 1997; Ito and Lai 1997) and a two-stem–loop structure (Ito and Lai 1997; Ivanyi-Nagy et al. 2006; Cantero-Camacho and Gallego 2015; Cantero-Camacho et al. 2017), which we refer to as 3′Xb and 3′Xa, respectively (Fig. 1B). Curiously, contemporary secondary structure free energy calculations (see Material and Methods) suggest that the free energies of the two conformations differ by only –2 kcal/mol (Fig. 1B; Supplemental Table S1). This amounts to a 5% difference, which is comparable to typical estimates of fractional errors in free energy calculations using nearest-neighbor parameters (Zuber and Mathews 2019). In both conformations, the last 43 nt adopt a long stem–loop structure (SL1 and SL1′) with nearly identical base-pairing interactions. The most prominent distinction between 3′Xb and 3′Xa is associated with the secondary structure of the first 55 nt, which form either two stem–loops (SL2/3) or one stem–loop (SL2′), respectively (Fig. 1B). Importantly, a previous study has shown that RNA sequences comprising more of the 3′ end of the viral genome were able to adopt two mutually exclusive conformations that appeared to be distinguished by distinct secondary structures within 3′X (Kranawetter et al. 2017).
While some insights into the structure of 3′X have been gleaned over the past two decades, much less is known about the molecular function of this untranslated viral RNA. Several cell-culture studies have demonstrated that deleting nucleotides from 3′X greatly abolished viral replication (Ito and Lai 1997; Ito et al. 1998; Yanagi et al. 1999; Friebe and Bartenschlager 2002; Yi and Lemon 2003a, b; You et al. 2004; Friebe et al. 2005; You and Rice 2008; Masante et al. 2015). Although these cellular studies bolster the notion that 3′X is essential, they arrive at different conclusions regarding its precise involvement in viral protein and/or RNA synthesis (i.e., translation and/or replication).
One emerging hypothesis is that 3′X functions as a regulatory element that primes individual copies of the viral genome for different RNA-dependent processes associated with infection (Fig. 1C). Based on its location in the viral genome, many groups have deduced that 3′X is involved in negative-strand RNA synthesis (Friebe and Bartenschlager 2002; Yi and Lemon 2003a, b). Curiously, 3′Xa presents the last few nucleotides of the genome as a single-stranded overhang (Fig. 1B). Previous studies have shown that such overhangs are optimal for de novo negative-strand RNA synthesis via nonstructural protein 5B—NS5B (Zhong et al. 2000; Cai et al. 2004); in other words, 3′Xa primes the viral genome for RNA synthesis. Conversely, 3′Xb presents the 7 nt of the so-called k-sequence in an apical loop (Fig. 1, yellow), where they can freely interact with a complementary sequence (Fig. 1A, inset; Fig. 1C) located in stem–loop 3.2 of the sequence encoding NS5B—5BSL3.2 (You et al. 2004; Friebe et al. 2005; You and Rice 2008; Romero-Lopez et al. 2014). Previous reports suggest that 5BSL3.2 can interact with alternative forms of 3′X (e.g., 3′Xa); however, the precise structure of the remaining nucleotides in 3′X has yet to be fully resolved (Kranawetter et al. 2017; Castillo-Martinez et al. 2022). In any case, the formation of this RNA–RNA interaction would prevent 5BSL3.2 from interacting with the 5′ UTR, leaving the IRES free to initiate cap-independent viral protein synthesis; in other words, 3′Xb primes the viral genome for protein synthesis (Romero-Lopez and Berzal-Herranz 2009, 2012; Shetty et al. 2013; Kranawetter et al. 2017).
Here, we use single-molecule Förster resonance energy transfer (FRET) spectroscopy (Fig. 2) to quantify the structural, energetic, and dynamic properties of the first 55 nt of 3′X, thereby allowing us to assess the biochemical merits of this riboregulatory hypothesis. FRET is a highly distance-dependent photophysical phenomenon that is routinely used to spectroscopically monitor structural changes of fluorescently labeled biomolecules under a wide range of solution conditions (Roy et al. 2008; Holmstrom et al. 2018). When conducted at the single-molecule level, FRET is capable of monitoring and distinguishing between the individual members of a multiconformation mixture, a feat that can be difficult for many ensemble techniques. Finally, single-molecule FRET uses low concentrations (∼100 pM) of fluorescently labeled biomolecules, which minimizes the likelihood of homomeric interactions between 3′X molecules (Ivanyi-Nagy et al. 2006; Shetty et al. 2010; Cantero-Camacho and Gallego 2015; Cantero-Camacho et al. 2017), which have been observed at the higher concentrations typically associated with other biophysical techniques. Our single-molecule FRET results indicate that the first 55 nt of 3′X slowly interconvert between two distinct conformations that have previously been implicated in viral protein and RNA synthesis.
FIGURE 2.

Overview of single-molecule FRET measurements. (A) Schematic representation of a single-molecule microscope system comprised of monochromatic laser diodes (MLDs), silver mirrors (SMs), long-pass dichroic (LPD), a multiband dichroic (MBD), an objective, achromatic lenses (L), a confocal pinhole (P), and avalanche photodiode detectors (APDs). (B) Detected photons are partitioned into 1.0 msec time bins based on their arrival time. Any time bin with a total number of photons (top) >30 (black dashed line) is considered a burst. These photons are partitioned based on the excitation source that was ON when the photon was detected (bottom). This allows us to calculate the transfer efficiency (E) of bursts originating from FRET-active molecules, which contain one active donor and one active acceptor fluorophore.
RESULTS
The discovery and subsequent incorporation of 3′X led to the construction of fully infectious genomic RNA transcripts (Kolykhalov et al. 1997). Therefore, it is perhaps unsurprising that this essential untranslated RNA is highly conserved across all major viral genotypes. Consistent with other HCV genomic analyses of 3′X (Kolykhalov et al. 1996; Triebel et al. 2023), our straightforward analysis of a multiple sequence alignment (MSA) containing more than 1000 RNA sequences indicates that 88 of the 98 nt associated with 3′X appear at the given position >99% of the time (Fig. 1B). In the first 55 nt of 3′X, which are expected to adopt one-of-two proposed conformations, 53 appear at the given position >99% of the time, with 6 of 7 nt in the k-sequences being absolutely invariant. Despite being required for viral replication and highly conserved, it remains unclear how the structural properties of this untranslated RNA enable it to perform essential roles during viral infection.
Monomeric 3′X55 can adopt two conformations in solution
To better understand the structural properties of this enigmatic RNA, we used single-molecule FRET spectroscopy (Fig. 2) to monitor the conformational dimensions of fluorescently labeled RNA constructs (Fig. 3) comprised of the first 55 nt of 3′X (3′X55). When these molecules pass through the diffraction-limited focus of our excitation sources (Fig. 2A), a brief (<1 msec) burst of several dozen fluorescence photons is generated (Fig. 2B). The photons associated with high-quality bursts are then used to calculate transfer efficiencies, which, after the duration of the entire measurement, are compiled together in a so-called transfer efficiency histogram to quantify the resulting distributions.
FIGURE 3.

Construction of 3′X55. The fluorescently labeled RNA constructs discussed in this paper were produced using a splinted-ligation method (Solomatin and Herschlag 2009). First, two RNA oligos were labeled with fluorophores and then annealed to a DNA splint before being ligated together via T4 RNA ligase II. The resulting product is an RNA–DNA hybrid containing 3′X55, where the donor fluorophore (Cy3B) is attached to nucleotide 13 and the acceptor fluorophore (CF660R) resides between nucleotides 39 and 40. Next, the DNA splint was digested with DNase I, allowing for 3′X55 to be purified using HPLC. Finally, the labeled RNA molecules were allowed to refold under storage conditions, where they appeared to form both 3′X55b (left) and 3′X55a (right). See Materials and Methods for more details.
Under our baseline experimental conditions (1 mM MgCl2, 150 mM NaCl, 25 mM HEPES, 12.5 mM NaOH, and 50 µM TWEEN 20) transfer efficiency histograms of 3′X55 show two distinct, yet slightly overlapping populations: a minor population at intermediate transfer efficiency values and a major population at high-transfer efficiency values (Fig. 4A, top). The entire distribution was fit to a sum of two peaked functions to determine the mean transfer efficiencies associated with each population, 〈E〉int = 0.66 ± 0.04 and 〈E〉high = 0.97 ± 0.01.
FIGURE 4.

Conformations of 3′X55. (A) Representative transfer efficiency histograms comprised of high-quality bursts associated with either 3′X55 (top) or 3′X49 (bottom) are jointly fit to a sum of two peaked functions to determine the mean transfer efficiency, 〈E〉, and relative abundance, ϕ, of each species. (B) Molecular representations of the three-dimensional models of 3′X55b (left) and 3′X55a (right) showing the AV associated with the donor and acceptor fluorophores and the modeled transfer efficiencies derived from them.
To assign these two populations to different molecular conformations, we first generated three-dimensional models for the two proposed conformations of 3′X (see Materials and Methods). Then the two models were imported into the FRET Positioning and Screening software (Kalinin et al. 2012) to calculate an accessible volume (AV) for the donor and acceptor fluorophores, and subsequently an average interfluorophore distance, which was used to generate a transfer efficiency for each conformation of 3′X (Fig. 4B). Indeed, these modeled 〈E〉 values were remarkably consistent with the experimentally observed 〈E〉 values allowing us to attribute the intermediate- and high-transfer efficiency populations to 3′X55b and 3′X55a, respectively. From this analysis, we can also quantify the relative abundance, ϕ, of the species associated with the two populations by integrating the peak functions. Under baseline experimental conditions, we see that on average ϕhigh = 74 ± 6% (Fig. 4A, top), and therefore, there is only a modest free energy difference (ΔG° ≈ −0.6 kcal/mol) between the two conformations.
To further validate our preliminary conformational assignments of the intermediate- and high-transfer efficiency populations, we designed a second RNA construct (3′X49) that lacks the last 6 nt of 3′X55. Because of their involvement in the base-pairing interactions associated with the SL2′ of 3′X55a, we expected these nucleotide deletions to greatly destabilize this high-transfer efficiency species. Conversely, because these nucleotides are not involved in either of the two stem–loops (i.e., SL2 and SL3) of 3′X55b, we expected these nucleotide deletions to have little effect on the stability of this intermediate transfer efficiency species. Therefore, the conformational equilibrium of 3′X49 should shift toward the intermediate transfer efficiency species, which is indeed consistent with our secondary structure free energy calculations (Supplemental Table S1). In our 3′X49 measurements, we indeed observed two populations with 〈E〉 values that are similar to those observed for 3′X55 (Fig. 4A, bottom). As expected, the relative abundance of the intermediate transfer efficiency species greatly increased, suggesting that this population likely corresponds to the two-stem–loop conformation of these 3′X constructs. This is consistent with a previous NMR study of a similar 3′X49 construct, in which a pseudo-stable two-stem–loop structure was observed(Cantero-Camacho and Gallego 2015).
To assess the monomeric status of our 3′X constructs, we first used analyses from fluorescence correlation spectroscopy to calculate the mean diffusion time (τD) of 3′X55 and 3′X49 (Supplemental Fig. S1A). This analysis yielded similar values for the two RNAs and indicated that the hydrodynamic radius and thus oligomeric status of the two species were similar. Then, to verify that 3′X55 was indeed monomeric, a 100 pM sample was refolded immediately before being measured under baseline experimental conditions to minimize the formation of any oligomeric species. Notably, the transfer efficiency histogram of this sample (Supplemental Fig. S1B) looked similar to that of the 3′X55 samples refolded at an RNA concentration of 10 nM (Fig. 4A, top), suggesting that both refolding procedures were effective at preventing oligomerization of 3′X55.
The relative abundance of each species depends on solution conditions
To begin characterizing this conformational equilibrium, we studied 3′X55 in the presence of urea, a common chemical denaturant that is well-known to disrupt the formation of RNA structure. Upon adding urea to our baseline experimental conditions, we observed a slight decrease in the 〈E〉 values associated with both populations (Fig. 5), although we are reluctant to attribute this entirely to changes in RNA structures as high concentrations of urea can alter photophysical properties associated with FRET. More importantly, our results showed that urea systematically increased the value of ϕint, indicating that the conformational equilibrium has shifted toward RNAs that resemble 3′X55b. Curiously, both species remained quite compact (i.e., 〈E〉 > 0.5) under these highly denaturing conditions and the RNA only sampled a low-transfer efficiency population (Fig. 5, orange) of presumable expanded/unfolded conformations when NaCl and MgCl2 were excluded from the destabilizing measurements.
FIGURE 5.
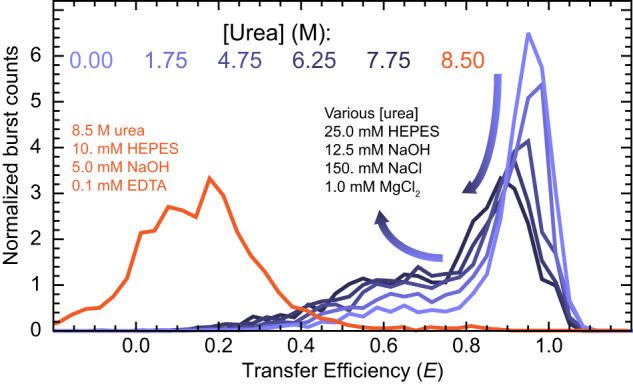
Chemical destabilization of 3′X55. Representative transfer efficiency histograms of 3′X55 under various destabilizing conditions show that the addition of urea to baseline experimental conditions (light to dark violet) shifts the 〈E〉 of both populations to lower values and increases the value of ϕint. When NaCl and MgCl2 are excluded from the destabilizing measurements, 3′X55 unfolds and samples a substantially more expanded low-transfer efficiency population (orange).
RNA molecules are known to routinely bind Mg2+, which can stabilize compact structures by shielding the negative charge that is characteristic of the phosphodiester backbone. To better understand how these cations influence the structure of 3′X55, measurements were performed under baseline experimental conditions with various concentrations of MgCl2 (Fig. 6). Curiously, lower concentrations of MgCl2 (i.e., ≤1 mM) did not alter the conformational equilibrium of 3′X55 (Fig. 6B, filled circles). Transfer efficiency histograms from measurements with elevated concentrations of MgCl2 revealed that the value of 〈E〉high remained constant and that the value of 〈E〉int only increased slightly. Like urea, higher concentrations of MgCl2 shifted the conformational equilibrium toward the intermediate transfer efficiency species (Fig. 6A). For example, increasing the concentration of MgCl2 from 1 mM to 3 mM resulted in a measurable increase in ϕint. In fact, ϕint continued to increase as the MgCl2 concentration increased, with 3′X55b eventually becoming the major species at concentrations above the apparent Mg2+ dissociation constant ([Mg2+]1/2 = 16 ± 3 mM). It is important to note that during subsequent nonequilibrated measurements (Fig. 6B, open circles) the introduction of MgCl2 did not immediately alter the values of ϕ, which suggests that the interconversion between 3′X55b and 3′X55a is much slower than the 10 min duration of our single-molecule measurements.
FIGURE 6.

Impact of MgCl2 on the conformations of 3′X55. (A) Representative transfer efficiency histograms of 3′X55 at various concentrations of MgCl2. (B) Relative abundance, ϕ, values derived from fully equilibrated measurements (filled circles) show that elevated concentrations of MgCl2 shift the conformational equilibrium toward the intermediate transfer efficiency population. These data are globally fit to a standard binding equation (solid line), yielding an apparent Mg2+ dissociation constant of [Mg2+]1/2 = 16 ± 3 mM. The ϕ values associated with nonequilibrated measurements conducted immediately after the addition of MgCl2 (open circles) are experimentally indistinguishable from fully equilibrated measurements under baseline experimental conditions (dashed line). Subsequent time-resolved measurements were conducted at select MgCl2 concentrations (gray boxes).
The interconversion between conformations is slow
To better understand the kinetics of these slow conformational dynamics, time-resolved measurements were carried out at 1, 10, and 50 mM MgCl2. In these measurements, data collection began immediately after adding MgCl2 to the solution and continued for more than half a day. These data were then partitioned into 73 consecutive 10 min measurements (Fig. 7), which were then analyzed like all other measurements. The ϕ values from time-resolved measurements performed at 1 mM MgCl2 were experimentally indistinguishable from one another (Fig. 7B, circles), which was consistent with the results of both the fully equilibrated and nonequilibrated measurements under the same conditions (Fig. 6B). However, ϕ values did change throughout the time-resolved measurements performed at MgCl2 concentrations of 10 mM (Fig. 7B, diamond) and 50 mM (Fig. 7B, stars). The ϕ values associated with all three conditions were then globally fit to a kinetic model describing unimolecular interconversion (see Materials and Methods), whose fitted parameters quantified the forward (kf; 3′X55a to 3′X55b) and reverse (kr; 3′X55b to 3′X55a) rate constants, with kf increasing from 2.4 ± 0.1 day−1 at 10 mM MgCl2 to 3.33 ± 0.07 day−1 at 50 mM MgCl2, and kr decreasing from 3.7 ± 0.2 day−1 to 2.36 ± 0.08 day−1.
FIGURE 7.
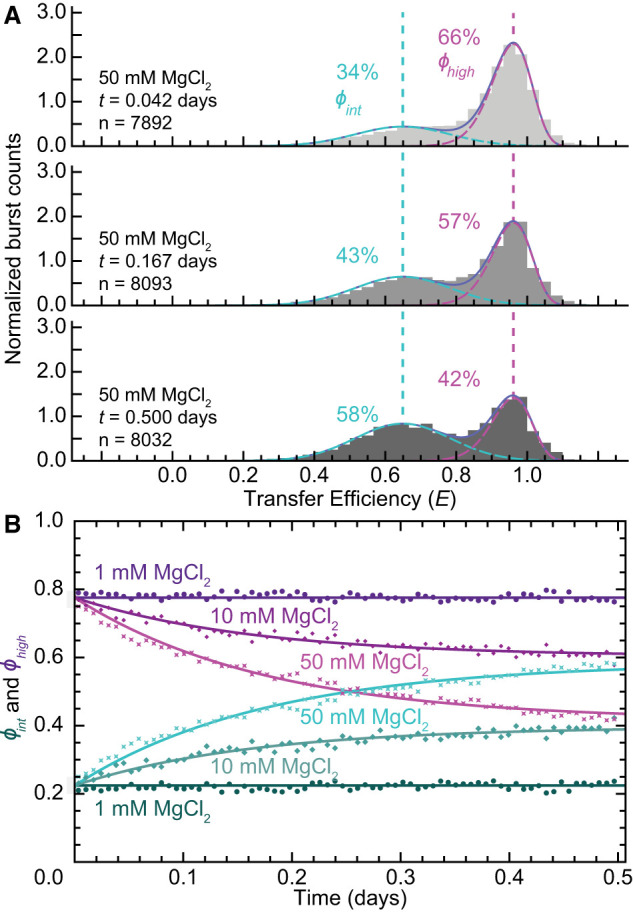
MgCl2 dependence of 3′X55 conformational dynamics. (A) Representative 10 min transfer efficiency histograms from time-resolved measurements of 3′X55 at 50 mM MgCl2 for the time points t = 0.042, 0.167, and 0.500 days show the systematic increase in ϕint. (B) Interconversion kinetics are extracted by globally fitting the ϕ data to a kinetic model (solid lines) describing unimolecular interconversion (see Materials and Methods).
DISCUSSION
3′X is a highly conserved and structured untranslated RNA that is essential for viral replication. Previous work suggests that 3′X can adopt two conformations, leading to the hypothesis that each has the potential to regulate a different RNA-dependent process associated with infection (Kao et al. 2000; You et al. 2004; Romero-Lopez and Berzal-Herranz 2012). Our findings highlight several notable biochemical features in the first 55 nt of 3′X that are highly compatible with this hypothesis.
Previous genomic analyses have shown that mutations rarely appear in the nucleotide sequence associated with 3′X (Kolykhalov et al. 1996). This is consistent with a recent analysis of a whole-genome MSA that observed the vast majority of 3′X nucleotides were nearly invariant (Triebel et al. 2023). Indeed, our straightforward analysis of an MSA containing more than 1000 RNA sequences shows that the only difference in our reference sequence from the consensus sequence is a uracil position 55 (Supplemental Fig. S2), which appears much less frequently (19%) than adenosine (81%). Notably, this A → U substitution in the context of our 3′X55 construct introduces a potential base-pairing interaction with G1, which may bias it toward 3′X55a (Fig. 1B). However, in the context of the full-length 3′X, U55 could also form a base-pairing interaction with A96, thus eliminating any strong conformational biases associated with this substitution.
In our single-molecule FRET experiments, we clearly see the coexistence of two distinct conformations of 3′X55 (Fig. 4A, top) with a free energy difference that favors the 3′X55a. This observation is qualitatively consistent with secondary structure free energy calculations (Supplemental Table S1). Although we expect 3′X55 to be quite modular, the exact details of this conformational equilibrium likely depend on the molecular context of this RNA sequence and whether it is isolated (as is the case here) or contained within, for example, the entire 3′X domain (Cantero-Camacho and Gallego 2015; Kranawetter et al. 2017), or larger segments of the viral genome.
Although there are currently no high-resolution molecular models for 3′X55, let alone 3′X, the structural insights from our results are compatible with both experimentally (Blight and Rice 1997; Ivanyi-Nagy et al. 2006; Cantero-Camacho and Gallego 2015; Cantero-Camacho et al. 2017; Kranawetter et al. 2017) and computationally (Tanaka et al. 1995; Kolykhalov et al. 1996; Ito and Lai 1997) derived models for these two conformations (Fig. 4). Not only does this highlight the utility of current tertiary structural prediction algorithms, but the near quantitative agreement suggests that these preliminary models may be a useful foundation for future structural studies of 3′X.
The two conformations associated with these models orient the k-sequence in different structural contexts (Fig. 1B). 3′Xb presents the k-sequence in an apical loop that can then readily bind to and sequester 5BSL3.2 (You et al. 2004), leaving the IRES free to initiate viral protein synthesis (Romero-Lopez et al. 2014). Conversely, 3′Xa sequesters the k-sequence, which would hinder the formation of this distal interaction, allowing 5BSL3.2 to favorably interact with the IRES in a way that impairs the translation of the viral genome (Romero-Lopez and Berzal-Herranz 2012). Additionally, the last 43 nt of 3′Xa are arranged in a stem–loop with a 3 nt single-stranded overhang that is not present in 3′Xb (Cantero-Camacho and Gallego 2015). These structural features have been reported to enhance de novo negative-strand RNA synthesis via NS5B (Kao et al. 2000; Zhong et al. 2000). In principle, these two coexisting conformations of 3′X would each influence and together balance the different RNA-dependent processes associated with viral infection, which is consistent with the notion that this one untranslated RNA can regulate both viral protein synthesis and viral RNA synthesis (Fig. 1C). Additionally, the two conformations being implicated in both processes may rectify the differing conclusions put forth by researchers who have previously concluded, based on the introduction of different genetic mutations, that 3′X is involved in either protein or RNA synthesis (Ito and Lai 1997; Ito et al. 1998; Yi and Lemon 2003b; Masante et al. 2015). However, it is entirely possible that the chosen mutations did not completely oblate the functionality of 3′X. Instead, the mutations may have simply shifted the conformational equilibrium of this riboregulatory element to greatly favor one conformation over the other, giving the illusion that this RNA is only involved in one of the two processes.
The structural energetics of 3′X55 shows that the two conformations are similarly stable under baseline experimental conditions. Surprisingly, 8.5 M urea is not sufficient to unfold 3′X55 under these conditions, suggesting that both species are quite stable (Fig. 5). Instead, the addition of urea increases the abundance of intermediate transfer efficiency RNAs that resemble 3′X55b and decreases the abundance of high-transfer efficiency RNAs that resemble 3′X55a. The urea dependence of this conformational equilibrium can be explained by the solvent-accessible surface area (SASA) of the ribose, nucleobase, and phosphate groups (Lambert and Draper 2012). When we calculate these SASA values using our three-dimensional models, we see that 3′X55b has greater nucleobase SASA, which enables more favorable interactions with urea and thus shifts the equilibrium toward this conformation (Lambert and Draper 2012). Similarly, the addition of MgCl2 also increases the abundance of RNAs with intermediate transfer efficiencies (Fig. 6), which in this case were assigned to 3′X55b. This finding is consistent with a previous NMR study of a longer genomic RNA (385 nt), where peak intensities for a 3′Xb-like conformation increased in higher ionic strength conditions (Kranawetter et al. 2017). Based on our three-dimensional models, we see that 3′X55b has less phosphate SASA, which is indicative of a more charge-dense RNA structure. Such structures can more favorably interact with counterions like Mg2+, leading to an increase in occupancy at high MgCl2 concentrations. In summary, the urea dependence and Mg2+ dependence of our results are fully compatible with the two proposed structural models. Finally, the observed coexistence of two conformations under a wide range of both stabilizing and destabilizing conditions may indicate that they are both present in more chemically complex environments like the cellular milieu.
Our kinetics data demonstrate that the interconversion between the two structures is incredibly slow, taking place over the course of several hours (Fig. 7). This may not be surprising given the lack of secondary structural similarities between 3′X55b and 3′X55a; thus, any structural rearrangements require a complete disruption and subsequent formation of more than a dozen base-pairing interactions. Interestingly, the HCV genome is reported to have a 3.4 h half-life (Chatterjee et al. 2013), which would mean that interconversion is unlikely to occur before the genome is degraded—unless other factors present in an infected hepatocyte greatly accelerate these conformational transitions. Without substantial interconversion, the functional fate of the genome (i.e., viral protein or RNA synthesis) would be sealed once 3′X adopts one of these two conformations, thereby reducing genomic conflict between ribosomes and NS5B. Curiously, the HCV core protein has been shown to rapidly promote in vitro viral genome dimerization via 3′X (Cristofari et al. 2004; Ivanyi-Nagy et al. 2006; Shetty et al. 2010), which may be an efficient way to liberate 3′X from the functional constraints associated with this monomeric conformational equilibrium.
Conclusions
Here, we used a straightforward genomic analysis of more than 1000 RNA sequences to show that the vast majority of the nucleotides that make up 3′X are extremely conserved. Using single-molecule fluorescence approaches, we observed that the first 55 nt of 3′X coexist in two distinct conformations that have previously been implicated in regulating biomolecular synthesis during a viral infection. Both conformations are present over a wide range of stabilizing and destabilizing conditions, and the interconversion between them is slower than the reported half-life of the HCV genome. Together, these biochemical features may help the virus synthesize adequate amounts of both viral protein and genomic RNA by flagging individual copies of the viral genome as a substrate for either ribosomes or NS5B. Additionally, our findings bolster an emerging hypothesis for the regulatory function of this untranslated viral RNA.
MATERIALS AND METHODS
Nucleotide conservation analysis of 3′X RNA
Throughout this work, we used the terminal 98 nt of a genotype 1b viral isolate (GenBank: AJ238799.1) as the reference sequence for 3′X, allowing for direct comparison to previous biochemical and biophysical studies of this RNA (Lohmann et al. 1999; Ivanyi-Nagy et al. 2006; Shetty et al. 2010; Cantero-Camacho and Gallego 2015; Cantero-Camacho et al. 2017). To determine the evolutionary conservation of the nucleotides in the reference sequence, a BLAST+ database was created containing all available HCV RNA sequences deposited in NCBI GenBank (256,786 total sequences as of May 25, 2023). The database was then queried to identify all sequences that could be locally aligned to the 98 nt of our 3′X reference sequence (Altschul et al. 1990). The resulting unfiltered FASTA file, which contained 1107 pairwise alignments, was then fed into version 7 of MAFFT (Kuraku et al. 2013) to generate a single MSA. Finally, the MSA was imported into Mathematica 13 (Wolfram) to determine both the frequency at which each nucleotide appears at every position in the reference sequence (Fig. 1B) as well as a consensus sequence for 3′X (Supplemental Fig. S2). Gaps flanking the first or last nucleotides in a sequence were not used in the nucleotide frequency calculations, as we believed those to be a result of incomplete sequencing due to the location of 3′X in the genome.
Secondary structure free energy calculations
The secondary structures for 3′Xb (Blight and Rice 1997) and 3′Xa (Cantero-Camacho and Gallego 2015) were taken from previously published reports. The “Structure display and free energy determination” mFold application hosted on the UNAFold web server (http://www.unafold.org) was used to calculate folding free energy values. We uploaded a connectivity table file (.ct) for each reported secondary structure to constrain the free energy calculations to precisely one secondary structure (Fig. 1B). Calculations were carried out using the free energy parameters from RNAFold v2.3 (Walter et al. 1994). Additionally, the temperature was set to 20°C, the NaCl concentration was set to 150 mM, and the MgCl2 concentration was set to 1 mM. All other variables and options were left at their defaults. The free energy differences between the two conformations (Supplemental Table S1) were calculated as ΔΔG° = ΔG°(3′Xa) − ΔG°(3′Xb). To calculate the free energy values for 3′X55a/b and 3′X49a/b, the corresponding .ct file was uploaded instead of those for 3′Xa/b.
Chemicals and reagents
Filtered (0.2 µm) ultrapure water (18.2 MΩ cm) was used to prepare all aqueous solutions. Sodium mono- and dibasic phosphate, 4-(2-hydroxyethyl-1-piperazineethanesulfonic acid (HEPES), ethylenediaminetetraacetic acid (EDTA), TWEEN 20, urea, dimethyl sulfoxide (DMSO), and magnesium chloride were all sourced from Sigma-Aldrich. Sodium hydroxide, sodium chloride, and acetonitrile (ACN) were all purchased from Fisher Scientific. Triethylammonium acetate (TEAA) was purchased from Millipore. N-hydroxysuccinimide (NHS) ester-modified variants of Cy3B and CF660R were purchased from Cytiva and Sigma-Aldrich, respectively. T4 RNA ligase II and DNase I were both purchased from New England Biolabs.
Labeling, ligation, and purification of FRET-labeled 3′X RNA constructs
Various custom-ordered RNA and DNA oligos (Supplemental Table S2) were purchased from Integrated DNA Technologies (IDT). The three amino-modified RNA oligos were suspended in storage solution (10 mM HEPES, 5 mM NaOH, and 0.1 mM EDTA), and then filtered five to eight times into labeling buffer (100 mM sodium phosphate, pH 8.0) using centrifugal concentrators (Sartorius; VIVASPIN 500 3000 MWCO PES) to remove unwanted primary amines present in the solution. Before labeling, the RNA concentration was adjusted to 100 µM. Next, NHS-ester-modified variants of the donor (Cy3B) and acceptor (CF660R) fluorophores were suspended in DMSO at a final concentration of 1 mM. To initiate the labeling reactions, fluorophore solutions were mixed with the RNA solutions to achieve a 10:1 molar ratio. The reaction mixtures were again filtered at least six times into labeling buffer using the centrifugal concentrators to remove fluorophores that were not covalently conjugated to the RNA. The labeled RNA oligos were purified from their unlabeled counterparts using an HPLC system (Agilent Technologies; 1260 Infinity II) pumping a 0.1 M TEAA water/ACN gradient through a reversed-phase column (Dr. Maisch; ReproSil-Pur 200 C18-AQ 3 µm), ultimately leaving us with an RNA oligo (RNA 1) with the donor fluorophore covalently conjugated to a primary amino group in nucleotide 13 as well as two RNA oligos (RNA 2 and 3) with the acceptor fluorophore covalently conjugated to an amino group between nucleotides 39 and 40 (Fig. 3; Supplemental Fig. S3).
To generate 3′X55 and 3′X49, donor-labeled RNA 1 was ligated to either acceptor-labeled RNA 2 or acceptor-labeled RNA 3, respectively (Supplemental Table S2). It is important to note that the ligation site is located between nucleotides 29 and 30, which corresponds to unpaired secondary structures in both proposed conformations (Fig. 1B). These labeling and ligation sites were selected to minimize the fluorophore's ability to disrupt any important secondary structure interactions and to have long RNA oligos with limited secondary structure, ensuring that they would efficiently anneal to the DNA splint (see below). The splinted-ligation workflow (Fig. 3) we used to prepare the FRET-labeled constructs described in this work is based on a general protocol previously described by Solomatin and Herschlag (2009). Briefly, the purified labeled RNA oligos were annealed to a complementary DNA splint and ligated together using T4 RNA ligase II. Following, ligation, the DNA splint was digested using DNase I. The resulting donor- and acceptor-labeled, ligated RNA construct was purified again using the HPLC, as described above. The two desired products—3′X55 and 3′X49—were first lyophilized, and then resuspended in storage solution at a final RNA concentration of 10 nM. To refold the ligated products into their most thermodynamically stable monomeric conformations, the RNA solutions were incubated at 95°C for 10 min and then quickly snap-cooled in liquid nitrogen. The refolded product was stored at −80°C.
Acquisition of single-molecule FRET data
All single-molecule measurements were performed on a custom-modified inverted confocal fluorescence microscope (Fig. 2A) (PicoQuant; MicroTime200) equipped with two monochromatic excitation sources to directly excite the donor and acceptor fluorophores: one at 515 nm (Omicron; Quixx 515-80PS) and the other at 642 nm (Omicron; Quixx 642-140PS). Both laser diodes were set to operate in continuous-wave mode and then alternatingly modulated (ON/OFF) using a square wave signal (20 kHz repetition rate and ∼50% duty cycle) from a function generator (Berkeley Nucleonics Corporation; Model:577-4C) before being adjusted to 90 µW to achieve an alternating-laser excitation (ALEX) configuration (Kapanidis et al. 2004). After being coaxially aligned, the two laser beams are then directed into the microscope using a multiband dichromic mirror (Chroma; ZT532/640rpc) and focused to a diffraction-limited spot 50 µm above the top surface of a coverslip (Ibidi; uncoated 15-well angiogenesis µ-slide) using a 60× water-immersion objective with a numerical aperture of 1.2 (Olympus; UPlanSAPO). A fraction of the fluorescence is then collected by the same objective in an epifluorescence configuration and transmitted back through the multiband dichroic mirror. The fluorescence was then focused through a 100 µm confocal pinhole to remove any photons that originated outside of the focal plane. The remaining fluorescence was then split via a polarizing beam splitter (PicoQuant; BS Cube Polarizer), generating two streams of photons whose oscillating electric fields are oriented either parallel or perpendicular to that of the excitation sources. These photon streams are each split again using a long-pass filter (Chroma; T635lpxr) to spatially separate photons emitted from the donor and acceptor fluorophores. Each of the four resulting photon streams is then directed toward an avalanche photodiode detector (Excelitas Technologies; SPCM-AQRH-14-TR), which notifies the time-correlated single-photon counting (TCSPC) module (PicoQuant; HydroHarp 400) that a photon was detected. All measurements were performed with a temporal resolution of 16,384 psec.
Analysis of single-molecule FRET data
Photon arrival time data were saved to a .ptu file, which was then imported and analyzed in Mathematica 13 using a user-extendable software package called Fretica (https://schuler.bioc.uzh.ch/programs/), last compiled on March 9, 2020. First, all photons are placed into 1 sec time bins based on their arrival times. Any time bins containing a total number of photons that exceeds the mean plus three times the standard deviation are assumed to have originated from large, slowly diffusing particles or aggregates (and not single, freely diffusing RNA molecules), and therefore these photons were excluded from downstream analyses.
The remaining photons were then rebinned into 1 msec time bins again based on their arrival times (Fig. 2B, top). Correction factors were used to adjust the numbers of photons in each bin to account for experiment limitations associated with (1) donor emission landing on acceptor detectors, (2) direct excitation of the acceptor fluorophore via the 515 nm laser diode, (3) unequal detection efficiency of donor and acceptor photons, and (4) unequal excitation efficiencies of the donor and acceptor fluorophores via their 515 and 642 nm excitation sources. After corrections had been applied, any millisecond time bin with a total number of photons between 30 and 500 was classified as a burst of fluorescence; all other time bins were classified as background fluorescence. The numbers of photons in all time bins were then adjusted to account for average background fluorescence. All background corrected time bins were then reclassified as either burst bins or background bins using the same criterion described above. Next, the total number of photons in each bin was once again adjusted to account for slight changes in the average background fluorescence associated with the reclassified pool of background bins. This process was repeated iteratively until the average fluorescence background remained constant.
A function generator synchronizes the two alternating excitation sources in a way that ensures that they are never ON at the same. Combined with the knowledge of every photon's arrival time, this enables us to confidently determine which excitation source (515 or 642 nm) was ultimately responsible for generating the detected photon (Fig. 2B, bottom). This information is then used to calculate the fluorophore stoichiometry S for all burst bins using Equation 1, and the total number of photons (after corrections) generated by either the 515 nm (515NTotal) or 642 nm (642NTotal) excitation sources. In addition to calculating S for each burst bin, we can also calculate the transfer efficiency E of each burst bin using Equation 2, and the total number of acceptor (515NAcc) and donor (515NDon) photons (after corrections) generated by specifically the 515 nm excitation source (Fig. 2B, bottom). Here, of course, the E values report on the distance between the two fluorophores in a manner governed by FRET (Förster 1948).
| (1) |
| (2) |
The S and E values for all burst bins can be displayed on a scatter plot (Supplemental Fig. S4) to visualize the different populations present in the sample. Any burst bins with S ≈ 1 or S ≈ 0 indicate that either the acceptor or donor fluorophores on the RNA were inactive (Kapanidis et al. 2004). The overall abundance of these undesirable data was quantified by projecting these data onto the S axis and fitting the resulting distribution to a sum of three Gaussians, revealing that our RNA constructs are >95% FRET-active. We chose to restrict our downstream analyses to high-quality burst bins that were FRET-active (i.e., 0.25 < S < 0.75), bright (i.e., 642NTotal + 515NTotal > 40), and lacking signs of photobleaching and rapid conformational dynamics based on the differences in mean photon arrival times derived from 515NAcc and 515NDon and from 515NTotal and 642NTotal.
High-quality bursts were then compiled into transfer efficiency histograms depicting either the number of bursts over a specific transfer efficiency range (Supplemental Fig. S4) or, more often, the normalized burst count (i.e., probability density) associated with the midpoint of that range (Figs. 4A, 5, 6A, and 7A). These histograms were then fit to the sum of a Gaussian and a log-normal distribution with each distribution corresponding to a single population. Fitted parameters associated with the positions, widths, and asymmetries of the fitted distributions were first determined by globally analyzing three histograms—the original unbiased histogram in addition to two population-biased histograms generated using a recurrence analysis of single particles (Hoffmann et al. 2011). To selectively bias the intermediate transfer efficiency population, histograms were generated for any bursts that were within two bins (2 msec) of a burst where 0.0 < E < 0.8. To selectively bias the high-transfer efficiency population, histograms were generated for any bursts that were within two bins (2 msec) of a burst where 0.85 < E < 1.2 (Supplemental Fig. S5).
Three-dimensional models of 3′X55
Presently, there are no atomic resolution structural models for either of the proposed secondary structures associated with 3′X55. To generate a model for 3′X55b, we used RNAComposer (Popenda et al. 2012), which uses machine translation principles to predict the three-dimensional structure of a given RNA sequence. Briefly, the sequence of 3′X55 (Supplemental Table S2) along with the associated bracket-dot map for the proposed secondary structure of 3′Xb (Fig. 1B, left) were provided as inputs to RNAComposer, which output a .pdb file for the predicted three-dimensional structure of 3′X55b. For 3′X55a, we used a previously generated three-dimensional model generated by Cantero-Camacho et al. (2017). This was generated by first determining the secondary structure of 3′Xa by NMR experiments (Cantero-Camacho and Gallego 2015). The base-pairing interactions were used to generate three-dimensional models and then simulate SAXS data to align with experimentally observed SAXS scattering data. The best models were refined to produce the 3′X55a model (Cantero-Camacho et al. 2017).
Fluorophore accessible volume calculations
Modeled transfer efficiencies associated with the two conformations of the various fluorescently labeled RNA constructs used in this work were calculated using the FRET Positioning and Screening software (Kalinin et al. 2012). When provided with a .pdb file of a three-dimensional model, this software will generate an AV for each fluorophore (Fig. 2B) at the specified labeling positions based simply on rigid body docking, which together are used to calculate the interfluorophore distances (r). The mean value of r is then used to calculate modeled transfer efficiencies using the Förster equation (Equation 3), where the Förster distance (R0) is assumed to be 5.9 nm based on the photophysical properties of the fluorophore pair used in this study.
| (3) |
Sample preparation
All measurements were conducted at 23°C in 50 µL of sample within 15-well angiogenesis µ-slides (Ibidi). Sample solutions always contained roughly 100 pM fluorescently labeled RNA to achieve single-molecule conditions, as well as 50 µM TWEEN 20 to prevent unwanted absorption of the RNA to the surfaces of the wells. For measurements under baseline experimental conditions, the samples also contained 150 mM NaCl, 25 mM HEPES with 12.5 mM NaOH, and 1 mM MgCl2. For measurements under stabilizing conditions, the only deviation from the baseline experimental conditions was the concentration of MgCl2 (0.1–50 mM). For most measurements under destabilizing conditions, various concentrations of urea (0.25–8.5 M) were added to the baseline experimental conditions; the sole exception was a single measurement at 8.5 M urea under what would otherwise be storage conditions. All fully equilibrated measurements were performed 12 h after the samples were prepared and lasted a total of 10 min. All nonequilibrated measurements were performed immediately after the samples were prepared and lasted for a total of 10 min, except in the case of the time-resolved measurements, which acquired data for a total of 12 h. For these measurements, a low vapor-pressure immersion oil was used instead of water.
Mg2+ binding analysis
Values for ϕ from nonequilibrated measurements were fitted to a horizontal line to determine the average value across all MgCl2 concentrations. A form of the standard ligand binding equation (where Initial and Final are the asymptotic values of ϕ, and [Mg2+]1/2 is the concentration Mg2+ required to achieve half of the maximal change in ϕ) was used to fit the values for (Equation 4) and (Equation 5) from fully equilibrated measurements.
| (4) |
| (5) |
Kinetic analysis of time-resolved measurements
Values for and from the time-resolved measurements were globally fit to a system of equations that describes the unimolecular interconversion between 3′X55b and 3′X55a (Equations 6 and 7), where Initial is shared across all three Mg2+ concentrations and the 1 mM MgCl2 data are treated as being time-independent (i.e., ):
| (6) |
| (7) |
SUPPLEMENTAL MATERIAL
Supplemental material is available for this article.
ACKNOWLEDGMENTS
The authors acknowledge the following individuals and institutions for their contributions to this research: the other members of the Holmstrom laboratory for their insightful feedback during the preparation of this manuscript; D. Nettels, B. Schuler, and coworkers for developing Fretica (https://schuler.bioc.uzh.ch/programs/), a user-extendable toolbox for analyzing single-molecule fluorescence data within Mathematica; Brian Sanderson at the University of Kansas Genomic Data Science Core for guidance with multiple sequence alignment; and the University of Kansas and the National Institutes of Health (P20GM103638 to E.D.H.) for financial support.
Footnotes
Article is online at http://www.rnajournal.org/cgi/doi/10.1261/rna.079983.124.
Freely available online through the RNA Open Access option.
MEET THE FIRST AUTHOR
Parker D. Sperstad.

Meet the First Author(s) is an editorial feature within RNA, in which the first author(s) of research-based papers in each issue have the opportunity to introduce themselves and their work to readers of RNA and the RNA research community. Parker D. Sperstad is the first author of this paper, “Conformational dynamics of the hepatitis C virus 3′X RNA.” Parker is a PhD student studying biochemistry and biophysics at the University of Kansas. He works in the Holmstrom laboratory where they use smFRET to study the biochemical and biophysical properties of nucleic acids and their binding partners.
What are the major results described in your paper and how do they impact this branch of the field?
Our study focused on the monomeric structures of the 3′X RNA of the hepatitis C virus, which is an untranslated regulatory element in the HCV genome. Using smFRET, we observed what we believe are the two monomeric conformations of the first 55 nt of this RNA and how the populational distribution is dependent on the concentration of magnesium. We also monitored the interconversion of these two conformations.
What led you to study RNA or this aspect of RNA science?
I have always been drawn to trying to understand the three-dimensional structure of molecules and the dynamics of how they change. When speaking with Dr. Holmstrom when finding a lab to join, our discussion shifted from just talking about RNA structure to discussing the technique the lab uses, and then the mathematics and physics and just how much information we can extract from our data; all of which was, and still is, very interesting to me.
During the course of these experiments, were there any surprising results or particular difficulties that altered your thinking and subsequent focus?
Originally, we were focusing our work on studying the dimerization of HCV 3′X, and one day, as a control experiment, I decided to monitor the FRET distribution of 3′X at single-molecule conditions in the presence of MgCl2 without unlabeled RNA present. Surprisingly, we observed a systematic change that we wanted to further explore and which resulted in this paper.
If you were able to give one piece of advice to your younger self, what would that be?
Keep the “move fast and break things” mentality, but occasionally slow down to pick your head up and ensure that what you are doing makes sense.
What are your subsequent near- or long-term career plans?
I will be defending my thesis in the coming months. After graduating, I hope to continue working with RNA to understand their structures and begin to explore how to target them with small molecule therapeutics.
REFERENCES
- Altschul SF, Gish W, Miller W, Myers EW, Lipman DJ. 1990. Basic local alignment search tool. J Mol Biol 215: 403–410. 10.1016/S0022-2836(05)80360-2 [DOI] [PubMed] [Google Scholar]
- Blight KJ, Rice CM. 1997. Secondary structure determination of the conserved 98-base sequence at the 3′ terminus of hepatitis C virus genome RNA. J Virol 71: 7345–7352. 10.1128/jvi.71.10.7345-7352.1997 [DOI] [PMC free article] [PubMed] [Google Scholar]
- Cai Z, Liang TJ, Luo G. 2004. Effects of mutations of the initiation nucleotides on hepatitis C virus RNA replication in the cell. J Virol 78: 3633–3643. 10.1128/JVI.78.7.3633-3643.2004 [DOI] [PMC free article] [PubMed] [Google Scholar]
- Cantero-Camacho A, Gallego J. 2015. The conserved 3′X terminal domain of hepatitis C virus genomic RNA forms a two-stem structure that promotes viral RNA dimerization. Nucleic Acids Res 43: 8529–8539. 10.1093/nar/gkv786 [DOI] [PMC free article] [PubMed] [Google Scholar]
- Cantero-Camacho A, Fan L, Wang YX, Gallego J. 2017. Three-dimensional structure of the 3′X-tail of hepatitis C virus RNA in monomeric and dimeric states. RNA 23: 1465–1476. 10.1261/rna.060632.117 [DOI] [PMC free article] [PubMed] [Google Scholar]
- Castillo-Martinez J, Fan L, Szewczyk MP, Wang YX, Gallego J. 2022. The low-resolution structural models of hepatitis C virus RNA subdomain 5BSL3.2 and its distal complex with domain 3′X point to conserved regulatory mechanisms within the Flaviviridae family. Nucleic Acids Res 50: 2287–2301. 10.1093/nar/gkac061 [DOI] [PMC free article] [PubMed] [Google Scholar]
- Chatterjee A, Smith PF, Perelson AS. 2013. Hepatitis C viral kinetics: the past, present, and future. Clin Liver Dis 17: 13–26. 10.1016/j.cld.2012.09.003 [DOI] [PMC free article] [PubMed] [Google Scholar]
- Cristofari G, Ivanyi-Nagy R, Gabus C, Boulant S, Lavergne JP, Penin F, Darlix JL. 2004. The hepatitis C virus core protein is a potent nucleic acid chaperone that directs dimerization of the viral (+) strand RNA in vitro. Nucleic Acids Res 32: 2623–2631. 10.1093/nar/gkh579 [DOI] [PMC free article] [PubMed] [Google Scholar]
- Förster T. 1948. Zwischenmolekulare Energiewanderung Und Fluoreszenz. Ann Phys 437: 55–75. 10.1002/andp.19484370105 [DOI] [Google Scholar]
- Friebe P, Bartenschlager R. 2002. Genetic analysis of sequences in the 3′ nontranslated region of hepatitis C virus that are important for RNA replication. J Virol 76: 5326–5338. 10.1128/JVI.76.11.5326-5338.2002 [DOI] [PMC free article] [PubMed] [Google Scholar]
- Friebe P, Boudet J, Simorre JP, Bartenschlager R. 2005. Kissing-loop interaction in the 3′ end of the hepatitis C virus genome essential for RNA replication. J Virol 79: 380–392. 10.1128/JVI.79.1.380-392.2005 [DOI] [PMC free article] [PubMed] [Google Scholar]
- Hoffmann A, Nettels D, Clark J, Borgia A, Radford SE, Clarke J, Schuler B. 2011. Quantifying heterogeneity and conformational dynamics from single molecule FRET of diffusing molecules: recurrence analysis of single particles (RASP). Phys Chem Chem Phys 13: 1857–1871. 10.1039/c0cp01911a [DOI] [PMC free article] [PubMed] [Google Scholar]
- Holmstrom ED, Holla A, Zheng W, Nettels D, Best RB, Schuler B. 2018. Accurate transfer efficiencies, distance distributions, and ensembles of unfolded and intrinsically disordered proteins from single-molecule FRET. Methods Enzymol 611: 287–325. 10.1016/bs.mie.2018.09.030 [DOI] [PMC free article] [PubMed] [Google Scholar]
- Ito T, Lai MM. 1997. Determination of the secondary structure of and cellular protein binding to the 3′-untranslated region of the hepatitis C virus RNA genome. J Virol 71: 8698–8706. 10.1128/jvi.71.11.8698-8706.1997 [DOI] [PMC free article] [PubMed] [Google Scholar]
- Ito T, Tahara SM, Lai MM. 1998. The 3′-untranslated region of hepatitis C virus RNA enhances translation from an internal ribosomal entry site. J Virol 72: 8789–8796. 10.1128/JVI.72.11.8789-8796.1998 [DOI] [PMC free article] [PubMed] [Google Scholar]
- Ivanyi-Nagy R, Kanevsky I, Gabus C, Lavergne JP, Ficheux D, Penin F, Fosse P, Darlix JL. 2006. Analysis of hepatitis C virus RNA dimerization and core-RNA interactions. Nucleic Acids Res 34: 2618–2633. 10.1093/nar/gkl240 [DOI] [PMC free article] [PubMed] [Google Scholar]
- Kalinin S, Peulen T, Sindbert S, Rothwell PJ, Berger S, Restle T, Goody RS, Gohlke H, Seidel CA. 2012. A toolkit and benchmark study for FRET-restrained high-precision structural modeling. Nat Methods 9: 1218–1225. 10.1038/nmeth.2222 [DOI] [PubMed] [Google Scholar]
- Kao CC, Yang X, Kline A, Wang QM, Barket D, Heinz BA. 2000. Template requirements for RNA synthesis by a recombinant hepatitis C virus RNA-dependent RNA polymerase. J Virol 74: 11121–11128. 10.1128/JVI.74.23.11121-11128.2000 [DOI] [PMC free article] [PubMed] [Google Scholar]
- Kapanidis AN, Lee NK, Laurence TA, Doose S, Margeat E, Weiss S. 2004. Fluorescence-aided molecule sorting: analysis of structure and interactions by alternating-laser excitation of single molecules. Proc Natl Acad Sci 101: 8936–8941. 10.1073/pnas.0401690101 [DOI] [PMC free article] [PubMed] [Google Scholar]
- Kato N. 2000. Genome of human hepatitis C virus (HCV): gene organization, sequence diversity, and variation. Microb Comp Genomics 5: 129–151. 10.1089/omi.1.2000.5.129 [DOI] [PubMed] [Google Scholar]
- Kolykhalov AA, Feinstone SM, Rice CM. 1996. Identification of a highly conserved sequence element at the 3′ terminus of hepatitis C virus genome RNA. J Virol 70: 3363–3371. 10.1128/jvi.70.6.3363-3371.1996 [DOI] [PMC free article] [PubMed] [Google Scholar]
- Kolykhalov AA, Agapov EV, Blight KJ, Mihalik K, Feinstone SM, Rice CM. 1997. Transmission of hepatitis C by intrahepatic inoculation with transcribed RNA. Science 277: 570–574. 10.1126/science.277.5325.570 [DOI] [PubMed] [Google Scholar]
- Kranawetter C, Brady S, Sun L, Schroeder M, Chen SJ, Heng X. 2017. Nuclear magnetic resonance study of RNA structures at the 3′-end of the hepatitis c virus genome. Biochemistry 56: 4972–4984. 10.1021/acs.biochem.7b00573 [DOI] [PMC free article] [PubMed] [Google Scholar]
- Kuraku S, Zmasek CM, Nishimura O, Katoh K. 2013. aLeaves facilitates on-demand exploration of metazoan gene family trees on MAFFT sequence alignment server with enhanced interactivity. Nucleic Acids Res 41: W22–W28. 10.1093/nar/gkt389 [DOI] [PMC free article] [PubMed] [Google Scholar]
- Lambert D, Draper DE. 2012. Denaturation of RNA secondary and tertiary structure by urea: simple unfolded state models and free energy parameters account for measured m-values. Biochemistry 51: 9014–9026. 10.1021/bi301103j [DOI] [PMC free article] [PubMed] [Google Scholar]
- Lohmann V, Körner F, Koch J, Herian U, Theilmann L, Bartenschlager R. 1999. Replication of subgenomic hepatitis C virus RNAs in a hepatoma cell line. Science 285: 110–113. 10.1126/science.285.5424.110 [DOI] [PubMed] [Google Scholar]
- Lukavsky PJ. 2009. Structure and function of HCV IRES domains. Virus Res 139: 166–171. 10.1016/j.virusres.2008.06.004 [DOI] [PMC free article] [PubMed] [Google Scholar]
- Masante C, Jaubert C, Palau W, Plissonneau J, Besnard L, Ventura M, Di Primo C. 2015. Mutations of the SL2 dimerization sequence of the hepatitis C genome abrogate viral replication. Cell Mol Life Sci 72: 3375–3385. 10.1007/s00018-015-1893-3 [DOI] [PMC free article] [PubMed] [Google Scholar]
- Popenda M, Szachniuk M, Antczak M, Purzycka KJ, Lukasiak P, Bartol N, Blazewicz J, Adamiak RW. 2012. Automated 3D structure composition for large RNAs. Nucleic Acids Res 40: e112. 10.1093/nar/gks339 [DOI] [PMC free article] [PubMed] [Google Scholar]
- Romero-López C, Berzal-Herranz A. 2009. A long-range RNA–RNA interaction between the 5′ and 3′ ends of the HCV genome. RNA 15: 1740–1752. 10.1261/rna.1680809 [DOI] [PMC free article] [PubMed] [Google Scholar]
- Romero-López C, Berzal-Herranz A. 2012. The functional RNA domain 5BSL3.2 within the NS5B coding sequence influences hepatitis C virus IRES-mediated translation. Cell Mol Life Sci 69: 103–113. 10.1007/s00018-011-0729-z [DOI] [PMC free article] [PubMed] [Google Scholar]
- Romero-López C, Barroso-Deljesus A, García-Sacristan A, Briones C, Berzal-Herranz A. 2014. End-to-end crosstalk within the hepatitis C virus genome mediates the conformational switch of the 3′X-tail region. Nucleic Acids Res 42: 567–582. 10.1093/nar/gkt841 [DOI] [PMC free article] [PubMed] [Google Scholar]
- Roy R, Hohng S, Ha T. 2008. A practical guide to single-molecule FRET. Nat Methods 5: 507–516. 10.1038/nmeth.1208 [DOI] [PMC free article] [PubMed] [Google Scholar]
- Shetty S, Kim S, Shimakami T, Lemon SM, Mihailescu MR. 2010. Hepatitis C virus genomic RNA dimerization is mediated via a kissing complex intermediate. RNA 16: 913–925. 10.1261/rna.1960410 [DOI] [PMC free article] [PubMed] [Google Scholar]
- Shetty S, Stefanovic S, Mihailescu MR. 2013. Hepatitis C virus RNA: molecular switches mediated by long-range RNA-RNA interactions? Nucleic Acids Res 41: 2526–2540. 10.1093/nar/gks1318 [DOI] [PMC free article] [PubMed] [Google Scholar]
- Simmonds P, Becher P, Bukh J, Gould EA, Meyers G, Monath T, Muerhoff S, Pletnev A, Rico-Hesse R, Smith DB, et al. 2017. ICTV virus taxonomy profile: flaviviridae. J Gen Virol 98: 2–3. 10.1099/jgv.0.000672 [DOI] [PMC free article] [PubMed] [Google Scholar]
- Solomatin S, Herschlag D. 2009. Methods of site-specific labeling of RNA with fluorescent dyes. Methods Enzymol 469: 47–68. 10.1016/S0076-6879(09)69003-0 [DOI] [PubMed] [Google Scholar]
- Tanaka T, Kato N, Cho MJ, Shimotohno K. 1995. A novel sequence found at the 3′ terminus of hepatitis C virus genome. Biochem Biophys Res Commun 215: 744–749. 10.1006/bbrc.1995.2526 [DOI] [PubMed] [Google Scholar]
- Triebel S, Lamkiewicz K, Ontiveros N, Sweeney B, Stadler PF, Petrov AI, Niepmann M, Marz M. 2023. Comprehensive survey of conserved RNA secondary structures in full-genome alignment of hepatitis C virus. bioRxiv 10.1101/2023.11.15.567179 [DOI] [PMC free article] [PubMed]
- Tsukiyama-Kohara K, Iizuka N, Kohara M, Nomoto A. 1992. Internal ribosome entry site within hepatitis C virus RNA. J Virol 66: 1476–1483. 10.1128/jvi.66.3.1476-1483.1992 [DOI] [PMC free article] [PubMed] [Google Scholar]
- Wakita T, Pietschmann T, Kato T, Date T, Miyamoto M, Zhao Z, Murthy K, Habermann A, Krausslich HG, Mizokami M, et al. 2005. Production of infectious hepatitis C virus in tissue culture from a cloned viral genome. Nat Med 11: 791–796. 10.1038/nm1268 [DOI] [PMC free article] [PubMed] [Google Scholar]
- Walter AE, Turner DH, Kim J, Lyttle MH, Müller P, Mathews DH, Zuker M. 1994. Coaxial stacking of helixes enhances binding of oligoribonucleotides and improves predictions of RNA folding. Proc Natl Acad Sci 91: 9218–9222. 10.1073/pnas.91.20.9218 [DOI] [PMC free article] [PubMed] [Google Scholar]
- Wan H, Adams RL, Lindenbach BD, Pyle AM. 2022. The in vivo and in vitro architecture of the hepatitis C virus RNA genome uncovers functional RNA secondary and tertiary structures. J Virol 96: e0194621. 10.1128/jvi.01946-21 [DOI] [PMC free article] [PubMed] [Google Scholar]
- Wang C, Sarnow P, Siddiqui A. 1993. Translation of human hepatitis C virus RNA in cultured cells is mediated by an internal ribosome-binding mechanism. J Virol 67: 3338–3344. 10.1128/jvi.67.6.3338-3344.1993 [DOI] [PMC free article] [PubMed] [Google Scholar]
- World Health Organization. 2021. Hepatitis C, Vol. 2022. WHO, Geneva. [Google Scholar]
- Yanagi M, St Claire M, Emerson SU, Purcell RH, Bukh J. 1999. In vivo analysis of the 3′ untranslated region of the hepatitis C virus after in vitro mutagenesis of an infectious cDNA clone. Proc Natl Acad Sci 96: 2291–2295. 10.1073/pnas.96.5.2291 [DOI] [PMC free article] [PubMed] [Google Scholar]
- Yi M, Lemon SM. 2003a. 3′ nontranslated RNA signals required for replication of hepatitis C virus RNA. J Virol 77: 3557–3568. 10.1128/JVI.77.6.3557-3568.2003 [DOI] [PMC free article] [PubMed] [Google Scholar]
- Yi M, Lemon SM. 2003b. Structure-function analysis of the 3′ stem–loop of hepatitis C virus genomic RNA and its role in viral RNA replication. RNA 9: 331–345. 10.1261/rna.2144203 [DOI] [PMC free article] [PubMed] [Google Scholar]
- You S, Rice CM. 2008. 3′ RNA elements in hepatitis C virus replication: kissing partners and long poly(U). J Virol 82: 184–195. 10.1128/JVI.01796-07 [DOI] [PMC free article] [PubMed] [Google Scholar]
- You S, Stump DD, Branch AD, Rice CM. 2004. A cis-acting replication element in the sequence encoding the NS5B RNA-dependent RNA polymerase is required for hepatitis C virus RNA replication. J Virol 78: 1352–1366. 10.1128/JVI.78.3.1352-1366.2004 [DOI] [PMC free article] [PubMed] [Google Scholar]
- Yu X, Qiao M, Atanasov I, Hu Z, Kato T, Liang TJ, Zhou ZH. 2007. Cryo-electron microscopy and three-dimensional reconstructions of hepatitis C virus particles. Virology 367: 126–134. 10.1016/j.virol.2007.05.038 [DOI] [PubMed] [Google Scholar]
- Zhong W, Uss AS, Ferrari E, Lau JY, Hong Z. 2000. De novo initiation of RNA synthesis by hepatitis C virus nonstructural protein 5B polymerase. J Virol 74: 2017–2022. 10.1128/JVI.74.4.2017-2022.2000 [DOI] [PMC free article] [PubMed] [Google Scholar]
- Zuber J, Mathews DH. 2019. Estimating uncertainty in predicted folding free energy changes of RNA secondary structures. RNA 25: 747–754. 10.1261/rna.069203.118 [DOI] [PMC free article] [PubMed] [Google Scholar]