Abstract
Cancer is highly infiltrated by myeloid-derived suppressor cells (MDSCs). Currently available immunotherapies do not completely eradicate MDSCs. Through a genome-wide analysis of the translatome of prostate cancers driven by different genetic alterations, we demonstrate that prostate cancer rewires its secretome at the translational level to recruit MDSCs. Among different secreted proteins released by prostate tumor cells, we identified Hgf, Spp1, and Bgn as the key factors that regulate MDSCs migration. Mechanistically, we found that the coordinated loss of Pdcd4 and activation of the MNK/eIF4E pathways regulate the mRNAs translation of Hgf, Spp1 and Bgn. MDSCs infiltration and tumor growth were dampened in prostate cancer treated with the MNK1/2 inhibitor eFT508 and/or the AKT inhibitor Ipatasertib, either alone or in combination with a clinically available MDSC targeting immunotherapy. This work provides a therapeutic strategy that combines translation inhibition with available immunotherapies to restore immune surveillance in prostate cancer.
Introduction
Prostate cancer is the second most commonly occurring cancer in men and the fourth most commonly occurring cancer overall. While immune checkpoint inhibitors therapies are effective in several tumors, patients with prostate cancer do not respond to this treatment1. Indeed, the tumor microenvironment of prostate cancers is characterized by an increased number of myeloid-derived suppressor cells (MDSCs) and tumor-associated macrophages (TAMs) that dampen T and NK cells activation2,3. MDSCs are the predominant immune cell subset infiltrating prostate cancer with previous findings demonstrating that these cells lead to: 1) immunosuppression4; 2) evasion of chemotherapy-induced senescence5, and 3) onset of castration-resistance prostate cancer (CRPC)6. A direct relationship between tumor burden and MDSC frequency has been demonstrated in clinical studies, and an inverse correlation between MDSCs and circulating T cell counts has been described as a negative prognostic factor in patients affected by different tumors, including prostate cancer7–15. Previous findings from additional research teams and us have identified IL8 and its cognate receptor CXCR2 as the key mediators of MDSCs recruitment in prostate tumors16–18. Ongoing clinical trials based on the CXCR2 antagonist AZD506919, or anti-IL8 antibody treatment, are under clinical evaluation in both hormone sensitive (HS) and CRPC patients (Clinical Trial NCT03177187, NCT03689699). Nonetheless, preclinical studies showed that these compounds only partially affect the recruitment of MDSCs in vivo, and that prolonged administration of CXCR2 antagonists ultimately leads to treatment resistance5,20. Thus, identifying mechanisms by which tumor cells recruit MDSCs could lead to the discovery of clinically relevant therapeutic targets.
Tumor cells rely on great demand for protein synthesis to grow, invade the surrounding tissues, and control the tumor secretome21,22. PTEN is one of the most altered tumor suppressor genes in human prostate cancer23–25. Preclinical studies have demonstrated that loss of PTEN leads to PI3K/AKT/mTOR activation, thereby promoting increased protein synthesis, a cause of tumor initiation and progression26. In cancer cells, translation is regulated by the AKT/mTOR and MNK pathways27. Both pathways control the function of eIF4E, a key member of the eIF4F complex, which binds to the 7-methylguanylate cap at the 5′ end of mRNA and sustains protein synthesis28. 4EBP1 phosphorylation increases the availability of eIF4E in the eIF4F complex whereas MNK1/2 kinase promotes eIF4E phosphorylation29–34. AKT also regulates the formation of the eIF4F complex through PDCD4, a protein that binds and sequesters eIF4A35 36 37. Thus, eIF4F is a central hub for protein synthesis and both the PI3K/AKT/mTOR and the MNK pathways converge to eIF4F to regulate protein synthesis. Here, using polysome profiling and bioinformatic analyses, we have characterized the extracellular interactome of Pten deficient prostate cancers to assess the mechanisms by which prostate tumor cells recruit and activate MDSCs. We report the identification of Hepatocyte growth factor (HGF), Osteopontin (SPP1) and Biglycan (BGN) as three translationally regulated key players in the interaction between prostate cancer cells and MDSCs. Previous studies using classical transcriptomic analysis did not identify these factors concomitantly in the secretome of prostate cancer38. Indeed transcriptomic analysis does not entirely reflect the proteome of cancer cells39, whereas polysome profiling phenocopies more faithfully changes at the proteome level40, especially downstream of oncogenic signaling activated in cancer41. Mechanistically, we show that loss of PDCD4 and phosphorylation of eIF4E in prostate tumor cells allow eIF4F to translate Hgf, Spp1 and Bgn, promoting the intratumoral recruitment of MDSCs. Therapeutically, we report that clinically available inhibitors of translation function as potent immunotherapies that block MDSCs recruitment and activation, thereby enhancing tumor immune surveillance in prostate cancer.
Results
The extracellular interactome between prostate cancer and MDSCs
Prostate tumors of different disease aggressiveness, benign (Ptenpc−/−), invasive (Ptenpc−/−;TMPRSS2-Ergpc+/+ 42, Ptenpc−/−;Trp53pc−/− 43) and metastatic (Ptenpc−/−;CDCP1pc+/+ 44, Ptenpc−/−;Timp1−/−45) were resected from mice of five different genetic backgrounds, between 20 and 25 weeks of age. FACS analysis was performed to characterize the immune landscape of these prostate tumors. In line with previous data5,6, we found that polymorphonuclear myeloid-derived suppressors cells (PMN-MDSCs; CD45+/CD11b+/Ly6Ghigh/Ly6Clow) cover the higher percentage among the tumor-infiltrating immune cell subsets analyzed, and the percentage of these cells increased with disease aggressiveness whereas CD45+/CD11b+/Ly6Gneg/Ly6Chigh (M-MDSCs) are a minority (Fig. 1a). To identify tumor-specific factors responsible for PMN-MDSCs recruitment, we performed a genome-wide analysis of the translatome in these tumors by polysome profiling analysis and RNA-seq (Fig. 1b). Contrary to transcriptomic analysis, polysome profiling allows identifying actively translated ribosome-bound mRNAs in cancers, a measure of protein abundance46,47. Three prostates for each genetic background for a total of 18 samples were used for the polysome profiling. Principal component analysis (PCA) of normal and prostate tumor samples demonstrated good reproducibility of the samples in the different genetic backgrounds and between total and polysomal RNA pools (Extended Data Fig 1a–c). The scatter plots summarizing the translational changes obtained by the polysome profiling in the different genetic backgrounds are shown in Extended Data Fig 1d. Bioinformatic analysis showed that most of the translated mRNAs in prostate tumors carry long 5’UTR and have increased folding energy, which requires the helicase activity of eIF4A to be efficiently translated48,49 (Fig. 1c). In addition, Gene Ontology (GO) analysis revealed that these upregulated mRNAs were involved in biological processes regulating myeloid/leukocytes migration and response to cytokines (Fig. 1d; polysomal RNA and total RNA GO biological processes: Extended Data Fig. 2a and b). To identify the key interactors responsible for the recruitment and activation of MDSCs, we applied a bioinformatic algorithm to identify secreted and membrane-tethering factors upregulated (Log2 fold change>1; FDR < 0.05) in prostate cancer with a corresponding receptor upregulated (Log2 fold change>1; FDR < 0.05) in the tumor and present on the plasma membrane of MDSCs (Extended Data Fig. 2c). By matching the ligands with the receptors, we identified 13 ligand-receptor couples overexpressed in the tumors with a cognate receptor expressed in MDSCs (Fig. 1e). Among these couples, we found CXCL5, a ligand of the CXCR2 receptor expressed on MDSCs, a known recruiter of these immune cells, thereby demonstrating the reliability of this analysis (Fig. 2a and Supplementary Table 1 and 2). Finally, we determined the translational efficiency of the differentially expressed 13 targets (ratio between polysomal mRNA and total mRNA expression) to identify factors enriched in ribosome-bound mRNAs (Fig. 2a).
Fig. 1. Genome-wide analysis of the translatome is exploited to identify the extracellular interactome of prostate cancer - PMN-MDSCs.
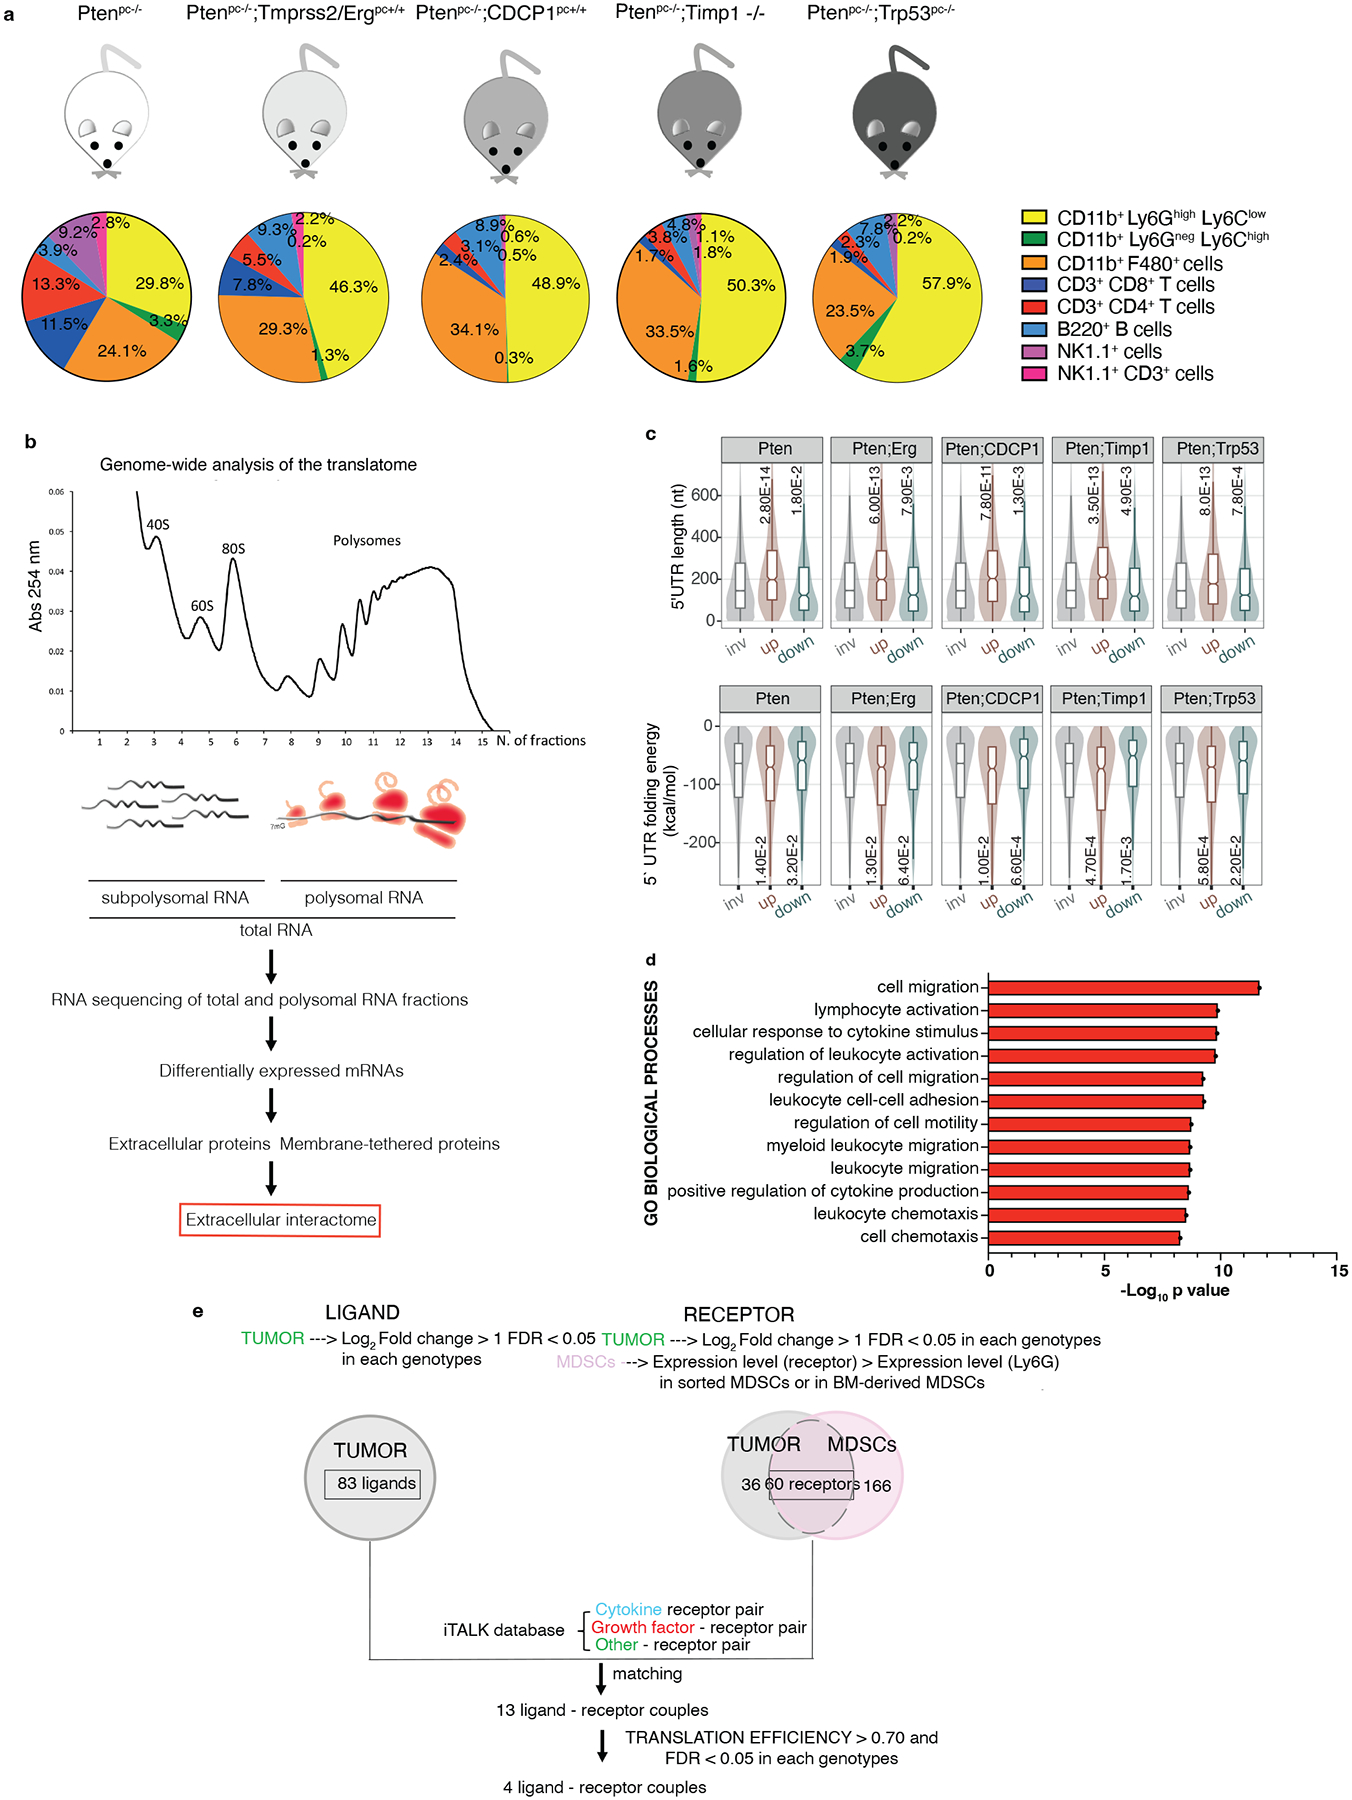
a, Immunophenotype of Ptenpc−/− (n = 4), Ptenpc−/−;TMPRSS2/Erg pc+/+ (at least n = 3), Ptenpc−/−;CDCP1pc+/+ (at least n = 2), Ptenpc−/−;Timp1−/− (n = 3) and Ptenpc−/−;Trp53pc−/− (n = 5) prostate cancers. b, Scheme of the polysome profiling analysis. c, Features of the 5’ UTRs of the translationally regulated mRNAs: 5’ UTR estimated length (top) and folding energy comparison (bottom). The mRNAs with an increased translation efficiency (TE) and the mRNAs with a decreased TE (down) were compared to mRNAs with a not significantly changed TE (inv) for each indicated genetic background (n = 3 mice) compared to wild-ty prostates (n = 3 mice). Definition of box whisker plots: center: median of the distribution; box: between lower and upper quartile; whisker: 1.5 interquartile range; outliers not displayed. Statistical test: Wilcoxon Rank Sum Test (two-sided). d, Gene Ontology Biological processes enriched among the translationally upregulated mRNAs in Ptenpc−/−, Ptenpc−/−;TMPRSS2/Ergpc+/+; Ptenpc−/−;CDCP1pc+/+, Ptenpc−/−;Timp1−/− and Ptenpc−/−;Trp53pc−/− prostate cancer compared to wild-type prostate, determined by the DAVID software. (n = 3 mice for each genetic background for a total of 18 samples). Log10 adjusted p-values by using the linear step-up method of Benjamini are reported. e, Bioinformatic algorithm applied to identify the extracellular interactome of prostate cancer - PMN-MDSCs.
Fig. 2. HGF, SPP1 and BGN are the most expressed, translationally regulated secreted factors in Pten null-driven prostate cancer.
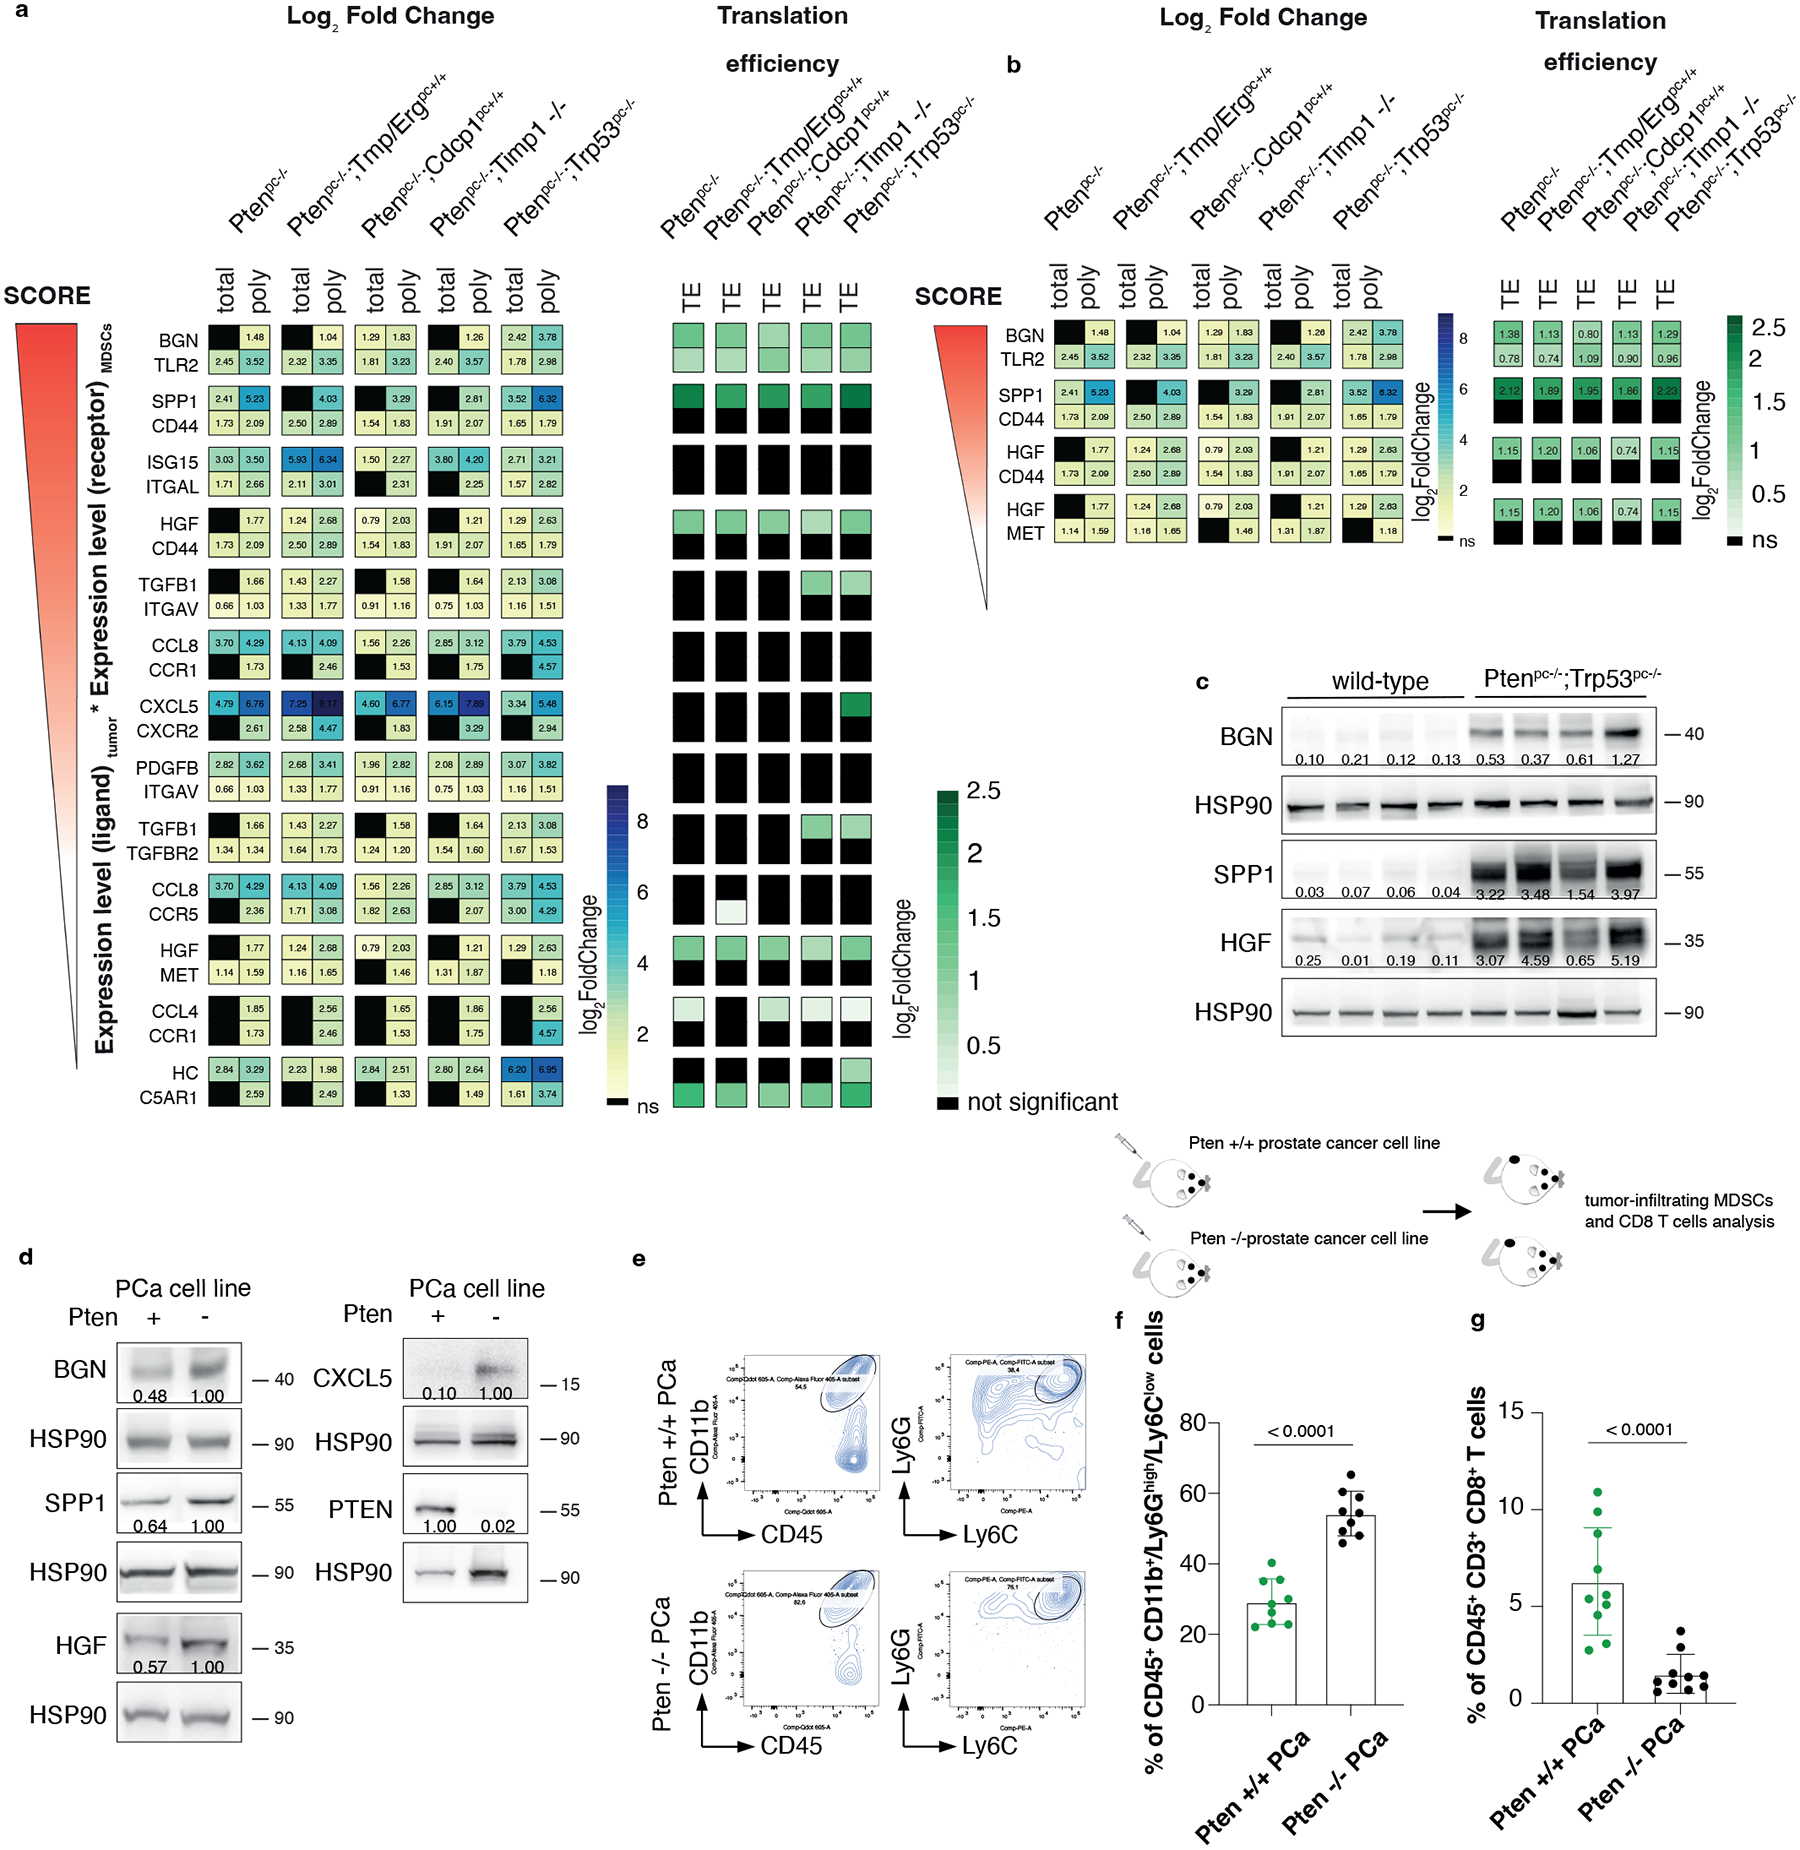
a, List of ligand-receptor couples upregulated in the indicated genetic backgrounds of prostate cancer: on the left, the Log2 Fold change of polysome-bound RNA (poly) and total RNA (total) expression (threshold fold change >1; threshold significant FDR < 0.05) and, on the right, the Log2 Fold change Translation efficiency (TE) (threshold fold change >0.70; threshold significant FDR < 0.05) (n = 3 for each genetic background for a total of 18 samples). See also Supplementary Table 1 for the Fold change of total RNA and polysomal RNA. b, Translationally regulated ligand-receptor pairs upregulated in the indicated genetic backgrounds of prostate cancer (threshold fold change >0.70; threshold significant FDR < 0.05) (n = 3 for each genetic background for a total of 18 samples). Log2 Fold change is indicated in the heatmap. See Supplementary Table 2 for the Fold change of the translation efficiency. c, Western blot showing the levels of HGF, SPP1 and BGN in wild-type prostates and Ptenpc−/−;Trp53pc−/−prostate cancers. The experiment was performed once with n = 4 mice for each group. Densitometry values normalized to the respective loading control are indicated for each band. d, Western blot showing the levels of HGF, SPP1, BGN, CXCL5 and PTEN in Pten wild-type or Pten-sh TC1 cell line. Densitometry values normalized to the respective loading control are indicated for each band. The experiment was repeated three independent times with similar results. e, Scheme of the experiment of Pten wild-type or Pten-sh TC1 prostate cancer cell injection (top), representative FACS plots of the CD45+/CD11b+ population and Ly6Ghigh/Ly6Clow cells inside the CD45+/CD11b+ population (bottom left). f. Percentage of CD45+/CD11b+/Ly6Ghigh/Ly6Clow cells inside the CD45+ population in Pten wild-type and Pten-sh TC1 allograft tumors. (n = 9 mice in each group) Statistical analysis: (unpaired two-sided Student’s t-test). g. Percentage of CD45+/CD3+/CD8+ cells inside the CD45+ population in Pten wild-type and Pten-sh TC1 allograft tumors. (n = 10 mice in each group). Statistical analysis: (Mann-Whitney test).
HGF, SPP1 and BGN recruit MDSCs in prostate cancer
Among the most translationally upregulated ligands identified, we found HGF, SPP1 and BGN (Fig. 2b and 2c; Supplementary Table 1 and 2), secreted factors previously known as regulators of extracellular matrix remodeling and epithelial-to-mesenchymal transition50–52. Ribosome profiling also detected an increased ribosome occupancy of Hgf, Spp1 and Bgn mRNAs in Ptenpc−/− tumors compared to wild-type prostates (Extended Data Fig. 3a). Finally, western blot analysis showed that HGF, SPP1 and BGN were more upregulated at protein levels in aggressive (Ptenpc−/−;TrpP53pc−/−) than benign prostate tumors correlating with increased infiltration of PMN-MDSCs (Extended Data Fig. 3b–d). Inhibition of Pten by mean of a Pten sh-RNA (Pten sh-TC1) in TRAMP-C1 prostate tumor cells resulted in increased tumor cell production of HGF, SPP1 and BGN. This increase was associated with enhanced recruitment of PMN-MDSCs and decreased CD8+ T cells infiltration compared to TRAMP-C1 control cells (Fig. 2d–g).
HGF, SPP1 and BGN were mainly expressed by epithelial tumor cells and by the stroma (Extended Data Fig. 4a), whereas the corresponding receptors TLR2, CD44 and MET were predominantly expressed by tumor-infiltrating myeloid cells, as detected by FACS analysis (Extended Data Fig. 4b–c). Notably, in human prostate tumor samples, we found a direct correlation between TLR2, CD44 and MET, and a previously published PMN-MDSCs signature composed of 50 genes4, both in primary tumors and CRPCs53 (Extended Data Fig. 4d). We next assessed whether HGF, SPP1 and BGN could promote the recruitment of MDSCs by performing an in vitro migration assay. We found that recombinant HGF, SPP1 and BGN were capable of driving the migration of MDSCs, similarly to CXCL5 (Fig. 3a). Moreover, MDSCs migration was enhanced when these three factors were administered in combination and in addition to CXCL5 (Fig. 3a). In line with these findings, inhibition of TLR2, CD44 and MET by treatment of MDSCs with three blocking antibodies arrested MDSCs migration toward conditioned media derived from prostate tumor cells (PCa c.m.) in vitro. This effect was more pronounced when the three antibodies were used in combination and in addition to the CXCR2 antagonist AZD5069 (Fig. 3b and Extended Data Fig. 4e). Finally, MDSCs exposed to HGF, SPP1 and BGN showed increased T suppressive functions in vitro and increased Arg1, Nos2 and Vsir mRNA levels, thereby demonstrating that these factors are not only involved in the recruitment of MDSCs but also regulate their function (Fig. 3c and Extended Data Fig. 4f).
Fig. 3. HGF, SPP1 and BGN induce PMN-MDSCs migration and T cell suppressive function.
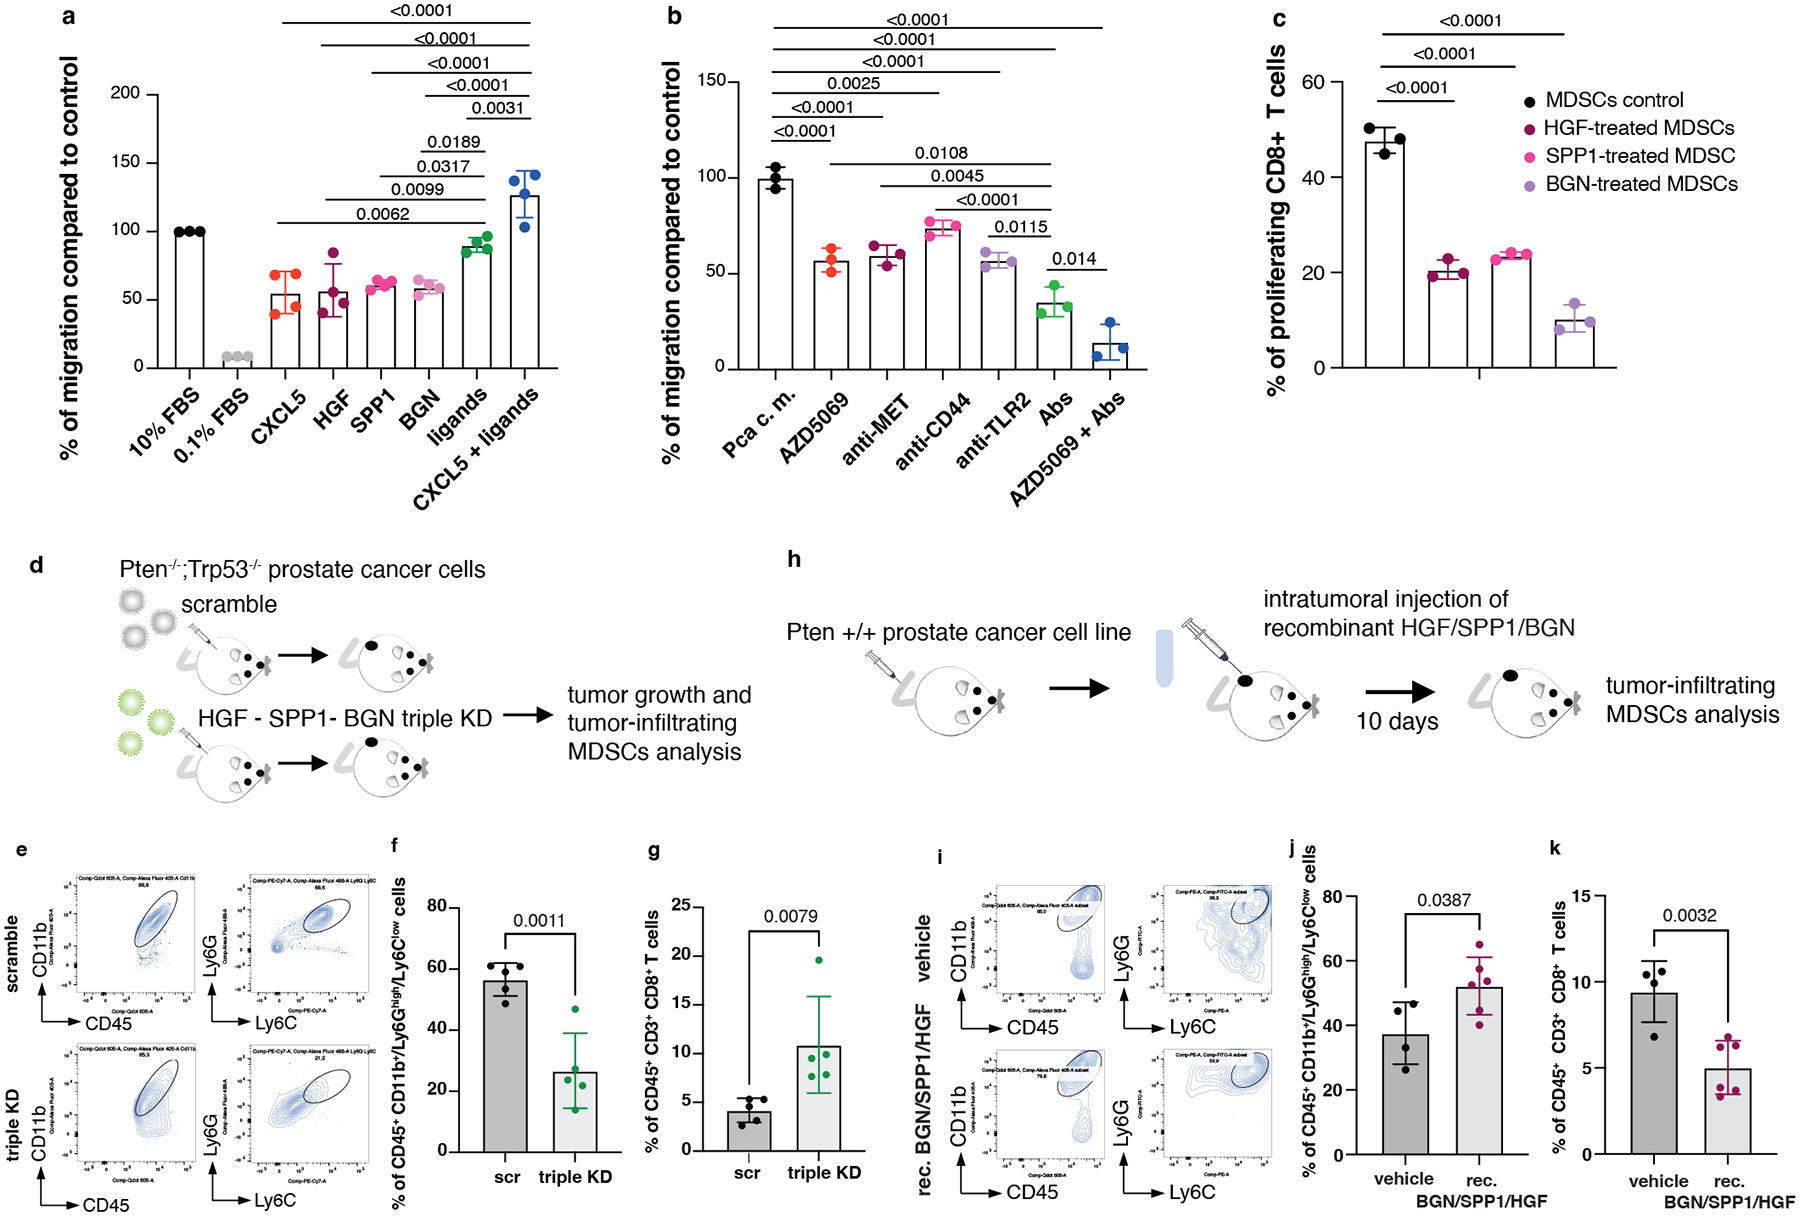
a, Transwell migration assay with bone marrow-derived MDSCs tested for the capability to migrate toward RPMI medium supplemented with the indicated secreted factors. Ligands: HGF+SPP1+BGN. n = 4 biological replicates. The experiment was repeated two independent times with similar results. b, Transwell migration assay with bone marrow-derived MDSCs tested in the presence of blocking antibodies for MET, CD44 and TLR2 with or without CXCR2 antagonist AZD5069, toward PCa conditioned medium derived from Pten−/−;Trp53−/− (RapidCap) prostate cancer cells. Abs: anti-MET+anti-CD44+anti-TLR2. n = 3 biological replicates. The experiment was repeated two independent times with similar results. c, Flow cytometric analysis of T cell suppression assay, analyzed as CFSE dilution, of splenocytes co-cultured with bone marrow-derived MDSCs; MDSCs were incubated for 24 hours with the indicated secreted factors before performing the experiment. n = 3 biological replicates. The experiment was repeated two independent times with similar results. d, Scheme of the experiment of Hgf, Spp1 and Bgn shRNAs in Pten−/−;Trp53−/− (RapidCap) cells. e, Representative FACS plots of CD45+/CD11b+ population and Ly6Ghigh/Ly6Clow cells inside the CD45+/CD11b+ population in scramble and triple KD in Pten−/−;Trp53−/− (RapidCap) allografts. f, Percentage of CD45+/CD11b+/Ly6Ghigh/Ly6Clow cells (PMN-MDSCs) inside the CD45+ population in Pten−/−;Trp53−/− (RapidCap) allografts tumors (n = 5 mice in each group). g, Percentage of CD45+/CD3+/CD8+ cells inside the CD45+ population in Pten−/−;Trp53−/− (RapidCap) allografts tumors (n = 5 mice in each group). h, Scheme of the experiment of rec. BGN/SPP1/HGF-treated Pten wild-type TC1 allografts (10 days treatment). i, Representative FACS plots of CD45+/CD11b+ population and Ly6Ghigh/Ly6Clow cells (PMN-MDSCs) inside the CD45+/CD11b+ population in vehicle-treated or rec. BGN/SPP1/HGF treated Pten wild-type TC1 allografts. j, Percentage of CD45+/CD11b+/Ly6Ghigh/Ly6Clow cells (PMN-MDSCs) inside the CD45+ population in rec. BGN/SPP1/HGF-treated Pten wild-type TC1 allografts for 10 days. (vehicle n = 4 mice; recombinant BGN/SPP1/HGF n = 6 mice). k, Percentage of CD45+/CD3+/CD8+ cells inside the CD45+ population in rec. BGN/SPP1/HGF-treated Pten wild-type TC1 allografts (n = 4 vehicle; n = 6 recombinant proteins-treated mice). Statistical analysis in (a-c) between all groups (ordinary one-way ANOVA followed by Tukey’s multiple comparisons test.). Statistical analysis in (f) and (j-k) (unpaired two-sided Student’s t-test). Statistical analysis in (g): (Mann Whitney test). Data are mean ± SD in (a-c), (f-g) and (j-k).
To address the relevance of HGF, SPP1 and BGN in mediating MDSCs recruitment, we generated a triple Hgf, Spp1 and Bgn knock down (triple KD) Pten−/−; Trp53−/− cell line using different shRNAs. We did not observe differences in cell growth in vitro between scramble and the triple KD tumor cells even though these cells produce high levels of the ligands (Extended Data Fig. 4g–h). However, when these cells were injected in vivo we found a significant difference in the growth of the triple KD tumor cells than the scramble sh (Fig. 3d and Extended Data Fig. 4i). This was associated with a decreased recruitment of PMN-MDSCs (Fig. 3e–f) and increased tumor-infiltrating CD8+ T cells (Fig. 3g and Extended Data Fig. 4j). Together, these experiments demonstrate that HGF, SPP1 and BGN affect prostate cancer cells proliferation by altering the tumor microenvironment.
We next assessed whether enhanced levels of HGF, SPP1 and BGN in the prostate tumor microenvironment could result in increased recruitment of MDSCs also in vivo (Fig. 3 h). Intratumoral injection of recombinant HGF, SPP1 and BGN proteins into TRAMP-C1 allograft tumors increased PMN-MDSCs infiltration, promoting an immunosuppressive tumor microenvironment (Fig. 3 i–k and Extended Data Fig. 4k). In sum, these data suggest that HGF, SPP1 and BGN can directly recruit MDSCs in vivo and loss of Pten in prostate tumor cells enhances the levels of these factors, leading to increased tumor infiltration of MDSCs.
PDCD4 and phospho-eIF4E control Hgf, Spp1 and Bgn translation
To characterize the mechanism by which prostate tumor cells control MDSCs recruitment, we analyzed different targets involved in the translation machinery of tumor cells by performing western blot analysis in Ptenpc−/−;Trp53pc−/− prostate tumors. In Pten null tumors, we found hyperactivation of the AKT/mTOR signaling as demonstrated by increased levels of pAkt, pS6 and p4EBP1 and increased phosphorylation of both MNK1 and eIF4E in line with previous data29. Moreover, we found downregulation of Programmed Cell Death 4 (PDCD4) at both mRNA and protein levels (Fig. 4a–b; Extended Data Fig. 5a–b). PDCD4 is a protein that binds and sequesters eIF4A, limiting the formation of the eIF4F complex. Previous evidence demonstrates that eIF4A is required to unwind high folding energy mRNAs48. Downregulation of Pten in TRAMP-C1 cells by mean of a Pten-sh (Pten-sh TC1) resulted in decreased levels of PDCD4 when compared to control cells (scramble-sh TC1) (Extended Data Fig. 5c, top panel). Cap pull-down assays in scramble-sh TC1 and Pten-sh TC1 cells showed increased binding of eIF4A to the eIF4F complex. On the contrary, overexpression of PDCD4 in Pten-sh TC1 reduced the binding of eIF4A to the complex (Extended Data Fig. 5c, bottom panel). Thus, in Pten-null tumors, the lack of PDCD4 increases the availability of eIF4A for the eIF4F complex formation.
Fig. 4. PDCD4 and phospho-eIF4E control the translation of Hgf, Spp1 and Bgn.
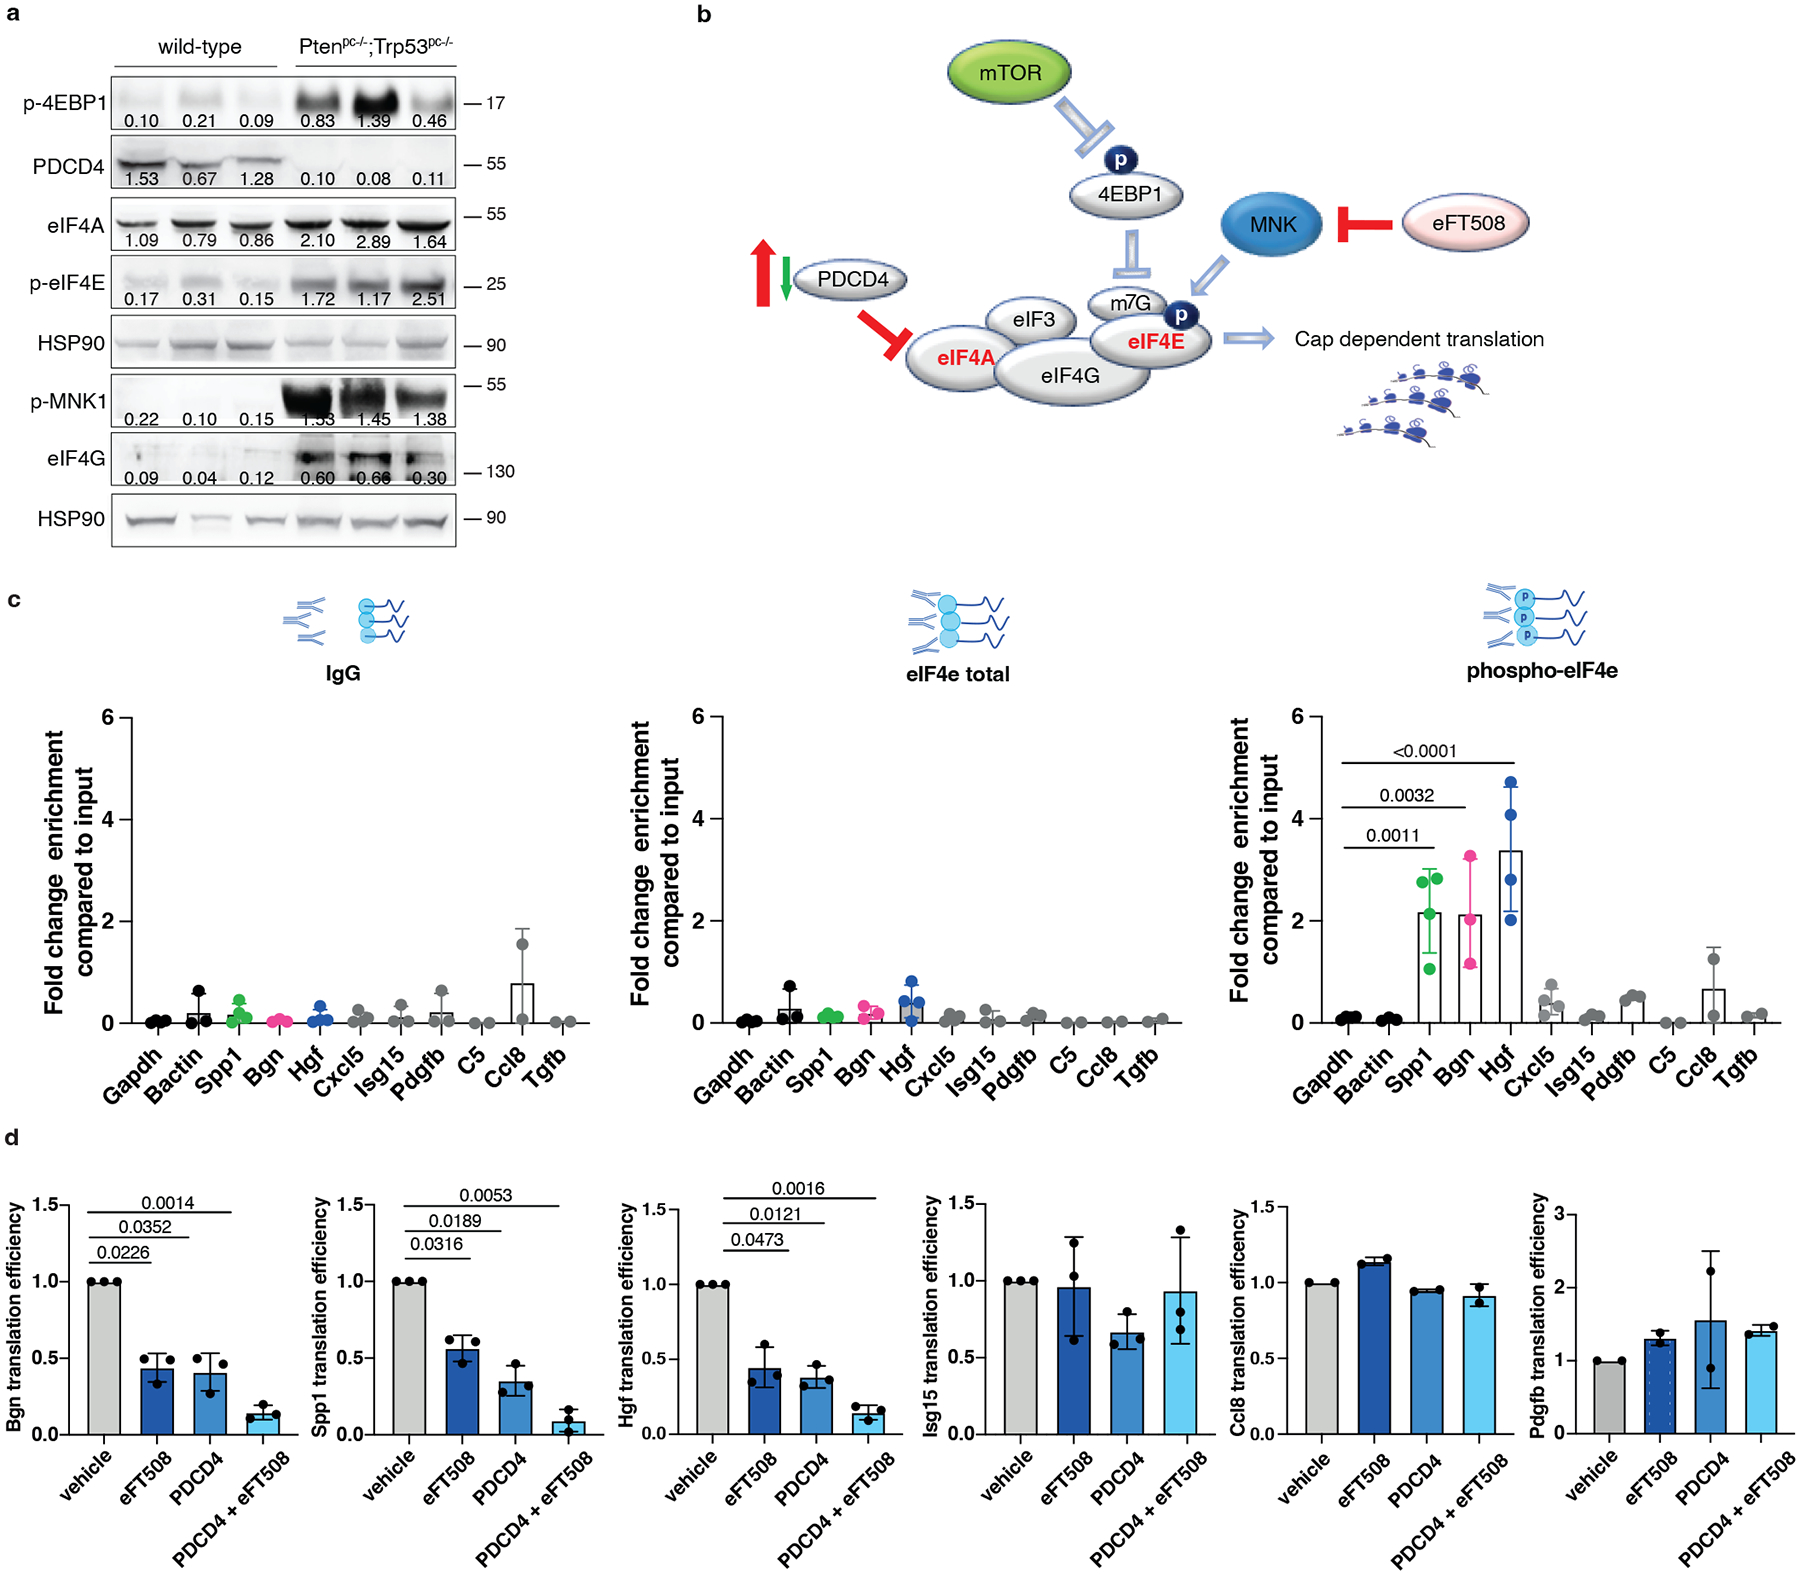
a, Western blot showing the levels of p-4EBP1, PDCD4, eIF4A, p-MNK, p-eIF4E, eIF4G and representative HSP90 in Ptenpc−/−;Trp53pc−/−prostate cancers compared to wild-type prostates. Densitometry values normalized to the respective loading control are indicated for each band. The experiment was performed once with n = 3 mice for each group. b, Model depicting the proposed mechanism by which PDCD4 loss and phosho-eIF4E cooperate to regulate translation and modulate the tumor microenvironment. c, Fold change enrichment for the indicated mRNAs in Pten-sh TC1 determined by RNA immunoprecipitation using, from right to left, control anti-IgG, total eIF4E antibody or phospho-eIF4E antibody, followed by qRT- PCR performed (at least n = 2 independent experiments). Data are mean ± SD. Statistical analysis between all groups (ordinary one-way ANOVA followed by Dunnett’s multiple comparisons test). d, Translation efficiency (polysomal mRNA expression/total mRNA expression) of Hgf, Spp1, Bgn, Isg15, Ccl8 and Pdgfb upon 500 nM eFT508 treatment and Pdcd4 rescue in Pten-sh TC1 prostate cancer cell line, determined by qRT- PCR (at least n = 2 independent experiments). Data are mean ± SD. Statistical analysis between all groups: (RM one-way ANOVA followed by Tukey’s multiple comparisons test).
We next performed RNA immunoprecipitation for eIF4E and phospho-eIF4E in Pten-sh TC1 prostate cancer cells to assess whether phospho-eIF4E specifically increased the affinity for Hgf, Spp1 and Bgn mRNAs. Indeed, although eIF4E is a general initiation factor, an increase in its activity only marginally affects global protein synthesis but strongly stimulates the translation of a subset of mRNAs referred to as ‘phospho-eIF4E sensitive’22. We found significant and specific enrichment of the mRNAs encoding for Hgf, Spp1 and Bgn in the RNA pool obtained by the immunoprecipitation of phospho-eIF4E compared to total eIF4E. Additional secreted factors identified in our previous analysis (Fig. 2a) were not bound to phospho-eIF4E, indicating the specificity of phospho-eIF4E for the translation of Hgf, Spp1 and Bgn (Fig. 4c; Extended Data Fig. 5d).
To further corroborate these data, Pten-sh TC1 prostate cancer cells were treated with eFT508, a potent and selective MNK1/2 inhibitor54, tested in clinical trial for prostate (NCT03690141), breast (NCT04261218) and lung (NCT04622007) cancers. eFT508 treatment decreased the levels of phospho-eIF4E both in mouse and human prostate cancer cells in a dose-dependent manner. This effect was associated with decreased HGF, SPP1 and BGN protein levels (Extended Data Fig. 5e), validating the results obtained with the phospho-eIF4E immunoprecipitation. We next assessed whether Pdcd4 loss could cooperate with phospho-eIF4E to promote the translation of Hgf, Spp1 and Bgn by performing a Pdcd4 rescue experiment in Pten-sh TC1 cells. Polysome profiling and western blot analysis demonstrated that treatment with eFT508 inhibited translation of Hgf, Spp1 and Bgn to a similar extent to Pdcd4 rescue. However, by combining inhibition of eIF4E phosphorylation with Pdcd4 rescue, the levels of Hgf, Spp1 and Bgn were further decreased compared to controls (Fig. 4d, Extended Data Fig. 5f and Extended Data Fig. 5 g–h for the qRT-PCR analysis on the single fractions derived from the polysome profiles). These data were further validated in human PC3 cell lines that carry biallelic PTEN deletions by polysome profiling analysis (Extended Data Fig. 5i–j).
PDCD4 downregulated HGF, SPP1 and BGN protein levels without affecting cell growth in vitro (Extended Data Fig. 6a). Importantly, Pdcd4 rescue, specifically in Pten−/−;TrpP53−/− prostate cancer cells, leads to reduced tumor growth in vivo (Extended Data Fig. 6b), inhibition of HGF, SPP1 and BGN protein levels (Extended Data Fig. 6c) and decreased PMN-MDSCs infiltration (Extended Data Fig. 6d–f). Interestingly, in human prostate cancer, we found that PDCD4 mRNA levels correlate with poor disease-free survival (Extended Data Fig. 6g). Moreover, PTEN deletions were significantly associated with decreased PDCD4 mRNA levels (Extended Data Fig. 6h). Taken together, these findings demonstrate that eIF4E phosphorylation and Pdcd4 loss cooperate to regulate the translation of Hgf, Spp1 and Bgn in prostate cancer.
eFT508 blocks PMN-MDSCs in Ptenpc−/−;Trp53pc−/− prostate tumors
We next investigated whether treatment with eFT508 could promote inhibition of PMN-MDSCs recruitment in vivo (Fig. 5a). Ptenpc−/−;Trp53pc−/− mice were treated with the MNK1/2 inhibitor eFT508 at standard dosage (10 mg/Kg) for six weeks before being sacrificed. Histopathological analysis showed that eFT508 inhibited prostate cancer growth (Fig. 5b–d). Polysome profiling and western blot analyses confirmed that Hgf, Spp1 and Bgn mRNA levels were decreased (Fig. 5e–f; Extended Data Fig. 7a–b). In parallel, IHC and FACS analysis showed that PMN-MDSCs infiltration in prostate tumors was decreased upon eFT508 treatment (Fig. 5b and 5g). Of note, the percentage of CD8+ T cells increased upon eFT508 treatment compared to the vehicle (Fig. 5h). This effect was associated with increased tumor mRNA levels of the T cell cytotoxic markers IFN-γ, granzyme B, perforin, and decreased Foxp3 expression (Extended Data Fig. 7c). In line with these findings, MDSCs cultured in vitro with c.m. from prostate tumor cells treated with eFT508 showed an impaired migration and decreased capability to suppress T cell proliferation than MDSCs treated with control c.m (Fig. 5i; Extended Data Fig. 7d–e). Of note, while treatment with eFT508 in Pten−/−; Trp53−/− allografts mice efficiently decreased PMN-MDSCs infiltration and increased T cells activity, it did not promote tumor suppression in mice co-treated with an anti-CD8 antibody (Fig 5j; Extended Data Fig. 8a). In addition, anti-Ly6G treatment in the same mice decreased tumor growth and increased T cells infiltration to a similar extent to eFT508 (Fig. 5j–l; Extended Data Fig. 8b). However, eFT508 and anti-Ly6G co-treatment did not further reduce prostate tumor growth (Fig. 5j), thereby demonstrating that in these tumors, the activation of T cells associated to eFT508 (Extended Data Fig. 8c) is controlled by MDSCs. Of note, treatment with eFT508 did not affect the proliferation of prostate tumor cells when this compound was administered in vitro (Extended Data Fig. 8d). In sum, these findings suggest that the anti-tumor effect observed in vivo in mice treated with eFT508 depends on the modulation of the tumor immune response. Inhibition of MDSCs mediated by eFT508 increases T cells recruitment and activation in prostate cancer, thereby promoting tumor inhibition.
Fig. 5. eFT508 treatment inhibits tumor growth and PMN-MDSCs infiltration in Ptenpc−/−; Trp53pc−/− prostate cancer.
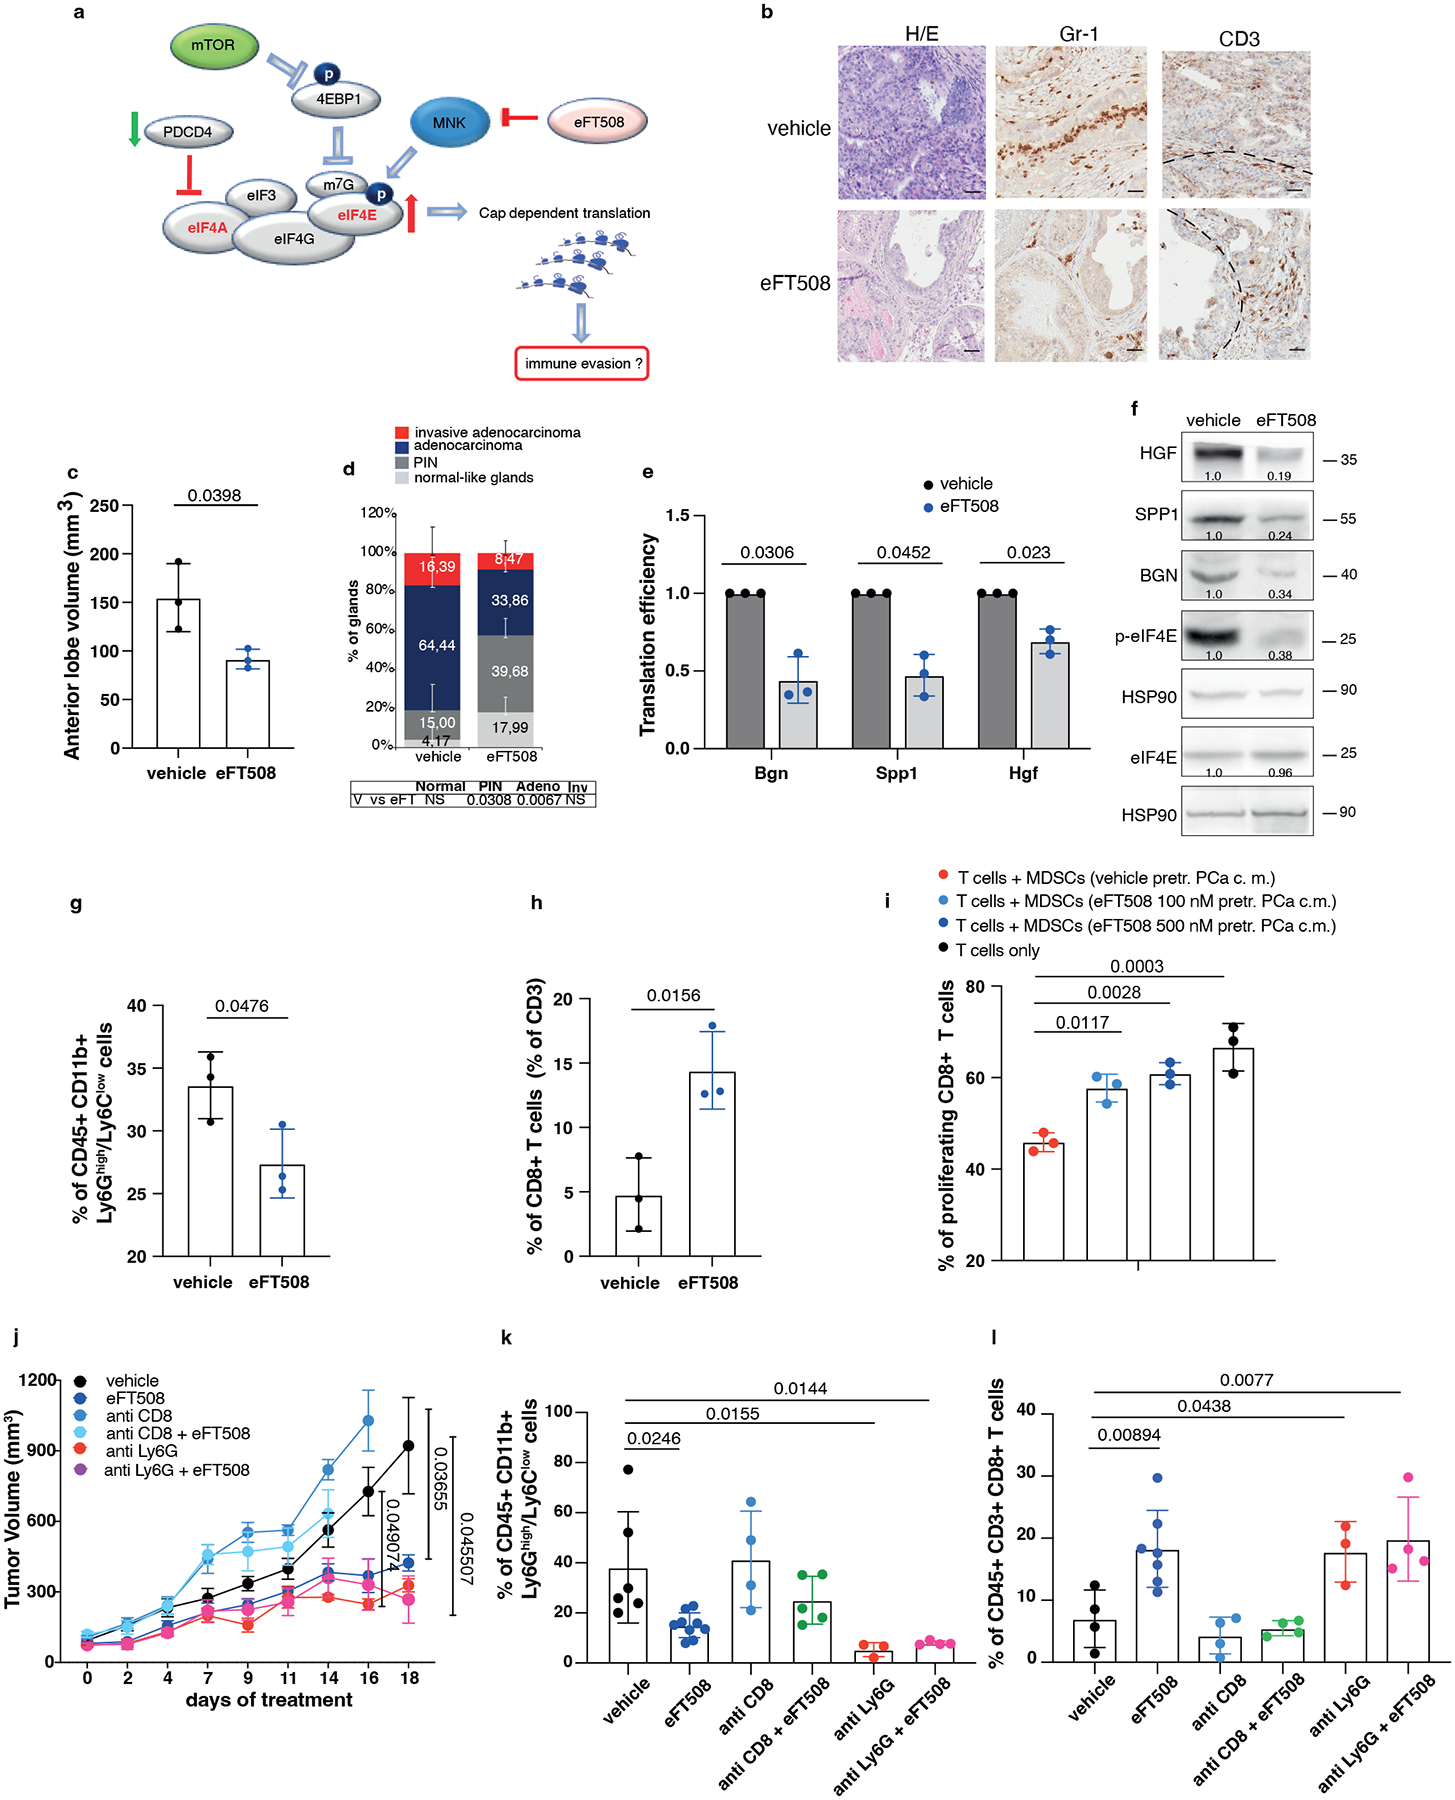
a, Model depicting the proposed mechanism by which MNK1/2 inhibition by eFT508 may inhibit translation and modulate the tumor microenvironment. b, Representative H/E, Gr-1 and CD3 staining (n = 3 mice in each group). Scale Bar 50 μm. c, Volume of the anterior prostate glands (n = 3 mice in each group). d, Histopathological score (n = 3 mice in each group). Summary table with statistical analysis (bottom) (2-way ANOVA followed by Šídák’s multiple comparisons test; top). PIN, prostatic intraepithelial neoplasia. e, Translation efficiency (polysomal mRNA expression/total mRNA expression) of Bgn, Spp1 and Hgf in eFT508-treated and vehicle-treated prostate cancer. n = 3 prostate tumors for each group. Statistical analysis (two-tailed ratio paired t test). f, Western blot analysis showing the protein levels of HGF, SPP1, BGN, p-eIF4E, eIF4E and representative HSP90 in eFT508-treated and vehicle-treated prostate cancer. Densitometry values normalized to the respective loading control are indicated for each band. The experiment was repeated three independent times with similar results. g, Percentage of CD45+/CD11b+/Ly6Ghigh/Ly6Clow cells (PMN-MDSCs) inside the CD45+ population (n = 3 mice in each group). h, Percentage of CD45+/CD3+/CD8+ cells inside the CD45+ population (n = 3 mice in each group). i, Flow cytometric analysis of CFSE dilution in spleen-derived T cells co-cultured with bone marrow-derived MDSCs in a T cell suppression assay; MDSCs were incubated for 24 hours with c.m. of eFT508-treated prostate cancer cells. n = 3 biological replicates. The experiment was repeated two independent times with similar results. j, Tumor growth of RapidCap allografts in C57BL6 mice treated with eFT508 (20 mg/Kg) or the indicated depleting-antibodies: anti-Ly6G (150 μg/Kg) and anti-CD8 (200 μg/Kg) (from the top of the legend, n = 8, n = 9, n = 4, n = 5, n = 5, n = 5). Data are mean ± SEM. Statistical analysis between all groups and time points (multiple unpaired t test). k, Percentage of CD45+/CD11b+/Ly6Ghigh/Ly6Clow cells (PMN-MDSCs) inside the CD45+ population (from the left, n = 6, n = 9, n = 4, n = 5, n = 3, n = 4). l, Percentage of CD45+/CD3+/CD8+ cells inside the CD45+ population (from the left, n = 4, n = 7, n = 4, n = 4, n = 3, n = 4). Data are mean ± SD in (c-e, g-i, k-l). Statistical analysis (two-sided unpaired Student’s t-test) in (c) and (g-h). Statistical analysis between all groups (ordinary one-way ANOVA followed by Tukey’s multiple comparisons test) in (k) and (i) and one-way ANOVA followed by Dunnett’s multiple comparisons test in (l).
Combined eFT508 and Ipatasertib treatment in Ptenpc−/−;Trp53pc−/− prostate tumors
The findings that the translation machinery of prostate tumor cells controls MDSCs recruitment through PDCD4 loss and eIF4E phosphorylation prompted us to hypothesize that inhibitors acting on different translation factors of the eIF4F complex could be used in combination to enhance treatment efficacy. Treatment of mouse and human prostate tumor cells with Ipatasertib (Ipa), a highly selective pan-AKT inhibitor55, promoted a dose-dependent increase in PDCD4 levels (Extended Data Fig. 9a). A recent phase III clinical trial demonstrated that Ipa, in combination with standard of therapy in prostate cancer, improved radiographical progression-free survival in metastatic CRPC (mCRPC) patients with PTEN-loss tumors, without affecting patient survival56,57. Treatment with eFT508 in combination with Ipa in murine Pten−/−; Trp53−/− and human PC3 prostate tumor cells blocked eIF4E phosphorylation and promoted the upregulation of PDCD4 levels triggering a more robust inhibition of HGF, SPP1 and BGN than in cells treated with the single inhibitors (Extended Data Fig. 9b and c). Moreover, the migratory capability of MDSCs was strongly reduced when exposed to c.m from tumor cells treated with Ipa and eFT508. This defect was rescued when HGF, SPP1 and BGN were added back to the c.m of tumor cells treated with eFT508 and Ipa (Extended Data Fig. 9d). In vivo, the combination treatment was well tolerated in Ptenpc−/−; Trp53pc−/− mice. eFT508 (10 mg Kg−1) in combination with Ipa (100 mg Kg−1) led to a strong reduction in tumor volume and number of prostate glands affected by invasive adenocarcinoma (Fig. 6a and 6c–d), efficiently decreasing the tumor levels of HGF, SPP1 and BGN also in vivo (Fig. 6e). Importantly, eFT508 and Ipa co-treatment reduced tumor-infiltrating PMN-MDSCs to a greater extent than the single treatments (Fig. 6a and 6f; Extended Data Fig. 9e). Inhibition of PMN-MDSCs recruitment was also associated with increased CD8+ T cells in prostate tumors treated with the combination (Fig. 6g–h). Note that in tumors treated with Ipa and eFT508, T cells were found within the prostate tumor glands, whereas in tumors treated with monotherapy, T cells were confined to the stroma (Fig. 6a–b). Thus, the dual targeting of both AKT and MNK promotes a more potent inhibition of the eIF4F initiation complex, reprogramming the tumor immune response of prostate cancer (Fig. 6i).
Fig. 6. Dual eFT508 and ipatasertib treatment dampens tumor-growth, tumor-infiltrating PMN--MDSCs and increases CD8+ T cells in Ptenpc−/− Trp53pc−/− prostate cancer.
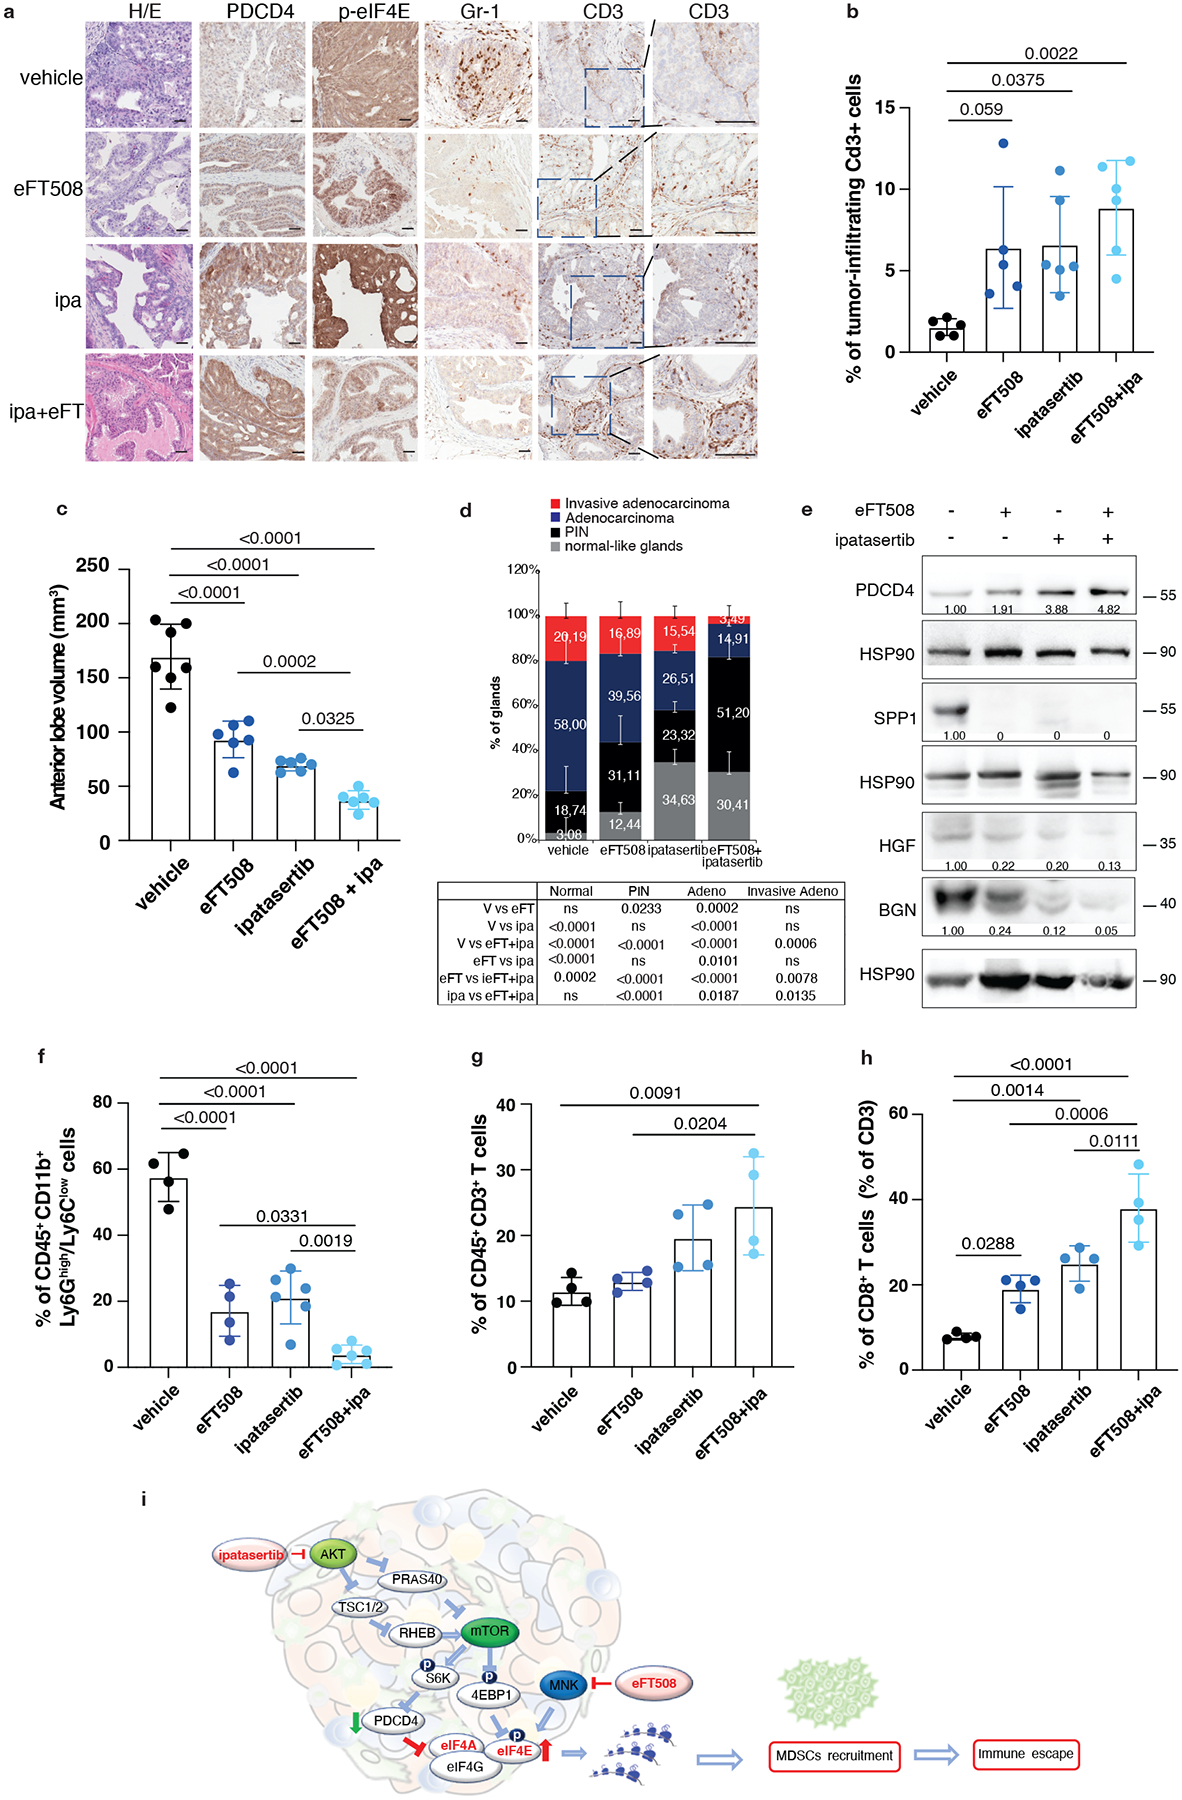
a, Representative haematoxylin and eosin (H/E), PDCD4, p-eIF4E, Gr-1 and CD3 staining in the tumor at the completion of the study. (vehicle n = 5, eFT508 n = 5, ipa n = 6, eFT+ipa n = 6). Scale bar 50 μm. b, Quantification of the percentage of CD3+ cells infiltrating the glands in the tumors of the indicated treatment groups (from the left, n = 5, n = 5, n = 6, n = 6). c, Volume of the anterior prostate glands in Ptenpc−/−;Trp53pc−/− mice randomly assigned to the indicated treatment groups (from the left, n = 7, n = 6, n = 6, n = 6). d, Histopathological score of Ptenpc−/−;Trp53pc−/− prostate tumor glands in the indicated treatment groups (from the left, n = 5, n = 5, n = 6, n = 6). Summary table with statistical analysis (2-way ANOVA followed by Tukey’s multiple comparisons test) on the bottom. e, Western blot analysis showing the protein levels of PDCD4, HGF, SPP1 and BGN in Ptenpc−/−;Trp53pc−/− whole tumor lysates in the indicated treatment groups. Densitometry values normalized to the respective loading control are indicated for each band. The experiment was repeated two independent times with similar results. f, Percentage of CD45+/CD11b+/Ly6Ghigh/Ly6Clow cells (PMN-MDSCs) inside the CD45+ population in Ptenpc−/−;Trp53pc−/− prostate cancer (from the left, n = 4, n = 4, n = 6, n = 6). g, Percentage of CD45+/CD3+ cells inside the CD45+ population in Ptenpc−/−;Trp53pc−/− prostate cancer (n = 4 in each group). h, Percentage of CD45+/CD3+/CD8+ T cells (% of CD3+ T cells) inside the CD45+ population determined by flow cytometric analysis in Ptenpc−/−; Trp53pc−/− prostate cancer in the indicated treatment groups (n = 4 in each group). i, Model depicting the proposed mechanism by which ipatasertib and eFT508 inhibit protein synthesis of the immunosuppressive secretome. Data are mean ± SD. Statistical analysis in b,c,f,g,h between all groups: (ordinary one-way ANOVA followed by Tukey’s multiple comparisons test).
eFT508 or IPA combined with AZD5069 in Ptenpc−/−;TMPRSS2/Ergpc+/+ prostate cancer
We and others have previously demonstrated that inhibition of the CXCR2 receptor partially inhibits MDSCs recruitment in prostate cancer (Extended Data Fig. 10a)5. Treatment with AZD5069 consistently increases the tumor levels of HGF but not of SPP1 and BGN in Ptenpc−/− mice (Extended Data Fig. 10b). Given that eFT508 inhibits the levels of HGF, SPP1 and BGN but not of CXCL5 (Extended Data Fig. 10c), which is transcriptionally regulated in prostate tumors, we speculated that eFT508 efficacy could be enhanced by AZD5069 treatment. As a model system to validate this hypothesis, we used the Ptenpc−/−;TMPRSS2/Ergpc+/+ mouse model. As shown by our bioinformatic analyses, Ptenpc−/−; TMPRSS2/Erg+/+ tumors present the highest transcriptional levels of CXCL5 when compared to prostate tumors of the other genetic backgrounds (Extended Data Fig. 10d). Ptenpc−/−; TMPRSS2/Ergpc+/+ mice were treated with the MNK1/2 inhibitor eFT508 (10 mg Kg−1), AZD5069 (30 mg Kg−1) or the combination of the two compounds at the same concentration for six weeks before being sacrificed. The combined treatment of AZD5069 with eFT508 promoted a potent tumor growth inhibition as assessed by decreased tumor volume and tumor aggressiveness compared to the single treatments (Fig. 7a–c). eFT508 treatment also decreased HGF, SPP1 and BGN protein levels without affecting CXCL5 levels (Fig. 7d). Consistently, PMN-MDSCs infiltration was reduced in tumors treated with the combination therapy compared to the single treatments (Fig. 7e). Finally, T cells infiltration increased in tumors treated with the combination of eFT508 and AZD5069 to a greater extent than in tumors treated with the single treatments (Fig. 7f).
Fig. 7. eFT508 or Ipatasertib enhances the anti-tumor immune response of AZD5069 in Ptenpc−/−;TMPRSS2/Ergpc+/+ prostate cancer.
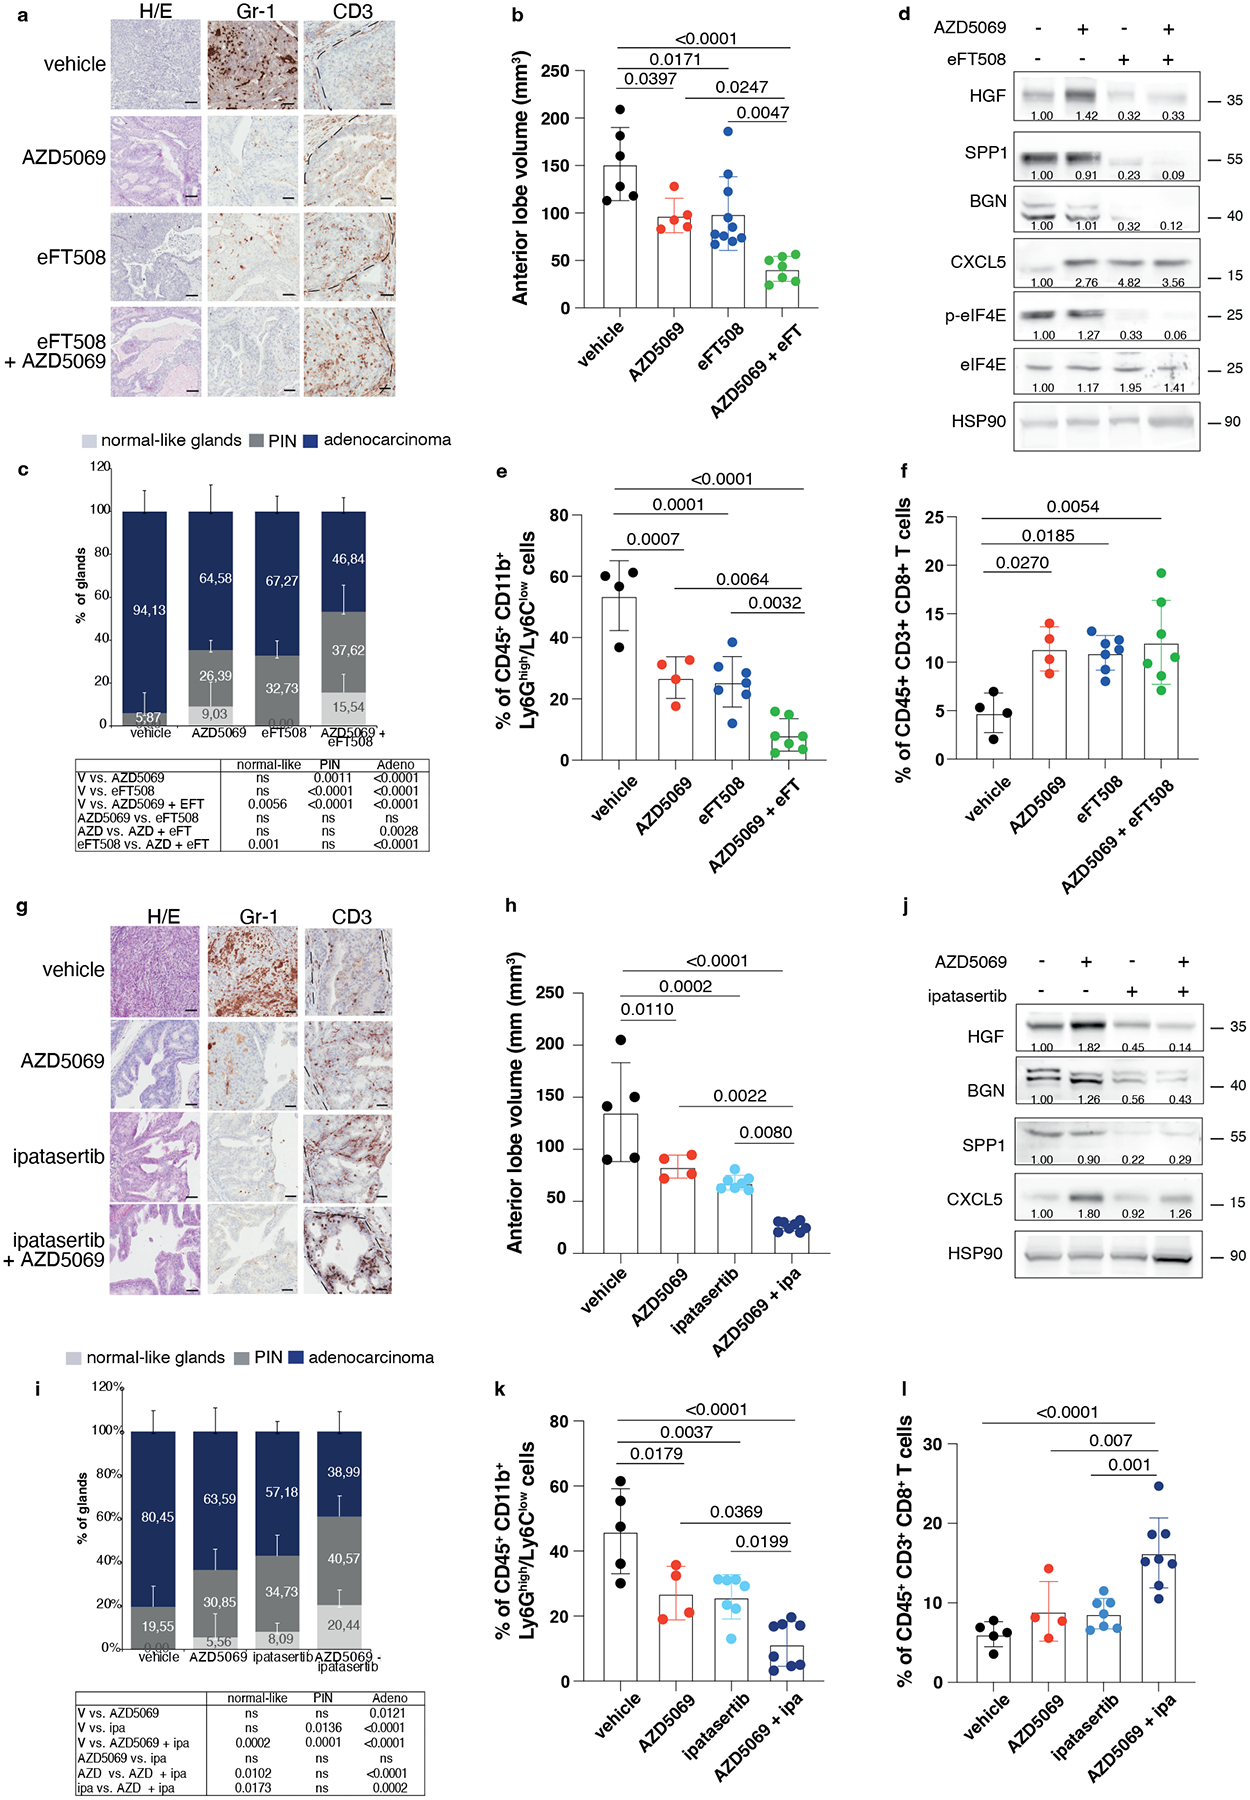
a, Representative H/E, Gr-1 and CD3 staining in the tumor. Scale bar 50 μm (vehicle n = 5, AZD5069 n = 4, eFT508 n = 9, AZD5069+ eFT508 n = 7). b, Volume of the anterior prostate glands (from the left, n = 6, n = 7, n = 10, n = 7). c, Histopathological score of prostate cancer glands (top). (from the left, n = 5, n = 4, n = 9, n = 7). Summary table with statistical analysis (2-way ANOVA followed by Tukey’s multiple comparisons test; bottom). d, Western blot showing the protein levels of HGF, SPP1, BGN, CXCL5, p-eIF4E, eIF4E and representative HSP90 in tumor lysates. Densitometry values normalized to the respective loading control are indicated for each band. The experiment was repeated two independent times with similar results. e, Percentage of tumor-infiltrating CD45+/CD11b+/Ly6Ghigh/Ly6Clow cells (PMN-MDSCs) inside the CD45+ population (from the left, n = 4, n = 4, n = 7, n = 7). f, Percentage of tumor-infiltrating CD45+/CD3+/CD8+ inside the CD45+ population (from the left, n = 4, n = 4, n = 7, n = 7). g, Representative H/E, Gr-1 and CD3 staining in the tumor. Scale bar 50 μm. (vehicle n = 4, AZD5069 n = 4, ipa n = 6, AZD5069+ipa n = 8). h, Volume of the anterior prostate glands (from the left, n = 5, n = 4, n = 7, n = 8). i, Histopathological score of prostate tumor glands (top). (from the left, n = 4, n = 4, n = 6, n = 8). Summary table with statistical analysis (2-way ANOVA followed by Tukey’s multiple comparisons test; bottom). j, Western blot showing the protein levels of HGF, SPP1, BGN, CXCL5 and representative HSP90 in whole tumor lysates. Densitometry values normalized to the respective loading control are indicated for each band. The experiment was repeated two independent times with similar results. k, Percentage of tumor-infiltrating CD45+/CD11b+/Ly6Ghigh/Ly6Clow cells (PMN-MDSCs) inside the CD45+ population (from the left, n = 5, n = 4, n = 7, n = 8). l, Percentage of tumor-infiltrating CD45+/CD3+/CD8+ inside the CD45+ population (from the left, n = 5, n = 4, n = 7, n = 8). Data are mean ± SD. Statistical analysis in (b), (e), (f), (h), (k) and (l) between all groups (ordinary one-way ANOVA followed by Tukey’s multiple comparisons test).
AZD5069 was also tested in combination with Ipa in vivo. Treatment with Ipa and AZD5069 in Ptenpc−/−; TMPRSS2/Ergpc+/+ mice was more effective than treatment with Ipa and AZD5069 alone, as detected by reduced tumor growth and tumor aggressiveness (Fig. 7g–i). HGF, SPP1 and BGN protein levels were reduced upon Ipa treatment (Fig. 7j). Ipa treatment combined with AZD5069 strongly decreased PMN-MDSCs compared to the single treatments (Fig. 7g and k). This was associated with increased CD8+ T cells infiltration in prostate tumors (Fig. 7g and l). Taken together, these findings demonstrate that both eFT508 and Ipa treatment decrease PMN-MDSCs infiltration and that co-treatment with AZD5069 further increases the anti-tumor immune response, providing an effective therapeutic strategy for the treatment of prostate cancer patients.
HGF, SPP1 and BGN correlate with p-eIF4E and CD33 in human prostate cancer
To corroborate our findings in human prostate tumors, we analyzed two tissue microarrays from a total cohort of 614 (Cohort 1 n = 545, Cohort 2 n = 69) patients with prostate cancer at different stages of the disease. Immunohistochemistry (IHC) analysis in Cohort 1 found that HGF, SPP1 and BGN levels were overexpressed in prostate adenocarcinoma and CRPC samples compared to benign prostate hyperplasia (BPH) (Cohort 1 n = 545) (Fig. 8a–b). Moreover, the co-expression of the MDSCs recruiters directly correlated with p-eIF4E levels in prostate adenocarcinoma and CRPC samples (Cohort 1 n = 401) (Fig. 8c–d and Extended Data Fig. 10e–f). The co-expression of phospho-eIF4E and the ligands correlated with poor survival in prostate cancer patients (Fig. 8g). In addition, we found a significant negative correlation between PDCD4 levels and the expression of the ligands (Cohort 1 n = 401) (Fig. 8e–f). Notably, prostate cancer patients carrying PDCD4 loss and overexpression of the ligands showed reduced overall survival compared to patients with high PDCD4 levels and low expression of the ligands (Fig. 8h).
Fig. 8. BGN, SPP1 and HGF are highly expressed in human prostate cancer and correlate with p-eIF4E and CD33 density.
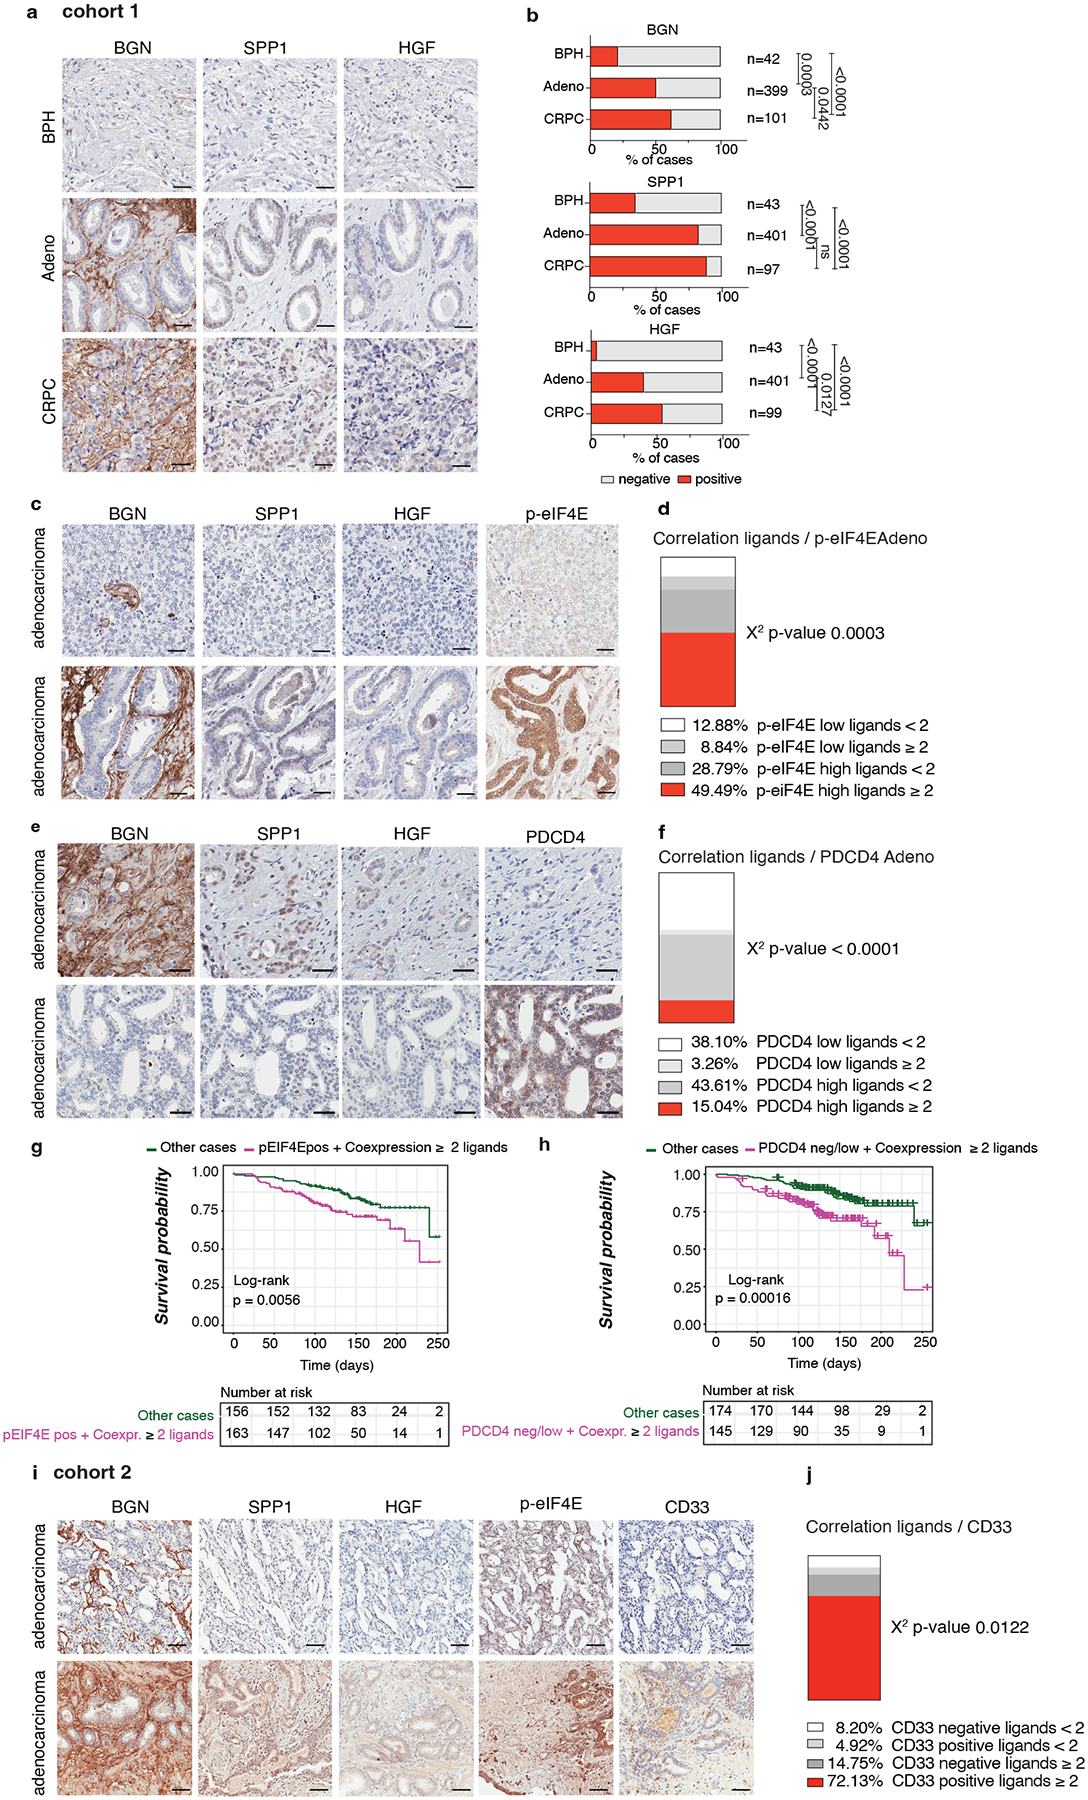
a, Representative IHC of BGN, SPP1 and HGF in benign prostate hyperplasia (BPH), prostate adenocarcinoma (PCa) and CRPC in Cohort 1 (n = 545). Scale bar 50 μm. b, Percentage of BGN, SPP1 and HGF negative and positive cases in BPH, prostate adenocarcinoma and CRPC in Cohort 1 for the indicated number of patients. Two-sided Fisher’s exact test. c, Representative IHC of BGN, SPP1, HGF and p-eIF4E showing negative (upper panel) and positive (lower panel) cases in prostate adenocarcinoma in cohort 1. Scale Bar 50 μm. d, Correlation between the co-expression of ≥ 2 ligands and p-eIF4E in prostate adenocarcinoma in Cohort 1 (n = 401). Two-sided Fisher’s exact test. e, Representative IHC of BGN, SPP1, HGF and PDCD4 showing the negative correlation in prostate adenocarcinoma in cohort 1. Scale Bar 50 μm. f, Correlation between the co-expression of ≥ 2 ligands and PDCD4 in prostate adenocarcinoma in Cohort 1 (n = 401); Two-sided Fisher’s exact test. g, Correlation between overall survival and co-expression of p-eIF4E and ≥ 2 ligands in prostate adenocarcinoma. The number of cases is indicated in the table below for each comparison. h, Correlation between overall survival and concomitant PDCD4 loss and expression of ≥ 2 ligands in prostate adenocarcinoma; The number of cases is indicated in the table below for each comparison. i, Representative IHC of BGN, SPP1, HGF and CD33 showing a positive correlation of BGN, SPP1 and HGF with p-eIF4E and CD33 in prostate adenocarcinoma in cohort 2. Scale Bar 50 μm. j, Correlation between the co-expression of ≥ 2 ligands and CD33 in prostate adenocarcinoma in cohort 2; Two-sided Fisher’s exact test.
HGF, SPP1 and BGN levels were also correlated with increased CD33 density in Cohort2, with included samples with available CD33 staining (n = 69) (Fig. 8i–j). In patient-derived organoids, we also detected different protein levels of the three MDSCs-recruiters, thereby validating the findings in the two cohorts of TMAs (Extended Data Fig. 10g). Last, we tried to correlate the plasma levels of HGF, SPP1 and BGN in patients affected by prostate cancer with the neutrophil-to-lymphocyte ratio, a clinically established prognostic marker that correlates with circulating MDSCs12,58, and we found that only HGF plasma levels correlated with the neutrophil-to-lymphocyte ratio in CRPCs (Extended Data Fig. 10h). In sum, these data confirm that the immunosuppressive secretome, constituted by HGF, SPP1 and BGN is increased in human prostate cancer and associated with increased CD33 density.
Discussion
Despite advances in prostate cancer care, there is an urgent unmet need for new therapeutic strategies to improve the outcome for prostate cancer patients59. Immune checkpoint inhibitors dramatically improved the prognosis of patients with certain types of tumors60. Nevertheless, the anticancer activity of immune checkpoint inhibitors in prostate cancer is very limited61. This lack of efficacy is probably due to the strong infiltration of immunosuppressive MDSCs that exclude T cells from the tumor2. Thus, new immunotherapeutic strategies targeting MDSCs are needed to restore immune surveillance in prostate cancer. Here, we have demonstrated that the genome-wide analysis of the translatome of prostate cancer identifies a specific signature of translationally regulated MDSCs recruiters that promote the establishment of an immunosuppressive tumor microenvironment. Mechanistically we found that prostate cancer cells build up a translational apparatus that is functional to its immune escape. The increased activity of the eIF4F complex, triggered by decreased PDCD4 and increased phosphorylation of eIF4E, upregulates the expression of Hgf, Spp1 and Bgn mRNAs that work as potent recruiters of MDSCs, as demonstrated by functional experiments in vitro and in vivo (Fig. 6i). Importantly, we found that eIF4E phosphorylation promotes the selective translation of Hgf, Spp1 and Bgn mRNAs and that pharmacological inhibition of MNK1/2 through eFT508 decreases the translation of phospho-eIF4E-sensitive mRNAs, depriving cancer cells of MDSCs. In line with these findings, previous papers demonstrate that phosphorylation of eIF4E marginally affects global translation, but it stimulates the translation of a subset of mRNAs, known as phospho-eIF4E sensitive. Interestingly, secreted and membrane-associated proteins are between the factors controlled by phospho-eIF4E62. In different tumors, the types of translationally-regulated secreted factors vary according to the cell context63, the available pool and features of mRNAs, and the presence of inhibitory RBPs22.
Our findings also demonstrate that the translation of factors capable of recruiting PMN-MDSCs partially depends on PDCD4, whose levels are downregulated in Pten-deficient cells. As demonstrated, PDCD4 rescue in prostate cancer cells is associated with decreased protein synthesis of HGF, SPP1 and BGN despite the elevated levels of phospho-eIF4E. Interestingly, a previous paper demonstrated that PDCD4 knock-down was associated with increased production of pro-tumorigenic cytokines in a spontaneous lymphoma model64. This finding suggests that PDCD4 downregulation, common in multiple types of cancer65,66, is necessary to establish an anti-inflammatory immune response67. In line with these findings in human prostate tumors, characterized by increased infiltration of PMN-MDSCs, we found decreased PDCD4 levels associated with increased HGF, SPP1 and BGN levels. Moreover, PDCD4 mRNA levels correlated with decreased disease-free survival in human prostate cancer (Extended Data Fig. 6g).
Our findings are also noteworthy because of their implications for research in the field of cancer immunotherapy. Recent work demonstrates that Ipa combined with abiraterone improved radiographical progression-free survival compared to abiraterone alone among patients with mCRPC with PTEN-loss tumors. However, in this trial, there was no significant difference between the groups in the intention-to-treat population57. One possible explanation of the partial efficacy of Ipa is that the MNK1/2-phospho eIF4E axis remains active and promotes the recruitment of PMN-MDSCs, allowing cancer cells to escape immunosurveillance. Our findings provide evidence that the efficacy of Ipa can be enhanced by eFT508 treatment by reshaping the tumor microenvironment, leading to decreased PMN-MDSCs, increased CD8+ T cell infiltration, and tumor suppression.
These findings are also relevant for future personalized therapies in prostate cancer. Contrary to tumors of other genetic backgrounds, in the Ptenpc−/−; TMPRSS2/Ergpc+/+ tumors, we found a transcriptional upregulation of CXCR2 ligands. This finding prompted us to hypothesize that this genetic background could be specifically sensitive to AZD5069 treatment. Indeed, PMN-MDSCs infiltration was significantly reduced upon AZD5069 administration. When AZD5069 was combined with eFT508 or Ipa, PMN-MDSCs infiltration was further reduced due to the inhibition of the translationally regulated recruiters HGF, SPP1 and BGN.
In conclusion, our findings demonstrate that the translation apparatus of cancer cells control the tumor immune response via PMN-MDSCs and that translation inhibition represents a valuable therapeutic approach to improve the treatment outcome of patients affected by aggressive prostate cancer.
Methods
Mouse strains
The research complies with all relevant ethical regulations and the “Inclusion & Ethics” recommendations. The animal experiments were approved by the local ethical committee (“Dipartimento della Sanità e Socialità, Esperimenti su animali” Canton Ticino), authorization number TI13/2015, TI25/2016, TI51/2018 e TI08/2021. Male Ptenpc−/− were generated by crossing female Pten loxP/loxP mice with male Pten loxP/WT;PB-Cre4 transgenic mice and genotyped as previously described5. Ptenpc−/−;TMPRSS2/Ergpc+/+, Ptenpc−/−;Trp53pc−/−, Ptenpc−/−;CDCP1pc+/+ and Ptenpc−/−;TIMP1−/− mice were generated as described in42 43 44 45, respectively. 4 weeks-old male C57BL6 male mice were purchased from Charles River (Calco, Italy) and acclimatized for four weeks before experimentation. For allograft experiments, 2.5 × 10⁶ TRAMP-C1 cells, 2.5 × 10⁶ Pten-shTRAMP-C1 or 2 × 10⁶ Pten−/−;Trp53−/− (RapidCap) cells68 were injected subcutaneously into the flank of 8 weeks-old male C57BL/6 mice. When tumors were approximately 100 mm3, mice were randomized to the treatment groups. Tumor growth was monitored every 2–3 days by measuring the tumor size with a caliper. The following formula was applied to measure tumor volume = (Width2 × Length)/2. The local ethics committee approved the conduction of the in vivo experiments with maximal tumor sizes of 1500 mm3. The maximal tumor size was not exceeded.
Cell cultures
HEK-293T (CRL-3216™ATCC®) , TRAMP-C1 cell line (ATCC® CRL-2730™), PC-3 (ATCC® CRL-1435™) and LNCaP (ATCC® CRL-1740™) were obtained from the ATCC. No further authentications were performed. No commonly misidentified cell lines were used in the study.
The TRAMP-C1 Pten-sh cell line was generated in the laboratory using the murine Pten Plasmid shRNA (sc-36326-SH; Santa Cruz) and validated by western blotting. Pten−/−;Trp53−/− Rapid Cap cells, kindly provided by L. Trotman, were obtained as previously described68.
Differentiation of myeloid-derived suppressor cells from bone marrow (BM-MDSCs) in vitro
Mouse BM-MDSCs were differentiated in vitro as previously described69. Briefly, bone marrow precursors were flushed from the femurs of C57BL/6 with RPMI 1640 medium. Red blood cells were lysed with ACK buffer (Gibco, Cat. A10492–01). The cell pellet was filtered through a 40 μm cell strainer (Falcon, Cat. 352340) and resuspended in 10 ml in RPMI 1640 containing 10% heat-inactivated FBS, 40 ng ml−1 GM-CSF and 40 ng ml−1 IL-6.
Treatments
eFT508 (MedChem Express) was administered daily by oral gavage at a final concentration of 10 mg Kg-1 in 12–14 weeks-old transgenic mice and 20 mg Kg-1 in C57BL6 mice on a Monday through Friday schedule. Ipatasertib (MedChem Express) was administered daily by oral gavage at a final concentration of 100 mg Kg-1 in 12–14 weeks-old transgenic mice on a Monday through Friday schedule. The CXCR2 antagonist AZD5069 (AstraZeneca) was administered daily by intraperitoneal injections at a final concentration of 100 mg Kg−1 in 12–14 weeks-old transgenic mice on a Monday through Friday schedule. 12–14 weeks-old control mice received vehicle solutions. For in vivo depletion, InVivoPlus anti-mouse CD8 antibody (200 μg per mouse; BioXCell; BP0061–5MG-A), InVivoPlus anti-mouse Ly6G (150 μg per mouse; BioXCell, BP0075-1-5MG-A) or InVivoMab rat IgG2b isotype control (200 μg per mouse; BioXCell; BE0090–5MG-A;) was administered three times a week via intraperitoneal injection.
Recombinant Murine HGF (315–23; Peprotech; 0.04 mg Kg−1), Recombinant Human SPP1 (120–35; Peprotech; 0.2 mg Kg−1) and Recombinant Mouse BGN Protein, CF (8128-CM-050; R&D systems; 0.2 mg Kg−1), were dissolved in sterile PBS and administered daily by intratumoral injection to TRAMP-C1-injected mice.
In vitro culture experiments
For western blotting, RNA extraction and polysome profiling experiments, the cells were serum-starved for 18 hours, then stimulated for 2 hours with 10% FBS and lysed in the appropriate buffer or Trizol for proteins or RNA extraction, respectively. Cell growth was analyzed in the indicated conditions and time using the Incucyte system.
Transwell migration assay
Five μm Boyden chambers (Millipore, MCMP24H48) were placed in a 24-well plate containing the appropriate media or recombinant proteins (Recombinant Murine CXCL5 #SRP3219, Sigma-Aldrich; 40 ng/ml); Recombinant Murine HGF #315–23, Peprotech; 40 ng/ml; Recombinant Human SPP1 #120–35, Peprotech; 40 ng/ml; Recombinant Mouse BGN Protein, CF #8128-CM-050, R&D systems; 40 ng/ml), and incubated for 30 mins at 37°C. An equal number of MDSCs under serum-starved conditions or pre-conditioned as indicated were placed on the top chamber of the transwell system. Cells were allowed to migrate to the bottom well for 6 h at 37 °C with 5% CO2. Migrated MDSCs in the lower wells of the membrane were collected, acquired by Fortessa (BD Biosciences) and analyzed using FlowJo software (TreeStar).
In vitro T cell suppression assay
In vitro T cell suppression assays were carried out with naive murine splenocytes, labeled with 5 μM CFSE (Molecular Probes; C34554) and activated in vitro with anti-CD3 and anti-CD28 beads (Invitrogen; 11452D), as described in6. Bone marrow derived-MDSCs were pretreated where indicated with the following recombinant proteins: Recombinant Murine HGF #315–23, Peprotech; Recombinant Human SPP1 #120–35, Peprotech; Recombinant Mouse BGN Protein, CF #8128-CM-050, R&D systems. Then, the recombinant proteins were washed out and MDSCs were co-cultured with the splenocytes. The proliferation of CFSE-labeled CD8+ T cells stained with an anti-CD8 antibody (Biolegend; clone 53–6.7) was assessed by BD Fortessa (BD Biosciences) and analyzed using FlowJo software (TreeStar).
ELISA assay
Prostate cancer-derived conditioned media from mouse prostate cancer cell lines was tested for the quantification of HGF, SPP1 and BGN by ELISA assay (Mouse Biglycan (BGN) ELISA Kit 48-strip-wells MBS2602124; Mouse Osteopontin (OPN) ELISA Kit MBS263335; Mouse Hepatocyte Growth Factor (HGF) ELISA Kit; MBS268751).
CRPC serum samples were analyzed to assess HGF concentration using the HU HGF ELISA KIT 96 TESTS BIOSOURCE (Life Technologies; KAC2211), following the manufacturer’s instructions.
Immunophenotyping by flow cytometry
Tumors were minced and digested in collagenase D (5 μg/ml, Roche, Cat. 11088858001) for 1 hour at 37 °C, followed by incubation in Trypsin and DNAse (20 μg/ml, Roche, Cat.4716728001) for 5 min. 10% FBS-containing RPMI medium was added and the cells were filtered through a cell strainer (Falcon; 352340) to obtain a single-cell suspension. Unspecific binding was neutralized with a CD16/CD32 antibody (Biolegend; clone 93, catalog 101302). Single-cell suspensions were stained with specific antibodies for 15 minutes at 4°C in FACS buffer (PBS containing 1% FCS and 1 mM EDTA). The primary antibodies are listed in the Reporting Summary.
For the EpCAM+ epithelial separation from the CD45+ immune cell fraction and from the EpCAM-/CD45- population, the single-cell suspension from Ptenpc−/−;Trp53 pc−/− prostate tumors were stained with the FITC-EpCAM antibody (Thermo Fisher Scientific; clone G8.8, 11-5791-82). Then, the single-cell suspension was incubated with anti-FITC MicroBeads (Miltenyi Biotech; 130-048-701) and purified through the MACS column in a QuadroMACS separator. The EpCAM- population was stained with PE-CD45 antibody (Biolegend; clone 30-F11, 103106), further incubated with the anti-PE MicroBeads (Miltenyi Biotech; 130-048-801), and purified through the MACS column. The EpCAM+, CD45+, and EpCAM-/CD45- population was resuspended in RIPA buffer and further analyzed for protein analysis.
Transduction of prostate cancer cells with lentiviral vectors
For PDCD4 overexpression, the Precision Lenti ORF Human PDCD4 (Horizon Discovery; OHS5897–202618618) and Precision Lenti ORF positive control (Horizon Discovery; OHS5832) were used. For the triple knockdown, Scramble[shRNA#1], mHgf[shRNA#1, mSpp1[shRNA#1] and] mBgn[shRNA#1] (VectorBuilder) were used. The transfection was performed using jetPRIME reagent (Polyplus transfection, 114–07/712–60) according to the manufacturer’s protocol at the 1:2 DNA:jet PRIME ratio in 293T cells. After 48 hours, each lentiviral-containing medium was collected, filtered through 0.45 μM filters and added to 70% confluent prostate cancer cells. After 48 hours from the transduction, antibiotics selection was performed for 48 hours. The efficiency of PDCD4 expression of Hgf/Spp1/Bgn silencing was confirmed by western blotting.
Immunohistochemistry
Tissues were fixed in formalin 10% and processed for haematoxylin and eosin staining and immunohistochemistry according to standard procedures, as described in70. Sections were stained for anti-peIF4E (ab7626; Abcam, 1:100), anti-PDCD4 (Cell Signaling Technology; catalog 9535S, 1:400), anti-Ly6G (Gr-1) (BD Pharmingen; clone 1A8, catalog 551459, 1:1500) and anti-CD3 (Dako; catalog A0452, 1:800). Images were obtained with Aperio ScanScope, Leica Biosystem. All the quantifications were performed with ImageScope, v12.3.2.8013, Leica Biosystem.
Polysome profiling, library synthesis and RNA-seq
Polysome profiles analysis of prostate tumor was performed in six different genetic backgrounds: wild-type, Ptenpc−/−, Ptenpc−/−;TMPRSS2-ERGpc+/+, Ptenpc−/−;CDCP1pc+/+, Ptenpc−/−;Timp1−/− and Ptenpc−/−;Trp53pc-/−. For each genotype, three mice of 20–25 weeks of age were analyzed. Prostate tumor tissues were quickly excised and homogenized in polysome lysis buffer (30 mM Tris-HCl, pH 7.5, 100 mM NaCl, 30 mM MgCl2, 1% sodium deoxycolate, 1% Triton X-100, 100 mg ml−1 cycloheximide, 1 mM DTT and 30 U ml−1 RNasin) by using a sterile pestle.
For MDSCs polysome profiling analysis, bone marrow-differentiated MDSCs were collected and sorted in CD11bhigh; Ly6Ghigh;Ly6Clow and CD11bhigh; Ly6Gneg;Ly6Chigh after 5 days of differentiation. Sorted cells were plated and collected the day after for polysome profiling analysis after incubation with PMA (20 ng/ml)/ionomycin (1 μM) for 15 minutes and cycloheximide 100 μg/ml in the last 5 minutes. Bone marrow from three mice was flushed from the femurs of C57BL/6 with RPMI 1640 medium. Red blood cells were lysed with ACK buffer (Gibco; Cat. A10492–01). The cell pellet was filtered through a 40 μm cell strainer (Falcon; Cat. 352340), resuspended and lysed in polysome lysis buffer.
Cells are seeded in two 15-cm dishes one day before harvest to reach a 70% confluence by the time of the experiment. Cells were treated with 100 μg/ml cycloheximide (Sigma; C7692) 5 minutes before harvesting. After a quick wash in ice-cold PBS containing cycloheximide (100 μg/ml; PBS-CHX), cells were scraped in polysome lysis buffer. Cytoplasmic extracts with equal amounts of RNA were loaded on a 15–50% sucrose gradient and centrifuged at 4 °C for 3 h 30 min at 187,813 g in a SW41Ti Beckman rotor using a Beckman Optima L-90K ultracentrifuge. Gradients were read at 254 nm by the BioLogic LP system (BioRad) and acquired by the BioLogic LP Dataview 2.0. The fractions (1.0 ml each) were collected for subsequent RNA extraction to isolate the polysomal RNA fractions. Total and polysomal RNA fractions were incubated with 200 ug/ml proteinase K and SDS 1% for 1 h at 37 °C. RNA was extracted by phenol/chloroform 5:1 (Sigma-Aldrich; P1944) method, followed by overnight isopropanol precipitation at −80 °C, centrifugation at 19090 xg for 45 minutes and resuspension in 10 μl of DEPC water. At the end of the procedure, DNAse digestion was carried out with Turbo DNase (Thermo Fisher Scientific; AM2238) for 30 minutes at 37 °C and RNA purification was performed with RNA Clean and Concentrator kit (Zymo Research; R1015). The purified RNA was measured using Nanodrop and the quality was assessed using the Agilent 2100 Bioanalyzer. After random primer annealing, whole library preparation was performed using the Illumina TruSeq Stranded Total RNA with Ribo Zero. Completed libraries were then submitted for sequencing. RNA-seq was constructed with barcodes to allow multiplexing of 12 samples per lane. Sequencing was carried out on NextSeq 500 Illumina platform. Sequence alignments of paired-end 75 bp reads to the reference mouse genome (GRCm38) were performed using STAR (v.2.5.2a)71. Gene expression was quantified using the comprehensive annotations made available by Gencode72. Specifically, we used v20 release of the Gene Transfer File (GTF). Raw counts were further processed in the R Statistical environment and downstream differential expression analysis was performed using the DESeq2 pipeline73. Genes characterized by low mean normalized counts were filtered out by the Independent Filtering feature embedded in DESeq2 (alpha = 0.05). The polysomal RNA and total RNA expression for each genetic background were compared to the wild-type ones. For the principal component analysis (PCA) of Extended Data Fig. 1b and c, the R function plotPCA was applied considering the top 500 genes selected by the highest variance between samples. To measure the translation efficiency for each comparison shown in the scatter plots of Extended Data Fig. 1d, anota2seq package was used, specifically anota2seqRun function74.
Gene expression bioinformatic analysis
For the 5’UTR length and 5’UTR folding energy, genes with altered TE were identified based on FDR < 0.05 and TE > 0.7 (up) or < −0.7 (down). 5’UTR lengths were retrieved from ENSEMBL annotations (Mus Musculus, version 90). Secondary structure minimum free energies were calculated with Vienna RNAfold (v2.4). Differences in 5’UTR features of genes with altered TE were tested against the distributions of genes with invariant TE (inv) with the Wilcoxon Rank Sum Test (two-sided).
Gene Ontology Biological processes enriched among the translationally upregulated mRNAs (threshold for polysomal mRNA expression Log2 FC ≥ 1.0; FDR < 0.05; threshold for translation efficiency Log2 FC ≥ 0.5; FDR < 0.1), polysomal mRNAs (threshold Log2 FC ≥ 1.0; FDR < 0.05) and total mRNAs (threshold Log2 FC ≥ 1.0; FDR < 0.05) were determined by the DAVID 6.8 software; adjusted p-values for multiple comparisons by using the linear step-up method of Benjamini is reported.
For the selection of the ligand-receptor couples, the upregulated mRNAs encoding for extracellular proteins were selected from the RNAseq of the five different genetic backgrounds of prostate cancer compared to wild-type prostate. In addition, the expressed membrane-tethered protein-encoding mRNAs in bone marrow-differentiated MDSCs were filtered and merged with the upregulated membrane-tethered proteins in prostate cancer to select the target receptors. The matching of the upregulated ligands in the tumors with the expressed receptors in the MDSCs was performed by the iTALK database (doi: https://doi.org/10.1101/507871). The first 61 couples in the cytokines, growth factors and “other factors” were selected. The ligands and the receptors with a Log2 Fold change > 1 in all genotypes were filtered. Among the “other factors”, the first 20 couples were further filtered and ligands-receptor couples were positively selected if 1) the ligands are extracellular proteins based on Uniprot and Human Protein Atlas annotation, 2) the ligands were not downregulated in human Pten loss prostate cancer by using the TCGA dataset. The confirmation of the interaction of the pairs based on the STRING network database75 was used as further validation for all the categories. Isg15-Itgal76 and C5-C5ar177 were added to the list based on the literature.
For the analysis of human samples, we used two different human datasets of prostate cancer patients (https://www.cancer.gov/tcga and25). In these datasets of patients, survival analysis has been performed using Kaplan-Meier estimator and Cox-regression model based on PDCD4 mRNA expression and protein levels (survival, survminer and rms packages). For the RNA seq data, samples were classified into quartiles based on expression levels of PDCD4 and first (PDCD4_LOW) and forth (PDCD4_HIGH) quartiles were used for the analysis. Additionally, correlation analysis was performed using ggscatter function and chisq.test function.
Ribosome profiling
Cytoplasmic lysates from control and Ptenpc−/− prostates were prepared as described previously78. Endonuclease digestion was performed using RNase I (10U per unit of absorbance at 260nm in the lysate) at room temperature for 45 minutes. The reaction was stopped by adding SUPERase-In RNase inhibitor (Thermo Fisher Scientific). Samples were loaded on a sucrose gradient and ultracentrifuged as described previously78. The fraction containing the 80S was collected and RNA was extracted using phenol-chloroform as described previously79. RPFs (Ribosome Protected Fragments) were isolated on Novex TBE-Urea Gel, 15% (Thermo Fisher Scientific) and used for library preparation. SMARTer sm-RNA-Seq Kit for Illumina (Takara Bio) and SMARTer RNA Unique Dual Index Kit (Takara Bio) were used according to manufacturer’s instructions to prepare Ribo-seq libraries. Libraries were further purified on Novex TBE Gel, 8% (Thermo Fisher Scientific). The libraries quality was assessed using high sensitivity DNA chip on the BioAnalyzer (Agilent) according to the manufacturer’s protocol and Qubit v.2.0 (Thermo Fisher Scientific). Then, the libraries were sequenced using NovaSeq 6000 system.
Analysis of ribosome profiling data
One hundred bp single-end reads were processed by removing poly(A) sequences in each read, trimming the first 3 nucleotides and discarding reads shorter than 15 nucleotides (Cutadapt v2.5). Reads mapping on the collection of M. musculus rRNAs (from the SILVA rRNA database) and tRNAs (from the Genomic tRNA database) were removed. The remaining reads were aligned to the mouse genome (GRCm39) using the Gencode M28 gene annotation based on ENSEMBL release 105. Antisense and duplicate reads were removed. All alignments were performed with STAR (v2.5.3a).
The ribosome occupancy for each gene has been computed using the riboWaltz R package (v1.2.0)80 and collapsing all isoforms of the same transcript. Only genes with gene count > 1 in all the replicates of at least 1 condition were kept for subsequent analysis. To remove possible size or compositional differences between libraries coming from multiple conditions, gene counts were normalized using the trimmed mean of M-values normalization method (TMM) implemented in the edgeR Bioconductor package (v3.32)81. Differential analyses were performed with generalized linear models implemented in edgeR (glmQLFTest function) and genes with significantly different ribosome occupancy were selected with a triple threshold on the log2 fold change (absolute value > 0.75), the correspondent statistical significance (P < 0.05) and mean CPM > 0.05 for both conditions.
RNA extraction and quantitative real-time PCR
RNA was isolated from tissues and cells using TRIzol (Ambion, Life technologies; 15596026). cDNA was synthesized by using IMPROM II kit (Promega; A3800) according to the manufacturer’s instructions. qPCR reactions were performed using GoTAQ qPCR Master Mix (Promega; Cat. A6002) on Step One Real-Time PCR systems (Applied Biosystems). Each expression value was calculated using the ΔΔCT method82 and normalized to 18S, Actinb or Gapdh level as reference. The primer sequences were obtained by the Primer bank database (http://pga.mgh.harvard.edu/primerbank/index.html) and are listed in Supplementary Table 3.
RNA immunoprecipitation
Cells at 70% confluency are lysed in RNA immunoprecipitation (RIP) buffer (20mM Tris-HCl pH 7.5, 200mM NaCl, 5mM MgCl2, 0.5% Triton X-100, protease/phosphatase inhibitor cocktail, 800U RiboLock RNase inhibitor (Thermo Fisher Scientific; EO0381), 10% BSA, 0.5 μM DTT). IgG control (Cell Signaling Technology; 2729S), eIF4E (Thermo Fisher Scientific; MA1089), and p-Ser209 eIF4E (Abcam; ab76256) were incubated with Dynabeads Protein G (Thermo Fisher Scientific; 10004D) for 2.5 hours. RNA immunoprecipitation was conducted by incubating the antibody-Dynabeads complex with the cell lysates for 30 minutes at 4°C in rotation. After the immunoprecipitation, three washes with RIP buffer were performed. The resulting elution was divided for protein extraction or RNA extraction by Trizol (Ambion, Life technologies; 15596026).
Cap column pull-down
500 μg of proteins were incubated with 50 μl of m7GTP agarose (Jena Biosciences), in a total volume of 1 ml cap pull-down buffer (50 mM MOPS-KOH, pH 7.4, 100 mM NaCl, 0.5mM EDTA, 0.5 mM EGTA, 7 mM β-mercaptoethanol, 0.5 mM PMSF, 1 mM Na3VO4, and 0.1 mM GTP, 1X protease/phosphatase inhibitor cocktail), for 90 min at 4°C with rotation. The beads were washed three times in cap pull-down buffer. The cap-bound fraction was eluted in 50 μl of 2X SDS sample buffer by boiling at 70°C for 10 min, followed by western blotting.
Western blotting
Proteins from tissue and cell lysates were extracted with RIPA buffer (Cell Signaling Technology; 9806) supplemented with Phenylmethanesulfonylfluoride (PMSF; Millipore Sigma, catalog 329-98-6) and Pierce Protease and Phosphatase Inhibitor Mini Tablets (Thermo Fisher Scientific; A32959). Protein concentration was measured using a BCA Protein Assay Kit (Thermo Fisher Scientific; 23227). The same amounts of proteins underwent electrophoresis by SDS–PAGE and were transferred onto a 0.45 mm nitrocellulose membrane (Thermo Fisher Scientific; 88018). Membranes were probed with diluted antibodies and incubated overnight at 4 °C. The primary antibodies are listed in the Reporting Summary. Secondary antibodies conjugated to horseradish peroxidase (HRP) anti-rabbit IgG (Promega; W4011, 1:5000) or anti-mouse IgG (Cell signaling Technology; W4021, 1:5000) were used. The protein band signals were developed using the ECL Western Blotting Substrate (Thermo Fisher Scientific; 32106). Membranes were exposed to the Fusion Solo S imaging system (Vilber). Blots were analyzed for the densitometry analysis using ImageJ 1.52 (National Institutes of Health).
Patients-derived samples and Human Tissue Microarrays
CRPC plasma (collected as described in6) and PDX-derived organoids (generated as described in83 84) were obtained from patients identified from a population of men with CRPC treated at the Royal Marsden NHS Foundation Trust. All patients had given written informed consent and were enrolled in institutional protocols approved by the Royal Marsden NHS Foundation Trust Hospital (London, United Kingdom) ethics review committee (reference No. 04/Q0801/60)
Human Tissue Microarray (TMA) samples of Cohort 1 were obtained and processed from Universitatsspital Zurich (USZ)85. Three independent TMA, ZTMA76, ZTMA80, and ZTMA204, were stained with the antibodies listed in the Reporting Summary.
Human TMA samples of Cohort 2 were obtained and processed from the University of Padova. Five independent TMA were stained with the antibodies listed in the Reporting Summary.
All patients had given written informed consent and were enrolled in institutional protocols approved by the Padova Province (Padova, Italy) Clinical Experimentation Ethics Committee (reference no. 5480/AO/22). Patients did not receive compensation.
Statistics & Reproducibility
Data analyses were carried out using GraphPad Prism version 7 or Microsoft Excel 2018. The data are mean ± SD or SEM where indicated. Two-sided, paired or unpaired t-test, according to the experimental setting, was used to compare two groups in the indicated experiments. One-way ANOVA with Tukey post-hoc test was used to compare three or more groups in the indicated experiments. The correlation between p-eIF4E, PDCD4 and CD33 status with HGF, SPP1 and BGN was performed using the chi-squared tests with Yates correction86. The survival probability of Figure 8g and 8h was calculated using the log-rank test. Normality test was calculated using GraphPad for most of the datasets. Otherwise, data were assumed to be normally distributed. No statistical method was used to predetermine sample size. Group sizes were determined based on the results of preliminary experiments. No data points were excluded from the analysis. All samples meeting proper experimental conditions were included in the analysis. Group allocation was performed in a randomized fashion. Data collection and analysis were not performed blind to the conditions of the experiments.
Further information on research design is available in the Nature Research Reporting Summary linked to this article.
Extended Data
Extended Data Fig. 1. Polysome profiling analysis in Pten null-driven prostate cancer.
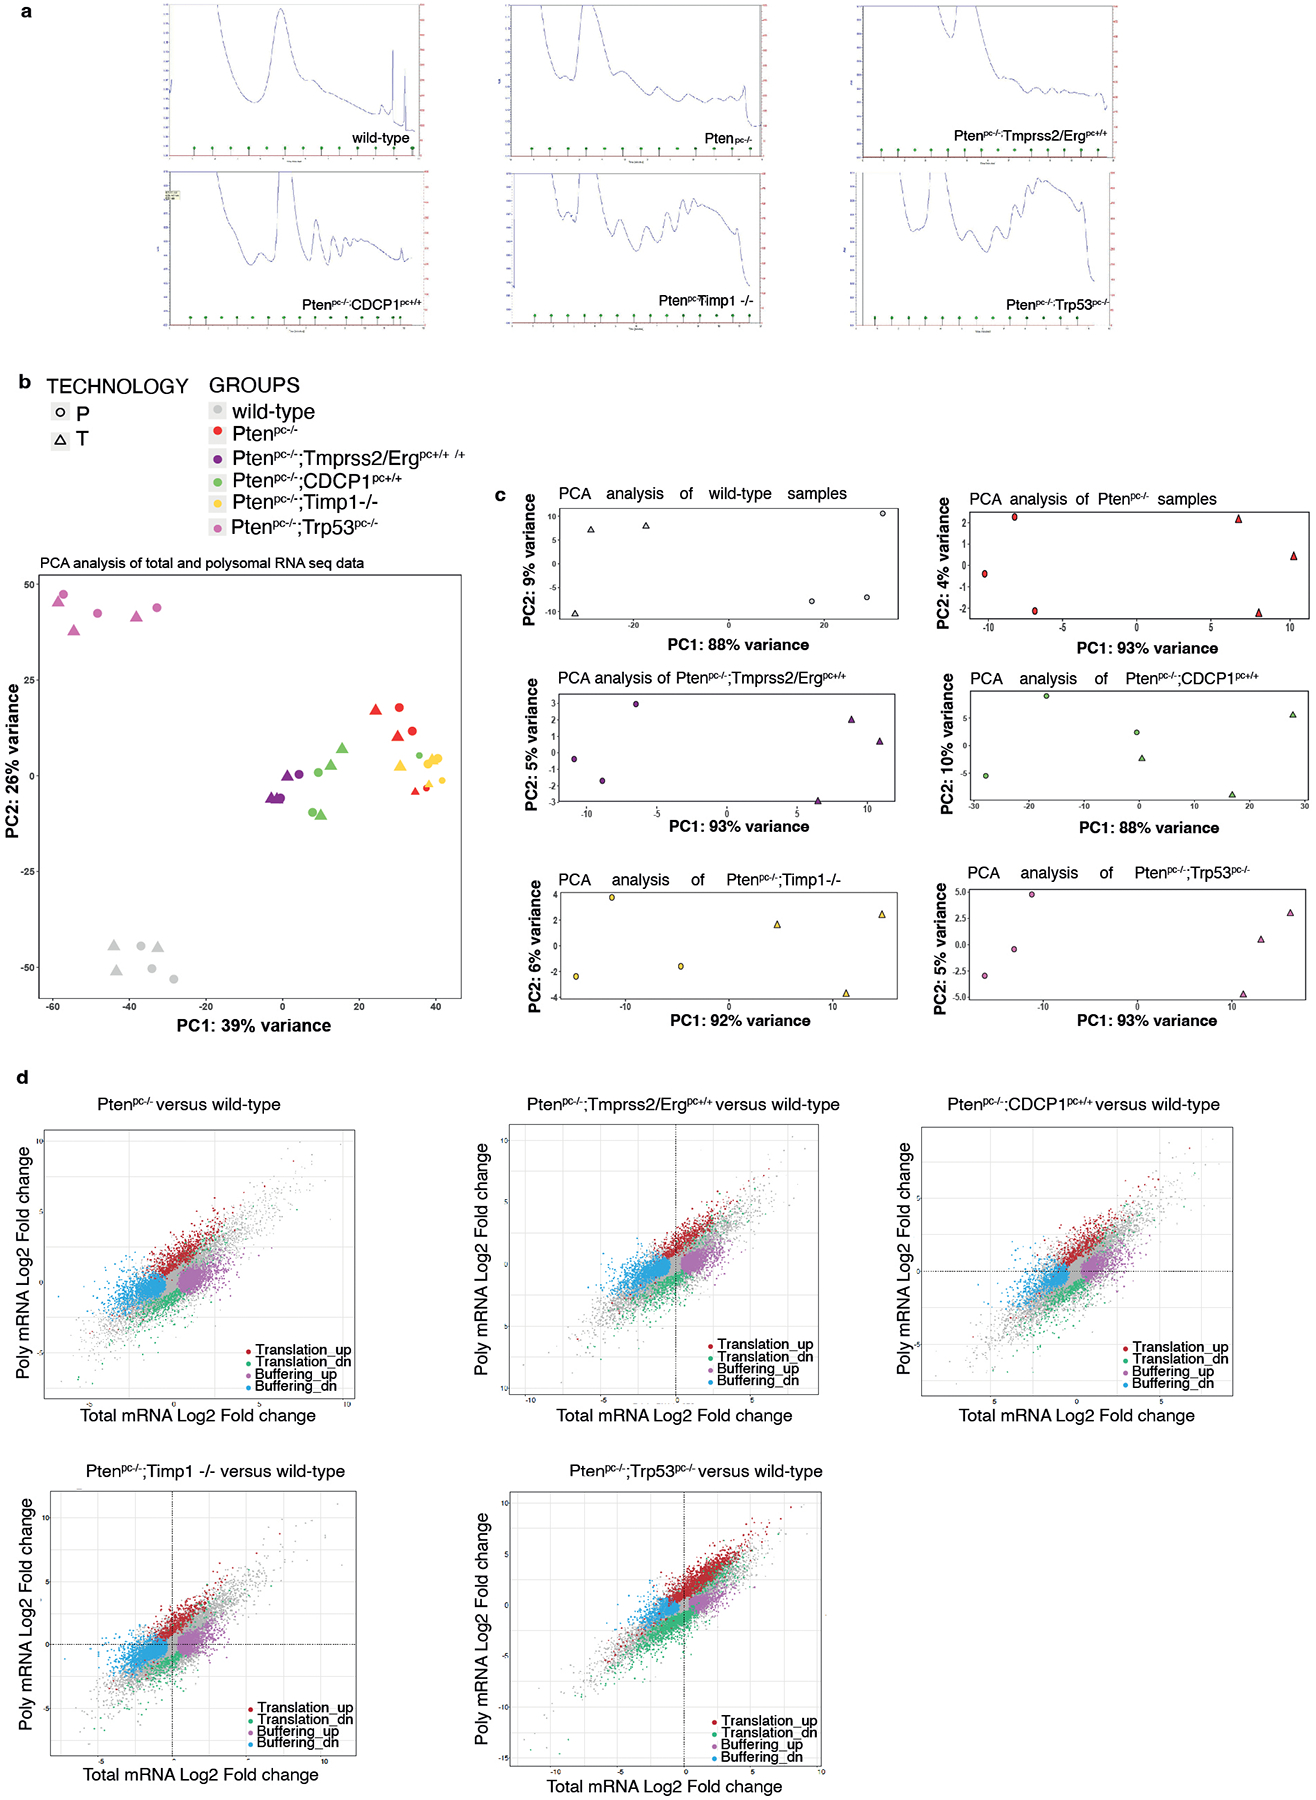
a, Polysome profiles of wild-type prostate, Ptenpc−/−, Ptenpc−/−;TMPRSS2/Ergpc+/+, Ptenpc−/−;CDCP1pc+/+, Ptenpc−/−;Timp1−/− and Ptenpc−/−;Trp53pc−/− prostate cancer. RNA-seq was performed on polysome-bound RNAs and total RNA derived from the prostate of three mice for each genetic background for a total of 18 samples. b, PCA plots of total (T) and polysomal RNA (P) fractions for each analyzed genetic background (n = 3 mice for each genetic background for a total of 18 samples). c, PCA plots of total and polysomal RNA fractions for each genetic background analyzed, corrected for the batch effect (n = 3 mice for each genetic background for a total of 18 samples). d, Scatter plots of fold-changes for polysome-associated and total mRNA levels for the comparisons between the indicated genetic backgrounds and wild-type prostates showing mRNAs with upregulated translation efficiency (red), downregulated translation efficiency, buffering up (pink), buffering down (blue) (n = 3 mice for each genetic background for a total of 18 samples). Details are provided in Supplementary Table 1 and Supplementary Table 2.
Extended Data Fig. 2. Polysome profiling analysis in Pten null-driven prostate cancer and bone marrow-derived MDSCs.
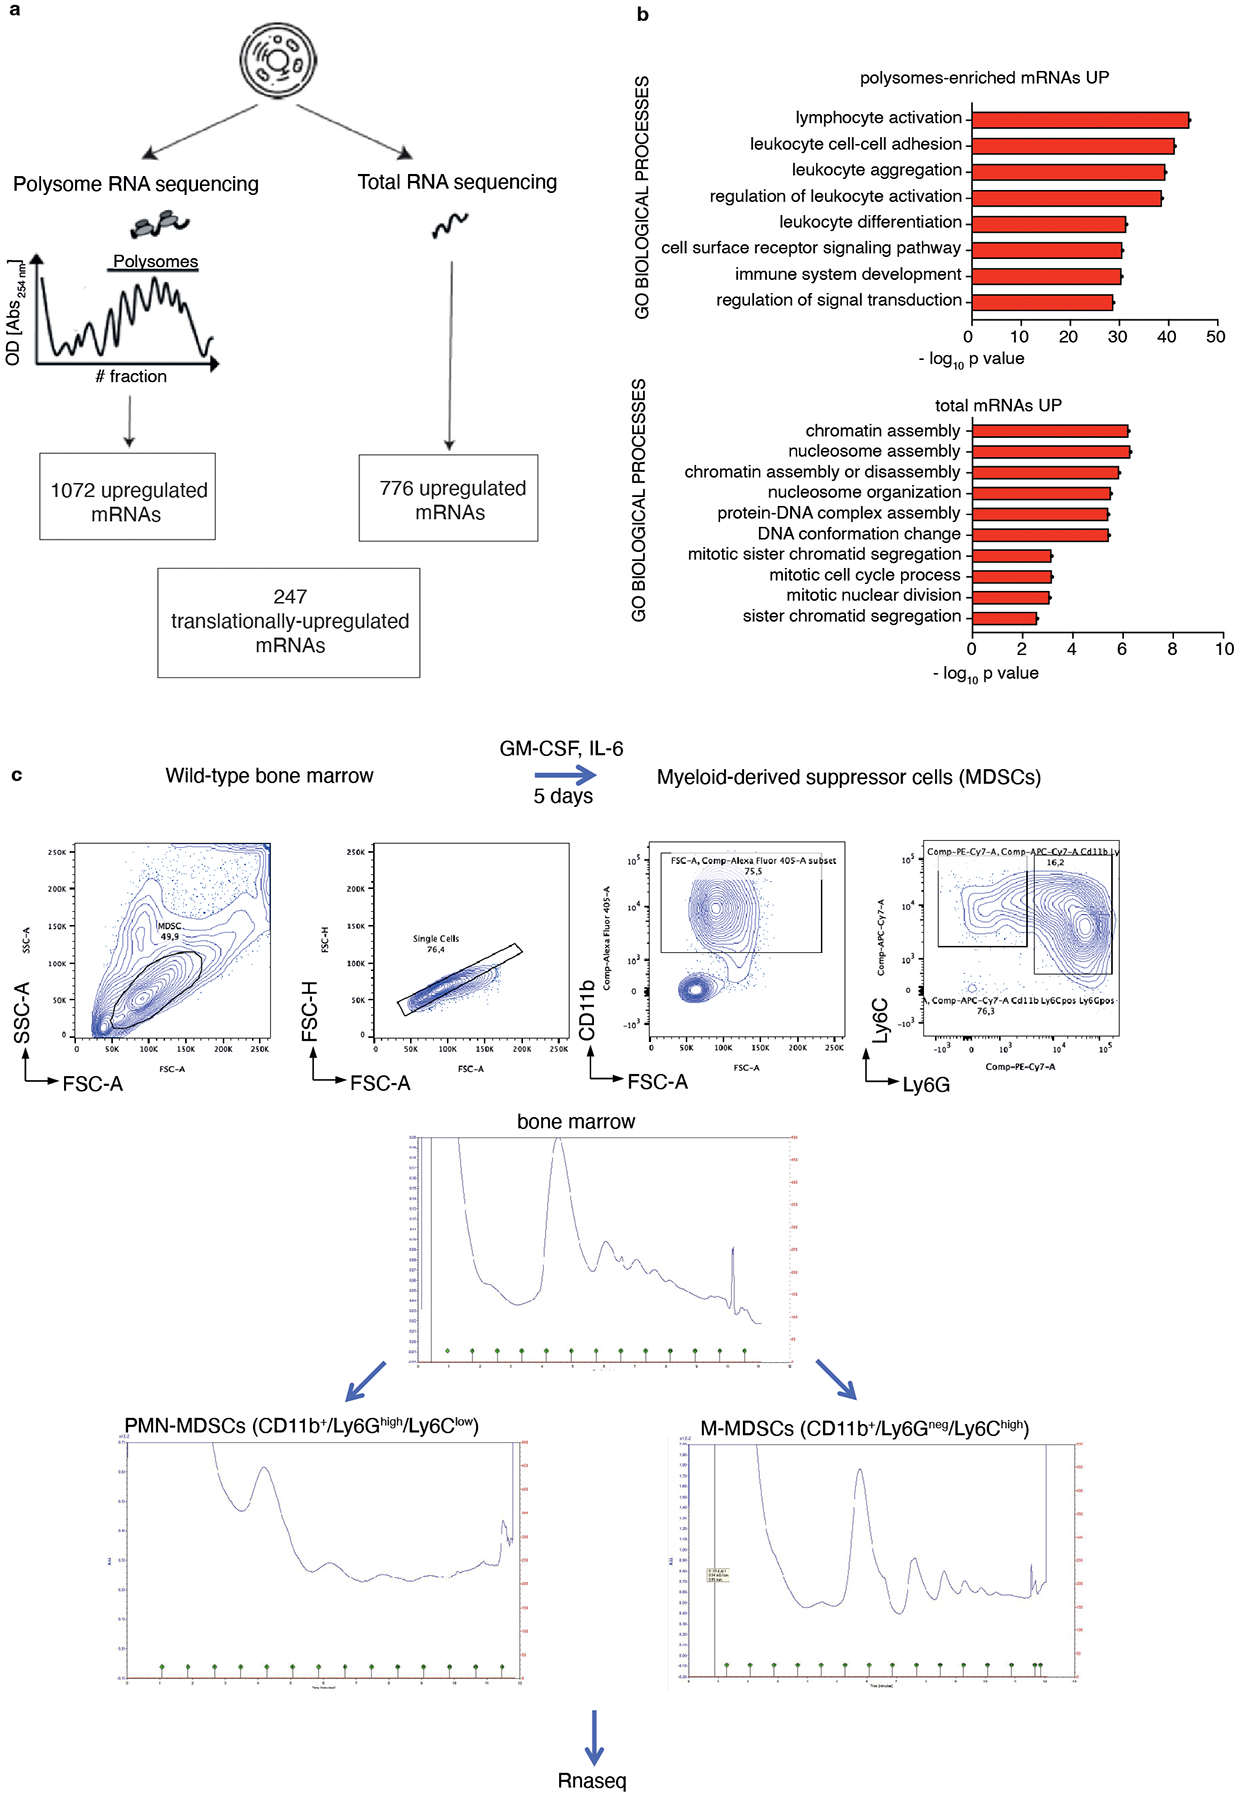
a, Schematic representation of the polysome profiling analysis performed by selecting mRNAs changes in common among the five different genetic backgrounds analyzed (Ptenpc−/−, Ptenpc−/−; TMPRSS2/Ergpc+/+, Ptenpc−/−;CDCP1pc+/+, Ptenpc−/−;Timp1−/− and Ptenpc−/−;Trp53pc−/− prostate cancer) and wild-type prostate. Using this approach, 1072 polysomes-bound mRNAs were upregulated in the polysomal RNA pool (threshold Log2 FC > 1.0; FDR < 0.05), 776 total mRNA were upregulated in the total RNA pool (threshold Log2 FC > 1.0; FDR < 0.05) and 247 mRNAs were found translationally up-regulated (threshold for polysomal mRNA expression Log2 FC ≥ 1.0; FDR < 0.05: threshold for translation efficiency Log2 FC ≥ 0.5; FDR < 0.1) in each genetic background compared to wild-type prostate. b, Gene Ontology biological processes enriched among the upregulated mRNAs in the polysomes-bound pool (upper panel) and in the total RNA pool (lower panel) in Ptenpc−/−, Ptenpc−/−; TMPRSS2/Ergpc+/+; Ptenpc−/−;CDCP1pc+/+, Ptenpc−/−;Timp1−/− and Ptenpc−/−;Trp53pc−/− prostate cancer compared to wild-type prostate, determined by DAVID software (n = 3 mice for each genetic background for a total of 18 samples). Log10 adjusted p-values by using the linear step-up method of Benjamini is reported. c, Scheme of the differentiation protocol of bone marrow-derived MDSCs; FACS plot of the gating strategy of bone marrow-derived MDSCs, sorted in CD11b+/Ly6Ghigh/Ly6Clow PMN-MDSCs and CD11b+/Ly6Gneg/Ly6Chigh M-MDSCs after 5 days of differentiation with 40 ng/ml GM-CSF and 40 ng/ml IL-6 in RPMI plus 10% FBS medium (top); polysome profiles of undifferentiated bone marrow (middle) CD11b+/Ly6Ghigh/Ly6Clow PMN-MDSCs (bottom left) and CD11b+/Ly6Gneg/Ly6Chigh M-MDSCs (bottom right). RNA-seq was performed on polysome-bound RNAs and total RNA derived from three biological replicates.
Extended Data Fig. 3. BGN, SPP1 and HGF are upregulated in Pten null-driven prostate cancer compared to wild-type prostate.
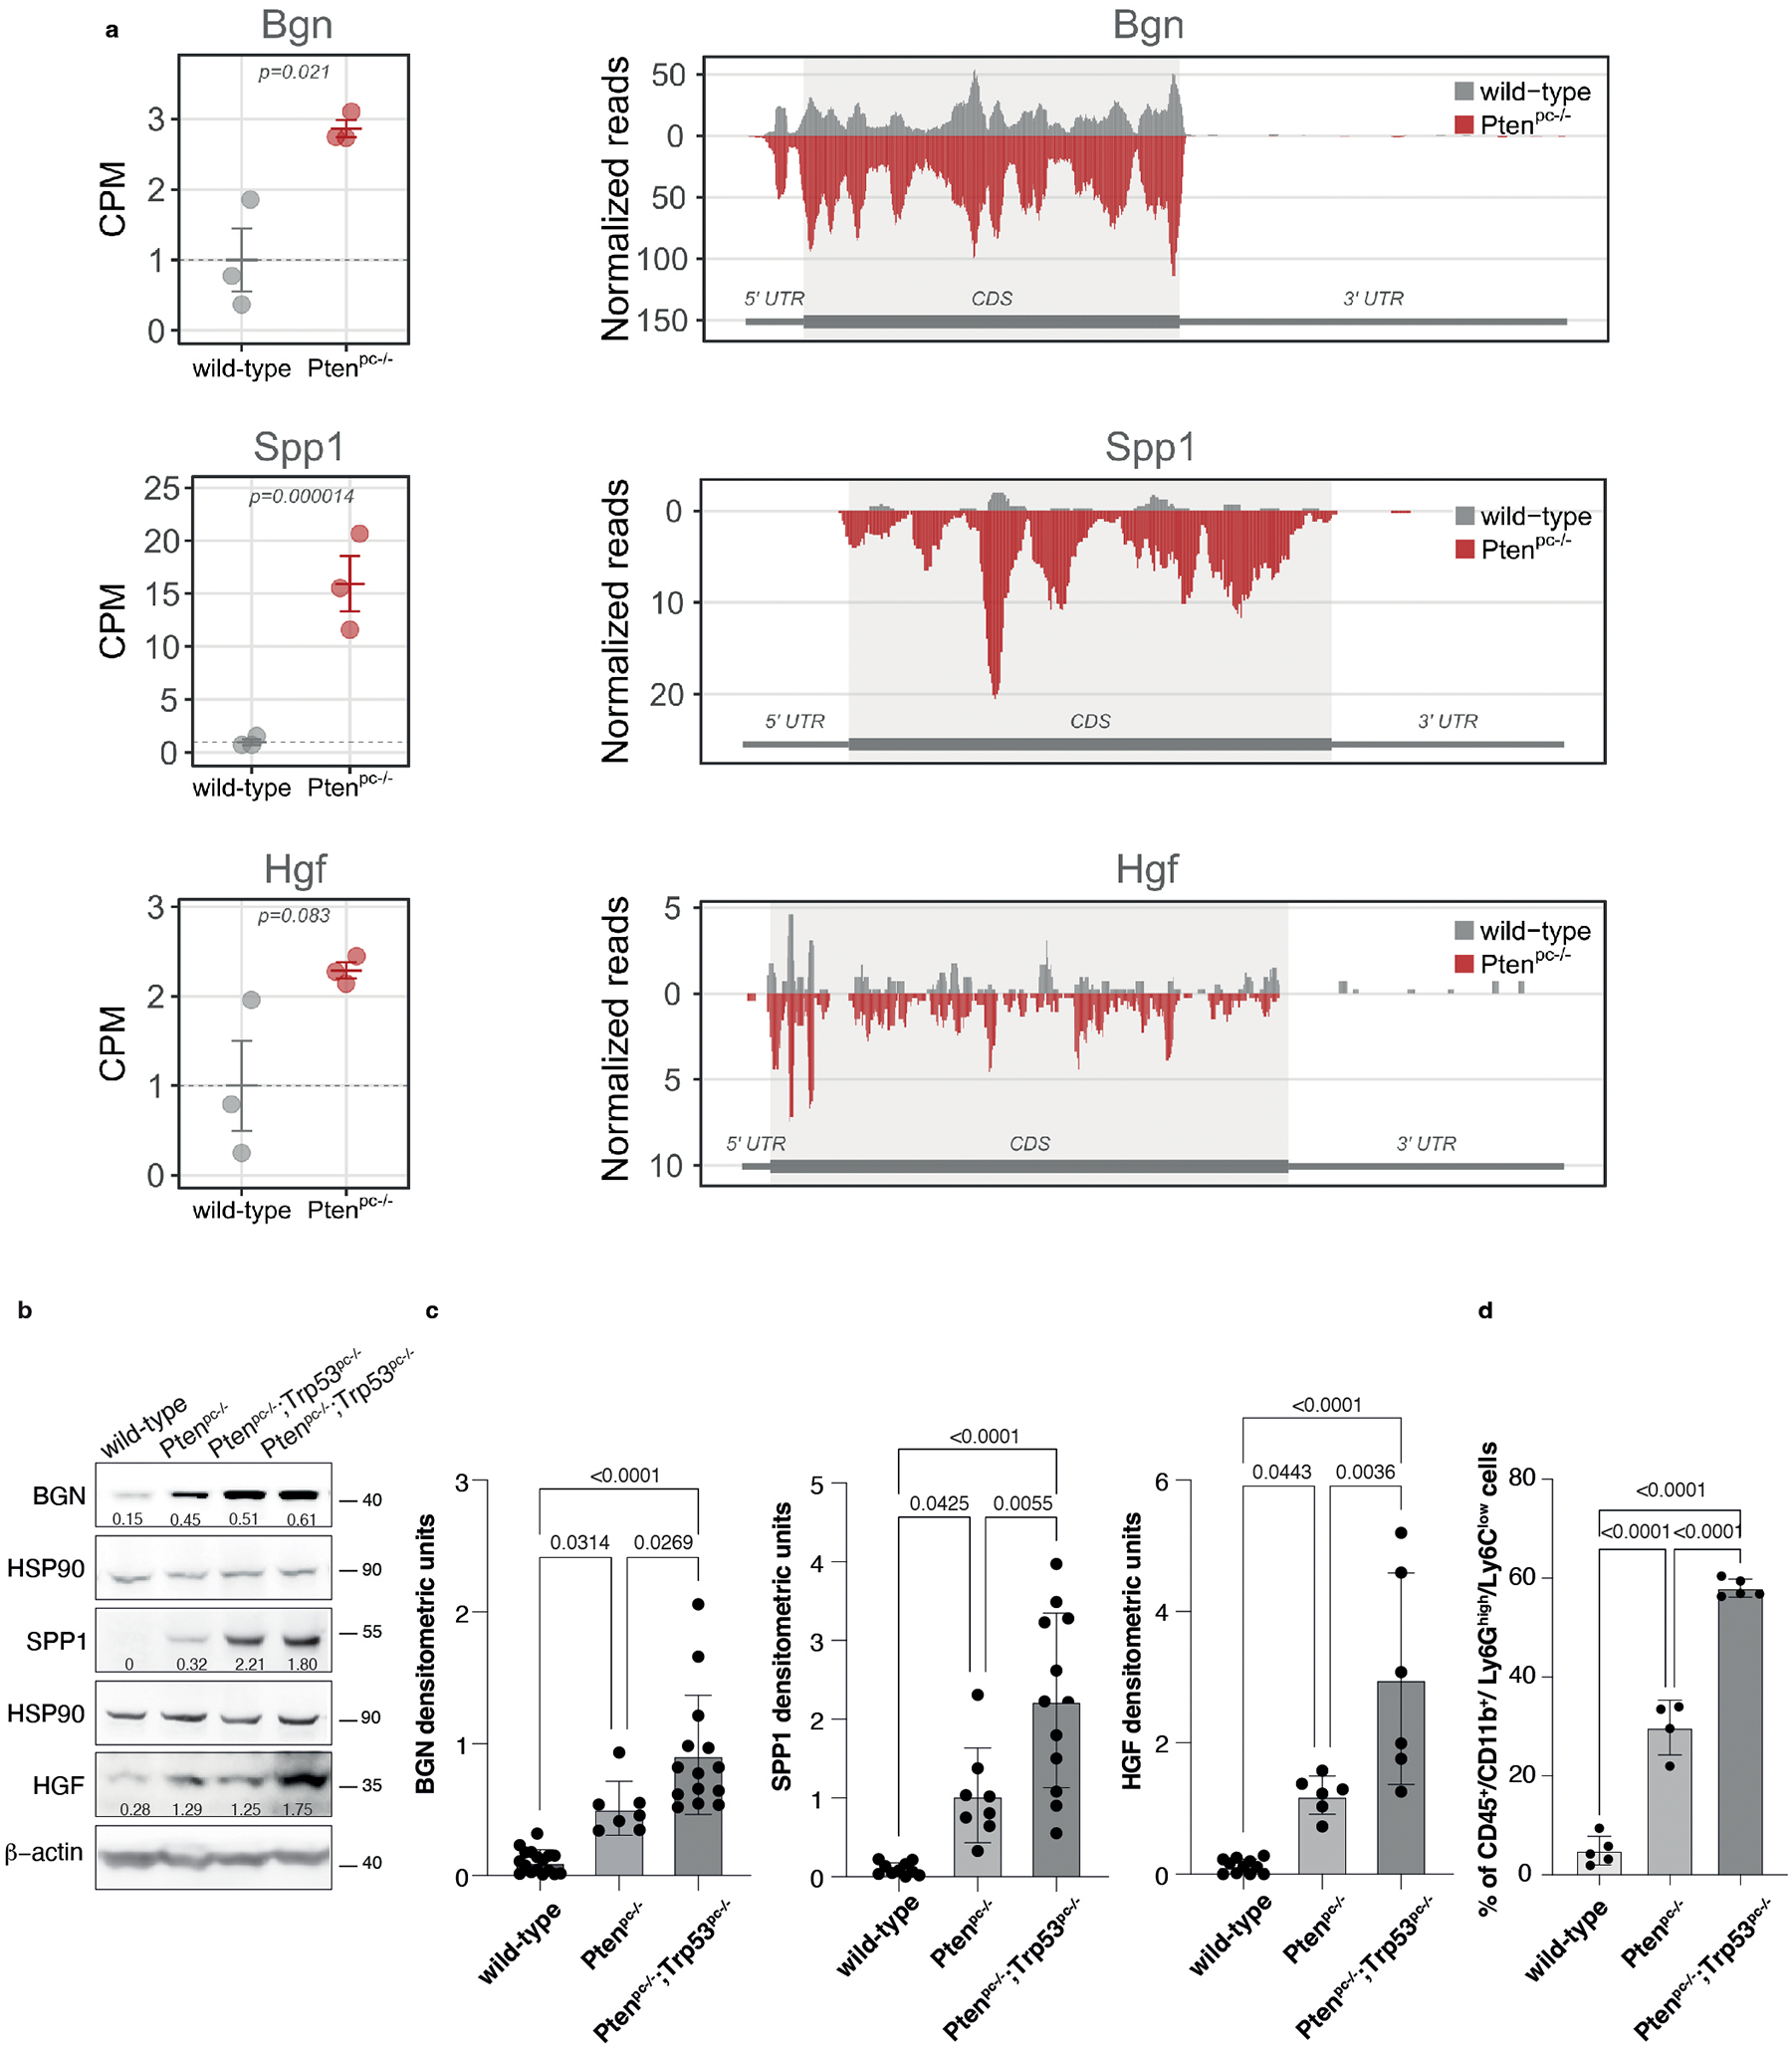
a, Graphs showing the CPM of Bgn, Spp1 and Hgf in wild-type prostate and Ptenpc−/− prostate cancer determined by Ribo-seq analysis (left panel). Data are presented as mean values +/− SEM of n = 3 mice for each genotype. P values were computed by one-tailed quasi-likelihood F-test and are indicated at the top of the graph. Ribosome occupancy in wild-type prostate (grey) and Ptenpc−/− prostate cancer (red) determined by Ribo-seq analysis (right panel). Each profile represents the mean normalized coverage among n = 3 mice for each genotype. The structure of the transcript, showing the boundaries of CDS and UTR regions, is outlined below each profile. b, Western blot showing the protein levels of BGN, SPP1 and HGF in wild-type prostates, Ptenpc−/− and Ptenpc−/−;Trp53pc−/− prostate cancers. Densitometry values normalized to the respective loading control are indicated for each band. See quantification for the indicated number of mice in Ext Data Fig. 3c. c, Densitometric analysis of BGN, SPP1 and HGF in wild-type prostates, Ptenpc−/− and Ptenpc−/−;Trp53pc−/− prostate cancers (from the left, BGN n = 17, n = 7, n = 14; SPP1 n = 10, n = 8, n = 12; HGF n = 11, n = 6, n = 6). Data are mean ± SD. d, Percentage of tumor-infiltrating CD45+/CD11b+/ Ly6Ghigh/Ly6Clow cells (PMN-MDSCs) in wild-type, Ptenpc−/− and Ptenpc−/−;Trp53pc−/− prostate cancers (from the left, n = 5, n = 4, n = 5 derived from the analysis of Fig. 1a. Data are mean ± SD. Statistical analysis between all groups in (c) and (d): (ordinary one-way ANOVA followed by Tukey’s multiple comparisons test).
Extended Data Fig. 4. TLR2, CD44 and MET expression correlates with the PMN-MDSCs signature in human prostate cancer and CRPC.
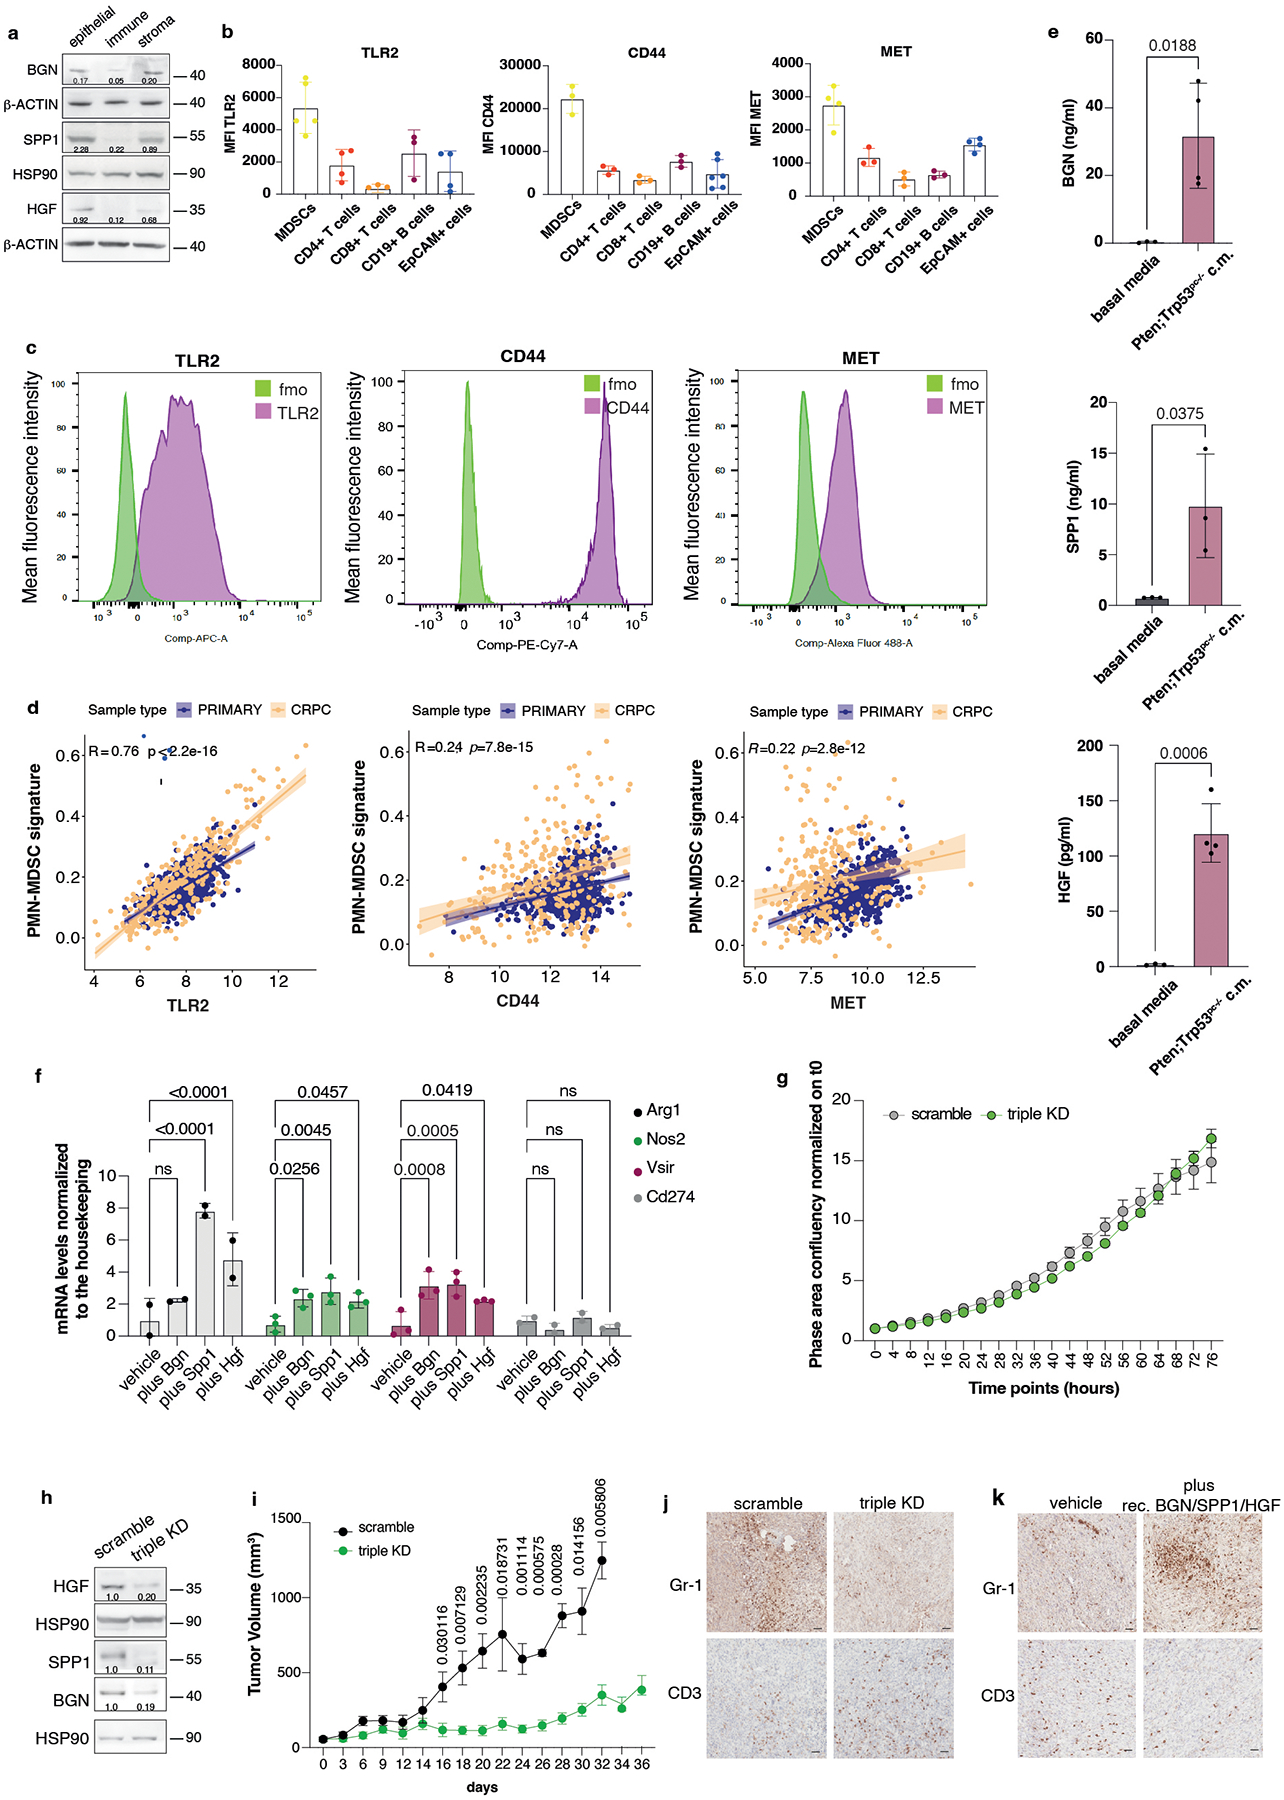
a, Western blot showing the protein levels of BGN, SPP1 and HGF in epithelial (EpCAM+ cells), immune (CD45+ cells) and stromal fraction (EpCAM-, CD45- cells) of Ptenpc−/−;Trp53pc−/− prostate cancer. Densitometry values normalized to the respective loading control are indicated for each band. The experiment was repeated two independent times with similar results. b, Mean fluorescence intensity (MFI) of the indicated receptors in tumor-infiltrating immune cells subsets and EpCAM+ cells in Ptenpc−/−;Trp53pc−/− prostate cancers. At least n = 3 biologically independent samples. Data are mean ± SD. c, FACS plots of TLR2, CD44 and MET receptor expression in bone marrow-derived MDSCs; green signal: MDSCs stained with fluorescence minus one control, violet signal: MDSCs stained with the specific antibody. d, Correlation of TLR2 (left panel), CD44 (middle panel) and MET (right panel) expression with the PMN-MDSCs signature in primary prostate cancer and CRPC. Pearson correlation and p value are indicated at the top of the graph. TLR2: 95 % confidence interval 0.734–0.785; CD44: 95 % confidence interval: 0.180–0.295; MET: 95 % confidence interval: 0.156–0.273 e, BGN, SPP1 and HGF protein levels determined in Pten−/−;Trp53−/− (RapidCap)-derived conditioned medium by ELISA assay. n = 3 biologically independent samples. Data are mean ± SD. Statistical analysis (unpaired two-sided Student’s t-test). f, Arg1, Nos2, Vsir and Cd274 mRNA expression levels in bone marrow-derived MDSCs pretreated with recombinant BGN, SPP1 and HGF for 24 hours. n = 2 (Arg1), n = 3 (Nos2), n = 3 (Vsir), n = 2 (Cd274) biologically independent samples Data are mean ± SD. Statistical analysis (two-way ANOVA followed by Dunnett’s multiple comparisons test). g, Growth curve of scramble and Hgf/Spp1/Bgn triple KD Pten−/−;Trp53−/− (RapidCap) cells. Data are mean ± SEM. The experiment was repeated two independent times with similar results. h, Western blot showing HGF, SPP1 and BGN protein levels in scramble and triple KD Pten−/−;Trp53−/− (RapidCap)- cell lines used for the in vivo experiments. Densitometry values normalized to the respective loading control are indicated for each band. i, Tumor growth of scramble and Hgf/Spp1/Bgn triple KD in Pten−/−;Trp53−/− (RapidCap) - allografts (for all groups, n = 5 in each group). Data are mean ± SEM. Statistical analysis (multiple unpaired student t test). j, Representative IHC of Gr-1 and CD3 in scramble and Hgf/Spp1/Bgn triple KD Pten−/−;Trp53−/− (RapidCap)- allografts. Scale bar 50 μm. (n = 5 mice in each group). k, Representative IHC of Gr-1 and CD3 in vehicle-treated (n = 4 mice) and recombinant Bgn/Spp1/Hgf-treated (n = 6 mice) TRAMP-C1 allografts. Scale bar 50 μm.
Extended Data Fig. 5. PDCD4 inhibits eIF4F complex formation and cooperates with eFT508 to reduce Hgf, Spp1 and Bgn levels.
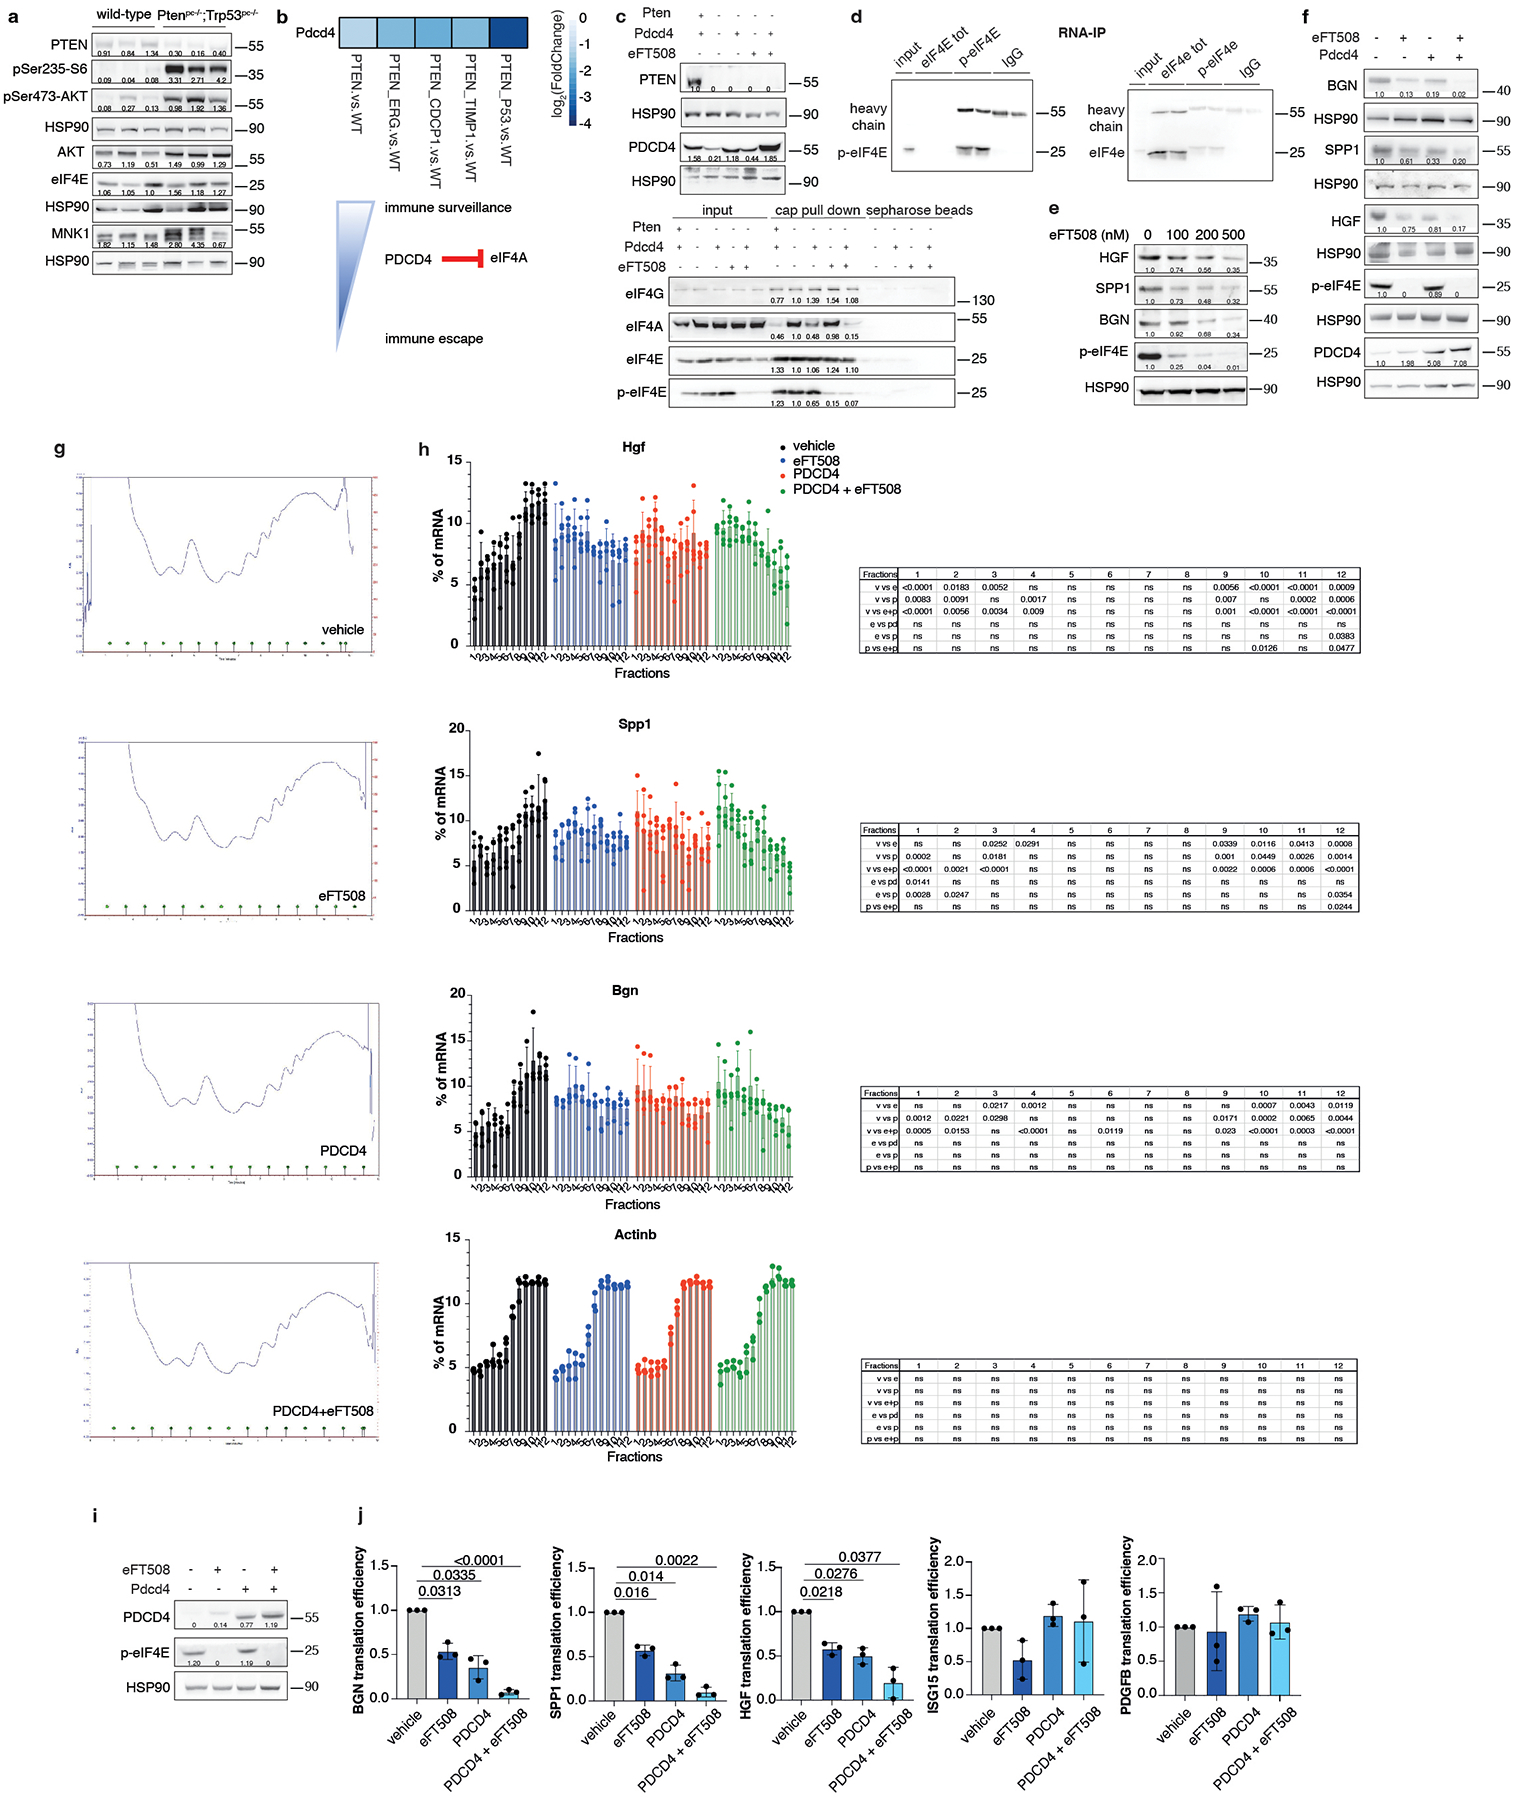
a, Western blot showing the protein levels of PTEN, pSer473-AKT, AKT total, pSer235-S6, eIF4E, MNK1 and representative HSP90 in wild-type prostate and Ptenpc−/−;Trp53pc−/− prostate cancer. The experiment was performed once with n = 3 mice for each group. b, Heatmap showing PDCD4 mRNA levels in the indicated genetic background of prostate cancer compared to wild-type prostate (total mRNA expression determined by RNA-seq). c, Western blot showing the levels of Pten and PDCD4 in the indicated settings (top). Cap pull-down assay showing the levels of eIF4G, eIF4A, eIF4E and p-eIF4E in input, cap pull-down and sepharose control beads. Densitometry values of the cap pull-down normalized to the input are indicated for each band (bottom). d, Western blot showing the levels of p-eIF4E and eIF4E after RNA immunoprecipitation with the respective antibody in Pten-sh TC1 prostate cancer cells. e, Western blot showing the levels of HGF, SPP1, BGN, p-eIF4E and representative HSP90 in Pten-sh TC1 cell line upon the indicated concentration of eFT508. f, Western blot showing the levels of HGF, SPP1, BGN, p-eIF4E, PDCD4 and representative HSP90 in Pten-sh TC1 cell line upon 500 nM eFT508 treatment and PDCD4 rescue. g, Polysome profiles of vehicle, 500 nM eFT508-treated, Pdcd4-overexpressing Pten-sh cells and eFT508-treated / Pdcd4-overexpressing Pten-sh cells. h, Distribution of Hgf, Spp1 and Bgn mRNA levels in the fractions derived from the sucrose gradient fractionation in Pten-sh TC1 cells, determined by qRT-PCR (n = 5 independent experiments for Hgf and Spp1; n = 4 independent experiments for Bgn; n = 3 independent experiments for Actinb). The percentages of Hgf, Spp1 and Bgn mRNA distributed in each fraction are shown. v= vehicle; e= eFT508; p=pdcd4; e+p=eFT508+pdcd4. Data are mean ± SD. Statistical analysis between all groups (ordinary two-way ANOVA followed by Tukey’s multiple comparisons test). i, Western blot showing the levels of PDCD4 and p-eIF4E in human PC3 prostate cancer cell line. j, Translation efficiency (polysomal mRNA expression/total mRNA expression) of HGF, SPP1, BGN, ISG15 and PDGFB upon 500 nM eFT508 treatment and PDCD4 rescue in human PC3 prostate cancer cell line (n = 3 independent experiments). Data are mean ± SD. Statistical analysis between all groups: (RM one-way ANOVA followed by Tukey’s multiple comparisons test). Densitometry values normalized to the housekeeping are indicated for each band in (a) and (e-f) and (i). The experiment was repeated at least two independent times with similar results in (c-f) and (i).
Extended Data Fig. 6. Prostate-specific Pdcd4 rescue inhibits tumor-infiltrating PMN-MDSCs and its loss is associated with decreased disease-free survival in human prostate cancer.
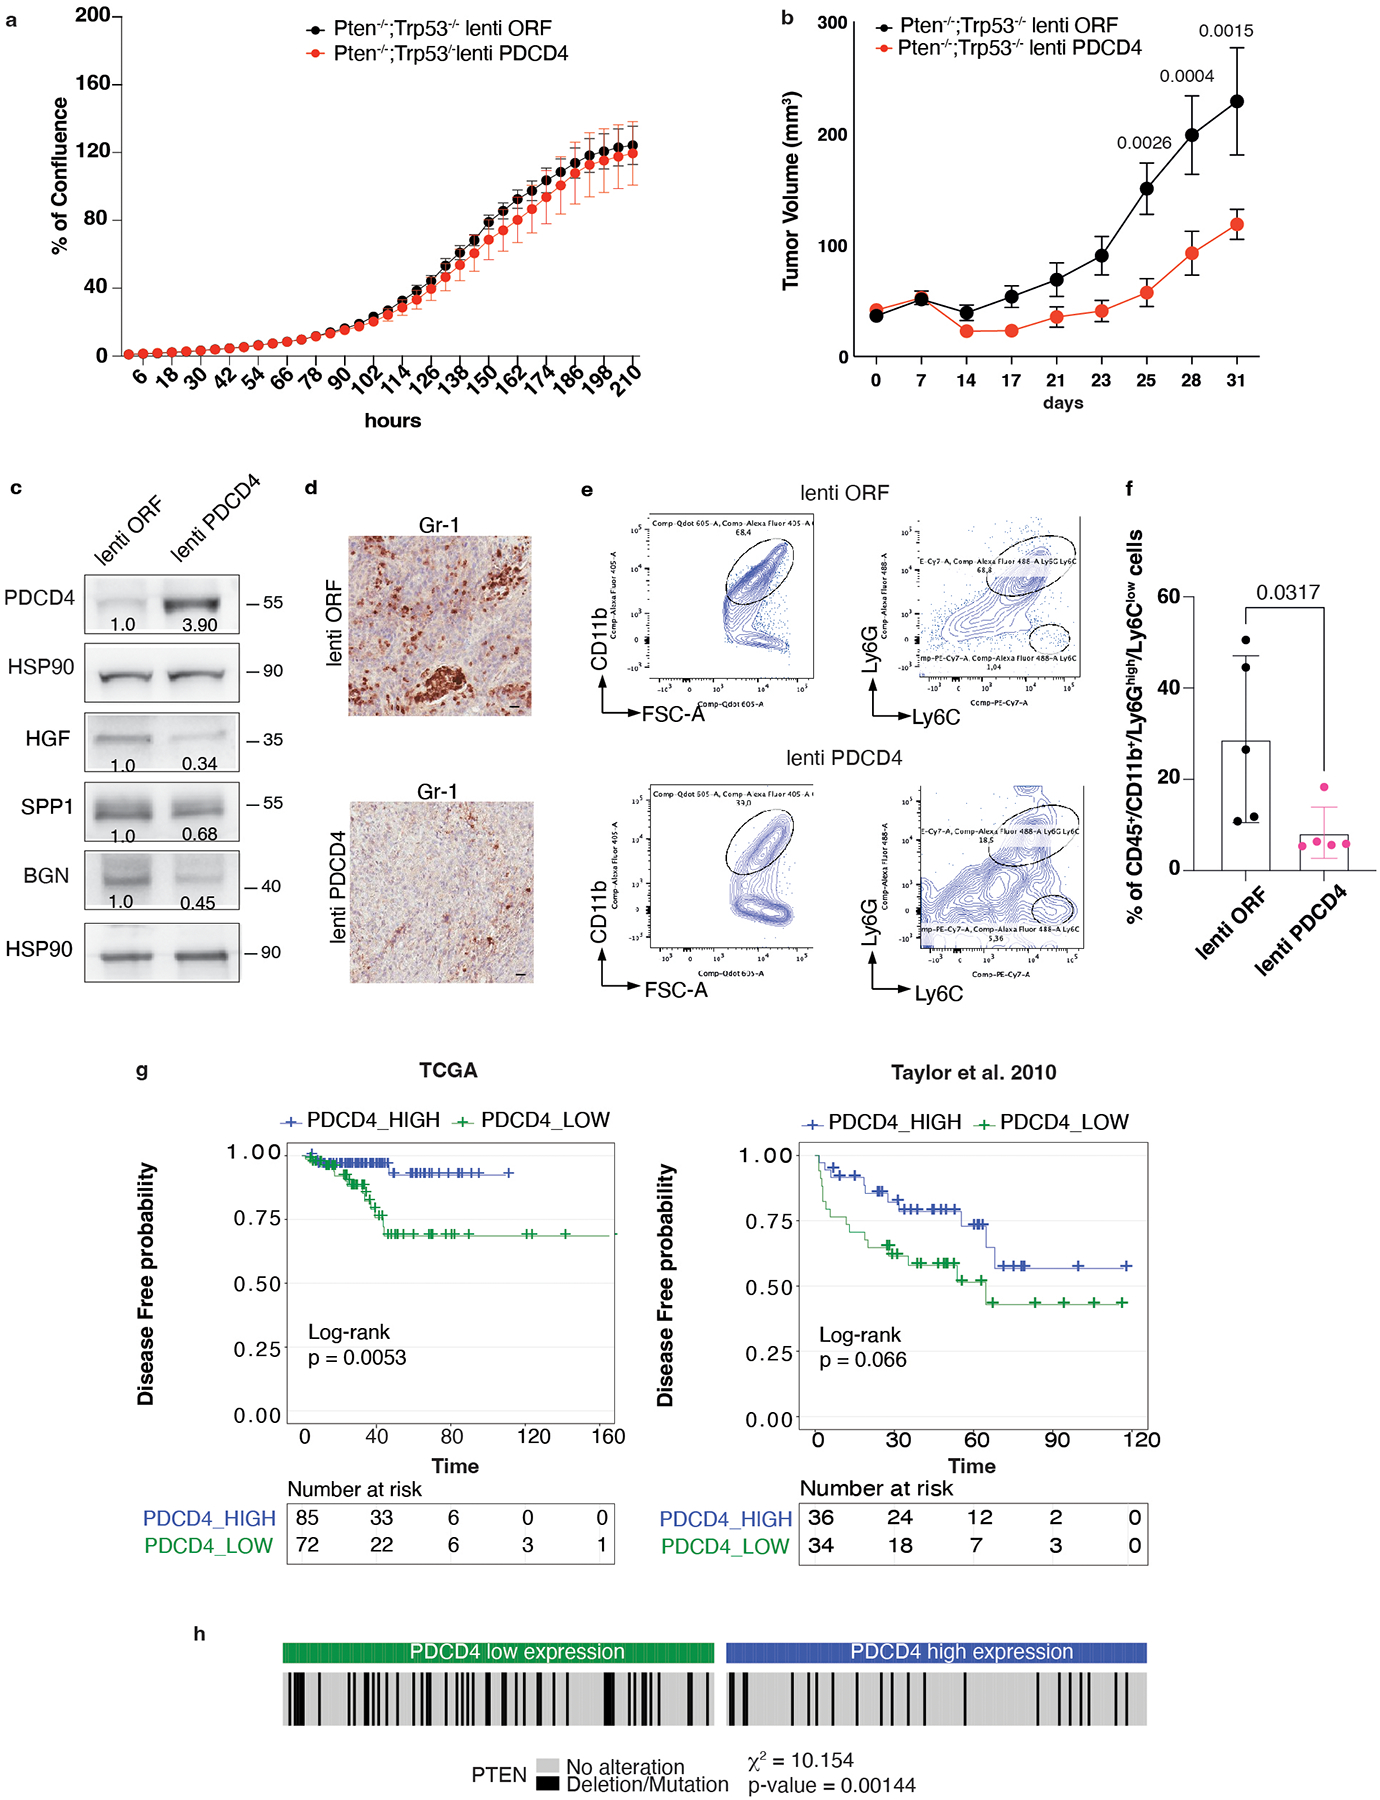
a, Growth curve of control vector (lenti ORF) and PDCD4 -overexpressing (lenti PDCD4) Pten−/−;Trp53−/− (RapidCap) prostate cancer cells, determined by the Incucyte system. Data are mean ± SEM. The experiment was repeated two independent times with similar results. b, Tumor growth of C57BL6 mice injected with 2.5 × 10⁶ control vector or PDCD4 -overexpressing Pten−/−;Trp53−/− (RapidCap) prostate cancer cells (lenti ORF n = 10; lenti Pdcd4 n = 7 mice). Data are mean ± SEM. Statistical analysis: (two way ANOVA followed by Šídák’s multiple comparisons test). c, Western blot showing the protein levels of PDCD4, SPP1, HGF, BGN and representative HSP90 in control vector and PDCD4 -overexpressing Pten−/−;Trp53−/− (RapidCap) murine prostate cancer cells. Densitometry values normalized to the housekeeping are indicated for each band. The experiment was repeated two independent times with similar results. d, Representative IHC of Gr-1-positive cells in control vector or PDCD4 -overexpressing Pten−/−;Trp53−/− (RapidCap) allografts. Scale bar 50 μm. (n = 5 mice in each group). e, Representative FACS plot of CD45+/CD11b+/Ly6Ghigh/Ly6Clow cells (PMN-MDSCs) inside the CD45+/CD11b+ population. f, Percentage of tumor-infiltrating CD45+/CD11b+/Ly6Ghigh/Ly6Clow (PMN-MDSCs) in control vector and PDCD4-overexpressing Pten−/−;Trp53−/− (RapidCap) allografts determined by flow cytometric analysis (n = 5 mice in each group). Data are mean ± SD. Statistical analysis (Mann-Whitney test). g, Correlation between PDCD4 mRNA levels and disease-free probability in the indicated human prostate cancer datasets. h, Correlation between PDCD4 mRNA expression levels and Pten deletion/mutation in the human prostate cancer TCGA dataset. Statistical analysis: chi-square test.
Extended Data Fig. 7. eFT508 inhibits translation of Hgf, Spp1 and Bgn and impairs PMN-MDSCs migration in prostate cancer.
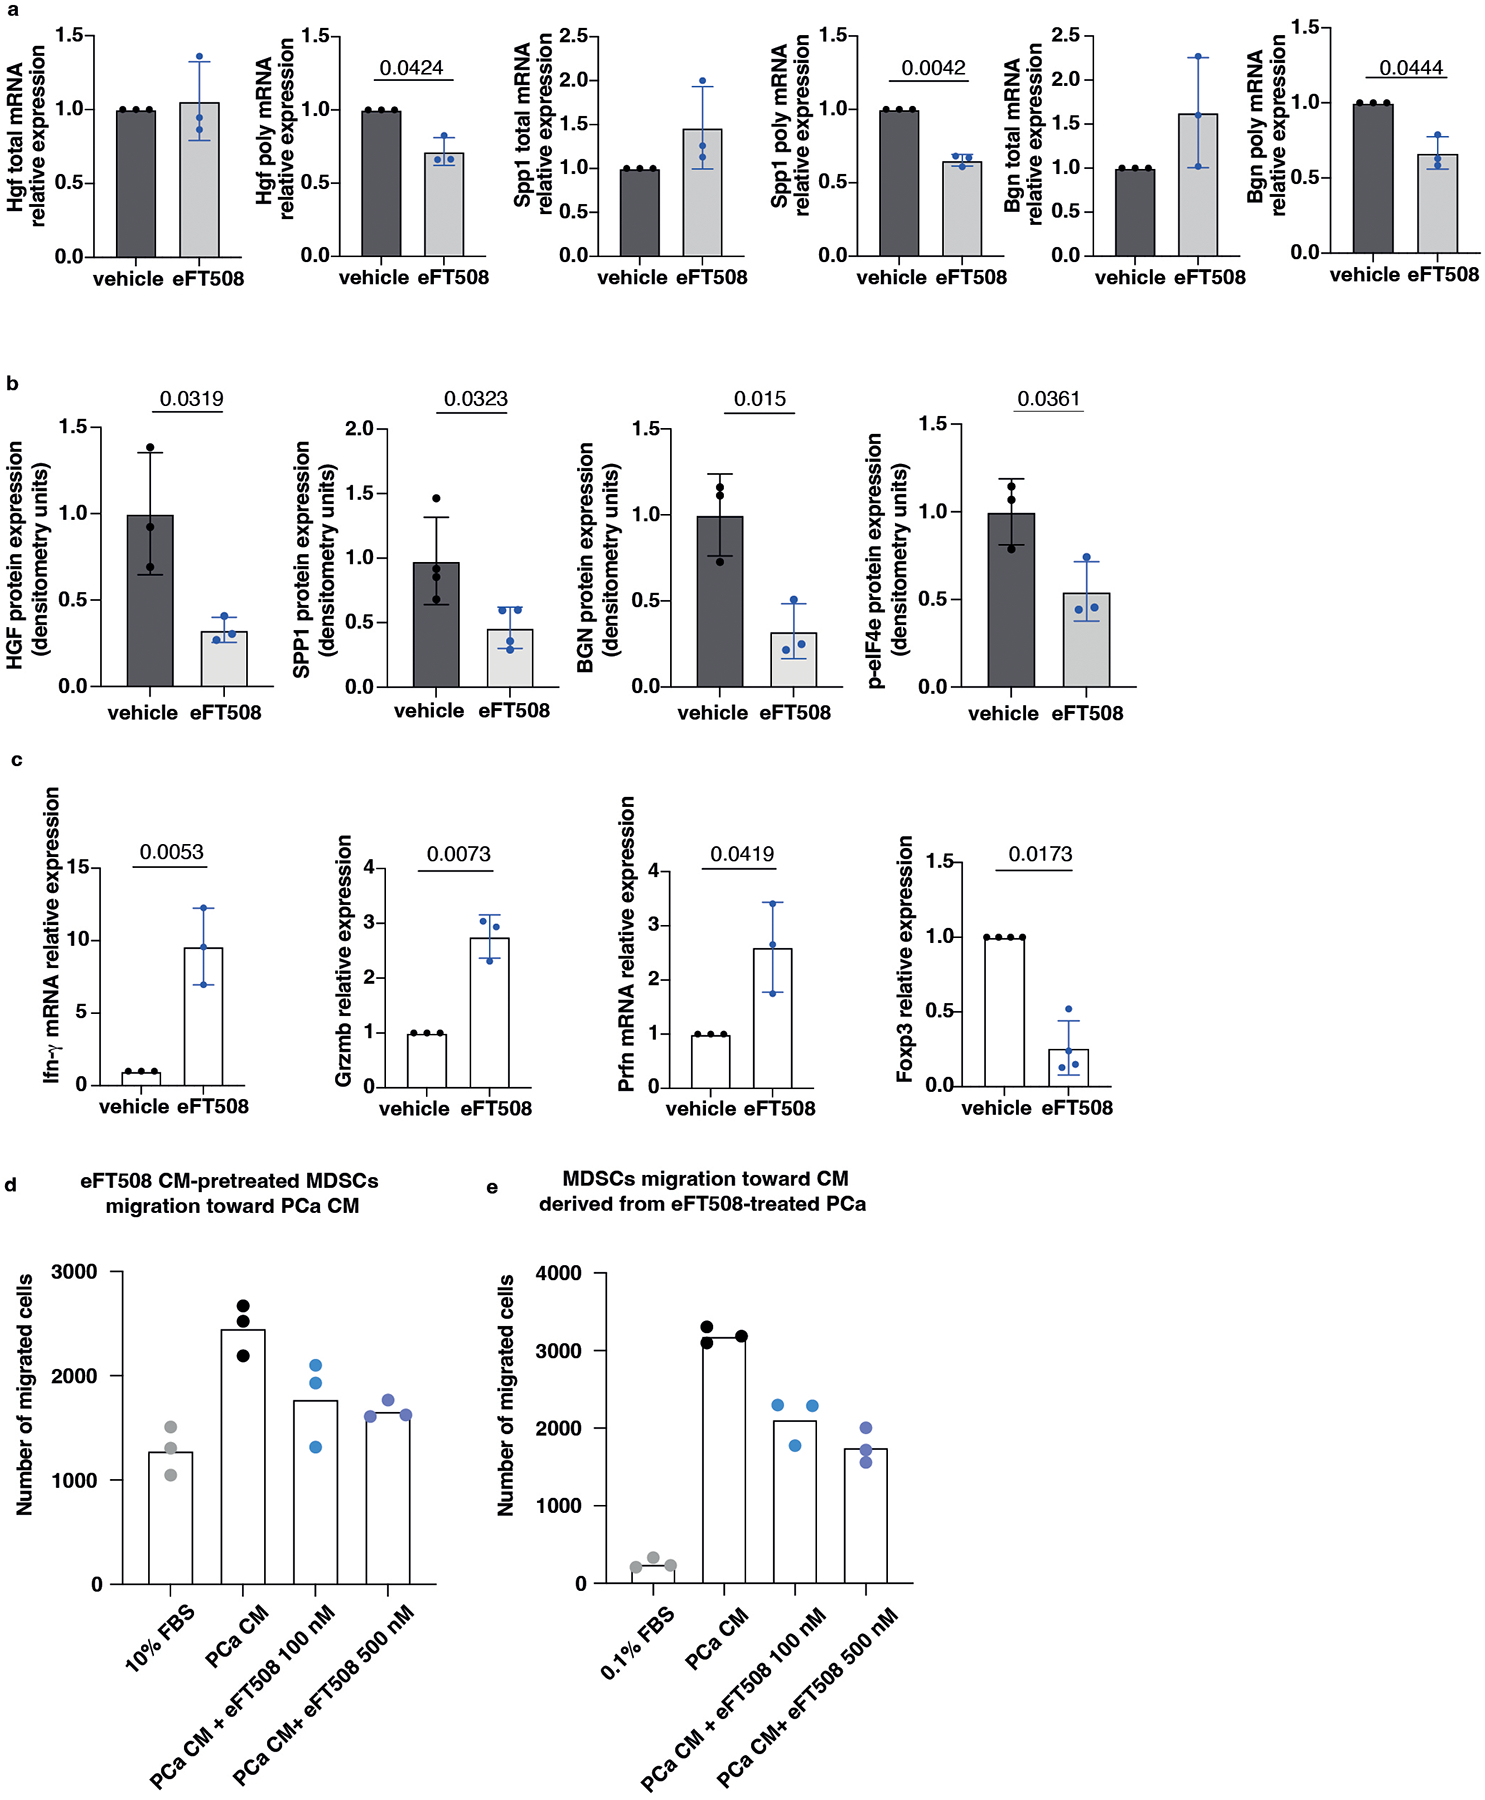
a, Hgf, Spp1 and Bgn mRNA levels in polysomes-bound mRNAs and total mRNAs fraction in prostate cancer of eFT508-treated and vehicle-treated Ptenpc−/−;Trp53pc−/− mice determined by qRT- PCR (n = 3 mice in each group). Data are mean ± SD. Statistical analysis (two-tailed ratio paired t-test). b, Densitometry of BGN, SPP1 and HGF protein expression levels in prostate cancer of eFT508-treated or vehicle-treated Ptenpc−/−;Trp53pc−/− mice (BGN and HGF, n = 3 mice ; SPP1, n = 4 mice). Data are mean ± SD. Statistical analysis (unpaired two-sided Student’s t-test). c, Ifng, Granzyme B (GrzmB), Perforin (Prfn) and FoxP3 mRNA levels in prostate cancer of eFT508-treated compared to vehicle-treated Ptenpc−/−;Trp53pc−/− mice determined by qRT- PCR (IFN-γ, GrzmB anf Prfn, n = 3 mice, Foxp3 n = 4 mice). Data are mean ± SD. Statistical analysis (two-tailed ratio paired t-test). d, Number of migrated MDSCs tested in a transwell migration assay: MDSCs, previously exposed to 10% FBS, vehicle, 100 nM or 500 nM eFT508-treated Ptenpc−/−;Trp53pc−/− (RapidCap)-derived conditioned media for 24 hours, were allowed to migrate through a 5 μm-transwell to the bottom well for 6 hours toward Pten−/−;Trp53−/− (RapidCap)-derived conditioned media. The number of migrated cells was determined by flow cytometric analysis. Experiment in technical replicates performed twice with similar results. e, Number of migrated MDSCs tested in a transwell migration assay: MDSCs were allowed to migrate through a 5 μm-transwell to the bottom well for 6 hours toward 0.1% FBS media, vehicle, 100 nM or 500 nM eFT508-treated Pten−/−;Trp53−/− (RapidCap)-derived conditioned media. The number of migrated cells was determined by flow cytometric analysis. Experiment in technical replicates performed twice with similar results.
Extended Data Fig. 8. eFT508 restores T cell activation in the Ptenpc−/−;Trp53pc−/− mouse model.
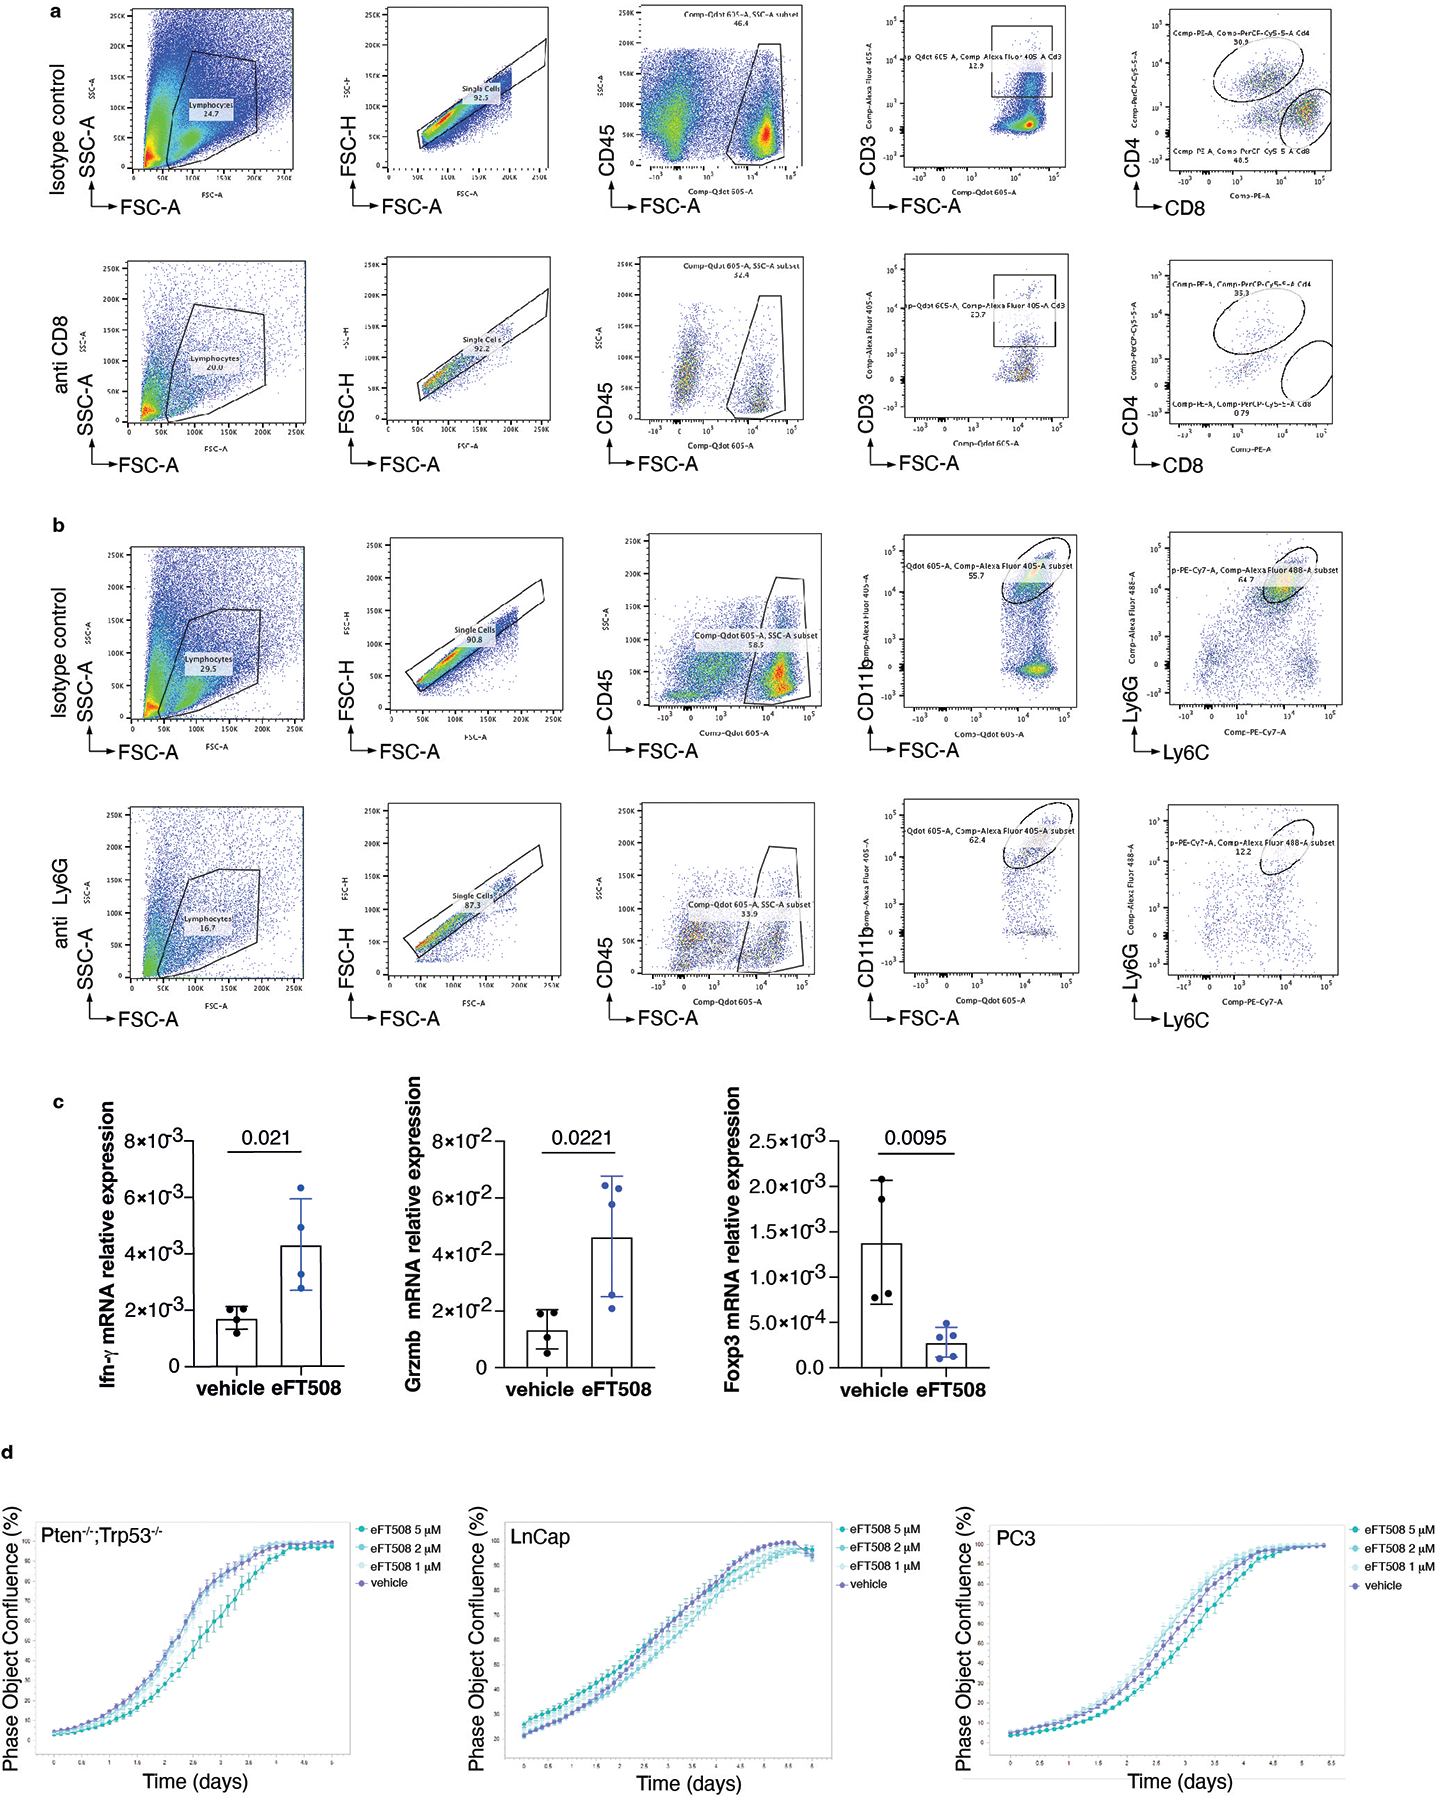
a, Representative FACS plots of the CD45+/CD3 population and CD45+/CD3+/CD8+ cells upon isotype control and anti-CD8 depleting antibody. b, Representative FACS plots of the CD45+/CD11b+ population and CD45+/CD11b+/Ly6Ghigh/Ly6Clow (PMN-MDSCs) upon isotype control and anti-Ly6G depleting antibody. c, IFN-γ, GrzmB and Foxp3 mRNA levels in eFT508-treated and vehicle-treated Pten−/−;Trp53−/− (RapidCap) allografts determined by qRT- PCR (vehicle group, n = 4; eFT508 group, n = 4, n = 5, n = 5 mice, respectively). Data are mean ± SD. Statistical analysis (unpaired two-sided Student’s t-test). d, Growth curve analysis of Pten−/−;Trp53−/− (RapidCap) murine prostate cancer cells, LnCap and PC3 human prostate cancer cell line treated with vehicle or 1 μM, 2 μM, 5 μM eFT508, determined by the Incucyte system. Data are mean ± SEM. The experiment was repeated two independent times with similar results.
Extended Data Fig. 9. AKT inhibition increases PDCD4 levels and cooperates with eFT508 to reduce HGF, SPP1 and BGN protein levels in Pten−/−;Trp53−/− prostate cancer cells.
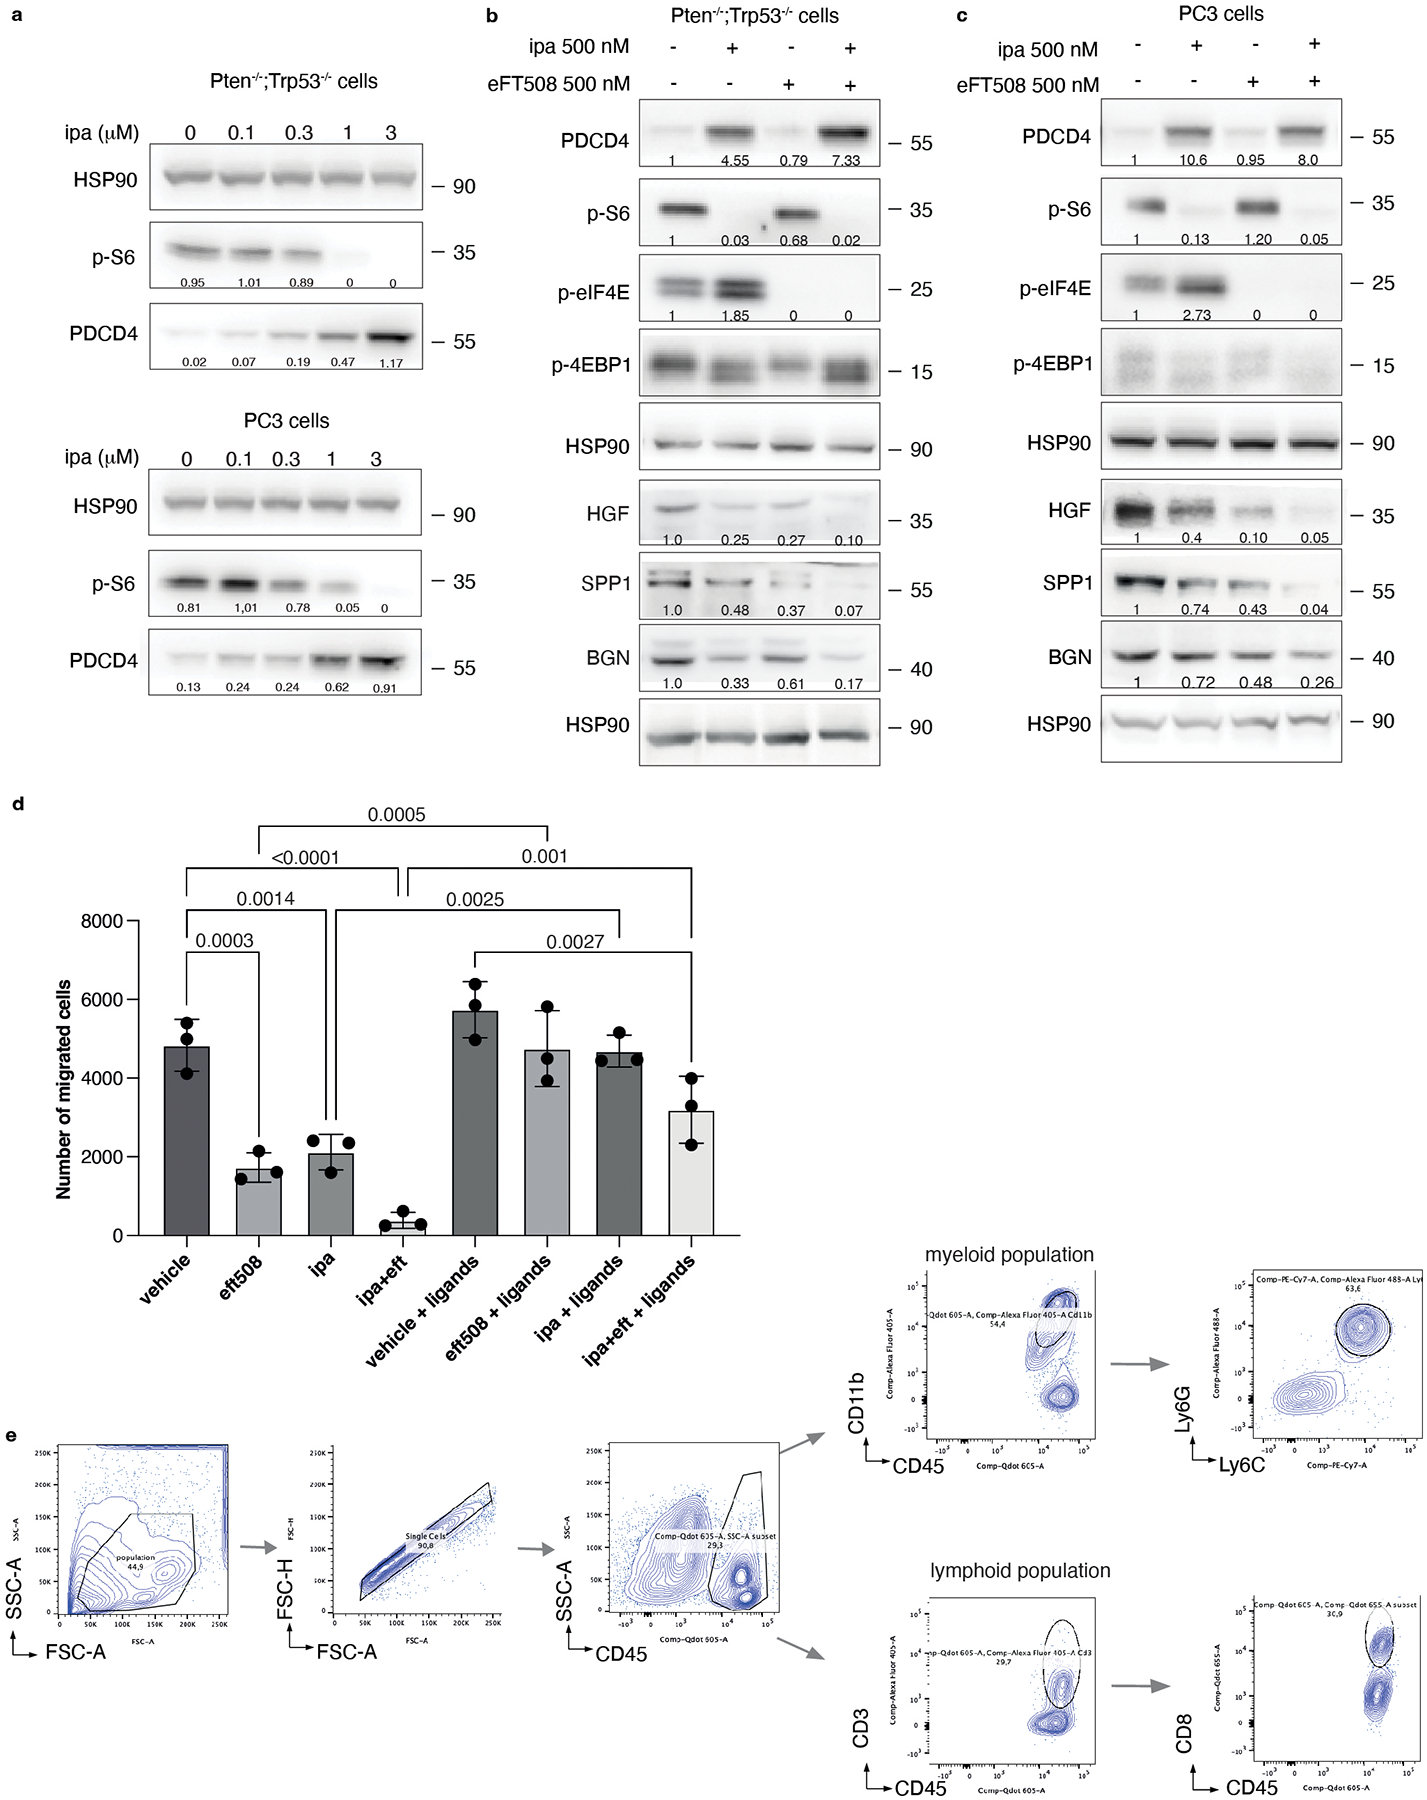
a, Western blot analysis showing the protein levels of PDCD4 and phospho-S6 in Pten−/−;Trp53−/− (RapidCap) and PC3 prostate cancer cell line upon treatment with the indicated concentration of ipatasertib. Densitometry values normalized to the loading control are indicated at the bottom for each band. The experiment was repeated two independent times with similar results. b, Western blot analysis showing the protein levels of PDCD4, p-S6, p-eIF4E, p-4EBP1, HSP90 (upper panel) and HGF, SPP1, BGN and representative HSP90 (lower panel) in Pten−/−;Trp53−/− (RapidCap) murine prostate cancer cell line upon treatment with vehicle, 500 nM eFT508, 500 nM ipatasertib or the dual treatment. Densitometry values normalized to the loading control are indicated at the bottom for each band. The experiment was repeated two independent times with similar results. c, Western blot analysis showing the protein levels of PDCD4, p-S6, p-eIF4E, p-4EBP1, HSP90 (upper panel) and HGF, SPP1, BGN and representative HSP90 (lower panel) in PC3 human prostate cancer cell line upon treatment with vehicle, 500 nM eFT508, 500 nM ipatasertib or the dual treatment. Densitometry values normalized to the loading control are indicated for each band. The experiment was repeated two independent times with similar results. d, Transwell migration assay performed with bone marrow-derived MDSCs tested for the capability to migrate toward PCa medium conditioned with the indicated treatments. n = 3 biological replicates. The experiment was repeated two independent times with similar results. Data are mean ± SD. Statistical analysis between all groups (ordinary one-way ANOVA followed by Tukey’s multiple comparisons test). e, Representative FACS plot of the gating strategy for the quantification of CD45+/CD11b+/Ly6Ghigh/Ly6Clow (PMN-MDSCs) (left) and CD45+/CD3+/CD8+ cells (right) in Ptenpc−/−;Trp53pc−/− prostate tumors.
Extended Data Figure 10. BGN, SPP1 and HGF are highly expressed in CRPC and correlate with p-eIF4E protein levels.
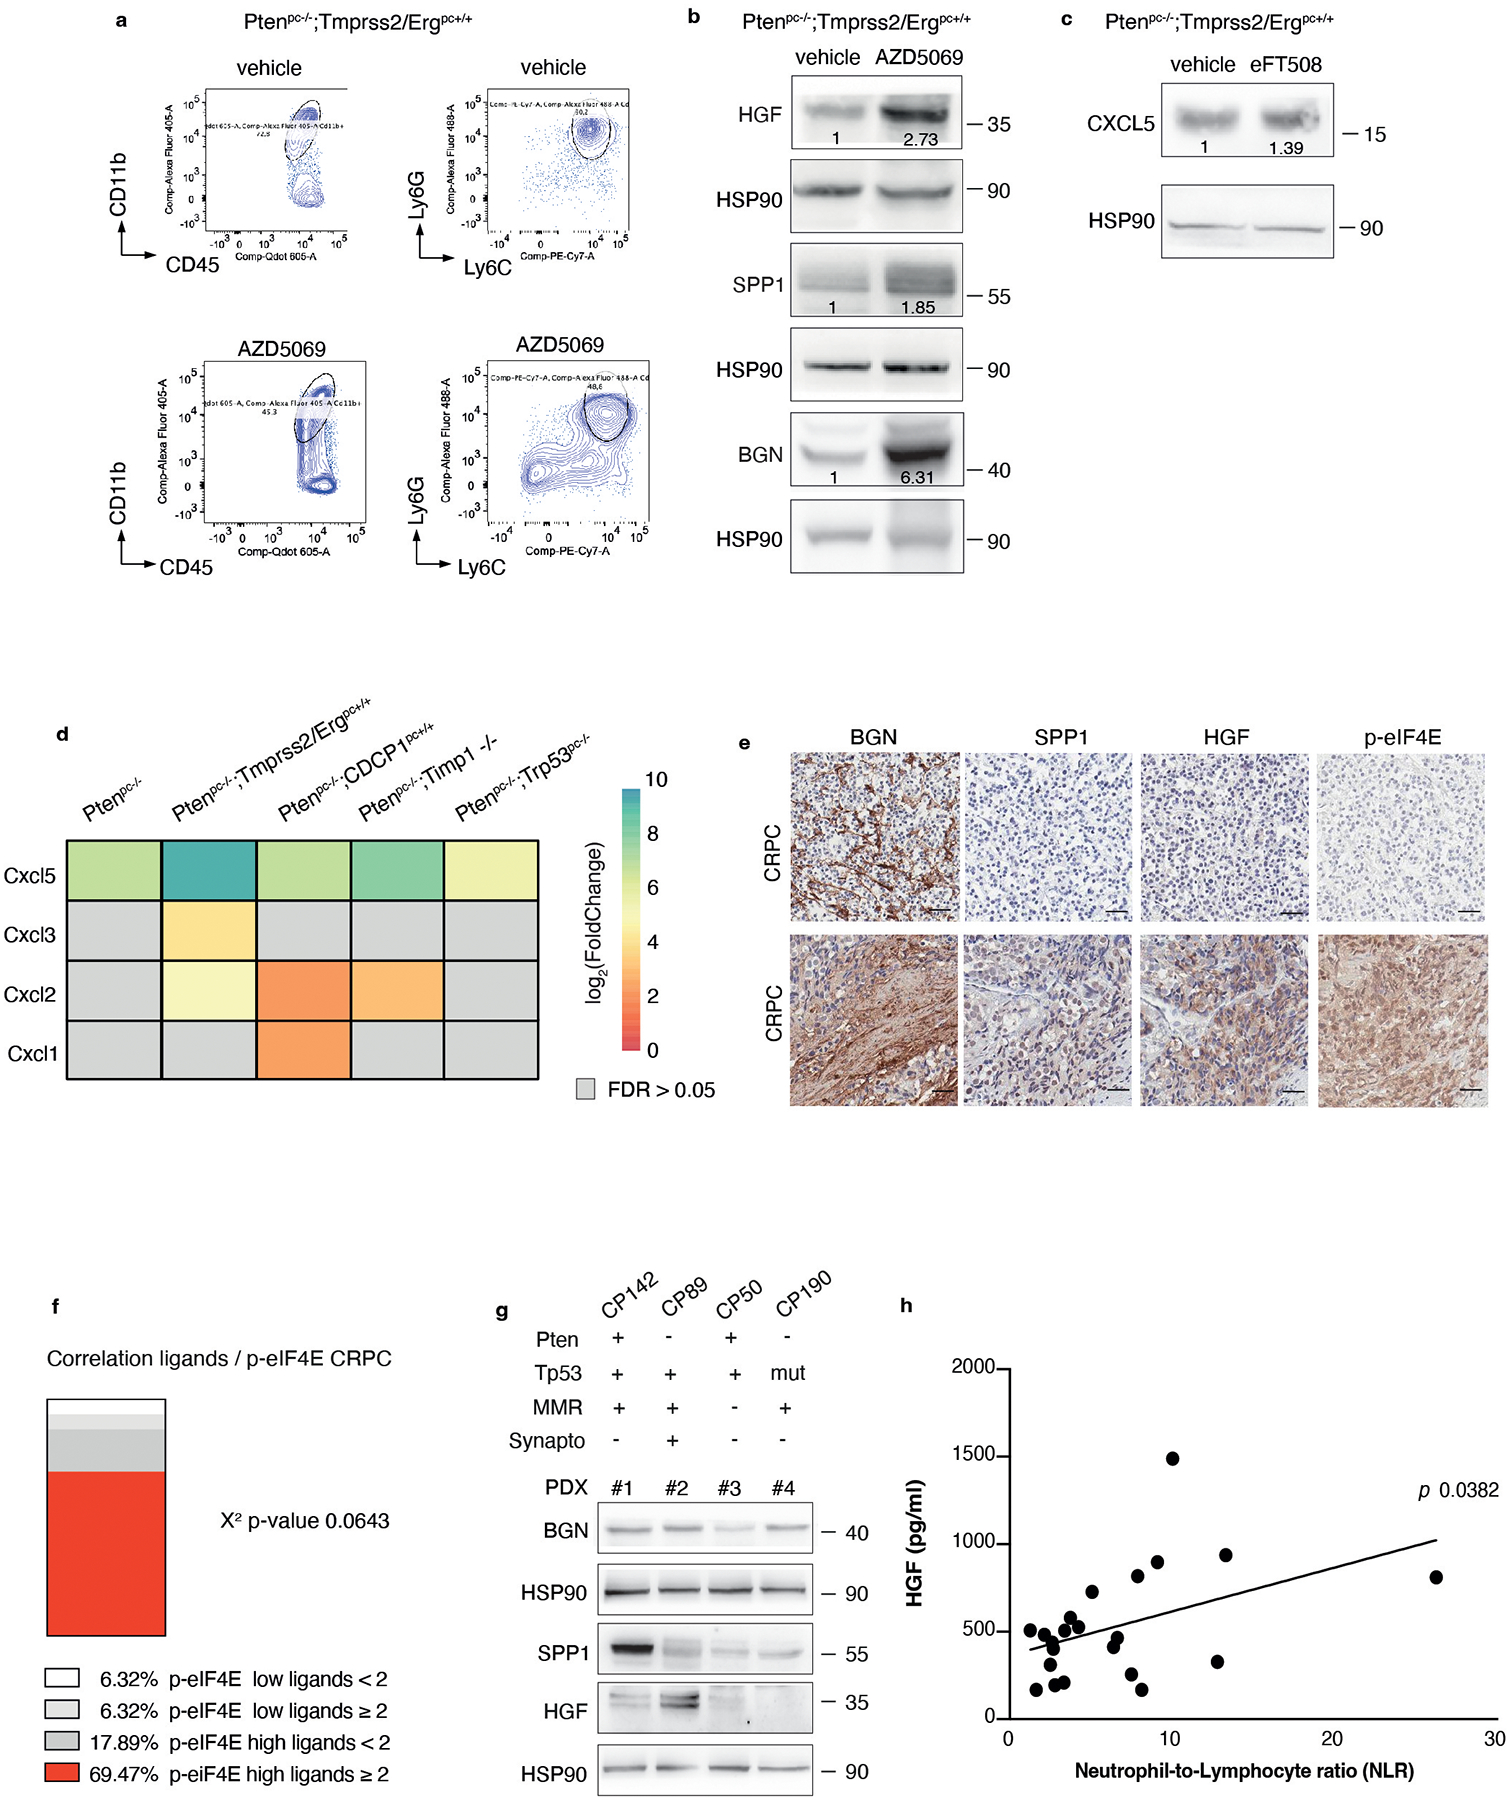
a, Representative FACS plots of CD45+/CD11b+ population and Ly6Ghigh/Ly6Clow cells (PMN-MDSCs) inside the CD45+/CD11b+ population in AZD5069-treated and vehicle-treated Ptenpc−/−;Tmprss2/Ergpc+/+. b, Western blot analysis showing the protein levels of HGF, SPP1 and BGN in Ptenpc−/−;Tmprss2/Ergpc+/+ prostate tumors upon treatment with vehicle or AZD5069. Densitometry values normalized to the housekeeping are indicated for each band. The experiment was performed once. c, Western blot analysis showing the protein levels of CXCL5 in Ptenpc−/−;Tmprss2/Ergpc+/+ prostate tumors upon treatment with vehicle or eFT508. Densitometry values normalized to the housekeeping are indicated for each band. The experiment was repeated two independent times with similar results. d, Heatmap depicting the mRNA levels of CXCL-chemokines in prostate tumors of the indicated genotypes compared to wild-type prostates (total mRNA expression determined by RNA-seq; n = 3 mice for each genetic background). e, Representative IHC of BGN, SPP1, HGF and p-eIF4E showing negative (upper panel) and positive (lower panel) cases in CRPC in cohort 1. Scale Bar 50 μm. f, Correlation between the co-expression of ≥ 2 ligands and p-eIF4E in CRPC in cohort 1 (n = 101). Two-sided Fisher’s exact test. g, Western blot showing the protein levels of BGN, SPP1 and HGF and representative HSP90 in CRPC patient-derived xenografts. (n = 4). h, Correlation between plasma HGF levels (pg/ml), determined by ELISA assay, and neutrophil-to-lymphocyte ratio (NLR) in CRPC patients. Statistical analysis: simple linear regression.
Supplementary Material
Supplementary Table 1 Log2 Fold change and adjusted p value of polysomal (P) and total (T) mRNAs in the indicated genetic background of prostate tumors compared to wild-type prostates.
Supplementary Table 2 Log2 Fold change and adjusted p value of translation efficiency (TE) in the indicated genetic background of prostate tumors compared to wild-type prostates.
Supplementary Table 3 List of primer sequences for q-RT-PCR analysis.
Acknowledgments
We acknowledge all the members of the A.A. laboratory for scientific discussions and critical reading. We acknowledge all the patients that participated in the study protocols. I. G. was in part founded by SAKK Translational Urogenital Cancer Meeting Award. This work was supported by ERC consolidator (CoG683136) grant, Prostate Cancer Foundation (PCF Challenge Award 19CHAL08), Swiss Card-Onco-Grant of Alfred and Annemarie von Sick, Horten Foundation, Prix Robert Wenner, Ligue Suisse contre le Cancer and ISREC Foundation (A. A.).
Competing interests
S.B. is affiliated with IMED Oncology AstraZeneca, Li Ka Shing Centre, Cambridge, UK and provided the AZD5069 compound. Johann de Bono has served on Advisory Boards for Roche and AstraZeneca and he is an employee of the ICR, which has received funding or other support for his research work from AstraZeneca and which has a commercial interest in PI3K/AKT pathway inhibitors (no personal income). Johann de Bono and Andrea Alimonti are principal investigators of the NCT03177187 trial which was partially supported by AstraZeneca and Astellas Pharma. The remaining authors declare no competing interests.
Footnotes
Code availability
All packages used for the bioinformatics analysis are described in the Methods section.
Data availability
RNA-seq data that support the findings of this study have been deposited in: ArrayExpress under accession codes E-MTAB-9624 (RNA-seq on total RNA of wild-type, Ptenpc−/−, Ptenpc−/−;P53pc −/−); Gene Expression Omnibus under accession code no. GSE202910 = RNA-seq on total RNA of Pten pc−/−;TMPRSS2/Ergpc+/+; Pten pc−/−; CDCP1pc +/+; Ptenpc−/−; Timp1 −/−; RNA-seq on polysomal RNA of wild-type, Ptenpc−/−, Ptenpc−/−;P53pc −/−, Pten pc−/−;TMPRSS2/Ergpc+/+; Pten pc−/−; CDCP1pc +/+; Ptenpc−/−; Timp1 −/−.
The data published in the Array Express are the results of the RNAseq on total RNA of the same samples for which the results of the RNAseq on polysomal RNA are published on GEO database, and they were processed at the same time.
Gene Expression Omnibus under accession code no. GSE202907 = RNA-seq on total and polysomal RNA of undifferentiated bone marrow, PMN-MDSCs (CD11b+/Ly6Ghigh/Ly6Clow) and M-MDSCs (CD11b+/Ly6Gneg/Ly6Clow).
The datasets used in this study are: Uniprot, https://www.uniprot.org/; Human Protein Atlas, https://www.proteinatlas.org/; STRING, https://string-db.org/; David 6.8, https://david.ncifcrf.gov/.
The human prostate cancer transcriptomic data were derived from the TCGA Research Network: http://cancergenome.nih.gov/ and from25.
Source Data for Fig. 1–8 and Extended Data Fig. 2–10 have been provided as Source Data files. All other data supporting the findings of this study are available from the corresponding author upon reasonable request.
REFERENCES
- 1.Kwon ED et al. Ipilimumab versus placebo after radiotherapy in patients with metastatic castration-resistant prostate cancer that had progressed after docetaxel chemotherapy (CA184–043): a multicentre, randomised, double-blind, phase 3 trial. Lancet Oncol 15, 700–712 (2014). 10.1016/S1470-2045(14)70189-5 [DOI] [PMC free article] [PubMed] [Google Scholar]
- 2.de Bono JS et al. Prostate carcinogenesis: inflammatory storms. Nat Rev Cancer 20, 455–469 (2020). 10.1038/s41568-020-0267-9 [DOI] [PubMed] [Google Scholar]
- 3.Feng S et al. Myeloid-derived suppressor cells inhibit T cell activation through nitrating LCK in mouse cancers. Proc Natl Acad Sci U S A 115, 10094–10099 (2018). 10.1073/pnas.1800695115 [DOI] [PMC free article] [PubMed] [Google Scholar]
- 4.Veglia F, Sanseviero E & Gabrilovich DI Myeloid-derived suppressor cells in the era of increasing myeloid cell diversity. Nat Rev Immunol 21, 485–498 (2021). 10.1038/s41577-020-00490-y [DOI] [PMC free article] [PubMed] [Google Scholar]
- 5.Di Mitri D et al. Tumour-infiltrating Gr-1+ myeloid cells antagonize senescence in cancer. Nature 515, 134–137 (2014). 10.1038/nature13638 [DOI] [PubMed] [Google Scholar]
- 6.Calcinotto A et al. IL-23 secreted by myeloid cells drives castration-resistant prostate cancer. Nature 559, 363–369 (2018). 10.1038/s41586-018-0266-0 [DOI] [PMC free article] [PubMed] [Google Scholar]
- 7.Lu X et al. Effective combinatorial immunotherapy for castration-resistant prostate cancer. Nature 543, 728–732 (2017). 10.1038/nature21676 [DOI] [PMC free article] [PubMed] [Google Scholar]
- 8.Porembka MR et al. Pancreatic adenocarcinoma induces bone marrow mobilization of myeloid-derived suppressor cells which promote primary tumor growth. Cancer Immunol Immunother 61, 1373–1385 (2012). 10.1007/s00262-011-1178-0 [DOI] [PMC free article] [PubMed] [Google Scholar]
- 9.Wang L et al. Increased myeloid-derived suppressor cells in gastric cancer correlate with cancer stage and plasma S100A8/A9 proinflammatory proteins. J Immunol 190, 794–804 (2013). 10.4049/jimmunol.1202088 [DOI] [PubMed] [Google Scholar]
- 10.Donkor MK et al. Mammary tumor heterogeneity in the expansion of myeloid-derived suppressor cells. Int Immunopharmacol 9, 937–948 (2009). 10.1016/j.intimp.2009.03.021 [DOI] [PubMed] [Google Scholar]
- 11.Leibowitz-Amit R et al. Clinical variables associated with PSA response to abiraterone acetate in patients with metastatic castration-resistant prostate cancer. Ann Oncol 25, 657–662 (2014). 10.1093/annonc/mdt581 [DOI] [PMC free article] [PubMed] [Google Scholar]
- 12.Lorente D et al. Baseline neutrophil-lymphocyte ratio (NLR) is associated with survival and response to treatment with second-line chemotherapy for advanced prostate cancer independent of baseline steroid use. Ann Oncol 26, 750–755 (2015). 10.1093/annonc/mdu587 [DOI] [PubMed] [Google Scholar]
- 13.Templeton AJ et al. Simple prognostic score for metastatic castration-resistant prostate cancer with incorporation of neutrophil-to-lymphocyte ratio. Cancer 120, 3346–3352 (2014). 10.1002/cncr.28890 [DOI] [PubMed] [Google Scholar]
- 14.Kaur HB et al. Association of tumor-infiltrating T-cell density with molecular subtype, racial ancestry and clinical outcomes in prostate cancer. Mod Pathol 31, 1539–1552 (2018). 10.1038/s41379-018-0083-x [DOI] [PMC free article] [PubMed] [Google Scholar]
- 15.van Soest RJ et al. Neutrophil-to-lymphocyte ratio as a prognostic biomarker for men with metastatic castration-resistant prostate cancer receiving first-line chemotherapy: data from two randomized phase III trials. Ann Oncol 26, 743–749 (2015). 10.1093/annonc/mdu569 [DOI] [PubMed] [Google Scholar]
- 16.Sharma J et al. Elevated IL-8, TNF-alpha, and MCP-1 in men with metastatic prostate cancer starting androgen-deprivation therapy (ADT) are associated with shorter time to castration-resistance and overall survival. Prostate 74, 820–828 (2014). 10.1002/pros.22788 [DOI] [PubMed] [Google Scholar]
- 17.Chi N, Tan Z, Ma K, Bao L & Yun Z Increased circulating myeloid-derived suppressor cells correlate with cancer stages, interleukin-8 and −6 in prostate cancer. Int J Clin Exp Med 7, 3181–3192 (2014). [PMC free article] [PubMed] [Google Scholar]
- 18.Lopez-Bujanda ZA et al. Castration-mediated IL-8 promotes myeloid infiltration and prostate cancer progression. Nat Cancer 2, 803–818 (2021). 10.1038/s43018-021-00227-3 [DOI] [PMC free article] [PubMed] [Google Scholar]
- 19.Nicholls DJ et al. Pharmacological characterization of AZD5069, a slowly reversible CXC chemokine receptor 2 antagonist. J Pharmacol Exp Ther 353, 340–350 (2015). 10.1124/jpet.114.221358 [DOI] [PubMed] [Google Scholar]
- 20.Dominguez C, McCampbell KK, David JM & Palena C Neutralization of IL-8 decreases tumor PMN-MDSCs and reduces mesenchymalization of claudin-low triple-negative breast cancer. JCI Insight 2 (2017). 10.1172/jci.insight.94296 [DOI] [PMC free article] [PubMed] [Google Scholar]
- 21.Silvera D, Formenti SC & Schneider RJ Translational control in cancer. Nat Rev Cancer 10, 254–266 (2010). 10.1038/nrc2824 [DOI] [PubMed] [Google Scholar]
- 22.Piccirillo CA, Bjur E, Topisirovic I, Sonenberg N & Larsson O Translational control of immune responses: from transcripts to translatomes. Nat Immunol 15, 503–511 (2014). 10.1038/ni.2891 [DOI] [PubMed] [Google Scholar]
- 23.Jamaspishvili T et al. Clinical implications of PTEN loss in prostate cancer. Nat Rev Urol 15, 222–234 (2018). 10.1038/nrurol.2018.9 [DOI] [PMC free article] [PubMed] [Google Scholar]
- 24.Cancer Genome Atlas Research, N. The Molecular Taxonomy of Primary Prostate Cancer. Cell 163, 1011–1025 (2015). 10.1016/j.cell.2015.10.025 [DOI] [PMC free article] [PubMed] [Google Scholar]
- 25.Taylor BS et al. Integrative genomic profiling of human prostate cancer. Cancer Cell 18, 11–22 (2010). 10.1016/j.ccr.2010.05.026 [DOI] [PMC free article] [PubMed] [Google Scholar]
- 26.Hsieh AC et al. The translational landscape of mTOR signalling steers cancer initiation and metastasis. Nature 485, 55–61 (2012). 10.1038/nature10912 [DOI] [PMC free article] [PubMed] [Google Scholar]
- 27.Bhat M et al. Targeting the translation machinery in cancer. Nat Rev Drug Discov 14, 261–278 (2015). 10.1038/nrd4505 [DOI] [PubMed] [Google Scholar]
- 28.Chu J, Cargnello M, Topisirovic I & Pelletier J Translation Initiation Factors: Reprogramming Protein Synthesis in Cancer. Trends Cell Biol 26, 918–933 (2016). 10.1016/j.tcb.2016.06.005 [DOI] [PubMed] [Google Scholar]
- 29.Furic L et al. eIF4E phosphorylation promotes tumorigenesis and is associated with prostate cancer progression. Proc Natl Acad Sci U S A 107, 14134–14139 (2010). 10.1073/pnas.1005320107 [DOI] [PMC free article] [PubMed] [Google Scholar]
- 30.Xu Y et al. Translation control of the immune checkpoint in cancer and its therapeutic targeting. Nat Med 25, 301–311 (2019). 10.1038/s41591-018-0321-2 [DOI] [PMC free article] [PubMed] [Google Scholar]
- 31.Knight JRP et al. MNK Inhibition Sensitizes KRAS-Mutant Colorectal Cancer to mTORC1 Inhibition by Reducing eIF4E Phosphorylation and c-MYC Expression. Cancer Discov 11, 1228–1247 (2021). 10.1158/2159-8290.CD-20-0652 [DOI] [PMC free article] [PubMed] [Google Scholar]
- 32.Huang F et al. Inhibiting the MNK1/2-eIF4E axis impairs melanoma phenotype switching and potentiates antitumor immune responses. J Clin Invest 131 (2021). 10.1172/JCI140752 [DOI] [PMC free article] [PubMed] [Google Scholar]
- 33.Robichaud N et al. Phosphorylation of eIF4E promotes EMT and metastasis via translational control of SNAIL and MMP-3. Oncogene 34, 2032–2042 (2015). 10.1038/onc.2014.146 [DOI] [PMC free article] [PubMed] [Google Scholar]
- 34.Robichaud N, Sonenberg N, Ruggero D & Schneider RJ Translational Control in Cancer. Cold Spring Harb Perspect Biol 11 (2019). 10.1101/cshperspect.a032896 [DOI] [PMC free article] [PubMed] [Google Scholar]
- 35.Schmid T et al. Translation inhibitor Pdcd4 is targeted for degradation during tumor promotion. Cancer Res 68, 1254–1260 (2008). 10.1158/0008-5472.CAN-07-1719 [DOI] [PubMed] [Google Scholar]
- 36.Parsyan A et al. mRNA helicases: the tacticians of translational control. Nat Rev Mol Cell Biol 12, 235–245 (2011). 10.1038/nrm3083 [DOI] [PubMed] [Google Scholar]
- 37.Sheth S et al. Resveratrol reduces prostate cancer growth and metastasis by inhibiting the Akt/MicroRNA-21 pathway. PLoS One 7, e51655 (2012). 10.1371/journal.pone.0051655 [DOI] [PMC free article] [PubMed] [Google Scholar]
- 38.Tomlins SA et al. Integrative molecular concept modeling of prostate cancer progression. Nat Genet 39, 41–51 (2007). 10.1038/ng1935 [DOI] [PubMed] [Google Scholar]
- 39.Sinha A et al. The Proteogenomic Landscape of Curable Prostate Cancer. Cancer Cell 35, 414–427 e416 (2019). 10.1016/j.ccell.2019.02.005 [DOI] [PMC free article] [PubMed] [Google Scholar]
- 40.Fabbri L, Chakraborty A, Robert C & Vagner S The plasticity of mRNA translation during cancer progression and therapy resistance. Nat Rev Cancer 21, 558–577 (2021). 10.1038/s41568-021-00380-y [DOI] [PubMed] [Google Scholar]
- 41.Rajasekhar VK et al. Oncogenic Ras and Akt signaling contribute to glioblastoma formation by differential recruitment of existing mRNAs to polysomes. Mol Cell 12, 889–901 (2003). 10.1016/s1097-2765(03)00395-2 [DOI] [PubMed] [Google Scholar]
- 42.Chen Y et al. ETS factors reprogram the androgen receptor cistrome and prime prostate tumorigenesis in response to PTEN loss. Nat Med 19, 1023–1029 (2013). 10.1038/nm.3216 [DOI] [PMC free article] [PubMed] [Google Scholar]
- 43.Chen Z et al. Crucial role of p53-dependent cellular senescence in suppression of Pten-deficient tumorigenesis. Nature 436, 725–730 (2005). 10.1038/nature03918 [DOI] [PMC free article] [PubMed] [Google Scholar]
- 44.Alajati A et al. CDCP1 overexpression drives prostate cancer progression and can be targeted in vivo. J Clin Invest 130, 2435–2450 (2020). 10.1172/JCI131133 [DOI] [PMC free article] [PubMed] [Google Scholar]
- 45.Guccini I et al. Senescence Reprogramming by TIMP1 Deficiency Promotes Prostate Cancer Metastasis. Cancer Cell 39, 68–82 e69 (2021). 10.1016/j.ccell.2020.10.012 [DOI] [PubMed] [Google Scholar]
- 46.Ingolia NT, Ghaemmaghami S, Newman JR & Weissman JS Genome-wide analysis in vivo of translation with nucleotide resolution using ribosome profiling. Science 324, 218–223 (2009). 10.1126/science.1168978 [DOI] [PMC free article] [PubMed] [Google Scholar]
- 47.Schwanhausser B et al. Global quantification of mammalian gene expression control. Nature 473, 337–342 (2011). 10.1038/nature10098 [DOI] [PubMed] [Google Scholar]
- 48.Rozen F et al. Bidirectional RNA helicase activity of eucaryotic translation initiation factors 4A and 4F. Mol Cell Biol 10, 1134–1144 (1990). 10.1128/mcb.10.3.1134-1144.1990 [DOI] [PMC free article] [PubMed] [Google Scholar]
- 49.Cerezo M et al. Translational control of tumor immune escape via the eIF4F-STAT1-PD-L1 axis in melanoma. Nat Med 24, 1877–1886 (2018). 10.1038/s41591-018-0217-1 [DOI] [PubMed] [Google Scholar]
- 50.Fu J et al. HGF/c-MET pathway in cancer: from molecular characterization to clinical evidence. Oncogene 40, 4625–4651 (2021). 10.1038/s41388-021-01863-w [DOI] [PubMed] [Google Scholar]
- 51.Appunni S et al. Biglycan: an emerging small leucine-rich proteoglycan (SLRP) marker and its clinicopathological significance. Mol Cell Biochem 476, 3935–3950 (2021). 10.1007/s11010-021-04216-z [DOI] [PubMed] [Google Scholar]
- 52.Zhao H et al. The role of osteopontin in the progression of solid organ tumour. Cell Death Dis 9, 356 (2018). 10.1038/s41419-018-0391-6 [DOI] [PMC free article] [PubMed] [Google Scholar]
- 53.Bolis M et al. Dynamic prostate cancer transcriptome analysis delineates the trajectory to disease progression. Nat Commun 12, 7033 (2021). 10.1038/s41467-021-26840-5 [DOI] [PMC free article] [PubMed] [Google Scholar]
- 54.Reich SH et al. Structure-based Design of Pyridone-Aminal eFT508 Targeting Dysregulated Translation by Selective Mitogen-activated Protein Kinase Interacting Kinases 1 and 2 (MNK1/2) Inhibition. J Med Chem 61, 3516–3540 (2018). 10.1021/acs.jmedchem.7b01795 [DOI] [PubMed] [Google Scholar]
- 55.Lin J et al. Targeting activated Akt with GDC-0068, a novel selective Akt inhibitor that is efficacious in multiple tumor models. Clin Cancer Res 19, 1760–1772 (2013). 10.1158/1078-0432.CCR-12-3072 [DOI] [PubMed] [Google Scholar]
- 56.de Bono JS et al. Randomized Phase II Study Evaluating Akt Blockade with Ipatasertib, in Combination with Abiraterone, in Patients with Metastatic Prostate Cancer with and without PTEN Loss. Clin Cancer Res 25, 928–936 (2019). 10.1158/1078-0432.CCR-18-0981 [DOI] [PubMed] [Google Scholar]
- 57.Sweeney C et al. Ipatasertib plus abiraterone and prednisolone in metastatic castration-resistant prostate cancer (IPATential150): a multicentre, randomised, double-blind, phase 3 trial. Lancet 398, 131–142 (2021). 10.1016/S0140-6736(21)00580-8 [DOI] [PubMed] [Google Scholar]
- 58.de Wit R et al. Baseline neutrophil-to-lymphocyte ratio as a predictive and prognostic biomarker in patients with metastatic castration-resistant prostate cancer treated with cabazitaxel versus abiraterone or enzalutamide in the CARD study. ESMO Open 6, 100241 (2021). 10.1016/j.esmoop.2021.100241 [DOI] [PMC free article] [PubMed] [Google Scholar]
- 59.Rebello RJ et al. Prostate cancer. Nat Rev Dis Primers 7, 9 (2021). 10.1038/s41572-020-00243-0 [DOI] [PubMed] [Google Scholar]
- 60.Wei SC, Duffy CR & Allison JP Fundamental Mechanisms of Immune Checkpoint Blockade Therapy. Cancer Discov 8, 1069–1086 (2018). 10.1158/2159-8290.CD-18-0367 [DOI] [PubMed] [Google Scholar]
- 61.Rescigno P & de Bono JS Immunotherapy for lethal prostate cancer. Nat Rev Urol 16, 69–70 (2019). 10.1038/s41585-018-0121-y [DOI] [PubMed] [Google Scholar]
- 62.Aguilar-Valles A et al. Translational control of depression-like behavior via phosphorylation of eukaryotic translation initiation factor 4E. Nat Commun 9, 2459 (2018). 10.1038/s41467-018-04883-5 [DOI] [PMC free article] [PubMed] [Google Scholar]
- 63.Genuth NR & Barna M Heterogeneity and specialized functions of translation machinery: from genes to organisms. Nat Rev Genet 19, 431–452 (2018). 10.1038/s41576-018-0008-z [DOI] [PMC free article] [PubMed] [Google Scholar]
- 64.Hilliard A et al. Translational regulation of autoimmune inflammation and lymphoma genesis by programmed cell death 4. J Immunol 177, 8095–8102 (2006). 10.4049/jimmunol.177.11.8095 [DOI] [PubMed] [Google Scholar]
- 65.Dorrello NV et al. S6K1- and betaTRCP-mediated degradation of PDCD4 promotes protein translation and cell growth. Science 314, 467–471 (2006). 10.1126/science.1130276 [DOI] [PubMed] [Google Scholar]
- 66.Asangani IA et al. MicroRNA-21 (miR-21) post-transcriptionally downregulates tumor suppressor Pdcd4 and stimulates invasion, intravasation and metastasis in colorectal cancer. Oncogene 27, 2128–2136 (2008). 10.1038/sj.onc.1210856 [DOI] [PubMed] [Google Scholar]
- 67.Sheedy FJ et al. Negative regulation of TLR4 via targeting of the proinflammatory tumor suppressor PDCD4 by the microRNA miR-21. Nat Immunol 11, 141–147 (2010). 10.1038/ni.1828 [DOI] [PubMed] [Google Scholar]
- 68.Cho H et al. RapidCaP, a novel GEM model for metastatic prostate cancer analysis and therapy, reveals myc as a driver of Pten-mutant metastasis. Cancer Discov 4, 318–333 (2014). 10.1158/2159-8290.CD-13-0346 [DOI] [PMC free article] [PubMed] [Google Scholar]
- 69.Marigo I et al. Tumor-induced tolerance and immune suppression depend on the C/EBPbeta transcription factor. Immunity 32, 790–802 (2010). 10.1016/j.immuni.2010.05.010 [DOI] [PubMed] [Google Scholar]
- 70.Pernigoni N et al. Commensal bacteria promote endocrine resistance in prostate cancer through androgen biosynthesis. Science 374, 216–224 (2021). 10.1126/science.abf8403 [DOI] [PubMed] [Google Scholar]
- 71.Dobin A et al. STAR: ultrafast universal RNA-seq aligner. Bioinformatics 29, 15–21 (2013). 10.1093/bioinformatics/bts635 [DOI] [PMC free article] [PubMed] [Google Scholar]
- 72.Harrow J et al. GENCODE: the reference human genome annotation for The ENCODE Project. Genome Res 22, 1760–1774 (2012). 10.1101/gr.135350.111 [DOI] [PMC free article] [PubMed] [Google Scholar]
- 73.Love MI, Huber W & Anders S Moderated estimation of fold change and dispersion for RNA-seq data with DESeq2. Genome Biol 15, 550 (2014). 10.1186/s13059-014-0550-8 [DOI] [PMC free article] [PubMed] [Google Scholar]
- 74.Oertlin C et al. Generally applicable transcriptome-wide analysis of translation using anota2seq. Nucleic Acids Res 47, e70 (2019). 10.1093/nar/gkz223 [DOI] [PMC free article] [PubMed] [Google Scholar]
- 75.Franceschini A et al. STRING v9.1: protein-protein interaction networks, with increased coverage and integration. Nucleic Acids Res 41, D808–815 (2013). 10.1093/nar/gks1094 [DOI] [PMC free article] [PubMed] [Google Scholar]
- 76.Swaim CD, Scott AF, Canadeo LA & Huibregtse JM Extracellular ISG15 Signals Cytokine Secretion through the LFA-1 Integrin Receptor. Mol Cell 68, 581–590 e585 (2017). 10.1016/j.molcel.2017.10.003 [DOI] [PMC free article] [PubMed] [Google Scholar]
- 77.Sadik CD, Miyabe Y, Sezin T & Luster AD The critical role of C5a as an initiator of neutrophil-mediated autoimmune inflammation of the joint and skin. Semin Immunol 37, 21–29 (2018). 10.1016/j.smim.2018.03.002 [DOI] [PubMed] [Google Scholar]
- 78.Lauria F et al. SMN-primed ribosomes modulate the translation of transcripts related to spinal muscular atrophy. Nat Cell Biol 22, 1239–1251 (2020). 10.1038/s41556-020-00577-7 [DOI] [PMC free article] [PubMed] [Google Scholar]
- 79.Tebaldi T et al. Widespread uncoupling between transcriptome and translatome variations after a stimulus in mammalian cells. BMC Genomics 13, 220 (2012). 10.1186/1471-2164-13-220 [DOI] [PMC free article] [PubMed] [Google Scholar]
- 80.Lauria F et al. riboWaltz: Optimization of ribosome P-site positioning in ribosome profiling data. PLoS Comput Biol 14, e1006169 (2018). 10.1371/journal.pcbi.1006169 [DOI] [PMC free article] [PubMed] [Google Scholar]
- 81.Robinson MD, McCarthy DJ & Smyth GK edgeR: a Bioconductor package for differential expression analysis of digital gene expression data. Bioinformatics 26, 139–140 (2010). 10.1093/bioinformatics/btp616 [DOI] [PMC free article] [PubMed] [Google Scholar]
- 82.Livak KJ & Schmittgen TD Analysis of relative gene expression data using real-time quantitative PCR and the 2(-Delta Delta C(T)) Method. Methods 25, 402–408 (2001). 10.1006/meth.2001.1262 [DOI] [PubMed] [Google Scholar]
- 83.Welti J et al. Targeting Bromodomain and Extra-Terminal (BET) Family Proteins in Castration-Resistant Prostate Cancer (CRPC). Clin Cancer Res 24, 3149–3162 (2018). 10.1158/1078-0432.CCR-17-3571 [DOI] [PubMed] [Google Scholar]
- 84.Gil V et al. HER3 Is an Actionable Target in Advanced Prostate Cancer. Cancer Res 81, 6207–6218 (2021). 10.1158/0008-5472.CAN-21-3360 [DOI] [PMC free article] [PubMed] [Google Scholar]
- 85.Zhong Q et al. Image-based computational quantification and visualization of genetic alterations and tumour heterogeneity. Sci Rep 6, 24146 (2016). 10.1038/srep24146 [DOI] [PMC free article] [PubMed] [Google Scholar]
- 86.Antonarakis ES et al. An immunohistochemical signature comprising PTEN, MYC, and Ki67 predicts progression in prostate cancer patients receiving adjuvant docetaxel after prostatectomy. Cancer 118, 6063–6071 (2012). 10.1002/cncr.27689 [DOI] [PMC free article] [PubMed] [Google Scholar]
Associated Data
This section collects any data citations, data availability statements, or supplementary materials included in this article.
Supplementary Materials
Supplementary Table 1 Log2 Fold change and adjusted p value of polysomal (P) and total (T) mRNAs in the indicated genetic background of prostate tumors compared to wild-type prostates.
Supplementary Table 2 Log2 Fold change and adjusted p value of translation efficiency (TE) in the indicated genetic background of prostate tumors compared to wild-type prostates.
Supplementary Table 3 List of primer sequences for q-RT-PCR analysis.
Data Availability Statement
RNA-seq data that support the findings of this study have been deposited in: ArrayExpress under accession codes E-MTAB-9624 (RNA-seq on total RNA of wild-type, Ptenpc−/−, Ptenpc−/−;P53pc −/−); Gene Expression Omnibus under accession code no. GSE202910 = RNA-seq on total RNA of Pten pc−/−;TMPRSS2/Ergpc+/+; Pten pc−/−; CDCP1pc +/+; Ptenpc−/−; Timp1 −/−; RNA-seq on polysomal RNA of wild-type, Ptenpc−/−, Ptenpc−/−;P53pc −/−, Pten pc−/−;TMPRSS2/Ergpc+/+; Pten pc−/−; CDCP1pc +/+; Ptenpc−/−; Timp1 −/−.
The data published in the Array Express are the results of the RNAseq on total RNA of the same samples for which the results of the RNAseq on polysomal RNA are published on GEO database, and they were processed at the same time.
Gene Expression Omnibus under accession code no. GSE202907 = RNA-seq on total and polysomal RNA of undifferentiated bone marrow, PMN-MDSCs (CD11b+/Ly6Ghigh/Ly6Clow) and M-MDSCs (CD11b+/Ly6Gneg/Ly6Clow).
The datasets used in this study are: Uniprot, https://www.uniprot.org/; Human Protein Atlas, https://www.proteinatlas.org/; STRING, https://string-db.org/; David 6.8, https://david.ncifcrf.gov/.
The human prostate cancer transcriptomic data were derived from the TCGA Research Network: http://cancergenome.nih.gov/ and from25.
Source Data for Fig. 1–8 and Extended Data Fig. 2–10 have been provided as Source Data files. All other data supporting the findings of this study are available from the corresponding author upon reasonable request.


