

Summary
Karyotypes, composed of chromosomes, must be accurately partitioned by the mitotic spindle for optimal cell health. However, it is unknown how underlying characteristics of karyotypes, such as chromosome number and size, govern the scaling of the mitotic spindle to ensure accurate chromosome segregation and cell proliferation. We utilize budding yeast strains engineered with fewer chromosomes, including just two “mega chromosomes” to study how spindle size and function is responsive to, and scaled by, karyotype. We determined that deletion and overexpression of spindle-related genes are detrimental to the growth of strains with two chromosomes, suggesting that mega chromosomes exert altered demands on the spindle. Using confocal microscopy, we demonstrate that cells with fewer but longer chromosomes have smaller spindle pole bodies, fewer microtubules, and longer spindles. Moreover, using electron tomography and confocal imaging we observe elongated, bent anaphase spindles with fewer core microtubules in strains with mega chromosomes. Cells harboring mega chromosomes grow more slowly, are delayed in mitosis, and a subset struggle to complete chromosome segregation. We propose that the karyotype of the cell dictates the microtubule number, type, spindle pole body size, and spindle length, subsequently influencing the dynamics of mitosis like the rate of spindle elongation, and the velocity of pole separation. Taken together, our results suggest that mitotic spindles are highly plastic ultra-structures that can accommodate and adjust to a variety of karyotypes even within a species.
Keywords: mitosis, karyotype, spindle, chromosome, chromosome segregation, metaphase, anaphase, chromosome size, centromere, microtubule, spindle pole body, tomography
eTOC
Engineered yeast with fewer but longer chromosomes are used to explore spindle scaling. Kunchala et al. show that the mitotic spindle adapts by reducing microtubule number and spindle pole body size while increasing spindle length, reliance on spindle-associated factors, and time in anaphase. The spindle is a highly adjustable ultrastructure.
Graphical Abstract:

Introduction
Variation in the karyotype of a species is well documented in many plants1 and animals2–6, sometimes referred to as karyomorphs. Whatever the karyotype, chromosomes must be segregated accurately for a successful cell division by the mitotic spindle, a conserved, dynamic macromolecular structure. The mitotic spindle is formed by three types of microtubules that are nucleated from the microtubule organizing center (MTOC): (i) kinetochore microtubules that attach to centromeric regions of chromosomes via kinetochores and facilitate chromosome segregation, (ii) interpolar or ‘core bundle’ microtubules that are involved in spindle stability and elongation during anaphase, and (iii) astral microtubules that position the spindle7. Although each type of spindle microtubule has a specific role in mitotic spindle function, the mechanisms that regulate the number and distribution of each are largely unknown. Furthermore, it remains unclear how the mitotic spindle adapts to variant karyotypes.
Faithful chromosome segregation requires the assembly of a mitotic spindle consisting of the correct number, type, and length of microtubules. Importantly, defects in spindle assembly and chromosome segregation typically result in aneuploidy or chromosome breakage. Previous studies in budding yeast have indicated that the size of the spindle pole body (SPB, the yeast MTOC) and thus the number of microtubules generated is dependent on gene dosage or ploidy8–10. Other studies have indicated that there is a counting-based mechanism that specifically detects the number of centromeres, not simply the overall genome content, which determines how many microtubules are generated11. Although these studies suggest spindles are plastic structures, we still do not understand how each component of the mitotic spindle adapts to karyotypic variation.
In this study, we utilize the budding yeast, Saccharomyces cerevisiae, as a model system to investigate how spindles adapt to variant karyotypes composed of fewer but much longer chromosomes. We used genetically engineered budding yeast strains made by two groups- the Qin lab12 and the Boeke lab13,14 wherein the 16 chromosomes present in haploid yeast were fused via CRISPR to produce yeast strains that are haploid with twelve, eight, four, or two chromosomes each12–14 (Table S1). We refer to the two chromosomes as mega chromosomes. These engineered karyotypes provide an excellent platform to study how spindle scaling and dynamics of mitosis are influenced by karyotype. We find that the spindle is a robust, highly plastic structure that can segregate each karyotype by adjusting the size of the SPB, the number of microtubules, and the length of the spindle. However, the mega chromosomes exert strain on the spindle as evidenced by mitotic delays, spindle bending, and karyotype specific genetic requirements. Overall, our results suggest karyotype properties strongly impact mitotic spindle structure and dynamics.
Results
Cells with mega chromosomes grow slowly and have unique genetic requirements
Each engineered mega chromosome contains one centromere and a telomere at each end12–14 ( Figure 1A and S1A). Strains with engineered chromosomes grow as haploids (Figure S1B). For the ease of representation, we name the strains by the group that made them i.e., 2Q (two chromosome strain made by Qin lab)12; 2B (two chromosome strain made by Boeke lab)13, 2B-XL (another two-chromosome strain made by the Boeke lab with an extra-long chromosome arm compared to 2B)14 (Figure 1A and S1A). The mega-chromosomes differ in the order of the linear arrangement of native chromosomes (Figure S1A). They also differ in the length of chromosomes arms, the centromere identity, and the placement of the ribosomal DNA array. The 2Q strain has the longest chromosome arm, followed by the 2B-XL strain and then the 2B strain (Figure 1A and S1A). Despite the fusions, the gene expression profile in these strains remained largely unaltered, except for a few genes with no coherent pattern of gene ontology (GO) term enrichment12–14.
Figure 1: Yeast bearing non-native karyotypes grow slowly and have different genetic requirements.
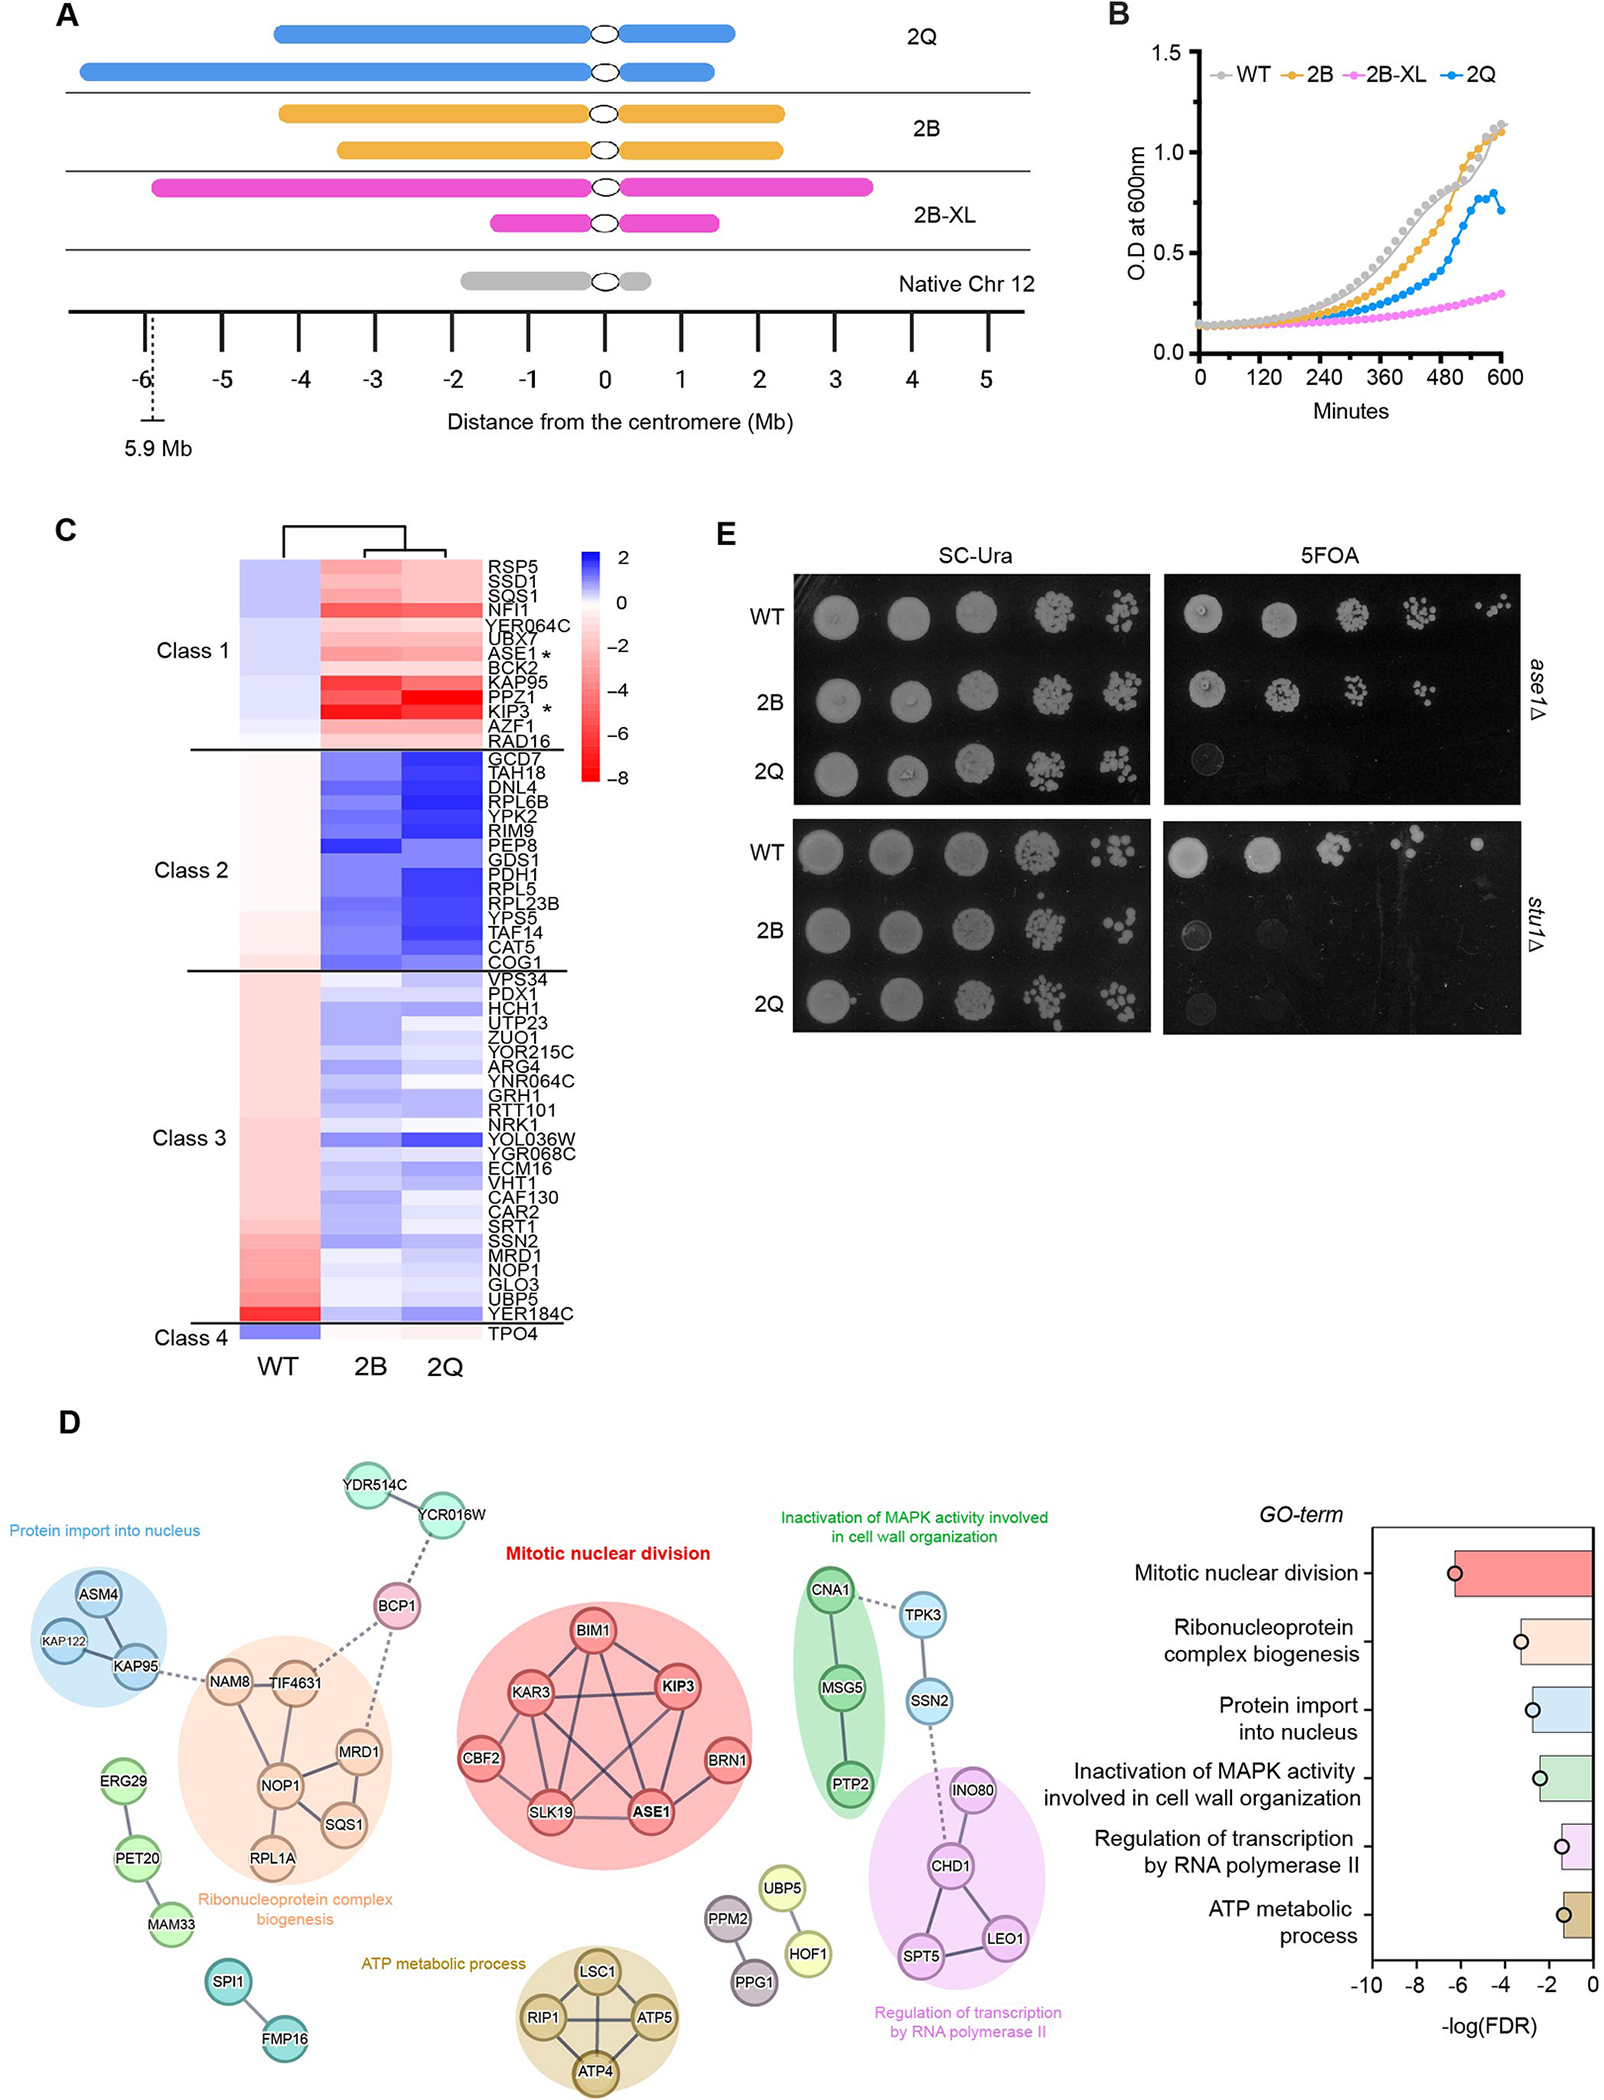
A. Illustration showing mega chromosomes made by Qin and Boeke labs in comparison to Chr 12, the longest chromosome in wildtype yeast. The chromosomes are centered by their centromeres (represented by a white circle) and are arranged to show the size of each chromosome arm. Scale at the bottom shows the length of each chromosome arm.
B. Mega chromosome strains 2B, 2B-XL and 2Q grow more slowly in YPD broth at 30°C compared to WT. Each line represents the average of six replicates. The slopes are significantly different from one another (P<0.0001). Doubling time for WT is ~96 min, 2B is ~119 min, 2B-XL is ~280 min, and 2Q is ~ 156 min.
C. Heatmap representation of the top 50 genes from the HIP overexpression screen is shown. Two of the genes that negatively impact growth upon overexpression in the 2B and 2Q strains but not in the WT (Class 1) are marked with an asterisk (ASE1, KIP3). Genes that positively impact the growth of the two-chromosome strains only are represented in Class 2, followed by Class 3 genes that negatively impact the growth of the WT only, and finally, Class 4 genes that positively impact the growth of the WT strain only. A black line divides each class in the heatmap.
D. STRING Network analysis of 100 genes most impacting growth from the HIP overexpression screen is shown. The line thickness indicates the confidence (strength of data support) using a high minimum required interaction score (0.7). Node color was determined by clustering using the Markov Cluster Algorithm (inflation parameter = 3). The middle cluster includes genes involved in mitotic nuclear division (GO:0140014) (6/7 nodes). Other clusters include ribonucleoprotein complex biogenesis (GO:0022613; 6/6 nodes), ATP metabolic process (GO:0046034; 3/4 nodes). Unconnected nodes are not shown. The bar plot on the right illustrates the negative logarithm of the False Discovery Rate (FDR) for the enriched biological processes from Gene Ontology (GO) analysis.
E. Examples of karyotype specific lethality in two chromosome strains are shown. Deletions of ASE1 and STU1 in WT, 2B and 2Q strains were generated by initially introducing a pURA3 plasmid (pURA3-ASE1 or pURA3-STU1) with the gene. Subsequently, the endogenous gene copy was deleted by transformation. Strains were serially diluted and spotted on both SC-Ura plates (with the plasmid) and 5-FOA plates at 30°C (which selects for plasmid loss).
We compared the growth of the fused yeast chromosome strains 2B, 2B-XL and 2Q to the wild-type (WT) strain with 16 chromosomes. We observed that 2B, 2B-XL and 2Q strains have a longer lag phase and a slower growth rate compared to a WT strain, consistent with the published literature 12–14 (Figure 1B). The 2B-XL strain has a more pronounced growth defect compared to the 2B strain; potential reasons have been explored in a recent study14. Due to the severe growth defect in the 2B-XL strain we have used it selectively in our studies. We postulated that the extreme karyotypes place unique demands on cell growth and cycling. To identify potential genes that when overexpressed either alleviate or worsen the growth phenotype, we transformed WT, 2B and 2Q strains with the Harvard Institute of Proteomics (HIP) overexpression library. Each of the 5083 plasmids in the library contains a unique open reading frame (ORF) under the GAL1 promoter and the URA3 selection marker15. Overexpression of the ORF could be turned ON or OFF by growing strains on galactose (ON; Test) or glucose (OFF; Control) (Figure S1C). We compared colony size of a strain grown on control and test plates to determine if overexpression of a gene was helpful, harmful, or had no effect (neutral) on growth. We categorized non-neutral hits into four classes based on the impact of their overexpression on growth i.e., whether it had a negative or positive impact on growth uniquely in the two chromosome strains, or WT strain (See methods for details). This identified a group of genes that when overexpressed had a deleterious effect uniquely in the 2B and 2Q strains but not in the WT strain (Class 1, Figure 1C). Interestingly, Class 1 genes included ASE1 and KIP3 (denoted with asterisk) which have been previously reported to affect bipolar spindle assembly, mitotic spindle stability, elongation, and spindle positioning16–18. STRING analysis of the top 100 genes most impacting growth showed several groupings (Figure 1D). The largest cluster contains genes associated with mitotic nuclear division (GO:0140014) (Figure 1D), including genes encoding microtubule associated proteins ASE1 and BIM1, microtubule motors KAR3 and KIP3, and kinetochore proteins CBF2 and SLK19. These results suggest that the slower growth phenotype observed in these strains could be in part due to the unusual karyotype challenging the mitotic spindle.
In a previous genome-wide knockout screen in yeast, genes related to recombination, chromatid cohesion, and spindle function were essential for the growth of triploid and tetraploid karyotypes, but not for haploids or diploids8. Examination of the mechanism of lethality indicated that the spindle structure in tetraploids differed from that in haploids or diploids, requiring various motor and microtubule-associated proteins (MAPs) for spindle formation in tetraploids that are not essential for spindles in haploids or diploids8. To further test the unique demands of the two-chromosome karyotype on the spindle, we deleted candidate genes to examine their essentiality, with a focus on MAPs.
ASE1 encodes a non-essential MAP that localizes at the spindle midzone and is required for anaphase spindle elongation16. Deletion of ASE1 is well-tolerated in the 2B strain but lethal in the 2Q strain (Figure 1E), suggesting that the spindle in the 2Q strain is under more stress. We hypothesize that the phenotypic differences of ASE1 deletion between 2B and 2Q strains could be due to variation in chromosomal arm lengths and/or the linear arrangement of the chromosomes. Next we deleted another non-essential MAP, STU1, a plus end tracking non-motor protein required for spindle integrity, kinetochore capture19,20 and outward force production during anaphase21. Deletion of STU1 is lethal in both 2B and 2Q strains (Figure 1E), suggesting that mega chromosomes increase the demand for MAPs that ensure proper kinetochore capture and the stability of spindles during anaphase.
In summary, we found the mega chromosome strains are sensitive to the dosage of genes involved in chromosome segregation, including genes encoding factors involved in microtubule and kinetochore function. These findings suggest that the karyotype impacts the gene essentiality landscape and tolerance to altered gene dosage. Moreover, these data suggest the mega chromosome karyotype places unique demands on the mitotic spindle.
Distinct spindle organization supports the two chromosome karyotypes
To examine the spindle ultra-structure, we performed electron tomography and modeled spindle microtubules in the 2B, 2B-XL, 2Q, and WT strains (see Methods). Representative models from each strain are shown in Figure 2A. Identifying a kinetochore microtubule in yeast through electron microscopy is challenging due to the lack of detectable kinetochore structures. Previous studies in yeast have reported that for each centromere, there is one presumptive kinetochore microtubule (pKT-MTs) in a bipolar spindle22. These pKT-MTs were identified by a process of elimination22 and not by visualizing the binding of a microtubule to the kinetochore. In this method, interpolar or ‘core bundle’ MTs were first identified based on their distance apart and length of overlap. The non-core MTs would contain pKT-MTs and other MTs; we prefer to use the term non-core microtubule (NC-MT) instead of pKT-MTs in this study. Our results show that the number of NC-MTs per half spindle of the WT strain is ~17.3 ± 3.1 (n=3) (Figure 2B, Table S3), consistent with approximately one microtubule per centromere22. While the number of NC-MTs in the 2B strain is similar to WT at ~17.6 ± 4.8 (n=7), the number is significantly reduced in the 2B-XL strain to ~ 8.2 ± 4.0 (n=2) and in the 2Q strain to ~10.6 ± 3.7 (n=6) (Figure 2B; Table S3). These results suggest that there are more NC-MTs than centromeres or chromosomes in these spindles. The excess of NC-MTs in the spindle is most apparent in the 2B strain, which was notable for better growth (Figure 1B) and less dependence on ASE1 than 2Q (Figure 1E). Several of the “additional” NC-MTs in metaphase in these strains are short and deviate from the central spindle axis (Figure S2A). The reduced length and altered trajectory of these NC-MTs makes it unlikely that they are attached to kinetochores.
Figure 2: Spindle architecture is altered in the 2B, 2B-XL and 2Q strains based on electron tomography.

A. Microtubules are categorized as kinetochore or core bundle microtubules based on their length and pitch angle from the spindle (see Methods). Kinetochore or non-core microtubules (NC-MTs) emanating from the spindle pole bodies are green (SPB1) or magenta (SPB2); core bundle microtubules are yellow. Models of metaphase spindles are shown for WT, 2B, and 2Q cells. 2B-XL models include early anaphase spindles. Metaphase spindles are classified by both SPBs in the mother cell, whereas in the anaphase spindles, one SPB is in the mother, and one is in the daughter cell. Scale - 200nm.
B. The graphs depict the average number of total microtubules, core-bundle microtubules, and non-core microtubules (from each SPB) microtubules for each strain. The number of measurements made per strain are as follows- WT (n=3), 2B (n=7), 2B-XL (n=2), and 2Q (n=6). Average number of microtubules are shown under each strain. One-way ANOVA test with Tukey’s multiple comparison test, with a single pooled variance was performed. * P ≤ 0.05, ** P ≤ 0.01, ns P > 0.05. SPB size decreases as chromosome number decreases.
C. The diameter of the central plaque of SPB is plotted. The average size of the central plaque is shown at the bottom. The number of measurements made per strain are as follows- WT (n=34), 2B (n=19), 2B-XL(n=11) and 2Q (n=28) strains. One-way ANOVA test with Tukey’s multiple comparison test, with a single pooled variance was performed. * P ≤ 0.05, ** P ≤ 0.01 **** P ≤ 0.0001, ns P> 0.05.
D. The graph shows the predicted radius of 38 nm for a SPB in a cell with two chromosomes.This prediction is based on the microtubule nucleation capacity required for two chromosomes, calculated based on the observed radii of SPBs in haploid, diploid and tetraploid cells with bipolar spindles8–10.
In the 2Q strain, we observed a spindle with pairs of co-tracking microtubules (Figure S2B). To rule out aberrant centromere organization in the 2Q strain, we analyzed the location of the centromere-specific nucleosome containing Cse4 through MNase ChIP-qPCR in the 2Q strain with the endogenous Cse4 tagged with 3HA (Cse4–3HA)23 (See methods; Table S4). Our results indicate that the Cse4–3HA histone is limited to the predicted locus, and has not expanded, suggesting that the number and position of the centromeric nucleosome is unaltered in the 2Q strain (Figure S2B). Although plants have regional centromeres and budding yeast has point centromeres, our findings are consistent with studies from plants suggesting that centromere size correlates with genome size rather than chromosome size 24,25.
Core bundle microtubules (CB-MTs) are distinct from NC-MTs and aid spindle stability and elongation during anaphase7. While the WT strain had ~12 ± 4.5 (n=3) (Table S3; Figure 2A and 2B), the number of core bundle microtubules was decreased in the 2B (~6.5 ± 2.6, n=7), 2B-XL (~6.5 ± 6.3, n=2) and 2Q (~4.6 ± 1, n=6) strains. The decrease in CB-MTs was not statistically significant for 2B or 2B-XL strains, likely due to the small number of models reconstructed via tomography. However, consistent with spindle instability, we observed increased bending of the spindles in anaphase via tomography (Figure S2C) and live cell confocal imaging (Figure S2D) in the two chromosome strains compared to WT. We quantified the degree of bending in anaphase spindles in the two chromosome strains using confocal microscopy and κ plugin26 (see methods). A radius of curvature was determined by computing the reciprocal of the average curvature per micron for each strain. Higher average radii values indicate lower curvature of the spindle, while lower average radii values indicate higher curvature. We observed significantly higher spindle bending in 2B (4.3 ± 1.1 μm), 2B-XL (4.4 ± 0.73 μm), and 2Q (4.9 ± 1.0 μm) strains compared to WT (5.3 ± 1.1 μm) (Figure S2D). Increased curvature of spindles in the mega chromosome strains could be caused by fewer CB-MTs in anaphase compared to WT.
In budding yeast spindles, the SPB nucleates all the microtubules, and the surface area of the SPB determines the number of microtubules produced27. We next asked if the size of the SPB was altered in the mega chromosome strains. We measured the diameter of the central plaque (CP) of the SPB in G1 and mitotic cells using electron microscopy. We found that the diameter was significantly reduced in 2B (87.6 ± 14.2 nm, n=19), 2B-XL (81.7 ± 10.6 nm, n=11) and 2Q (81.8 ± 8.7 nm, n=28) strains compared to the WT strain (99.7 ± 19 nm, n=34) (Figure 2C), which translates to a reduced area and nucleation capacity. Reduced fluorescence intensity of SPB protein Tub4-GFP in yeast strains bearing 12, 8, 4, or 2 chromosomes is also consistent with a reduction in the size of the SPB (Figure S2E). Altogether these data indicate that the size of the SPB is reduced in response to karyotypes with fewer chromosomes, which will lower the microtubule nucleation capacity of this organelle.
Earlier studies have indicated that the radius of the central plaque (CP) of the SPB in haploid, diploid, and tetraploid yeast cells is approximately 55 nm, 80 nm, and 120 nm respectively 8–10 (Figure 2D), indicating that as the number of chromosomes increases, the area (πr2) of the SPB increases proportionally. Based on this, a cell with two chromosomes is predicted to have a CP of radius ~38 nm. However, our electron microscopy results indicate a deviation from the expected scaling (Figure 2D). The WT haploid strain had a mean CP radius of ~57 nm in a bipolar spindle but the 2Q strain had CP radius of ~49.6 nm in a bipolar spindle, significantly larger than the prediction. Moreover, the SPB radii in G1 cells of the two chromosome strains was about ~40–44 nm, which is also above the predicted radius for a cell harboring two chromosomes (Figure 2C). We speculate that there is a minimal size for the SPB, and further reduction would compromise its assembly and function.
Our data demonstrate that yeast strains with fewer chromosomes have smaller SPBs (Figure 2C and Figure S2E) and fewer microtubules (Figure 2B and Table S3) than WT. Moreover, the anaphase spindles are bent in mega chromosome strains, possibly due to fewer CB-MTs (Figure S2C and S2D). We postulated that the observed growth delay could result from unstable mitotic spindles.
Altered forces on the spindle and longer chromosome arms increase spindle length through mitosis
To further determine how the spindle architecture is impacted in the mega chromosome strains, we measured spindle length using live cell confocal fluorescence microscopy (see Methods). We first categorized spindles into metaphase and anaphase based on the position of the SPBs, classifying those with two SPBs in the mother cell as metaphase spindles and those with separated SPBs in both mother and daughter cells as anaphase spindles. The metaphase spindle length is proposed to be set by two opposing forces: an outward force generated by motor proteins that push overlapping CB-MTs apart and an opposing inward force that pulls poles together as a result of cohesion between the sister chromatids attached to microtubules via kinetochores (Figure 3A)11. We hypothesized that the two chromosome strains would experience reduced inward forces due to the reduced number of chromosomes/attachment points, potentially increasing the metaphase spindle length. Measurements of metaphase spindles showed that the average metaphase spindle length in WT is 1.4 ± 0.42 μm and increased significantly to 2.7 ± 0.61 μm in 2B, 3.2 ± 1.01 μm in 2B-XL and 3 ± 1.05 μm in the 2Q strain (Figure 3B). We found a similar increase in metaphase spindle length in other fused chromosome strains 12B (1.6 ± 0.51 μm ), 8B (2.2 ± 0.64 μm), and 4B (2.2 ± 0.71 μm) compared to WT (1.3 ± 0.31 μm) (Figure S3). A previous study reported a similar increase in metaphase spindle length with two synthetic kinetochores11. The increase in metaphase spindle length observed in yeast strains with fewer chromosomes (Figure 3B and S3) is consistent with less inward force on the spindle.
Figure 3: Spindles lengthen in the two chromosome strains.

A. The cartoon illustration depicts forces that act on the metaphase spindle. The inward forces experienced at the poles are due to sister chromatid cohesion and KT-MTs attachment are shown by inward facing arrows. The outward forces experienced by the spindle are due to kinesin motor proteins and other non-motor proteins, represented by a bidirectional arrow. Illustration made in BioRender.com.
B. Metaphase spindle length increases in the 2B, 2B-XL and 2Q strains compared to WT. The super plots show data from 2 biological replicates for each strain. Below, representative images of WT, 2B, 2B-XL and 2Q strains with the fluorescent tags on SPB and tubulin are shown (see methods). The number of measurements made per strain are as follows- WT (n=164), 2B (n=134), 2B-XL (n=135) and 2Q (n=173). One-way ANOVA test with Tukey’s multiple comparison test, with a single pooled variance was performed. * P ≤ 0.05, **** P ≤ 0.0001.
C. Anaphase spindle length increases in 2B, 2B-XL and 2Q strains compared to WT. The super plots show data from 2 biological replicates for each strain. The number of measurements made per strain are as follows- WT (n=107), 2B (n=100), 2B-XL (n=108) and 2Q (n=207). One-way ANOVA test with Tukey’s multiple comparison test, with a single pooled variance was performed. * P ≤ 0.05, **** P ≤ 0.0001, ns P> 0.05.
D. The cartoon illustrates how mega chromosomes (2B, 2B-XL and 2Q) will require longer anaphase spindles for segregation compared to WT cells with normal sized chromosomes. As chromosome arm size increases, chromosomes must move a greater distance before cytokinesis to prevent chromosome loss or breakage. Illustration made in BioRender.com.
E. Deletion of BOI1 in WT, 2B, 2B-XL, and 2Q strains was generated by initially introducing a pURA3 plasmid (i.e., pURA3-BOI1) with the gene. Subsequently, the endogenous gene copy was deleted by transformation. Strains were serially diluted and spotted on both SC-Ura plates (with the plasmid) and 5-FOA plates at 30°C (which selects for plasmid loss). All strains were spotted on the same plate but intervening rows between 2Q and 2B-XL were removed.
See also Figure S3
In addition to the longer metaphase spindles, we observed an increase in average anaphase spindle length in 2B (5.0 ± 2.05 μm), 2B-XL (4.1 ± 1.62 μm) and 2Q (4.7 ± 2.29 μm) strains compared to WT (2.2 ± 1.48μm) (Figure 3C). Increases in anaphase spindle length in 12B, 8B, and 4B strains were also observed compared to WT (Figure S3). As the inward forces are removed during anaphase, we speculate that the increase in anaphase spindle length could be an adaptive mechanism to segregate long chromosome arms compared to the relatively short chromosome arms present in WT, to avoid chromosome loss or breakage during cytokinesis (Figure 3D). We asked if the NoCUT pathway28 which detects chromosome arms at the cytokinesis axis and stalls telophase initiation until the chromosome arms are cleared, was essential in the two chromosome strains. We deleted BOI1 which encodes a protein in the NoCUT pathway that localizes to the site of cleavage in an Ipl1-dependent manner and acts as an abscission inhibitor28. Deletion of BOI1 caused a growth defect in 2B-XL and 2Q strains compared to WT (Figure 3E). Our results suggest that the dependency on the NoCUT pathway increases based on the two-chromosome karyotype.
Perturbing the inward and outward forces on the spindle is predicted to change the spindle length in metaphase. We hypothesized that adding more centromeres would shorten the metaphase spindle length. To test this, we transformed the strains 2B, 2B-XL and 2Q with a centromere-containing low copy number plasmid (pRS316) (Figure 4A). The centromere in the plasmid forms a functional kinetochore29,30 (Figure 4B). Consistent with our hypothesis, the average metaphase spindle length was significantly reduced by the addition of plasmids in two chromosome strains. Lengths were 2B+CEN plasmid strain (~2.8 ± 0.8 μm), 2B-XL+CEN plasmid strain (~2.8 ± 1.3 μm) and 2Q+CEN plasmid strain (~2.6 ± 0.97 μm) compared to 2B (~3.1 ± 0.98 μm), 2B-XL (~3.28 ± 1.2 μm) and 2Q (~3.5 ± 0.98 μm) (Figure 4C). The decrease in metaphase spindle length with extra centromeres is consistent with the force balance model, i.e., as the number of centromeres increases, inward forces increase and spindle length decreases. Metaphase spindle lengths in the WT strain did not change with the addition of centromere plasmids (Figure S4A), possibly because the number of copies (~3–5 per cell 31) is low relative to the number of chromosomes. This outcome is consistent with another study that titrated the number of centromere plasmids and found that 10–30 copies had a more significant impact on spindle length in a WT strain than ~5 copies11. Adding extra centromeres to WT, 2B, 2B-XL, and 2Q strains did not change the average length of the anaphase spindle (Figure 4D and Figure S4B). This finding supports our hypothesis that the increased length of the anaphase spindle is a compensatory mechanism to separate long chromosome arms before cytokinesis.
Figure 4: Forces that act on the spindle impact spindle length.

A. A schematic for transformation of centromere containing plasmid (pRS316) is shown. Illustration made in BioRender.com.
B. Cartoon illustration showing an increase in inward force as a result of extra centromeres, indicated by larger inward arrows. Illustration made in BioRender.com.
C. Metaphase spindle length is reduced in strains with extra centromeres compared to strains without extra centromeres. The number of measurements made per strain are as follows- 2B+CEN (n=142) and 2B (n=106); 2B-XL+CEN (n=94) and 2B-XL (n=70); 2Q+CEN (n=67) and 2Q (n=47). For comparison an unpaired, parametric, t Test was performed. *P ≤ 0.05, **P ≤ 0.01,****P ≤ 0.0001
D. Spindle length in anaphase does not change with extra centromeres. The number of measurements made per strain are as follows- 2B+CEN (n=77) and 2B (n=82); 2B-XL+CEN (n=61) and 2B-XL (n=47); 2Q+CEN (n=153) and 2Q (n=141). For comparison an unpaired, parametric, t Test was performed. ns P > 0.05.
See also Figure S4
The two chromosome karyotypes confer defects in spindle elongation and delayed mitosis
Strains 2B and 2Q both grow slowly (Figure 1B), have altered spindle organization (Figure 2, Table S3), and elongated spindles (Figure 3 and S3), although the 2Q strain is generally more impaired than the 2B strain. To better understand the consequences of the altered spindle architecture we examined mitosis using live cell time lapse microscopy (see Methods). The rate of elongation of the spindle, measured from initiation of anaphase (t=0) until the end of anaphase (when the spindle breaks), is slower in the 2B and 2Q strains compared to WT (Figure 5A) and the duration of time spent in anaphase is much longer than WT (Figure 5B). Like the rate of spindle elongation, the velocity of SPB separation is also much slower in the 2B (~0.048 ± 00.014 μm/min) and 2Q (~0.053 ± 0.019 μm/min) strains compared to WT (~0.14 ± 0.06 μm/min) (Figure 5C). Despite the highly variable rate of spindle elongation in the 2B-XL strain (Figure S5A), we found a similar increase in the duration in anaphase and decrease in the velocity of SPB separation in the 2B-XL strain compared to WT (Figure S5B and S5C). These data suggest that separating mega chromosomes is challenging for the spindle. Moreover, the two chromosome strains show a trend toward decreased CB-MTs (Figure 2B, Table S3), which can result in reduced outward force and, therefore, a slower segregation process.
Figure 5: Spindle elongation is slowed with mega chromosomes.

A. Rates of spindle elongation are slower in mega chromosome strains (2B and 2Q) compared to WT. Spindle elongation was monitored in individual cells of WT (n=19), 2B (n=15), and 2Q (n=12) strains. Each line represents the average of the rate of spindle elongation for all the cells per strain. Error bars are SEM. A few of the points are without error bars because of the cell-to-cell variability of the final break point.
B. The duration of anaphase in significantly longer for cells with mega chromosomes compared to WT. Duration in anaphase was measured for each cell plotted in 5a; One-way ANOVA test with Tukey’s multiple comparison test, with a single pooled variance was performed.***P ≤ 0.001, ****P ≤ 0.0001.
C. Velocity of SPB separation is slower in cells in mega chromosome strains compared to WT. Velocity was measured for each cell plotted in 5a. One-way ANOVA test with Tukey’s multiple comparison test, with a single pooled variance was performed.****P ≤ 0.0001.
D. The rate of spindle elongation was not accelerated in cells with extra centromeres (2Q+CEN) compared to cells without extra centromeres (2Q). The number of measurements made per strain are as follows- WT (n=19), 2Q (n=12) and 2Q+CEN (n=7). The higher spindle length reported here for the 2Q+CEN strain compared to the 2Q strain could be attributed to cell-to-cell variability and small sample size. Each line represents the average rate of spindle elongation for all the cells per strain. Error bars are SEM. A few of the points are without error bars because of the cell-to-cell variability in the final break point.
E. Addition of extra centromeres in the 2Q strain (2Q+CEN) did not decrease the amount of time spent in anaphase compared to cells without extra centromeres (2Q). Duration in anaphase was measured for each cell plotted in Figure 5D. One-way ANOVA test with Tukey’s multiple comparison test, with a single pooled variance was performed.**P ≤ 0.01,****P ≤ 0.0001.
F. The velocity of SPB separation was unchanged in cells with additional centromeres (2Q+CEN) compared to cells without additional centromeres (2Q). Velocity was measured for each cell plotted in Figure 5D. One-way ANOVA test with Tukey’s multiple comparison test, with a single pooled variance was performed. *P ≤ 0.05, ****P ≤ 0.0001.
G. A montage of the 2B strain undergoing mitosis is presented. The white arrow points to a cell that struggles to undergo mitosis for about 10 hours (565 mins). The spindle of this cell shows a unique elongation and collapse phenotype where the spindle initiates anaphase multiple times but collapses and moves completely into the daughter cell. T=0 min represents a timepoint right before SPB duplication and bipolar spindle formation. This multiple collapse and restart phenotype is more prevalent in the 2Q strain than the 2B strain.
See also Figure S5
Since spindle elongation is dependent on the stability of the spindle, which is influenced by the number and type of microtubules, we asked if the rate of spindle elongation could be accelerated by increasing the number of MTs present in the cell through addition of extra chromosomal attachment points. To answer this, we examined mitosis in the 2Q strain with and without additional centromeres using live cell time lapse microscopy. The rate of spindle elongation was unchanged by the addition of plasmids (Figure 5D), nor was the duration of time spent in anaphase (Figure 5E) or the velocity of SPB separation (Figure 5F), arguing these aspects of spindle dynamics were unresponsive to the addition of extra microtubule attachments. These data are consistent with our working model that the length of the chromosome arms provides crucial real-time feedback during mitosis that can ultimately result in a slowed mitosis as the spindle elongates beyond its typical length to segregate the chromosomes.
Mad1 is a component of the spindle assembly checkpoint32,33. It detects defects in spindle assembly and/or attachment of microtubules to kinetochores and delays the onset of anaphase by inhibiting the anaphase-promoting complex. Deletion of MAD1, a non-essential gene in WT, is lethal in the 2Q strain but not in the 2B strain (Figure S5D). This result suggests that the 2Q strain has defects in spindle assembly and requires frequent checkpoint activation to correct otherwise lethal segregation errors. To further understand the effect of the loss of MAD1 in the 2B strain, we compared the growth of WT and 2B with and without the MAD1 gene. Deletion of MAD1 led to an increase in the growth rate of both the 2B and WT strains (Figure S5E). This suggests that the slower growth rate observed in the 2B strain (Figure 1B) could be due in part to the activation of the spindle assembly checkpoint.
Despite compensatory changes in the spindle ultra-structure to accommodate the altered karyotype (Figure 2, Table S3), a fraction of the cells bearing two chromosomes struggle to complete mitosis and show a unique spindle elongation and collapse phenotype (Figure 5G). This phenotype is only observed in strains with two chromosomes and not in WT, possibly due to the dearth of CB-MTs required for spindle elongation and stability (Table S3; Figure 2). Anaphase spindles collapsed significantly more frequently in the 2Q strain compared to the 2B and WT strains (Figure S5F) consistent with spindles in the 2Q strain being more compromised than in the 2B strain based on spindle ultrastructure and genetic requirements (Figure S5). We compared the time spent on spindle assembly and elongation in WT, 2B and 2Q strains. We found that the time spent on spindle assembly significantly increased in the 2B strain whereas the time spent on elongation significantly increased in the 2Q strain compared to WT (Figure S5G). Furthermore, the time spent on spindle elongation is significantly higher in the 2Q strain compared to the 2B strain (Figure S5G). Previous research suggests an upper limit on chromosome arm size in organisms34, because spindle length is limited by the cell size. In a yeast cell, an anaphase spindle can reach a maximum of 10 μm7, suggesting that the potential length of a chromosome arm is limited to approximately 5μm. Studies have predicted that 1Mb of condensed chromosome during anaphase will extend ~0.85μm35. Consequently, the upper limit for the length of a chromosome arm that can be separated on a yeast spindle should be ~5.9 Mb (5μm/0.85μm per 1Mb). Notably, the 2Q strain possesses a chromosome arm that exceeds the anticipated upper limit for budding yeast (Figure 1A and S1A) which may explain the extended time spent on spindle extension. While spindles in the mega chromosome strains share many commonalities, we speculate the differences in chromosome arm length, linear arrangement, and position of rDNA between the 2B and 2Q strains (Figure 1A, S1A) could all contribute to the differential collapse phenotype of the spindle but will require further studies.
Discussion
A functional mitotic spindle that effectively segregates chromosomes is imperative for the overall health of an organism. Many organisms, even within the same species, show variation in karyotypes, and these typically form by chromosome fusion to create fewer, but longer chromosomes. Prior research in budding yeast suggests that as the ploidy of the cell increases (e.g., haploid, diploid, tetraploid), the size of the SPB increases and the number of microtubules increases while the spindle length remains constant. This has led to the hypothesis that the spindle scales with ploidy and/or centromere number. A study by Nannas et al., 2014 demonstrated that artificially increasing centromeres in a cell resulted in larger SPBs and more microtubules, supporting centromere number as a key factor in spindle scaling. In this study, we employ budding yeast with non-native karyotypes to examine how the mitotic spindle adjusts to fewer but longer chromosomes. The spindle apparatus is remarkably plastic in its ability to adjust microtubule type and spindle length to segregate these highly modified karyotypes, although the reliance on some spindle components is increased and mitosis is slowed.
A one-to-one correspondence between the number of chromosomes and NC-MTs has previously been observed in budding yeast24. However, our results demonstrate that the number of NC-MTs in the spindle does not necessarily scale linearly with the chromosome number, a finding previously observed by EM in a strain that lacks functional kinetochores36. A cell with two chromosomes should have ~2 NC-MTs per half spindle. Our tomography results argue that the number of NC-MTs is not nearly this low (Table S3; Figure 2). Several of these “additional NC-MTs” in the two chromosome strains are quite short and tend to deviate from the central spindle axis, suggesting that they are not stabilized by kinetochore capture (Figure S2). These “unused” microtubules may be the product of an SPB that cannot shrink beyond a minimum size (Figure 2C, 2D).
Cells with fewer chromosomes had increased spindle length in both metaphase and anaphase, but we speculate for two different reasons. The increase in the metaphase spindle length could be explained by the force balance model. According to this model, the metaphase spindle length is dependent on the opposing forces that act on the spindle. We speculate that as the number of attachment points (points of force generation) are reduced in addition to fewer core bundle microtubules (less outward force from motor proteins) in the cell it results in a net increase in length of the metaphase spindle relative to a WT strain. This theory is further supported by the decrease in spindle length observed in metaphase when more inward forces are added by extra cohesion via centromere plasmids. We speculate the differences in spindle length in metaphase between the two chromosome strains could be due to differences in linear order of the chromosomes, centromere identity, and related cohesin loading on chromosome arms37. Once anaphase is initiated and cohesion between sister chromatids is destroyed, inward forces no longer exist. In anaphase we observed cells with fewer but longer chromosomes had longer spindles. In the two chromosome strains we observed severely bent spindles (Figure S2D), delayed spindle assembly and elongation (Figure S5G), and decreased SPB separation velocity (Figure 5C), which we postulate could be attributed to fewer CB-MTs and, therefore, lower outward force production (Table S3; Figure 2).
Our data suggests that the karyotype not only dictates the size of an organelle (SPB), the scaling of the mitotic spindle, and the rate of mitosis but also plays an important role in determining the essentiality of genes. Genes encoding proteins involved in spindle elongation and stability as well as kinetochore capture, spindle assembly checkpoint (MAD1) and the completion of mitosis (NoCUT pathway, BOI1) become more essential depending on the karyotype. The lower number of microtubules in the spindles in the 2Q and 2B-XL strains combined with the longer chromosome arms (Figure S1A), near or beyond the theoretical upper limit of arm length in yeast13, might increase the dependency on the spindle assembly and NoCUT checkpoints. We propose that the gene essentiality landscape in a species will depend in part on karyotype.
In conclusion, our study sheds new light on the interwoven relationship between karyotypes and mitotic spindles. Our findings demonstrate the remarkable adaptability of the mitotic spindle in response to dramatic karyotypic changes. This phenomenon not only impacts spindle size and microtubule type but extends to the rate of mitosis itself. Moreover, our findings illuminate the role of specific genes in this plasticity, as genes encoding proteins that participate in spindle assembly, stability, and checkpoint control become essential with dramatic karyotype alteration. This study deepens our understanding of how cells adapt to the challenges posed by karyotypic diversity within a species and prompts intriguing questions about the evolutionary and mechanistic underpinnings of these adaptations. Further investigation into the interplay between karyotype, gene essentiality, spindle formation and dynamics may unravel additional layers of feedback for successful chromosome segregation.
STAR Methods
Resource availability
Lead contact
Further information and requests for resources and reagents should be directed to and will be fulfilled by the lead contact, Jennifer Gerton (JEG@stowers.org).
Materials availability
This study did not generate any new plasmids. The original fusion strains are available from the Qin lab or Boeke lab, subject to an MTA. Any strain request must include an agreement with either the Qin or Boeke lab.
Data and code availability
Original images and data underlying this manuscript can be accessed from the Stowers Original Data Repository. The ODR link is listed in the key resources table.
Key resources table.
| REAGENT or RESOURCE | SOURCE | IDENTIFIER |
|---|---|---|
| Antibodies | ||
| Anti-HA (12CA5) | Roche | RRID# AB_514505 |
| Anti-HA (ChIP) | abcam | ab9110 |
| Chemicals, peptides, and recombinant proteins | ||
| Formaldehyde Solution | Sigma-Aldrich | Cat# 252549 |
| Proteinase K | ThermoFisher | Cat# EO0491 |
| GelRed Nucleic Acid Gel Stain | Biotium | Cat# 41103 |
| 5-Fluoroorotic Acid | Zymo Research | Cat# F9001 |
| Micrococcal nuclease | Worthington Biochemical | Cat# LS004798 |
| Propidium iodide solution | Sigma-Aldrich | Cat# P4864 |
| Triton X-100 | Sigma-Aldrich | Cat# T9284 |
| NP-40 Alternative | Sigma-Aldrich | Cat# 492016 |
| Sodium Deoxycholate | Sigma-Aldrich | Cat# S1827 |
| cOmplete Protease Inhibitors Cocktail | Sigma-Aldrich | Cat# 11836145001 |
| Bovine serum albumin | Sigma-Aldrich | Cat# 9048–46-8 |
| Sodium azide | VWR | Cat# 97064–646 |
| RNase A | ThermoFisher | Cat# EN0531 |
| Critical commercial assays | ||
| Dynabeads Protein G | Invitrogen | Cat# 10004D |
| SYBR Green Master Mix | ThermoFisher | Cat# A25742 |
| Deposited data | ||
| Raw data presented in this manuscript | This study | https://www.stowers.org/research/publications/libpb-2437 |
| Original Code used in the manuscript | This study | https://github.com/jmvarberg/Kunchala_et_al_2024 |
| Experimental models: Organisms/strains | ||
| All Saccharomyces cerevisiae strains used in this study are listed in Table S1 | Lab stock and this study | N/A |
| Oligonucleotides | ||
| Oligonucleotides used in this study are listed in Table S3 | N/A | |
| Recombinant DNA | ||
| Yeast MOBY collection | Ho et al.39 | DOI:10.1038/nbt.1534 |
| Yeast HIP ORF collection | Hu et al.15 | DOI:10.1101/gr.6037607 |
| Software and algorithms | ||
| Fiji (Image J) V2.3.1/1.53f | https://imageJ.net/ | RRID:SCR_002285 |
| FlowJo v9 | FlowJo | RRID# SCR_008520 |
| Prism V9.3.1 | GraphPad | RRID# SCR_002798 |
| R v 4.2.1 | R core team | RRID# SCR_001905 |
All original code has been deposited at GitHub and is publicly available as of the date of publication and is listed in the key resources table. DOIs are listed in the key resources table. Any additional information required to reanalyze the data reported in this paper is available from the lead contact upon request.
EXPERIMENTAL MODEL AND SUBJECT DETAILS
Yeast strains
All Saccharomyces cerevisiae yeast strains used in this study were of the S288C- (BY4741 or BY4742) background and are listed in Table S1. The fused yeast chromosomes were obtained from Qin (2Q) and Boeke (2B, 2B-XL, 4B, 8B, 12B) labs respectively. The strains used in this study are listed in Table S1. Standard methods were used tagging proteins including C-terminal tagging with fluorescent proteins and epitope labelling by PCR based methods as previously published38. The yeast strains containing the HIP-overexpression libraries15 were generated using by traditional methods as previously described38.
For gene deletions, cells were transformed with a MOBY-covering plasmid39 for the gene of interest and later the endogenous gene was deleted using methods previously published38. To analyze gene deletion phenotypes, cells were cultured overnight in YPD and then plated to synthetic complete medium lacking uracil (SC-Ura) or 5-fluoro-orotic acid (5-FOA) medium and grown at the indicated temperatures.
METHOD DETAILS
Growth curve
Cells were grown overnight in YPD and diluted to 0.05 O.D600 cells/ml the following day and allowed to grow for 90 minutes before collecting the growth curve. Cells were plated in 96 well plate and O.D600 was measured every 15 minutes using the Tecan plate reader for 10 hours at 30°C. The mean O.D600 of six biological replicates is plotted on the graph for every strain. MAD1 deletion strains were streaked onto 5FOA plates two days prior to the growth curve analysis to remove the covering plasmid. Cells were then grown overnight in YPD, and the growth rate was measured as described above.
Flow cytometry
DNA content in cells was analyzed by flow cytometry. Cells were fixed with 70% ethanol for 1 hour to overnight at room temperature, treated with RNAse (Roche, Basel, Switzerland) and Proteinase K (Roche) for 2 h at 37°C and stained with propidium iodide (Sigma-Aldrich, St. Louis) in the dark at 4°C for 1 hour. Samples were run either on MACSQuant FACS Analyzer (Miltenyi Biotec) or Bio-Rad ZE5 cell analyzer and data was displayed using FlowJo software (Tree Star, Ashland, OR). Wildtype haploid and diploid controls were used to identify 1N, 2N and 4N peaks; forward and side scatter were used to differentiate cells from debris40.
Electron Tomography
Cells were processed for electron microscopy using methods described previously22,41. Briefly, aliquots of log phase cultures were collected by vacuum filtration and frozen using an EM ICE high-pressure freezer (Leica). The frozen cells were freeze-substituted in 2% osmium tetroxide 0.2% uranyl acetate and 2% water in acetone, then embedded in either hard Spurr’s or Hard Plus resin (Electron Microscopy Sciences, Fort Washington, PA) and polymerized. Serial semi-thick (250nm) sections were cut using a Leica Ultracut-E microtome and collected onto Formvar-coated copper slot grids. The sections were poststained with 2% aqueous uranyl acetate followed by Reynolds lead citrate. Fifteen-nanometer colloidal gold particles (Ted Pella) were affixed to both surfaces of the section to serve as fiducial markers for tilt series alignment. For SPB measurements, 100 nm sections were cut, collected onto slot grids, and stained as described above. Grids were screened using a Tecnai T12 Spirit Biotwin TEM (ThermoFisher Scientific, Waltham, MA) to locate cells containing spindles and SPBs.
Tomography was performed as described42. Tilt series were collected using a Tecnai F30 microscope (ThermoFisher Scientific, Waltham, MA) using the SerialEM program for data acquisition 43. Tilt-series data were acquired from serial sections at a pixel size of 1.2–1.5 nm using a Gatan One View camera (Gatan, Inc. Pleasanton, CA). Tomographic volumes were computed using the IMOD software package44,45. For each spindle, volumes from three to or five serial sections were joined, and the spindle microtubules were modeled using the 3dmod program of the IMOD software package. SPB diameters were computed from the model contour data. The MT pairing program of the IMOD software package was used to compute and identify the core bundle mts in each spindle22.
HIP ORF screen analysis:
Colony growth was monitored by imaging plates every 24 hours for 3 days. Colony densities on test and control plates were quantified using a custom ImageJ macro as described46 with downstream analysis performed using R (v 4.2.1, R Core Team 2022)47. Briefly, the colony intensities from each of the four technical replicates for each gene was averaged to generate a mean colony growth value for each gene from the Test and Control plates. For the subset of genes that were present at multiple locations in the HIP ORF library (314 genes, 6.2% of library), the mean values of the technical replicates at each location were further averaged to generate a single mean value for each gene. Next, a fold-change value was calculated for each gene by dividing the mean intensity on Test plate by the mean intensity of the Control plate. To remove false positive hits caused by artificially inflated fold-change values observed for colonies with very low growth in both conditions, genes with colony intensities below the 10th percentile in both Test and Control conditions were filtered and removed. The remaining fold-change values were then log2-transformed, centered, and scaled to generate z-scores for each gene. Genes that improved or reduced growth in the two chromosome strains (2Q,2B) compared to the WT strain, (or vice versa), were identified through pairwise comparisons of the z-scores from each strain. Genes of interest were classified into four categories: Class 1 – Genes negatively impacting growth for two chromosome strains but not 16 chromosome (z-score for 2Q and 2B <= −1, z-score >= 0 for WT); Class 2 – Genes positively impacting growth for two chromosome but not for 16 chromosome (z-score for 2Q and 2B >= 1, z-score <= 0 for WT); Class 3 - Genes negatively impacting growth for 16 chromosomes but not two chromosome strains (z-score for 2Q and 2B >= 0, z-score <= −1 for WT); and Class 4 – Genes that positively impacted colony growth for 16 chromosome but not for two chromosome strains (z-score for 2Q and 2B <= 0, z-score >= 1 for WT). Heatmaps were created using the pheatmap package (v. 1.0.12). The full source code is available at https://github.com/jmvarberg/Kunchala_et_al_2024.
To identify pathway enrichment, we analyzed the top 100 genes from HIP overexpression screen using the STRING Network Analysis database version 11.5. The settings utilized encompassed the full STRING network, with all active interaction sources selected, and a minimum required interaction score of 0.7 (indicating high confidence). MCL clustering, employing an inflation parameter of 3, was employed, and dotted lines were used to denote edges between clusters.
Chromatin immunoprecipitation (ChIP) and Quantitative PCR (qPCR)
Cells with CSE4-3xHA tags were grown to mid-log phase and MNAse-ChIP was performed as described23. Briefly, cultures were fixed with formaldehyde (1% final) for 10 minutes and chromatin was harvested by bead beating in the presence of lysis buffer (100 mM Tris pH 7.5, 150 mM NaCl, 0.1 mM EDTA, 1 mM DTT, 0.1% NP-40, 10% glycerol, protease inhibitors). For mononucleosome ChIPs, CaCl2 (3 mM final) was added to the chromatin after bead beating. Micrococcal nuclease was added (500 units, Worthington), and chromatin was incubated for 30 minutes at 37°C. The MNase reaction was stopped by addition of EDTA and EGTA to a final concentration of 25 mM. Cell extracts were diluted with dilution/wash buffer (50mM Tris(pH7.5), 150mM NaCl,0.1%NP-40). Diluted cell extracts were incubated with anti-αHA antibody (abcam (ab9110); 1:500 dilution) overnight followed by 2h with pre-blocked protein G dyna beads (Invitrogen-10004D) at 4°C. Controls omitting antibody were done for all ChIPs. qPCR was conducted on an iCycler real-time PCR machine using IQ Sybr Green Supermix (Bio-Rad). The primer sets utilized for qPCR can be found in Table S3. Occupancy of the Cse4 containing nucleosome was calculated determined using the formula 100*2ΔCt. This ratio indicates the enrichment of immunoprecipitated DNA over the input DNA for a specific target.
Microscopy and Image analysis
Live cell confocal imaging was used to study spindle length and spindle elongation. For live cell imaging, strains were grown overnight and then diluted and grown to 0.4–0.7 O.D600. Images were acquired with an Orca Flash 4.0 sCMOS on a Nikon Eclipse Ti2 microscope equipped with a Yokagawa CSU W1 10,000 rpm Spinning Disk Confocal with 50 μm pinholes, and a Nikon Plan Apochromat Lambda 100x oil (N.A. 1.49) objective lens. Samples were illuminated with 488 nm (6.75mw-8.5mw power density at sample) laser light for GFP and 561 nm (5.8–6.1mw power density at sample) laser light for mCherry (LUNV 6-line Laser Launch) with nominal power measures at the objective focal plane, using a 405/488/561/640 quad excitation filter. Bandpass emissions filters used for acquisition were 507–543 nm for GFP and 579–631 nm for mCherry. The experimental parameters, such as laser power, exposure time, z-spacing, and number of stacks, were set to identical values.
The levels of SPB protein (Tub4-GFP) in G1 cells was quantified using custom plugins (available at http://research.stowers.org/imagejplugins) developed for ImageJ software (NIH, Bethesda, MD). Prior to analysis, the raw images underwent background subtraction and were summed to generate a single plane image. Individual SPBs were identified using the “Find Maxima” function in ImageJ, with the output set to “single points.” A circular region of interest (ROI) with a diameter of 5 pixels was drawn around each SPB to encompass it completely. The integrated intensity of each ROI was then calculated and plotted.
The spindle length was measured using ImageJ, as a distance between two SPBs on sum projected images in strains with Spc98-mCherry and GFP-Tub1 (WT,2B, 2Q strains) or Spc98-mCherry and CloverGFP-Tub1 in the case of 2B-XL strain. Briefly, single points were marked on the center of each pair of SPBs of a bipolar spindle using a point tool. The X, Y co-ordinates were obtained for each. The distance between two points and was calculated using the Pythagorean formula: . The metaphase and anaphase spindles were categorized based on the position of the spindle pole bodies (SPBs). In a metaphase spindle, both SPBs are in the mother cell, whereas in an anaphase spindle, one SPB is situated in the mother and one in the daughter cell. As the spindle lengths are calculated on sum projected images, the actual spindle length might be slightly more than reported spindle length in all experiments.
For time lapse imaging, strains with Spc98-mCherry and GFP-Tub1 (WT,2Q,2B) or Spc98-mCherry and CloverGFP-Tub1 (2B-XL) were grown overnight to saturation at 30°C in imaging medium (YNB+CAA broth). Cultures were diluted and plated onto SC-complete agar plates at ~OD600 0.2. The strains were then allowed to grow for 3–4 hours before mounting. A section of agarose was then dissected from the plate and inverted into a Matsunami glass bottom dish with no coating (dish diameter- 35mm; glass diameter-14mm; glass thickness-No.0) for imaging. Timelapse images were acquired every 5 minutes for 561/488 channels for the 2B and 2Q strains. In the 2B-XL strain images were captured every 5 minutes for the 561 channel and 10 minutes for the 488 channel. Captured images were later processed using Image J using a custom macro as described above. Spindle dynamics were examined by both the signal of the Tub1-GFP (CloverGFP-Tub1 for 2B-XL) and Spc98-mCherry over time. Velocity of SPB separation (v) is calculated by measuring the displacement in length(l) (from the start of anaphase to end of telophase) over time(t) using the formula v = l/t.
Spindle bending was quantified using the open-source Fiji/Image J plugin called Kappa (κ) 44 on sum projected images in strains with Spc98-mCherry and GFP-Tub1 (WT,2B, 2Q strains) or Spc98-mCherry and CloverGFP-Tub1 in the case of 2B-XL strain. Briefly, anaphase spindles in each strain were marked by drawing a segmented line along the spindle axis using the segmented line tool in Fiji/Image J. Each segmented line was added to the ROI manager. The image and the respective ROIs were imported into the Kappa (κ) plugin and analyzed by B-spline interpolation. Exported data were further analyzed in R (v. 4.2.2) with conversion of the average curvature values (1/R) to average spindle radii in microns. The full source code is available at https://github.com/jmvarberg/Kunchala_et_al_2024.
QUANTIFICATION AND STATISTICAL ANALYSIS
All the statistical details of each figure panel can be found in the corresponding legend. Statistical tests were performed using GraphPad Prism version 10.1.1 (270) for macOS, GraphPad Software, Boston, Massachusetts USA, www.graphpad.com.
Supplementary Material
Table S2. Z-Scores Analysis: Overexpression Screen Results for WT, 2B, and 2Q Strains, related to Figure 1.
Highlights.
Yeast with fewer but longer chromosomes challenge the mitotic spindle
Mega chromosomes create unique genetic requirements
Karyotype sets spindle pole body size, microtubule number, type, and spindle length
Spindle scaling and dynamics are plastic and adapt to the karyotype
Acknowledgements
We would like to thank Dr. Boeke and Dr. Qin for sharing yeast strains. We thank members of the Gerton, Hawley and Jaspersen labs for discussion and feedback on this work. We gratefully acknowledge contributions from undergraduate Sarah Joseph. We thank the microscopy core at Stowers Institute for Medical Research for assistance and feedback on the project. Electron microscopy was performed at the University of Colorado, Boulder EM Services Core Facility in the MCDB Department, with the technical assistance of facility staff. Research reported in this publication was supported by the Stowers Institute for Medical Research and NIH grant award number R01GM121443 to SLJ/JLG.
Footnotes
Declaration of interests
The authors declare no competing interests.
Publisher's Disclaimer: This is a PDF file of an unedited manuscript that has been accepted for publication. As a service to our customers we are providing this early version of the manuscript. The manuscript will undergo copyediting, typesetting, and review of the resulting proof before it is published in its final form. Please note that during the production process errors may be discovered which could affect the content, and all legal disclaimers that apply to the journal pertain.
References
- 1.Silva JC, Soares FAF, Sattler MC, and Clarindo WR (2020). Repetitive sequences and structural chromosome alterations promote intraspecific variations in Zea mays L. karyotype. Sci Rep 10, 8866. 10.1038/s41598-020-65779-3. [DOI] [PMC free article] [PubMed] [Google Scholar]
- 2.Lukhtanov VA, Dincă V, Talavera G, and Vila R (2011). Unprecedented within-species chromosome number cline in the Wood White butterfly Leptidea sinapis and its significance for karyotype evolution and speciation. BMC Evolutionary Biology 11, 109. 10.1186/1471-2148-11-109. [DOI] [PMC free article] [PubMed] [Google Scholar]
- 3.Cook LG (2000). Extraordinary and extensive karyotyptic variation: A 48-fold range in chromosome number in the gall-inducing scale insect Apiomorpha (Hemiptera: Coccoidea: Eriococcidae). Genome 43, 255–263. [PubMed] [Google Scholar]
- 4.Ghigliotti L, Christiansen JS, Carlig E, Di Blasi D, and Pisano E (2020). Latitudinal Cline in Chromosome Numbers of Ice Cod A. glacialis (Gadidae) from Northeast Greenland. Genes 11, 1515. 10.3390/genes11121515. [DOI] [PMC free article] [PubMed] [Google Scholar]
- 5.Zhang XM, Yan M, Yang Z, Xiang H, Tang W, Cai X, Wu Q, Liu X, Pei G, and Li J (2022). Creation of artificial karyotypes in mice reveals robustness of genome organization. Cell Res 32, 1026–1029. 10.1038/s41422-022-00722-x. [DOI] [PMC free article] [PubMed] [Google Scholar]
- 6.Britton-Davidian J, Catalan J, da Graça Ramalhinho M, Ganem G, Auffray J-C, Capela R, Biscoito M, Searle JB, and da Luz Mathias M (2000). Rapid chromosomal evolution in island mice. Nature 403, 158–158. 10.1038/35003116. [DOI] [PubMed] [Google Scholar]
- 7.Winey M, and Bloom K (2012). Mitotic Spindle Form and Function. Genetics 190, 1197–1224. 10.1534/genetics.111.128710. [DOI] [PMC free article] [PubMed] [Google Scholar]
- 8.Storchová Z, Breneman A, Cande J, Dunn J, Burbank K, O’Toole E, and Pellman D (2006). Genome-wide genetic analysis of polyploidy in yeast. Nature 443, 541–547. 10.1038/nature05178. [DOI] [PubMed] [Google Scholar]
- 9.Byers B, and Goetsch L (1974). Duplication of Spindle Plaques and Integration of the Yeast Cell Cycle. Cold Spring Harbor Symposia on Quantitative Biology 38, 123–131. 10.1101/SQB.1974.038.01.016. [DOI] [PubMed] [Google Scholar]
- 10.Byers B, and Goetsch L (1975). Electron microscopic observations on the meiotic karyotype of diploid and tetraploid Saccharomyces cerevisiae. Proceedings of the National Academy of Sciences 72, 5056–5060. 10.1073/pnas.72.12.5056. [DOI] [PMC free article] [PubMed] [Google Scholar]
- 11.Nannas NJ, O’Toole ET, Winey M, and Murray AW (2014). Chromosomal attachments set length and microtubule number in the Saccharomyces cerevisiae mitotic spindle. Mol Biol Cell 25, 4034–4048. 10.1091/mbc.E14-01-0016. [DOI] [PMC free article] [PubMed] [Google Scholar]
- 12.Shao Y, Lu N, Wu Z, Cai C, Wang S, Zhang L-L, Zhou F, Xiao S, Liu L, Zeng X, et al. (2018). Creating a functional single-chromosome yeast. Nature 560, 331–335. 10.1038/s41586-018-0382-x. [DOI] [PubMed] [Google Scholar]
- 13.Luo J, Sun X, Cormack BP, and Boeke JD (2018). Karyotype engineering by chromosome fusion leads to reproductive isolation in yeast. Nature 560, 392–396. 10.1038/s41586-018-0374-x. [DOI] [PMC free article] [PubMed] [Google Scholar]
- 14.Lazar-Stefanita L, Luo J, Montagne R, Thierry A, Sun X, Mercy G, Mozziconacci J, Koszul R, and Boeke JD (2022). Karyotype engineering reveals spatio-temporal control of replication firing and gene contacts. Cell Genom 2, 100163. 10.1016/j.xgen.2022.100163. [DOI] [PMC free article] [PubMed] [Google Scholar]
- 15.Hu Y, Rolfs A, Bhullar B, Murthy TVS, Zhu C, Berger MF, Camargo AA, Kelley F, McCarron S, Jepson D, et al. (2007). Approaching a complete repository of sequence-verified protein-encoding clones for Saccharomyces cerevisiae. Genome Res. 17, 536–543. 10.1101/gr.6037607. [DOI] [PMC free article] [PubMed] [Google Scholar]
- 16.Pellman D, Bagget M, Tu YH, Fink GR, and Tu H (1995). Two microtubule-associated proteins required for anaphase spindle movement in Saccharomyces cerevisiae. J Cell Biol 130, 1373–1385. 10.1083/jcb.130.6.1373. [DOI] [PMC free article] [PubMed] [Google Scholar]
- 17.Kotwaliwale CV, Frei SB, Stern BM, and Biggins S (2007). A Pathway Containing the Ipl1/Aurora Protein Kinase and the Spindle Midzone Protein Ase1 Regulates Yeast Spindle Assembly. Developmental Cell 13, 433–445. 10.1016/j.devcel.2007.07.003. [DOI] [PMC free article] [PubMed] [Google Scholar]
- 18.Cottingham FR, and Hoyt MA (1997). Mitotic Spindle Positioning in Saccharomyces cerevisiae Is Accomplished by Antagonistically Acting Microtubule Motor Proteins. J Cell Biol 138, 1041–1053. [DOI] [PMC free article] [PubMed] [Google Scholar]
- 19.Funk C, Schmeiser V, Ortiz J, and Lechner J (2014). A TOGL domain specifically targets yeast CLASP to kinetochores to stabilize kinetochore microtubules. Journal of Cell Biology 205, 555–571. 10.1083/jcb.201310018. [DOI] [PMC free article] [PubMed] [Google Scholar]
- 20.Ortiz J, Funk C, Schäfer A, and Lechner J (2009). Stu1 inversely regulates kinetochore capture and spindle stability. Genes Dev 23, 2778–2791. 10.1101/gad.541309. [DOI] [PMC free article] [PubMed] [Google Scholar]
- 21.Yin H, You L, Pasqualone D, Kopski KM, and Huffaker TC (2002). Stu1p Is Physically Associated with β-Tubulin and Is Required for Structural Integrity of the Mitotic Spindle. Mol Biol Cell 13, 1881–1892. 10.1091/mbc.01-09-0458. [DOI] [PMC free article] [PubMed] [Google Scholar]
- 22.Winey M, Mamay CL, O’Toole ET, Mastronarde DN, Giddings TH Jr, McDonald KL, and McIntosh JR (1995). Three-dimensional ultrastructural analysis of the Saccharomyces cerevisiae mitotic spindle. Journal of Cell Biology 129, 1601–1615. 10.1083/jcb.129.6.1601. [DOI] [PMC free article] [PubMed] [Google Scholar]
- 23.Camahort R, Shivaraju M, Mattingly M, Li B, Nakanishi S, Zhu D, Shilatifard A, Workman JL, and Gerton JL (2009). Cse4 is Part of an Octameric Nucleosome in Budding Yeast. Mol Cell 35, 794–805. 10.1016/j.molcel.2009.07.022. [DOI] [PMC free article] [PubMed] [Google Scholar]
- 24.Zhang H, and Dawe RK (2012). Total centromere size and genome size are strongly correlated in ten grass species. Chromosome Res 20, 403–412. 10.1007/s10577-012-9284-1. [DOI] [PMC free article] [PubMed] [Google Scholar]
- 25.Wang N, Liu J, Ricci WA, Gent JI, and Dawe RK (2021). Maize centromeric chromatin scales with changes in genome size. Genetics 217, iyab020. 10.1093/genetics/iyab020. [DOI] [PMC free article] [PubMed] [Google Scholar]
- 26.Mary H, and Brouhard GJ (2019). Kappa (κ): Analysis of Curvature in Biological Image Data using B-splines. Preprint at bioRxiv, 10.1101/852772 10.1101/852772. [DOI] [Google Scholar]
- 27.Jaspersen SL, and Winey M (2004). The budding yeast spindle pole body: structure, duplication, and function. Annu Rev Cell Dev Biol 20, 1–28. 10.1146/annurev.cellbio.20.022003.114106. [DOI] [PubMed] [Google Scholar]
- 28.Norden C, Mendoza M, Dobbelaere J, Kotwaliwale CV, Biggins S, and Barral Y (2006). The NoCut Pathway Links Completion of Cytokinesis to Spindle Midzone Function to Prevent Chromosome Breakage. Cell 125, 85–98. 10.1016/j.cell.2006.01.045. [DOI] [PubMed] [Google Scholar]
- 29.Clarke L, and Carbon J (1980). Isolation of a yeast centromere and construction of functional small circular chromosomes. Nature 287, 504–509. 10.1038/287504a0. [DOI] [PubMed] [Google Scholar]
- 30.Bloom KS, and Carbon J (1982). Yeast centromere DNA is in a unique and highly ordered structure in chromosomes and small circular minichromosomes. Cell 29, 305–317. 10.1016/0092-8674(82)90147-7. [DOI] [PubMed] [Google Scholar]
- 31.Karim AS, Curran KA, and Alper HS (2013). Characterization of plasmid burden and copy number in Saccharomyces cerevisiae for optimization of metabolic engineering applications. FEMS Yeast Res 13, 10.1111/1567–1364.12016. 10.1111/1567-1364.12016. [DOI] [PMC free article] [PubMed] [Google Scholar]
- 32.Li R, and Murray AW (1991). Feedback control of mitosis in budding yeast. Cell 66, 519–531. 10.1016/0092-8674(81)90015-5. [DOI] [PubMed] [Google Scholar]
- 33.Hardwick KG, and Murray AW (1995). Mad1p, a phosphoprotein component of the spindle assembly checkpoint in budding yeast. Journal of Cell Biology 131, 709–720. 10.1083/jcb.131.3.709. [DOI] [PMC free article] [PubMed] [Google Scholar]
- 34.Schubert I, and Oud JL (1997). There Is an Upper Limit of Chromosome Size for Normal Development of an Organism. Cell 88, 515–520. 10.1016/S0092-8674(00)81891-7. [DOI] [PubMed] [Google Scholar]
- 35.Neurohr G, Naegeli A, Titos I, Theler D, Greber B, Díez J, Gabaldón T, Mendoza M, and Barral Y (2011). A midzone-based ruler adjusts chromosome compaction to anaphase spindle length. Science 332, 465–468. 10.1126/science.1201578. [DOI] [PubMed] [Google Scholar]
- 36.Romao M, Tanaka K, Sibarita J-B, Ly-Hartig NTB, Tanaka TU, and Antony C (2008). Three-dimensional electron microscopy analysis of ndc10–1 mutant reveals an aberrant organization of the mitotic spindle and spindle pole body defects in Saccharomyces cerevisiae. J Struct Biol 163, 18–28. 10.1016/j.jsb.2008.03.015. [DOI] [PubMed] [Google Scholar]
- 37.Fernius J, and Marston AL (2009). Establishment of Cohesion at the Pericentromere by the Ctf19 Kinetochore Subcomplex and the Replication Fork-Associated Factor, Csm3. PLOS Genetics 5, e1000629. 10.1371/journal.pgen.1000629. [DOI] [PMC free article] [PubMed] [Google Scholar]
- 38.Gardner JM, and Jaspersen SL (2014). Manipulating the yeast genome: deletion, mutation, and tagging by PCR. Methods Mol Biol 1205, 45–78. 10.1007/978-1-4939-1363-3_5. [DOI] [PubMed] [Google Scholar]
- 39.Ho CH, Magtanong L, Barker SL, Gresham D, Nishimura S, Natarajan P, Koh JLY, Porter J, Gray CA, Andersen RJ, et al. (2009). A molecular barcoded yeast ORF library enables mode-of-action analysis of bioactive compounds. Nature Biotechnology 27, 369–377. 10.1038/nbt.1534. [DOI] [PMC free article] [PubMed] [Google Scholar]
- 40.Rosebrock AP (2017). Analysis of the Budding Yeast Cell Cycle by Flow Cytometry. Cold Spring Harb Protoc 2017, pdb.prot088740. 10.1101/pdb.prot088740. [DOI] [PubMed] [Google Scholar]
- 41.Giddings TH, O’Toole ET, Morphew M, Mastronarde DN, McIntosh JR, and Winey M (2001). Using Rapid Freeze and Freeze-Substitution for the Preparation of Yeast Cells for Electron Microscopy and Three-Dimensional Analysis. Methods Cell Biol 67, 27–42. [DOI] [PMC free article] [PubMed] [Google Scholar]
- 42.O’Toole ET, Giddings TH, and Winey M (2017). Cryopreparation and Electron Tomography of Yeast Cells. Cold Spring Harb Protoc 2017. 10.1101/pdb.prot085589. [DOI] [PubMed] [Google Scholar]
- 43.Mastronarde DN (2005). Automated electron microscope tomography using robust prediction of specimen movements. J Struct Biol 152, 36–51. 10.1016/j.jsb.2005.07.007. [DOI] [PubMed] [Google Scholar]
- 44.Kremer JR, Mastronarde DN, and McIntosh JR (1996). Computer visualization of three-dimensional image data using IMOD. J Struct Biol 116, 71–76. 10.1006/jsbi.1996.0013. [DOI] [PubMed] [Google Scholar]
- 45.Mastronarde DN (1997). Dual-axis tomography: an approach with alignment methods that preserve resolution. J Struct Biol 120, 343–352. 10.1006/jsbi.1997.3919. [DOI] [PubMed] [Google Scholar]
- 46.Varberg JM, Gardner JM, McCroskey S, Saravanan S, Bradford WD, and Jaspersen SL (2020). High-Throughput Identification of Nuclear Envelope Protein Interactions in Schizosaccharomyces pombe Using an Arrayed Membrane Yeast-Two Hybrid Library. G3 (Bethesda) 10, 4649–4663. 10.1534/g3.120.401880. [DOI] [PMC free article] [PubMed] [Google Scholar]
- 47.R Core Team (2022). R: A Language and Environment for Statistical Computing. [Google Scholar]
Associated Data
This section collects any data citations, data availability statements, or supplementary materials included in this article.
Supplementary Materials
Table S2. Z-Scores Analysis: Overexpression Screen Results for WT, 2B, and 2Q Strains, related to Figure 1.
Data Availability Statement
Original images and data underlying this manuscript can be accessed from the Stowers Original Data Repository. The ODR link is listed in the key resources table.
Key resources table.
| REAGENT or RESOURCE | SOURCE | IDENTIFIER |
|---|---|---|
| Antibodies | ||
| Anti-HA (12CA5) | Roche | RRID# AB_514505 |
| Anti-HA (ChIP) | abcam | ab9110 |
| Chemicals, peptides, and recombinant proteins | ||
| Formaldehyde Solution | Sigma-Aldrich | Cat# 252549 |
| Proteinase K | ThermoFisher | Cat# EO0491 |
| GelRed Nucleic Acid Gel Stain | Biotium | Cat# 41103 |
| 5-Fluoroorotic Acid | Zymo Research | Cat# F9001 |
| Micrococcal nuclease | Worthington Biochemical | Cat# LS004798 |
| Propidium iodide solution | Sigma-Aldrich | Cat# P4864 |
| Triton X-100 | Sigma-Aldrich | Cat# T9284 |
| NP-40 Alternative | Sigma-Aldrich | Cat# 492016 |
| Sodium Deoxycholate | Sigma-Aldrich | Cat# S1827 |
| cOmplete Protease Inhibitors Cocktail | Sigma-Aldrich | Cat# 11836145001 |
| Bovine serum albumin | Sigma-Aldrich | Cat# 9048–46-8 |
| Sodium azide | VWR | Cat# 97064–646 |
| RNase A | ThermoFisher | Cat# EN0531 |
| Critical commercial assays | ||
| Dynabeads Protein G | Invitrogen | Cat# 10004D |
| SYBR Green Master Mix | ThermoFisher | Cat# A25742 |
| Deposited data | ||
| Raw data presented in this manuscript | This study | https://www.stowers.org/research/publications/libpb-2437 |
| Original Code used in the manuscript | This study | https://github.com/jmvarberg/Kunchala_et_al_2024 |
| Experimental models: Organisms/strains | ||
| All Saccharomyces cerevisiae strains used in this study are listed in Table S1 | Lab stock and this study | N/A |
| Oligonucleotides | ||
| Oligonucleotides used in this study are listed in Table S3 | N/A | |
| Recombinant DNA | ||
| Yeast MOBY collection | Ho et al.39 | DOI:10.1038/nbt.1534 |
| Yeast HIP ORF collection | Hu et al.15 | DOI:10.1101/gr.6037607 |
| Software and algorithms | ||
| Fiji (Image J) V2.3.1/1.53f | https://imageJ.net/ | RRID:SCR_002285 |
| FlowJo v9 | FlowJo | RRID# SCR_008520 |
| Prism V9.3.1 | GraphPad | RRID# SCR_002798 |
| R v 4.2.1 | R core team | RRID# SCR_001905 |
All original code has been deposited at GitHub and is publicly available as of the date of publication and is listed in the key resources table. DOIs are listed in the key resources table. Any additional information required to reanalyze the data reported in this paper is available from the lead contact upon request.