

Abstract
Biofilms are highly resistant to antimicrobials, often causing chronic infections. Combining antimicrobials with low-frequency ultrasound (LFU) enhances antimicrobial efficiency, but little is known about the underlying mechanisms. Biofilm physical characteristics, which depend on factors such as growth conditions and age, can have significant effects on inactivation efficiency. In this study, we investigated the susceptibility of Pseudomonas aeruginosa biofilms to tobramycin, with and without LFU treatment. The biofilms were grown under low and high fluid shear to provide different characteristics. Low-shear biofilms exhibited greater thickness, roughness, and porosity and lower density, compared to high-shear biofilms. The biofilm matrix of the high-shear biofilms had a three times higher protein-to-polysaccharide ratio, suggesting greater biofilm stiffness. This was supported by microrheology measurements of biofilm creep compliance. For the low-shear biofilms without LFU, the viability of the biofilms in their inner regions was largely unaffected by the antibiotic after a 2-hour treatment. However, when tobramycin was combined with LFU, the inactivation for the entire biofilm increased to 80% after 2 h. For the high-shear biofilms without LFU, higher LFU intensities were needed to achieve similar inactivation results. Microrheology measurements revealed that changes in biofilm inactivation profiles were closely related to changes in biofilm mechanical properties. Modeling suggests that LFU changes antibiotic diffusivity within the biofilm, probably due to a “decohesion” effect. Overall, this research suggests that biofilm physical characteristics (e.g., compliance, morphology) are linked to antimicrobial efficiency. LFU weakens the biofilm while increasing its diffusivity for antibiotics.
Subject terms: Biofilms, Clinical microbiology
Introduction
Biofilms are aggregates of bacteria embedded in a gel-like matrix of extracellular polymeric substances (EPS). This matrix provides adhesion to surfaces, cohesion among bacteria, and protection against antimicrobials1. Biofilms are often associated with chronic infections, such as those related to wounds, urinary catheters, and medical implants. They pose a critical concern, as they are 100 to 1000 times more resistant to antibiotics than planktonic bacteria2. This is partially due to their protective EPS layer, which hinders or prevents antibiotic penetration3–5.
The antibiotic susceptibility of biofilms can change significantly with biofilm physical characteristics, such as the biofilm thickness, density, morphology, and mechanical properties. They also may vary with the EPS composition, which can alter the structural characteristics of the biofilm and its sorptive properties. These attributes can influence antimicrobial diffusion in the biofilm6, affecting the efficiency of the treatment. Biofilm physical characteristics are affected by a range of factors, most notably by the fluid shear stresses and nutrient availability during growth, as well as the biofilm age. Fluid shear could be relevant to a range of biofilm infections, such as biofilms that develop on blood-indwelling devices, where shear stresses are induced by blood flow7.
Low-frequency ultrasound (LFU) has been shown to enhance the susceptibility of biofilms to antimicrobials8–10. Qian et al.11,12 observed a synergistic effect of antibiotics and LFU, known as a “bioacoustic effect,” where LFU enhanced the antibiotic’s bactericidal effect on Pseudomonas aeruginosa biofilms without disrupting the biofilm or dispersing bacteria. More recently, in vivo studies found that LFU had a significant effect on biofilm-infected wounds, leading to improved wound healing10,13. Moreover, LFU was shown to enhance antibiotic effectiveness for antibiotic-resistant strains4,14.
While prior research has investigated the impact of LFU on antibiotic susceptibility for several different bacterial strains, no studies have addressed how biofilm physical characteristics can affect their susceptibility to antibiotics combined with LFU. This can have important practical implications for this strategy.
In this study, we grew P. aeruginosa biofilms under low and high shear conditions. We first determined the physical characteristics of sonicated and non-sonicated biofilms, including thickness, roughness, and mechanical properties (i.e., creep compliance). We also determined the EPS composition, which is linked to the mechanical properties of biofilms. We then compared biofilm susceptibility to antibiotics, both with and without LFU. A one-dimensional diffusion model was developed to elucidate potential mechanisms underlying the effects of LFU on biofilm antibiotic susceptibility.
The results of this research can help understand how biofilm physical properties can affect the efficiency of LFU for biofilm inactivation. This research can help lead to the more effective use of LFU as a therapeutic strategy for biofilm infections.
Results and discussion
Biofilm structure
Biofilms grown under low and high fluid shear were analyzed by optical coherence tomography (OCT) to study their morphology, thickness, and roughness. Typical micrographs from the OCT are shown in Fig. 1. Low-shear biofilms had an average thickness of 52 ± 20 µm and a relative roughness of 0.31 ± 0.09. A dendritic structure was observed with elongated, filament-like patterns. The structure appeared highly porous, with voids and streamers in the upper layers of the biofilm. Biofilms grown under high shear stress were thinner (29 ± 8 µm), with a relative roughness of 0.18 ± 0.06. As indicated by the reduced relative roughness, the biofilm structure had a more compact and uniform appearance on the upper surface, with the absence of streamers or voids.
Fig. 1. Typical OCT images of biofilms grown under low shear (above) and high shear (below).
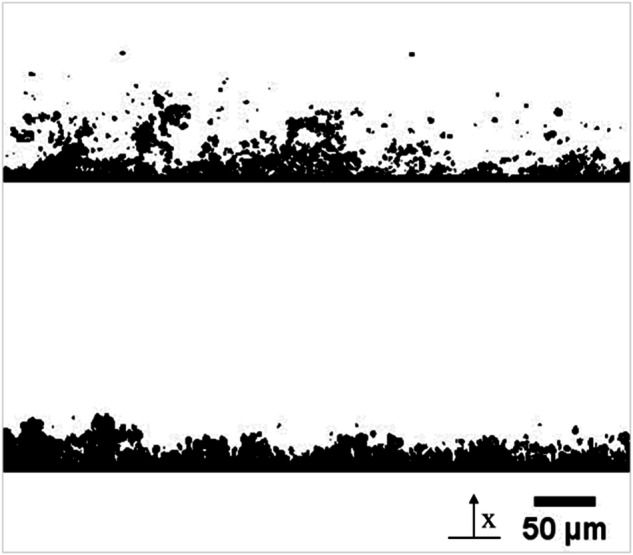
The coordinate x (used in the simulations) starts at the bottom of the biofilm.
These results agree with previous studies. For example, Vieira et al.15 exposed Pseudomonas fluorescens biofilms to turbulent flow and found that biofilms were thinner at higher shear stresses and had lower internal diffusivities. Fanesi et al.16 grew Chlorella vulgaris biofilms in flow cells at three different shear stresses (1.0, 6.5, and 11.0 mPa) and found that higher shear significantly increased the cohesion of the biofilms and allowed for thinner biofilms than lower shear stresses. Hart et al.17 grew Staphylococcus aureus under 1.0 mPa and 10.0 mPa and found that biofilms subjected to increased shear stresses had more uniform and compact biofilm growth, as loosely bound bacteria detached from the biofilm.
Biofilm EPS composition
Figure 2 shows the relative abundance of the main EPS components for biofilms grown at both low and high shear. eDNA content was higher in the low-shear biofilm (22.14 ± 13.43%) than in the high-shear biofilm (4.88 ± 2.12%). A ratio of proteins to polysaccharides (PN/PS) was used to assess the stability and cohesion of a biofilm. An almost three times higher ratio was observed in the high-shear biofilm (1.15 ± 0.55) compared to the low-shear biofilm (0.39 ± 0.20).
Fig. 2. EPS matrix composition.

a Relative abundance of polysaccharides, proteins, and eDNA in the EPS for biofilms grown at low and high shear. b Ratio of proteins to polysaccharides of each biofilm. Error bars correspond to measurements on three experimental replicates.
The composition of proteins, polysaccharides, and eDNA within the EPS matrix can fluctuate, influencing its strength and cohesiveness. A protein-rich EPS matrix tends to exhibit hydrophobic properties, while EPS abundant in polysaccharides displays hydrophilic characteristics18. Therefore, a matrix with a higher content of proteins (higher PN/PS ratio) correlates with increased aggregation and adhesive properties and is linked to a more compact, less porous, and more stable biofilm19,20. In agreement with our results, Wang et al.21 grew mixed cultured biofilms under different flow velocities and found higher contents of proteins in the high-shear biofilms, as well as higher contents of total EPS, including an increase in polysaccharide concentrations.
Biofilm mechanical properties
We used microrheology to quantify the spatial distribution of biofilm mechanical properties. We calculated the mean square displacement (MSD) to assess the mobility or movement of particles within a biofilm over a specific time. This kinetic measure can be translated to creep compliance [Pa−1], which describes the rate at which strain increases for a constant applied stress. The highest compliance was observed in the biofilm grown under low shear, with a median compliance of 5570 ± 101 Pa−1 and 8640 ± 57 Pa−1 for the inner and outer biofilm, respectively. The high-shear biofilm had a median creep compliance of 31 ± 1 Pa−1 (inner) and 49 ± 3 Pa−1 (outer). A two-orders-of-magnitude difference between the biofilms suggests that the high-shear biofilm was much stiffer than the low-shear biofilm. Previous research has reported biofilm heterogeneity with different mechanical properties in different biofilm layers, with stiffer regions in the inner portions of the biofilm and weaker towards the outer biofilm22–24. Fluid shear has also been shown to affect mechanical properties, with higher flow rates resulting in stiffer biofilms22. In all cases, the outer portion of the biofilm always had a greater creep compliance than the inner portion.
Creep compliance curves were fitted to a power law (Supplementary Fig. 1). The exponent α = 0 corresponds to elastic behavior, while α = 1 corresponds to viscous behavior. When subjected to stress, biofilms can have both reversible elastic responses and irreversible deformation and have both elastic and viscous components25,26. For moderate loadings, they exhibit primarily reversible elastic responses. For higher loadings, they exhibit irreversible deformation characteristic of viscous materials. In our results, the exponent was close to zero for the high-shear biofilm (average ) and closer to 1 for the low-shear biofilm (), suggesting that the low-shear biofilm had a greater viscous component.
There is a general consensus that biofilms grown under high shear are stiffer than those grown under lower shear27,28. For instance, Allen et al.29 grew P. fluorescens biofilms under semi-static conditions and found more compliant biofilms than those grown with high shear. Beneyal and Lewandowski30 concluded that the flow rate that biofilms are grown under dictates mechanical strength, with increasing strength at higher rates.
Effects of LFU on biofilm structure
To analyze the effect of LFU on biofilm structure, we subjected low- and high-shear biofilms to low-, medium-, or high-intensity LFU for 60 sec. No significant changes were seen when low- and high-shear biofilms were subjected to LFU at low intensity (Fig. 3). Thickness before and after LFU were 52 ± 20 and 50 ± 19 µm, respectively, while the relative roughness changed from 0.18 ± 0.06 to 0.21 ± 0.14. However, medium-intensity LFU caused a high degree of biofilm disruption for the low-shear biofilm. Dispersed particles and a swollen biofilm were observed (Fig. 3c). For the high-shear biofilm, no disruption was observed at any intensity. As shown in Fig. 3f, g, the structure remained unaltered at medium intensities (thickness 31 ± 8 µm) and slightly thinner at high intensities (thickness 27 ± 8 µm).
Fig. 3. Structure and morphology of biofilms.

A typical biofilms under the OCT at low and high shear before and after 60 s of LFU treatment at different intensities. Each figure is not necessarily from the same location but from the same biofilm (either low-shear or high-shear condition). Given that the low-shear biofilm was disrupted (substantially altered) when sonicated with LFU medium intensity, it was not subjected to high-intensity LFU. B Biofilm thickness grown under low and high shear. Given that the low-shear biofilm was disrupted when sonicated with LFU at medium intensity, no thickness data is shown at either medium or high intensities. Error bars correspond to measurements on three experimental replicates.
Effects of LFU on biofilm mechanical properties
Microrheology was used to determine the effect of LFU on biofilm creep compliance. This was done by determining the compliance before and after LFU treatment at different intensities. Results are shown in Fig. 4. For low-shear biofilms, the effect of LFU was studied only using low-intensity LFU because higher intensities severely disrupted the biofilm. Low-intensity LFU increased the compliance in the inner and outer portions by 42% and 29%, respectively. This indicates a decrease in biofilm stiffness throughout the whole biofilm. For the high-shear biofilm, low-intensity LFU only increased compliance in the inner and outer portions by 9% and 10%, respectively. When applying LFU at medium intensity, the inner biofilm compliance increased by 14%, but the outer biofilm compliance increased by 53%, suggesting a greater effect towards the outer portions of the biofilm. Performing the same treatment at a high LFU intensity resulted in an increase in compliance of 25% in the inner biofilm and more than one order of magnitude increase (135%) in the outer biofilm. Such a high increase suggests decohesion and tearing of the biofilm structure. The effect was higher in the outer biofilm. This was possibly because that region was more compliant prior to LFU and, therefore, more susceptible to mechanical changes. While significant alterations in biofilm compliance were noted at higher intensities (see Fig. 4), no significant changes in thickness were observed within the microstructure (see Fig. 3f, g) using OCT, likely due to resolution limitations. Higher LFU intensities may be needed to allow for more noticeable modifications in the biofilm structure.
Fig. 4. Biofilm creep compliance.

Biofilms grown at low shear (green) and high shear (orange) before applying LFU for 60 s at low, medium, or high intensity. Only low intensity was used for the biofilm grown under low shear, as higher intensities resulted in biofilm disruption. Error bars correspond to one standard deviation for three replicates.
The structure of the biofilm can influence the impacts of LFU. The low-shear biofilm was highly susceptible to structural changes, such as disruption and dispersion. This is probably due to its EPS composition, which contributes to the intrinsic biofilm mechanical properties. A substantial two-orders-of-magnitude difference in creep compliance was observed between the two biofilms. The low-shear biofilm displayed high viscous component and creep compliance, essentially indicating a weaker structure. It is possible that the high-shear biofilm was stiffer due to the higher concentration of proteins, and this allowed for the increased stiffness mentioned above. It is also likely that the elevated stiffness, resulting from growth under high-shear conditions, may have contributed to greater LFU attenuation. This could result in greater energy dissipation and a less effective sonication regimen.
Antibiotic susceptibility of low-shear biofilm without LFU
Biofilms grown under low and high shear stress were tested with the aminoglycoside antibiotic tobramycin. This antibiotic binds to bacterial ribosomes and interferes with protein synthesis31. It is effective against a wide range of Gram-negative bacteria, including the strain used in this study. Biofilms were subjected to different tobramycin concentrations under stagnant conditions under a confocal laser scanning microscope (CLSM) for 120 min. For each condition, the inner biofilm is referred to as the first 5 µm closest to the attachment surface, while outer biofilm corresponds to the outer 5 µm. The middle biofilm was calculated as half of the averaged biofilm thickness, and the middle section was ± 2.5 µm from this location.
For low-shear biofilms without LFU, Fig. 5 shows the distributions of cell viability over time and biofilm depth. A control with phosphate buffer and no antibiotic (Fig. 5a) had cell viability ranging from 97 ± 1% and 99 ± 1%. As expected, cells remained viable over 120 min. despite the absence of nutrients. Increasing the concentration of tobramycin from 100 µg/ml to 300 µg/ml (Fig. 5b–d) reduced cell viability within a 2-hour timeframe.
Fig. 5. Cell viability, without LFU, for the low-shear biofilm for a range of different tobramycin concentrations.

Duration of the experiments: 120 min. Doses of tobramycin applied: (a) 0 (control), (b) 100 µg/ml, (c) 200 µg/ml, (d) 300 µg/ml. The time scale is represented from dark green (Time 0) to light green (Time 120 min).
For 100 µg/ml tobramycin, the inactivation effect varied with biofilm depth. For the outer biofilm, 82 ± 2% of the cells remained viable, while 90 ± 1% and 95 ± 2% remained viable towards the middle and inner portion of the biofilm, respectively. For 200 µg/ml tobramycin, the cell viability was approximately 50% in the outer biofilm. However, cell viability remained considerably higher in the inner section of the biofilm, at 77 ± 1% and 95 ± 2%, respectively. With 300 µg/ml tobramycin, cell viability in the outer biofilm decreased more significantly to 33 ± 9%, while the viability of the inner portions remained high, at around 83 ± 3%.
Table 1 shows the inactivation efficiency of tobramycin at varying concentrations in different sections of the low-shear biofilms over 120 min. Except for the control, the inactivation efficiencies were higher in the outer biofilm but decreased towards the inner portions of the biofilms.
Table 1.
Inactivation efficiency, without LFU, on the inner and outer regions of a low-shear biofilm using different tobramycin concentrations after 120 min
| Tobramycin concentration (µg/ml) | Inactivation efficiency (%) | |
|---|---|---|
| Inner biofilm | Outer biofilm | |
| 0 | 0.49 ± 1.39 | 0.79 ± 2.13 |
| 100 | 3.75 ± 2.79 | 17.20 ± 8.89 |
| 200 | 5.32 ± 3.44 | 45.42 ± 18.89 |
| 300 | 16.72 ± 9.28 | 66.59 ± 16.54 |
Antibiotic susceptibility of high-shear biofilms without LFU
For the high-shear biofilm, none of the tobramycin concentrations (100–300 µg/ml) had an appreciable effect on viability over the 120-min. experiments. The viability remained above 99% in all cases (data not shown for brevity).
Biofilms grown under higher shear stresses have been shown to have higher antimicrobial resistance. For instance, Zhang et al.7 administered ciprofloxacin to biofilms and showed that the minimum biofilm full inactivation concentration was eight times higher for biofilms cultured under flow than those cultured under static conditions. This may be due to a higher biofilm density, reducing the antibiotic diffusivity.
Antibiotic susceptibility of low-shear biofilms with LFU
In these tests, the synergistic effect of LFU with antibiotics was assessed. Biofilms were exposed to 200 µg/ml of tobramycin—the most effective concentration for low-shear biofilms—followed by 60 s of LFU.
As shown in Fig. 6 (left), when treated with antibiotics alone, the efficiency of the treatment was uneven and decreased towards the inner portions of the biofilm (see Table 1), where most of the cells remained viable after 120 min. of exposure. In contrast, when combining both tobramycin and LFU, enhanced inactivation was observed. Fig. 6 (right) indicates more rapid and deep inactivation, with an efficiency of 80.3 ± 7.6% throughout the whole thickness of the biofilm. It is important to note that low-intensity LFU treatment alone did not inactivate cells (Supplementary Fig. 2) or significantly disrupt the biofilm microstructure, as observed by OCT alone by measuring thickness and roughness. Overall, cell inactivation was faster and deeper within the biofilm following LFU.
Fig. 6. Spatiotemporal distributions of cell viability over 120 min treatment for the low-shear biofilm.

Biofilm dosed with (a) 200 µg/ml tobramycin alone and (b) 200 µg/ml tobramycin and 60 s of LFU at low intensity.
Because higher intensities of LFU severely disrupted the low-shear biofilms, only low-intensity LFU was considered for these more compliant biofilms. The changes in biofilm mechanical properties may help explain the successful inactivation efficiency achieved with LFU in the low-shear biofilm. As can be observed, the changes in biofilm cell viability align with measurements of creep compliance before and after LFU treatment (Fig. 4a), indicating a close correlation between the two. These changes in mechanical properties likely contributed to the enhanced inactivation when combined with the antibiotic.
To further quantify the enhanced inactivation effect, an inactivation constant Ka was calculated from the experimental data. The rate of biofilm inactivation followed a first-order reaction with antibiotic concentration, as described in Eq. 7 (see Materials and Methods). This value was subsequently used in the mathematical simulations discussed in Antibiotic susceptibility of low-shear biofilm without LFU While Ka without LFU was m3/mol-s, after LFU at low intensities, it increased to m3/mol-s, suggesting LFU increased the inactivation rate and consequently enhanced the inactivation efficiency.
Antibiotic susceptibility of high-shear biofilms with LFU
Fig. 7 indicates the effect of LFU on high-shear biofilms with 200 µg/ml tobramycin—the same antibiotic concentration as the low-shear biofilm—with low, medium, and high LFU intensities. Either applying the antibiotic alone or combining it with low-intensity LFU resulted in no appreciable inactivation. Although higher LFU intensities increased the inactivation both in the outer and inner portions of the biofilm, the treatment was less effective than with the low-shear biofilm. The inactivation efficiency was 31.8 ± 5.8% with medium-intensity LFU and 61.1 ± 13.7% at high intensity LFU. Performing a combination of LFU treatment at the highest intensity on the high-shear biofilm was comparable to the lowest intensity for the low-shear biofilm.
Fig. 7. Effect of LFU on the spatiotemporal distribution of cell viability of high-shear biofilms.

The total exposure time was 120 min. Treatment was performed with (a) 200 µg/ml tobramycin alone, (b) 200 µg/ml tobramycin and 60 s of LFU at low intensity, (c) 200 µg/ml tobramycin and 60 s of LFU at medium intensity, and (d) 200 µg/ml tobramycin and 60 s of LFU at high intensity. e Inactivation efficiency in inner and outer biofilm.
The viability effects for the high-shear biofilm are also correlated to its measurements of mechanical properties (Fig. 4b). Low-intensity LFU did not significantly change either the creep compliance or viability of the high-shear biofilm, which aligns with the absence of cell inactivation in any portion of the biofilm. When higher intensities were used, both creep compliance and inactivation efficiency increased, suggesting that altering the stiffness by even a short 60 s LFU pulse can impact biofilm inactivation.
The inactivation constant Ka for the high-shear biofilm was also determined from experimental data, following Eq. 7. Ka before or after low-intensity LFU—both cases with no observable changes in viability—was determined to be 9.46 × 10⁻⁶ ± 1.21 × 10⁻⁶ m3/mol-s. This was found to be significantly smaller than that of the low-shear biofilm. This is likely due to the increase in antibiotic tolerance in biofilms exposed to higher shear stresses32–34 and possibly a densely packed biofilm, where the cells are not entirely exposed to the antibiotic due to the lack of penetration. This limit of antibiotic penetration leads to sub-minimal inhibitory concentrations of antibiotics and, therefore, a higher tolerance and lower Ka. For instance, Simões et al.33 extracted P. fluorescens cells—removing EPS content—from a biofilm previously cultivated at high shear stress and demonstrated a comparable resistance to a biocide as observed when growing in a biofilm growth mode.
The medium-intensity LFU resulted in a significant increase in the Ka at m3/mol-s. The value was further increased for the high-intensity LFU, where Ka was m3/mol-s. This is over three times higher than medium-intensity LFU.
The differences between inactivation constants for the low- and high-shear biofilms may be correlated with antibiotic diffusion through the biofilms. Growth under low or high shear stresses produced structurally different biofilms, resulting in significant differences in their antibiotic susceptibility and response to LFU. A thinner biofilm—such as the one grown under high shear stress—would be expected to be more vulnerable to antibiotics due to the shorter diffusion distance to its interior. However, biofilms subjected to higher shear stresses are typically more compact, i.e., with lower roughness and smaller pores, decreasing the biofilm diffusivity35. Thus, the antibiotic may not reach the inner biofilm in the dosing period, allowing quick biofilm recovery7,15. This would also have an impact on antibiotic resistance, given that exposure to subinhibitory concentrations of antibiotics—due to lack of penetration—contributes to increased antibiotic resistance36.
The EPS matrix that surrounds biofilms acts as an important physical barrier for antibiotic diffusion, and its composition may play a crucial role. Biofilms with higher protein content—observed in the high-shear biofilm—tend to be more tightly bound together, allowing for higher cohesion and less porosity28. This could further strengthen the diffusion barrier, hindering or delaying the penetration of antibiotics into the biofilm. This may provide a possible explanation for the considerably lower susceptibility of the high-shear biofilm to antibiotic treatment. Furthermore, the EPS matrix may also contribute to electrostatic interactions with specific antibiotics, thereby increasing the diffusion barrier. Future studies should focus on alternative antibiotics to further explore the synergistic effect with LFU.
No prior studies have linked the use of LFU to changes in bacterial biofilm mechanical properties. However, past research focused on the use of ultrasound in soft tissues (i.e., viscoelastic material) found that ultrasound waves are highly attenuated at several frequencies as a consequence of their intrinsic viscoelastic nature, leading to energy dissipation37. Hence, it is possible that a similar effect may occur in biofilms. When the biofilm exhibits a high creep compliance, a higher impact from the application of LFU can be observed. Conversely, a less compliant biofilm characterized by a greater concentration of proteins in its EPS, higher cohesion, and density would function as a barrier, dissipating ultrasound energy from the outer regions to the inner portions of the biofilm.
Modeling results
We used a mathematical model to explore whether changes in biofilm diffusivity can explain the increased susceptibility to antibiotics following LFU. To match the experimental conditions, the model simulated a 50 µm-thick biofilm exposed to a 200 µg/ml initial bulk concentration of tobramycin in the liquid phase. The simulation time was 120 min, as per the experiments. Diffusion coefficients in Eq. 6 (see Methods) were fitted using the least-squares method. The Ka parameter for each condition was calculated from experimental data. All model parameters can be found in the Supplementary Information (Supplementary Table 2).
Fig. 8 shows biofilm cell viability (top a, b) and tobramycin concentrations (bottom c, d) throughout the biofilm over time. Based on the model calibration, the diffusivity of tobramycin in the biofilm domain without LFU was two orders of magnitude lower than in the bulk domain (i.e., water), as shown in Fig. 8a, c. After 120 min, the antibiotic concentration only reaches around 80 µg/ml at the base of the biofilm, substantially lower than the 200 µg/ml supplied in the liquid domain. In our experiments, we were not able to track the antibiotic concentrations in the biofilm. However, from the computational results, we infer that the concentration was probably not high enough to inactivate the inner biofilm. This explains the higher viability observed in the deeper regions of the low-shear biofilm. This could also clarify the results given in Fig. 5, where higher antibiotic concentrations contributed to lower viability, but the treatment was only effective in the outer portions of the biofilm, as the biofilm served as a diffusion barrier.
Fig. 8. Modeling results for low-shear biofilm.

Simulated distributions of biofilm viability (a, b) and the concentration of antibiotics (c, d) for a low-shear biofilm with different antibiotic diffusion coefficients, representing before (left) and after (right) LFU. Each line corresponds to a 10 min. interval, where the darkest line corresponds to time 0 min, and the lightest line refers to time 120 min. Red dots in the viability plots (a, b) represent experimental data from Fig. 6 at time 120 min.
The model helps explain the effects of LFU when applied in combination with antibiotics, as depicted in Figs. 5, 7. The simulations were able to capture the experimental results with LFU when the diffusivity of tobramycin in the biofilm was increased to be in the same order of magnitude as that in water (Fig. 8b). According to the fitted correlations between experimental and modeling results, while the diffusion coefficient of tobramycin through the biofilm before LFU was 0.007*, after LFU the diffusivity increased 67 times, to a final value of 0.47*. Hence, a plausible explanation is that low-intensity LFU increased the diffusion of the antibiotic through the biofilm by modifying the biofilm’s internal structure (i.e., tearing it). This hypothesis is further supported by the microrheology results shown in Fig. 4. The reduction in mechanical strength following LFU likely led to a ‘decohesion/tearing effect’ of the biofilm. This could be attributed to the formation of pores or holes and connected cracks within the biofilm structure. Consequently, after LFU, the biofilm exhibits diffusive behavior more closely resembling water, leading to a faster diffusion rate of antibiotics and an increased rate of cell inactivation. This can be visualized in Fig. 8d, where the antibiotic reaches a steady state condition inside the biofilm only 20 min. after its application.
Modeling was also carried out for the high-shear biofilm. In this case, a different biofilm diffusion coefficient , and inactivation constant Ka were used (see Supplementary Information). The diffusion coefficient used for simulations of the high-shear biofilm without the application of LFU was the same as the one used for the low-shear biofilm. This was because the calibration of the diffusion coefficient for tobramycin in the high-shear biofilm without the application of LFU was not possible due to the lack of viability changes, demonstrated by the very small inactivation constant . This is consistent with the experimental data displayed in Fig. 7a. Therefore, we only present the distributions of simulated antibiotic concentrations with LFU (Supplementary Fig. 4, left).
To assess the effects of LFU on the high-shear biofilm, simulations were fitted to experimental data corresponding to the medium-intensity LFU (Supplementary Fig. 5), given that the low-intensity results did not show measurable changes in biofilm viability (Fig. 7b). The newly calibrated diffusion coefficient for the high-shear biofilm was 0.1, which is 14 times higher than the used for simulations before LFU. In this case (Supplementary Fig. 5a), the viability lines were almost horizontal, but similar antibiotic concentrations used in the low-shear biofilms did not exhibit the same inactivation efficiency: 70% of the cells remained viable, as opposed to 25% for the simulations of the low-shear biofilm. This is likely due to the order-of-magnitude-lower Ka values for high-shear biofilms after LFU—compared to those of low-shear biofilms—suggesting that high-shear biofilms required greater contact time or higher antibiotic concentrations to inactivate the biofilm cells.
Literature suggests that ultrasound increases the permeability of the EPS matrix by creating pores within the matrix, facilitating an easier diffusion of the antibiotics3,8,38. For example, Ronan et al.39 performed LFU in combination with microbubbles and observed craters that developed in the EPS matrix. Our modeling results suggest that the experimental results could be explained by an increase in diffusion coefficient comparable to water. These findings, coupled with the changes in biofilm mechanical properties induced by LFU, indicate that LFU may contribute to a ‘decohesion’ or ‘tearing’ effect by generating pores or holes and breaking the internal biofilm structure. Therefore, LFU might be triggering a percolation effect within the biofilm, facilitating the penetration of antibiotics into the newly formed spaces inside the biofilm and leading to enhanced biofilm inactivation. Future research should investigate changes in antibiotic diffusivity within biofilms under the influence of LFU and study how these dynamics vary with alterations in biofilm characteristics.
The calculated inactivation constants Ka also changes with LFU. In both the low- and high-shear biofilms, the constant is higher upon LFU treatment (see Supplementary Table 1), suggesting that other phenomena could be implicated in the enhanced cell inactivation when antibiotics and LFU are combined. This could include enhanced metabolic activity after the application of LFU. Further research is needed, especially for longer sonication times in the presence of antibiotics, to explore this possible explanation.
In this study, biofilms were grown at varying shear conditions, and their physical characteristics were analyzed, along with changes in their mechanical properties and antibiotic susceptibility, when briefly sonicated. Combining antibiotics with low-intensity LFU showed faster inactivation and extended efficiency to the inner biofilm grown at low shear, while high-shear biofilms needed higher intensities to exhibit an enhanced antibiotic susceptibility. Microrheology measurements indicated a correlation between changes in biofilm inactivation profiles following the application of LFU and changes in mechanical properties, suggesting an intrinsic association. Additionally, EPS composition and microrheology measurements indicated a greater cohesion for the high-shear biofilm. This could possibly lead to a greater diffusion barrier, hindering antibiotic penetration. It also could provide a physical barrier, impeding the propagation of ultrasound waves and potentially leading to acoustic field attenuation throughout the biofilm. These results, combined with the biofilm modeling, suggest that LFU may increase biofilm diffusivity by increasing pore sizes or inducing holes and fissures in the matrix, inducing a ‘decohesion effect and tearing’ in the biofilm structure.
While the precise mechanisms underlying the observed synergistic effect between antibiotics and LFU remain unclear, results suggest a close association between the intrinsic biofilm mechanical properties, EPS composition, and the influence of LFU on antibiotic susceptibility, as the effect of identical LFU treatments varies for low- and high-shear biofilms.
Further research should explore the effects of LFU on biofilm mechanical properties and diffusivity in more detail, as well as the increased sonication time and antibiotic inactivation constants. Finally, future research should also explore LFU impacts on the inactivation efficiency of other antibiotics. For instance, in cases where antibiotics significantly adsorb to the biofilm’s EPS matrix, increasing biofilm diffusivity via LFU may not result in the same degree of enhancement.
Methods
Three identical groups of P. aeruginosa PAO1 biofilms were cultivated in flow cells under low and high fluid shear for the same duration and nutrient conditions. The first group of biofilms was assessed with “Live/Dead” cell viability staining (see below) and exposed to either different concentrations of the antibiotic tobramycin, LFU at different intensities, or a combination of both. The antibiotic and the stain were added together. LFU was applied immediately afterward for 60 s. Finally, the Live/Dead status over time throughout the biofilm depth was captured using a CLSM. A detailed schematic showing this procedure is provided in Supplementary Fig. 6 (Supplementary Information). For this analysis of biofilm viability, the primary objective was to compare the inactivation efficiencies and trends with and without LFU. Consequently, the results are utilized to estimate trends rather than focus on absolute values.
A second group of biofilms was cultured in the presence of fluorescent microbeads. Optical coherence tomography (OCT) was used to analyze biofilm morphology, thickness, and roughness before and after LFU treatment at different intensities. Microrheology measurements were performed with these biofilms using a CLSM.
The third group of biofilms was harvested and stained with different dyes to quantify the relative abundance of polysaccharides, proteins, and extracellular DNA present in the EPS matrix. The detailed methodologies for each experimental procedure are provided below.
Bacterial strains and biofilm growth
P. aeruginosa PAO1C (ATCC 15692) was used to grow biofilms at low and high shear. For flow cell inoculation, a stock was grown in sterile tubes with Luria‐Bertani (LB) broth at 37 °C on an orbital shaker overnight to an optical density OD600 of 0.6. The culture was further diluted to OD600 = 0.1 in LB broth. Approximately 200 µL was injected into sterile flow cells (Ibidi® Flow cell, tissue-cultured treated, 0.6 mm, Ibidi Inc., Germany). Flow cells were incubated under static conditions for 30 h at room temperature. Thereafter, biofilms were grown under a continuous flow of 10% LB broth for five days. For low-shear experiments, the flow was supplied at 3 ml/h with a peristaltic feed pump (Rainin Dynamax RP-1, Oakland, CA, USA). For high-shear experiments, the influent flow was also maintained at 3 ml/h to keep the same nutrient supply, but a 10 ml reservoir was included and recirculated with a second peristaltic pump at 30 ml/h. The low-shear stress was estimated at 2.7 mPa, while the high-shear was estimated at 27 mPa.
Cell viability stains
Following growth, a LIVE/DEAD® Biofilm Viability Kit (Film Tracer™, Invitrogen, USA) was added to the flow cell, per manufacturer instructions. Briefly, SYTO 9 was used to analyze viable cells, while propidium iodide (PI) was used to count dead cells. About 200 μL of staining solution was injected into the flow cells using a syringe pump (pump 341B, Sage Instruments, Watsonville, CA) at the same flow rate as the one used for growth. Samples were then incubated for 20 min. at room temperature while protected from light.
Ultrasound
An ultrasound probe (Qsonica125 with 1/8” tip, 20 kHz, Qsonica, USA) was programmed according to the desired intensity: 25% (approximately 0.63 W/cm2), 50% (1.25 W/cm2) or 75% (1.88 W/cm2). In this paper, these intensities are referred to as “low,” “medium,” and “high,” respectively. However, all the intensities would be considered as “low” concerning those used for biofilm disruption4. The sonication time was 60 s in all cases. The flow cell was placed in the center of a 100 mm × 50 mm rectangular plastic container and fixed in place with modeling clay (Fig. 9). The container was filled with 130 ml of deionized water to a height of 30 mm. The temperature of the medium was not controlled during the experiment, but a known volume of ice was added to prevent temperatures from rising. The tip of the ultrasound probe was submerged and positioned within an approximate distance of 5 mm of the flow cell in the center of a square previously labeled in the flow cell. A schematic of this setup is shown in Fig. 9.
Fig. 9. Schematic of biofilm sonication setup.
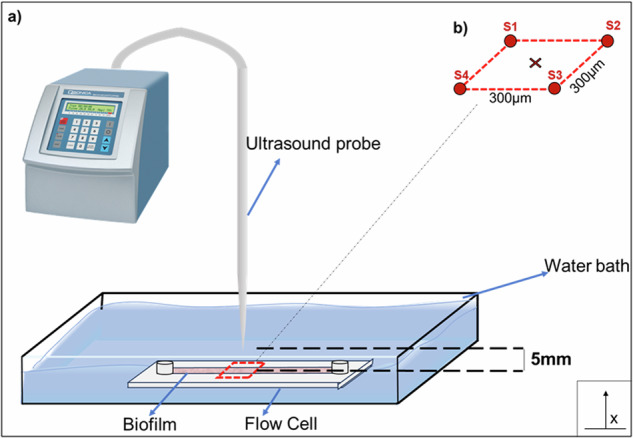
a The probe was positioned at the center of the flow cell, maintaining a 5 mm gap without contact. The surrounding bath consisted of deionized water. The red-highlighted region represents the area closest to the ultrasound waves and was the focus of the microscope. b Distance between spots (S1, S2, S3, S4) analyzed in the microscope. The ‘x’ marker represents the centered position of the LFU probe.
CLSM image collection
Previously stained biofilms were imaged with an inverted CLSM (Nikon A1R-MP, Tokyo, Japan) using a 40× oil immersion objective. Samples individually stained with PI or SYTO 9 (see Cell viability stains) were first analyzed separately to ensure clear signals without overlap. Four arbitrary locations (each square of 320 × 320 µm) within the target area (see Fig. 9b) were chosen, and z-stacks with a step size of 0.5 µm were taken for each location to obtain a 3D visualization of biofilm viability, starting at the base of the biofilm (distance from the attachment surface = 0 µm) and finishing at the biofilm interface with the liquid media. Z-stacks of the same locations were taken every 10 min. to characterize the temporal distribution of cell viability. Overall, spatiotemporal distributions of biofilm cell viability were obtained over 120 min. Hereafter, “inner” biofilm refers to the portion of the biofilm located in the first 5 µm from the base, while “outer” biofilm refers to the top 5 µm.
CLSM image analysis
Z-stacks were analyzed using FIJI (ImageJ, US National Institutes of Health, Bethesda, Maryland, USA)40 with a protocol adapted from Mountcastle et al.41. Briefly, background and noise removal were first performed to clean the images. Segmentation was performed by applying a threshold based on the histogram of both channels42. The number of pixels (px) of the green and the red channels was then determined, and the percentages of viable and dead bacteria were calculated as follows:
| 1 |
SYTO9 stains all cells emitting green fluorescence, regardless of their viability. PI (red fluorescence) only penetrates damaged cell membranes, resulting in a decrease in green fluorescence for these cells. Moreover, live and dead cells can be in close proximity. For these reasons, red and green pixels can be superimposed on each other41, and therefore Eq. 1 subtracts the intersection between the two channels.
| 2 |
| 3 |
Biofilm imaging with optical coherence tomography
OCT (Ganymede II Spectral Domain OCT System, THORLABS, Inc., Lübeck, Germany), an in-situ and non-destructive imaging technique, was used to obtain 2-D biofilm profiles. The profiles were then used to determine biofilm thickness before and after LFU treatment, as well as relative roughness and biofilm detachment. The OCT equipment had a center white light beam wavelength of 930 nm and a Thorlabs LSM03 objective scan lens, providing 4.1 µm axial resolution and 4.5 mm imaging depth in water. The image collection software used was ThorImage OCT Version 4.3, (THORLABS Inc.). The OCT software was used with the following settings: 1.33 refractive index, 30 kHz image frequency, and 101 dB sensitivity.
Thickness values were calculated by measuring 10–12 points in at least 5 different sections in each flow cell—three different replicates for each condition. The average thickness was then determined. Then, the relative roughness coefficient was calculated43–45 from:
| 4 |
where is the relative roughness coefficient, N is the number of measurements, is the biofilm thickness at point i, and is the average biofilm thickness. The standard deviation was calculated from the averages of the roughness values.
Creep compliance
Biofilm creep compliance was determined with a microbead microrheology technique46, providing a spatial distribution of creep compliance within the biofilm. In this technique, microspheres are added to a biofilm while growing. The spheres are entrapped within the structure of the biofilm, and their Brownian motion is tracked by video microscopy. Several spheres are tracked simultaneously over time in the same section and MSD is calculated afterward by analyzing trajectories.
Biofilms were grown as described in Bacterial strains and biofilm growth, except a solution of 100 µl/L polystyrene no surface-labeled (inert) fluorescent particles (microspheres) of 1 µm diameter (Fluoresbrite 18660, Polysciences) were added to the media (10% LB) at the beginning of the experiment. The media contained approximately 4.55 × 10¹⁰ particles/ml. Videos of particle motion were recorded with a Nikon A1R-MP CLSM (Nikon, Tokyo, Japan) using a 40× oil immersion objective and an optical zoom of 2×. Videos were taken for 30 s with a 16-fps frame rate. At least ten videos were recorded for each section of biofilm, and each video captured a minimum of 4 particles. The experiments were repeated three times for each condition. The recordings were then analyzed using TrackMate47 implemented in FIJI. The Laplacian of Gaussian (LoG) Detector was used to identify the particles. An estimated object diameter of 1 µm with a quality threshold of 50 was selected. The initial thresholding was set to zero. The Simple Linear Assignment Problem (LAP) tracker in TrackMate was used to follow trajectories. The linking maximum distance was set at 1 µm while the gap-closing maximum distance and frame gap were set at 3 µm and 1 µm, respectively. Particle trajectories with less than 60 spots and outliers on the track displacement filter were ignored. The tracks were then exported as XML and imported into MATLAB (MATLAB R2022a, Mathworks, Inc.). The MSD of all curves, mean MSD and statistical parameters were obtained using the plugin ‘msdanalyzer’48. The curves were fitted to a power law using the ‘ezyfit’ function. Finally, creep compliance was calculated using the following formula:
| 5 |
where J = creep compliance (Pa−1), d = particle diameter (m), kB = Boltzman constant (J*K−1), T = temperature (K), and t = time (s).
Quantifying EPS constituents
The relative abundance of EPS constituents—polysaccharides, proteins, and eDNA—was determined by using component-specific fluorescent stains and measuring the relative area of each fluorescent signal along the length of each z-stack. To analyze the EPS composition, biofilms were grown in Ibidi flow cells with a removable base. At the end of the experiment, flow cells were opened, and samples were collected in microscope slides. The staining procedure and conditions are included in the Supplementary Information (Supplementary Table 2). An upright Nikon C2 + CLSM (Nikon Instruments, Melville USA), equipped with 40× oil immersion objectives, was used to image the biofilm samples. At least ten randomly selected samples were obtained from each biofilm. Images were further analyzed with FIJI to calculate percentages of polysaccharides, proteins, and eDNA. To simplify the calculations, the EPS detected by fluorescence was considered as total EPS (100%), neglecting any minor EPS components not captured by the utilized stains. Three identical replicates were analyzed for each condition.
Antibiotic susceptibility tests
Tobramycin sulfate (Thermofisher Scientific, USA) was used as antibiotic. It was diluted in deionized water. The antibiotic was added to the Live/Dead staining solution, and biofilms were injected with the desired antibiotic concentration with the same procedure as followed for biofilm staining (see Cell viability stains). Each concentration of antibiotic was assessed at least twice for each biofilm condition.
Mathematical model
A 1D biofilm diffusion model with antibiotic inactivation was adapted from ref. 49 and implemented in COMSOL Multiphysics (COMSOL v.6.0; COMSOL Inc., Burlington, MA). Only antibiotic diffusion in the liquid and biofilm phases and cell inactivation were included in the model. LFU was not explicitly modeled.
To mimic the experiments, a biofilm domain and liquid domain were modeled. The biofilm domain was 50 µm thick, while the water domain was 550 µm thick. The liquid domain initially contained a uniform concentration of tobramycin, while the biofilm domain had an initial tobramycin concentration equal to zero. To simplify the model, biofilm growth and oxygen consumption were neglected. The diffusion coefficient for tobramycin in water was taken from Sankaran et al.50, = 15.3 µm/s2. The diffusion coefficient of tobramycin through the biofilm was calibrated with experimental results (see Supplementary Information). The diffusion of antibiotic, with concentration , results from the time-dependent mass balance, neglecting potential reaction and consumption of antibiotic within the biofilm:
| 6 |
where is the diffusion coefficient of the antibiotic and ‘i’ represents either water or biofilm . A no-flux boundary condition was imposed at the biofilm base and water surface for the antibiotic ( at x = 0 and x = 600 µm). The initial concentration of antibiotic was set to 200 µg/ml in the bulk domain and 0 µg/ml in the biofilm domain. See Fig. 9 for the coordinate system.
Biomass inactivation was assumed to follow a first-order rate expression with the antibiotic concentration and the biomass concentration49. The resulting mass balance for active biomass in the biofilm is:
| 7 |
where is the concentration of live biomass and Ka is the inactivation constant.
Active and inactivated biomass were modeled as and , with volume fractions . Here ρX is the biomass density and is considered equal for both active and inactivated biomass, 10 kg/m3 51, which was kept constant during the simulations. It was assumed that initially, all biomass in the biofilm was active ( at t = 0). A no-flux condition was imposed at the biofilm base and water ends ( at x = 0 and x = 600 µm), along with a continuity interface between biofilm and water (x = 100 µm).
The antibiotic inactivation constant, Ka, and the diffusion coefficient of tobramycin through the biofilm, , were calibrated using experimental data. The calibration is described in Antibiotic susceptibility of low-shear biofilm without LFU.
Statistical analysis
A spreadsheet (Microsoft Excel) was used for data processing and analysis. Parameter values were expressed as mean ± standard deviation ( ± S). ANOVA was used for one-way data analysis. p < 0.05 was considered a statistically significant difference.
Reporting summary
Further information on research design is available in the Nature Research Reporting Summary linked to this article.
Supplementary information
Acknowledgements
We thank the Notre Dame Integrated Imaging Facility (NDIIF) for providing access to the Nikon A1R CLSM. We appreciate seed grants from the Berthiaume Institute for Precision Health, the Luksic Scholars Fund, and the Naughton Faculty Accelerator grant from the University of Notre Dame. We also acknowledge Dr. Tom Keens and Ms. Carmen Reyes of the Children’s Hospital of Los Angeles (CHLA) for their insightful feedback early in this work.
Author contributions
Y.N.: Conceptualization, methodology, Formal analysis, writing—original draft, review, and editing. N.G: Conceptualization, Methodology, Writing—review and editing. A.C.: Conceptualization, Supervision, Funding acquisition, Writing—original draft, review, and editing. K.M.: Conceptualization, Formal analysis, Supervision, Writing—review and editing. R.N.: Conceptualization, Supervision, Funding acquisition, Project administration, Resources, Writing—original draft, review, and editing. At time of submission, Author R.N. was Associate Editor of npj Biofilms and Microbiomes.
Data availability
The datasets that support the findings of this study are available from the corresponding author on reasonable request.
Competing interests
The authors declare no competing interests.
Footnotes
Publisher’s note Springer Nature remains neutral with regard to jurisdictional claims in published maps and institutional affiliations.
Supplementary information
The online version contains supplementary material available at 10.1038/s41522-024-00544-2.
References
- 1.Flemming, H. C., Neu, T. R. & Wingender, J. The PerfecT Slime. (IWA, 2017).
- 2.Cao, B. et al. Diffusion retardation by binding of tobramycin in an alginate biofilm model. PLoS ONE11, 1–11 (2016). [DOI] [PMC free article] [PubMed] [Google Scholar]
- 3.Cai, Y., Wang, J., Liu, X., Wang, R. & Xia, L. A review of the combination therapy of low frequency ultrasound with antibiotics. BioMed. Res. Int.2017, 11–13 (2017). 10.1155/2017/2317846 [DOI] [PMC free article] [PubMed] [Google Scholar]
- 4.Erriu, M. et al. Microbial biofilm modulation by ultrasound: Current concepts and controversies. Ultrason. Sonochem.21, 15–22 (2014). 10.1016/j.ultsonch.2013.05.011 [DOI] [PubMed] [Google Scholar]
- 5.Vyas, N. et al. Which Parameters Affect Biofilm Removal with Acoustic Cavitation? A Review. Ultrasound Med. Biol.45, 1044–1055 (2019). 10.1016/j.ultrasmedbio.2019.01.002 [DOI] [PubMed] [Google Scholar]
- 6.Fleming, D. & Rumbaugh, K. P. Approaches to Dispersing Medical Biofilms. Microorganisms5, 15 (2017). 10.3390/microorganisms5020015 [DOI] [PMC free article] [PubMed] [Google Scholar]
- 7.Zhang, Y. et al. Understanding the effects of aerodynamic and hydrodynamic shear forces on Pseudomonas aeruginosa biofilm growth. Biotechnol. Bioeng.119, 1483–1497 (2022). 10.1002/bit.28077 [DOI] [PMC free article] [PubMed] [Google Scholar]
- 8.Carmen, J. C. et al. Ultrasonic-enhanced gentamicin transport through colony biofilms of Pseudomonas aeruginosa and Escherichia coli. J. Infect. Chemother.10, 193–199 (2004). 10.1007/s10156-004-0319-1 [DOI] [PMC free article] [PubMed] [Google Scholar]
- 9.Carmen, J. C. et al. Treatment of biofilm infections on implants with low-frequency ultrasound and antibiotics. Am. J. Infect. Control33, 78–82 (2005). 10.1016/j.ajic.2004.08.002 [DOI] [PMC free article] [PubMed] [Google Scholar]
- 10.Seth, A. K. et al. Noncontact, low-frequency ultrasound as an effective therapy against Pseudomonas aeruginosa-infected biofilm wounds. Wound Repair Regeneration21, 266–274 (2013). 10.1111/wrr.12000 [DOI] [PubMed] [Google Scholar]
- 11.Qian, Z., Stoodley, P. & Pitt, W. G. Effect of low-intensity ultrasound upon biofilm structure from confocal scanning laser microscopy observation. Biomaterials17, 1975–1980 (1996). 10.1016/0142-9612(96)00022-1 [DOI] [PubMed] [Google Scholar]
- 12.Qian, Z., Sagers, R. D. & Pitt, W. G. The Effect of Ultrasonic Frequency upon Enhanced Killing of P. aeruginosa biofilms.25, 69–76 (1997). [DOI] [PubMed] [Google Scholar]
- 13.Li, S. et al. Ultrasound microbubbles enhance human β-defensin 3 against biofilms. J. Surgical Res.199, 458–469 (2015). 10.1016/j.jss.2015.05.030 [DOI] [PubMed] [Google Scholar]
- 14.Rediske, A. M., Hymas, W. C., Wilkinson, R. & Pitt, W. G. Ultrasonic enhancement of antibiotic action on several species of bacteria. J. Gen. Appl. Microbiol.44, 283–288 (1998). 10.2323/jgam.44.283 [DOI] [PubMed] [Google Scholar]
- 15.Vieira, M. J., Melo, L. F. & Pinheiro, M. M. Biofilm formation: Hydrodynamic effects on internal diffusion and structure. Biofouling7, 67–80 (1993). 10.1080/08927019309386244 [DOI] [Google Scholar]
- 16.Fanesi, A. et al. Shear stress affects the architecture and cohesion of Chlorella vulgaris biofilms. Sci. Rep.11, 4002 (2021). 10.1038/s41598-021-83523-3 [DOI] [PMC free article] [PubMed] [Google Scholar]
- 17.Hart, J. W., Waigh, T. A., Lu, J. R. & Roberts, I. S. Microrheology and Spatial Heterogeneity of Staphylococcus aureus Biofilms Modulated by Hydrodynamic Shear and Biofilm-Degrading Enzymes. Langmuir35, 3553–3561 (2019). 10.1021/acs.langmuir.8b04252 [DOI] [PMC free article] [PubMed] [Google Scholar]
- 18.Santschi, P. H. et al. Can the protein/carbohydrate (P/C) ratio of exopolymeric substances (EPS) be used as a proxy for their ‘stickiness’ and aggregation propensity? Mar. Chem.218, 103734 (2020). 10.1016/j.marchem.2019.103734 [DOI] [Google Scholar]
- 19.Han, F. et al. Dynamic characteristics of microbial community and soluble microbial products in partial nitrification biofilm system developed from marine sediments treating high salinity wastewater. J. Environ. Manag.290, 112586 (2021). 10.1016/j.jenvman.2021.112586 [DOI] [PubMed] [Google Scholar]
- 20.Hou, X., Liu, S. & Zhang, Z. Role of extracellular polymeric substance in determining the high aggregation ability of anammox sludge. Water Res.75, 51–62 (2015). 10.1016/j.watres.2015.02.031 [DOI] [PubMed] [Google Scholar]
- 21.Wang, C. et al. The effect of flow velocity on the distribution and composition of extracellular polymeric substances in biofilms and the detachment mechanism of biofilms. Water Sci. Technol.69, 825–832 (2014). 10.2166/wst.2013.785 [DOI] [PubMed] [Google Scholar]
- 22.Galy, O. et al. Mapping of bacterial biofilm local mechanics by magnetic microparticle actuation. Biophys. J.103, 1400–1408 (2012). 10.1016/j.bpj.2012.07.001 [DOI] [PMC free article] [PubMed] [Google Scholar]
- 23.Pavissich, J. P., Li, M. & Nerenberg, R. Spatial distribution of mechanical properties in Pseudomonas aeruginosa biofilms, and their potential impacts on biofilm deformation. Biotechnol. Bioeng.118, 1564–1575 (2021). 10.1002/bit.27671 [DOI] [PubMed] [Google Scholar]
- 24.Li, M., Nahum, Y., Matouš, K., Stoodley, P. & Nerenberg, R. Effects of biofilm heterogeneity on the apparent mechanical properties obtained by shear rheometry. Biotechnol. Bioeng.120, 553–561 (2023). 10.1002/bit.28276 [DOI] [PubMed] [Google Scholar]
- 25.Guelon, T., Mathias, J.-D. & Stoodley, P. Advances in Biofilm Mechanics. Advances5, 111–139 (2011). [Google Scholar]
- 26.Persat, A. et al. The mechanical world of bacteria. Cell161, 988–997 (2015). 10.1016/j.cell.2015.05.005 [DOI] [PMC free article] [PubMed] [Google Scholar]
- 27.Paul, E., Ochoa, J. C., Pechaud, Y., Liu, Y. & Liné, A. Effect of shear stress and growth conditions on detachment and physical properties of biofilms. Water Res.46, 5499–5508 (2012). 10.1016/j.watres.2012.07.029 [DOI] [PubMed] [Google Scholar]
- 28.Stoodley, P., Cargo, R., Rupp, C. J., Wilson, S. & Klapper, I. Biofilm material properties as related to shear-induced deformation and detachment phenomena. J. Ind. Microbiol. Biotechnol.29, 361–367 (2002). 10.1038/sj.jim.7000282 [DOI] [PubMed] [Google Scholar]
- 29.Allen, A., Habimana, O. & Casey, E. The effects of extrinsic factors on the structural and mechanical properties of Pseudomonas fluorescens biofilms: A combined study of nutrient concentrations and shear conditions. Colloids Surf. B: Biointerfaces165, 127–134 (2018). 10.1016/j.colsurfb.2018.02.035 [DOI] [PubMed] [Google Scholar]
- 30.Beyenal, H. & Lewandowski, Z. Internal and External Mass Transfer in Biofilms Grown at Various Flow Velocities. Biotechnol. Prog.18, 55–61 (2002). 10.1021/bp010129s [DOI] [PubMed] [Google Scholar]
- 31.Neu, H. C. Tobramycin: An Overview. J. Infect. Dis.134, S3–S19 (1976). 10.1093/infdis/134.Supplement_1.S3 [DOI] [PubMed] [Google Scholar]
- 32.Kostenko, V., Salek, M. M., Sattari, P. & Martinuzzi, R. J. Staphylococcus aureus biofilm formation and tolerance to antibiotics in response to oscillatory shear stresses of physiological levels. FEMS Immunol. Med. Microbiol.59, 421–431 (2010). 10.1111/j.1574-695X.2010.00694.x [DOI] [PubMed] [Google Scholar]
- 33.Simões, L. C., Gomes, I. B., Sousa, H., Borges, A. & Simões, M. Biofilm formation under high shear stress increases resilience to chemical and mechanical challenges. Biofouling38, 1–12 (2022). 10.1080/08927014.2021.2006189 [DOI] [PubMed] [Google Scholar]
- 34.Simões, M., Pereira, M. O. & Vieira, M. J. Effect of Different Concentrations of Ortho-phthalaldehyde on Biofilms Formed by Pseudomonas fluorescens Under Different Flow Conditions. Biofouling19, 287–295 (2003). 10.1080/0892701031000153398 [DOI] [PubMed] [Google Scholar]
- 35.Ramasamy, P. & Zhang, X. Effects of shear stress on the secretion of extracellular polymeric substances in biofilms. Water Sci. Technol.52, 217–223 (2005).16180431 10.2166/wst.2005.0204 [DOI] [Google Scholar]
- 36.Ching, C. & Zaman, M. H. Development and selection of low-level multi-drug resistance over an extended range of sub-inhibitory ciprofloxacin concentrations in Escherichia coli. Sci. Rep.10, 8754 (2020). 10.1038/s41598-020-65602-z [DOI] [PMC free article] [PubMed] [Google Scholar]
- 37.Laugier, P. & Haïat, G. Introduction to the Physics of Ultrasound. in Bone Quantitative Ultrasound (eds. Laugier, P. & Haïat, G.) 29–45 (Springer Netherlands, Dordrecht, 2011). 10.1007/978-94-007-0017-8_2.
- 38.Rapoport, N., Smirnov, A. I., Timoshin, A., Pratt, A. M. & Pitt, W. G. Factors affecting the permeability of Pseudomonas aeruginosa cell walls toward lipophilic compounds: Effects of ultrasound and cell age. Arch. Biochem. Biophys.344, 114–124 (1997). 10.1006/abbi.1997.0176 [DOI] [PubMed] [Google Scholar]
- 39.Ronan, E., Edjiu, N., Kroukamp, O., Wolfaardt, G. & Karshafian, R. USMB-induced synergistic enhancement of aminoglycoside antibiotics in biofilms. Ultrasonics69, 182–190 (2016). 10.1016/j.ultras.2016.03.017 [DOI] [PubMed] [Google Scholar]
- 40.Schindelin, J. et al. Fiji: an open-source platform for biological-image analysis. Nat. Methods9, 676–682 (2012). 10.1038/nmeth.2019 [DOI] [PMC free article] [PubMed] [Google Scholar]
- 41.Mountcastle, S. E. et al. Biofilm viability checker: An open-source tool for automated biofilm viability analysis from confocal microscopy images. npj Biofilms Microbiomes7, 1–12 (2021). 10.1038/s41522-021-00214-7 [DOI] [PMC free article] [PubMed] [Google Scholar]
- 42.Luo, T. L. et al. A Sensitive Thresholding Method for Confocal Laser Scanning Microscope Image Stacks of Microbial Biofilms. Sci. Rep.8, 13013 (2018). 10.1038/s41598-018-31012-5 [DOI] [PMC free article] [PubMed] [Google Scholar]
- 43.Derlon, N., Peter-Varbanets, M., Scheidegger, A., Pronk, W. & Morgenroth, E. Predation influences the structure of biofilm developed on ultrafiltration membranes. Water Res.46, 3323–3333 (2012). 10.1016/j.watres.2012.03.031 [DOI] [PubMed] [Google Scholar]
- 44.Li, C., Wagner, M., Lackner, S. & Horn, H. Assessing the influence of biofilm surface roughness on mass transfer by combining optical coherence tomography and two-dimensional modeling. Biotechnol. Bioeng.113, 989–1000 (2016). 10.1002/bit.25868 [DOI] [PubMed] [Google Scholar]
- 45.Murga, R., Stewart, P. S. & Daly, D. Quantitative analysis of biofilm thickness variability. Biotechnol. Bioeng.45, 503–510 (1995). 10.1002/bit.260450607 [DOI] [PubMed] [Google Scholar]
- 46.Chew, S. C., Rice, S. A., Kjelleberg, S. & Yang, L. In situ mapping of the mechanical properties of biofilms by particle-tracking microrheology. J. Visualized Exp.2015, 1–8 (2015). [DOI] [PMC free article] [PubMed] [Google Scholar]
- 47.Tinevez, J.-Y. et al. TrackMate: An open and extensible platform for single-particle tracking. Methods115, 80–90 (2017). 10.1016/j.ymeth.2016.09.016 [DOI] [PubMed] [Google Scholar]
- 48.Tarantino, N. et al. TNF and IL-1 exhibit distinct ubiquitin requirements for inducing NEMO–IKK supramolecular structures. J. Cell Biol.204, 231–245 (2014). 10.1083/jcb.201307172 [DOI] [PMC free article] [PubMed] [Google Scholar]
- 49.Stewart, P. S. Biofilm accumulation model that predicts antibiotic resistance of Pseudomonas aeruginosa biofilms. Antimicrob. Agents Chemother.38, 1052–1058 (1994). 10.1128/AAC.38.5.1052 [DOI] [PMC free article] [PubMed] [Google Scholar]
- 50.Sankaran, J. et al. Single microcolony diffusion analysis in Pseudomonas aeruginosa biofilms. npj Biofilms Microbiomes5, 35 (2019). 10.1038/s41522-019-0107-4 [DOI] [PMC free article] [PubMed] [Google Scholar]
- 51.Rittmann, B. & McCarty, P. L. Environmental Biotechnology: Principles and Applications. (McGraw-Hill Companies,Incorporated, 2001).
Associated Data
This section collects any data citations, data availability statements, or supplementary materials included in this article.
Supplementary Materials
Data Availability Statement
The datasets that support the findings of this study are available from the corresponding author on reasonable request.