

Abstract
Deficiencies in response inhibition are associated with numerous mental health conditions, warranting innovative treatments. Transcranial direct current stimulation (tDCS), a non-invasive brain stimulation technique, modulates cortical excitability and has shown promise in improving response inhibition. However, tDCS effects on response inhibition often yield contradictory findings. Previous research emphasized the importance of inter-individual factors that are mostly ignored in conventional meta-analyses of mean effects. We aimed to fill this gap and promote the complementary use of the coefficient of variation ratio and standardized mean effects. The systematic literature search included single-session and sham-controlled tDCS studies utilizing stop-signal task or Go-NoGo tasks, analyzing 88 effect sizes from 53 studies. Considering the impact of inter-individual factors, we hypothesized that variances increase in the active versus sham tDCS. However, the results showed that variances between both groups did not differ. Additionally, analyzing standardized mean effects supported previous research showing an improvement in the stop-signal task but not in the Go-NoGo task following active tDCS. These findings suggest that inter-individual differences do not increase variances in response inhibition, implying that the heterogeneity cannot be attributed to higher variance in response inhibition during and after active tDCS. Furthermore, methodological considerations are crucial for tDCS efficacy.
Keywords: Response inhibition, Transcranial direct current stimulation, Coefficient of variation ratio, Inter-individual differences
Subject terms: Cognitive neuroscience, Cognitive control
Introduction
The ability to withhold one’s responses is a crucial skill in a wide range of activities such as decision-making, emotional regulation and behavioral control. This form of impulsivity, called response inhibition, is associated with higher risk-taking behavior1 and emotional dysregulation2. Response inhibition is defined as the ability to suppress motor, cognitive and affective functions resulting in undesirable behavior3,4. Both impulsivity and response inhibition are associated with a variety of mental disorders including substance use disorder, attention-deficit/hyperactivity disorder (ADHD), obsessive compulsive disorder (OCD), eating disorders, and psychopathy5–10. Deficiencies in impulsivity and response inhibition are linked to functional brain alterations such as decreased activation in the left prefrontal cortex (PFC) and the right inferior frontal gyrus (rIFG)11,12.
To address PFC related deficits in response inhibition, non-invasive brain stimulation (NIBS) has become increasingly relevant in the past 20 years. Among a variety of NIBS methods, transcranial direct current stimulation (tDCS) emerged as a cost-effective method. TDCS delivers weak electrical currents to cortical regions and neuronal networks, modifying the resting membrane potential of neurons. Theoretically, anodal stimulation increases resting membrane potential, while cathodal stimulation decreases it13. Yet, an increasing amount of research questions this dichotomous view14.
Thus far, research on tDCS effects on response inhibition has produced heterogeneous results. Whereas some studies reported beneficial tDCS effect on response inhibition15,16, others reported no effects at all17,18. Meta-analyses revealed an overall benefit of tDCS on response inhibition, although effect sizes were small19,20. Despite a small effect, inconsistencies between studies may be explained by inter-individual differences. Vergallito et al.21 identified stable and variable factors contributing to inter-individual variability. Among stable factors are genotypes, morphological disparities, and biological sex, which may play a significant role in explaining differences in tDCS responses between individuals. Notably, genes encoding brain-derived neurotrophic factors and Catechol-O-Methyltransferase have been identified to interact with tDCS effects22–24. Additionally, morphological disparities such as skull thickness and composition21,25 may be associated with tDCS efficacy. Age and biological sex, factors related to skull thickness, have also been suggested to modulate tDCS effects21,26,27. Moreover, recent evidence indicates that cortical thickness28 and electric field magnitude29 can influence the outcomes of tDCS interventions. Variable factors such as mental disorder may also influence tDCS effectiveness. Patients with schizophrenia, Alzheimer’s disease, major depressive disorder (MDD), and Parkinson’s disease react differently to tDCS compared to healthy individuals30. MRI research indicated that electric field strength was significantly diminished in patients (Schizophrenia and MDD) compared to healthy controls31. Substance use, for instance nicotine consumption, may also influence tDCS efficacy32,33. This is supported by findings suggesting that nicotine intake can cancel out tDCS effects of long-term plasticity34.
Conventional meta-analyses have predominantly focused on standardized mean effects35, often not addressing inter-individual differences. Homan et al.36 were the first to investigate inter-individual variation in NIBS research and found increased variance in active compared to sham tDCS in patients with schizophrenia. In contrast to previous meta-analyses focusing on mean effect differences of tDCS by calculating Cohens d or Hedges g20,37, this meta-analysis aimed to investigate the heterogeneity—or difference in variance—between active and sham tDCS conditions. Comparing individual response differences necessitates the calculation of a ratio between active and sham variance in response to a specific treatment35. The logarithm of the coefficient of variation ratio (lnCVR) is a metric that can measure whether treatment groups show higher variation compared to placebo groups35. This statistic, employed to compare variability between groups, has been used for other treatment approaches such as dietary restrictions38 and schizophrenia medication39.
The rationale behind this method is that if variance in response inhibition is higher in active compared to sham tDCS, inter-individual differences might influence the effect of tDCS. If individual factors play a role in the effectiveness of tDCS, we expect increased variation in response to active compared to sham tDCS. The primary objective is to use the lnCVR to compare variances between active and sham tDCS and incorporate standard tDCS parameters into the analysis to investigate their individual contribution to variability in tDCS groups.
In addition to assessing variance differences, we examine mean differences in response inhibition performance between active and sham tDCS to replicate previous findings20. Accordingly, we expect to find a positive effect of active tDCS on response inhibition, and moderating effects of tDCS parameters—including target electrode position and task. Measuring variance differences between active and sham tDCS and incorporating tDCS parameters may inform the development of tDCS protocols that effectively modulate response inhibition. In addition, comparing mean differences and adding more recent studies may allow us to replicate findings20 and determine the robustness of previously reported effects.
Results
The MLMA revealed that variance between active and sham tDCS did not differ (CVR = 1, p = 0.975, 95% CI [0.93, 1.07]) (see Table 1). All moderator tests were non-significant, which suggests that the hypothesis of equal CVR across comparisons cannot be rejected. Hence, CVR can be considered homogeneous across all studies or comparisons. The proportion of studies showing a CVR larger than 1 was 50%. Each comparison of CVR can be inspected in the forest plot (Fig. 1). The Q-test of heterogeneity, displayed in supplementary materials Table 6, was non-significant (QE = 96.65, p = 0.225).
Table 1.
Multi-level meta-analyses of variance ratios.
| Null model | CVR | p | AIC | BIC |
|---|---|---|---|---|
| 1 | 0.975 | 42.89 | 52.76 |
| Moderator variable | QM | p | AIC | BIC |
|---|---|---|---|---|
| Task | 0.01 | 0.929 | 45.28 | 57.56 |
| Polarity | 0.30 | 0.586 | 45.13 | 57.40 |
| Target location | 4.77 | 0.445 | 49.65 | 71.31 |
| Return electrode | 1.25 | 0.741 | 48.02 | 65.04 |
| Timing | 1.46 | 0.227 | 43.80 | 56.07 |
| Current density | 0.11 | 0.747 | 45.63 | 57.90 |
| Duration | 3.57 | 0.059 | 41.85 | 54.12 |
| Blinding | 0.44 | 0.933 | 50.94 | 67.95 |
Number of studies = 53, number of effects = 88, CVR = coefficient of variation ratio (lnCVR was exponentiated by e), QM = Moderator test, AIC = Akaikes information criterion, BIC = Bayesian information criterion.
Figure 1.

Forest plot of CVR multi-level meta-analysis.
Sensitivity analyses
To validate the robustness of our findings, we conducted sensitivity analyses by using different ITCCs than 0.58. Using a correlation of 0.3 showed no difference in variance between active and sham tDCS (CVR = 1, p = 0.925, 95% CI [0.93, 1.08]). Moderator tests showed that duration of stimulation emerged as a significant moderator (CVR = 0.99, p = 0.038 95% CI [− 0.97, 1]). All other moderators were not significantly associated with the CVR (see Table 2). Similarly, using a correlation coefficient of 0.8 revealed no difference in variation between active and sham tDCS. In addition, no moderator showed a significant contribution (see Table 3). Cochranes risk of bias assessment identified seven studies with higher risk of bias (see in supplementary materials Table 7). Excluding these studies did not change the overall results (CVR = 0.98, p = 0.677, 95% CI [0.91, 1.06]).
Table 2.
Sensitivity analysis with an intra-trial correlation coefficient of 0.3.
| Null model | CVR | p | AIC | BIC |
|---|---|---|---|---|
| 1 | 0.925 | 50.11 | 59.98 |
| Moderator variable | QM | p | AIC | BIC |
|---|---|---|---|---|
| Task | 0.01 | 0.924 | 52.39 | 64.66 |
| Polarity | 0.43 | 0.510 | 52.06 | 64.33 |
| Target location | 5.10 | 0.404 | 56.47 | 78.13 |
| Return electrode | 1.48 | 0.688 | 54.79 | 71.81 |
| Timing | 1.39 | 0.239 | 51.02 | 63.30 |
| Current density | 0.09 | 0.768 | 52.70 | 64.98 |
| Duration | 4.29 | 0.038 | 48.50 | 60.78 |
| Blinding | 0.55 | 0.909 | 57.95 | 74.96 |
Number of studies = 53, number of effects = 88, CVR = coefficient of variation ratio (lnCVR was exponentiated), QM = Moderator test, AIC = Akikes information criterion, BIC = Bayesian information criterion, intra-trial correlation coefficient = 0.3.
Table 3.
Sensitivity analysis with an intra-trial correlation coefficient of 0.8.
| Null model | CVR | p | AIC | BIC |
|---|---|---|---|---|
| 1 | 0.932 | 28.96 | 33.89 |
| Moderator variable | QM | p | AIC | BIC |
|---|---|---|---|---|
| Task | 0.03 | 0.863 | 35.48 | 47.75 |
| Polarity | 0.14 | 0.708 | 35.65 | 47.93 |
| Target location | 4.26 | 0.513 | 40.20 | 61.86 |
| Return electrode | 0.94 | 0.816 | 38.59 | 55.61 |
| Timing | 1.52 | 0.217 | 33.86 | 46.13 |
| Current density | 0.15 | 0.696 | 35.81 | 48.08 |
| Duration | 2.61 | 0.107 | 32.73 | 45.00 |
| Blinding | 0.30 | 0.960 | 41.12 | 58.13 |
Number of studies = 53, number of effects = 88., CVR = coefficient of variation ratio (lnCVR was exponentiated), QM = Moderator test, AIC = Akikes information criterion, BIC = Bayesian information criterion, intra-trial correlation coefficient = 0.8.
Hedges g
Calculating mean differences with hedges g showed no significant tDCS effect on response inhibition (g = − 0.11, p = 0.091, 95% CI [− 0.24, 0.018]) (see Table 4). Q-test of cross study heterogeneity provided evidence for the presence of increased heterogeneity (QE = 165.76, p < 0.0001). This effect suggests the null hypothesis that all true mean effect sizes (hedges g) are equal across studies or comparisons can be rejected. Hence, we expect that hedges g is heterogeneous across studies or comparisons.
Table 4.
Sensitivity analysis with an intra-trial correlation coefficient of 0.8.
| Null model | Hedges g | p | AIC | BIC |
|---|---|---|---|---|
| − 0.11 | 0.091 | 132.82 | 142.68 |
| Moderator variable | QM | p | AIC | BIC |
|---|---|---|---|---|
| Task | 6.93 | 0.031* | 130.43 | 142.70 |
| Polarity | 2.97 | 0.227 | 134.29 | 146.56 |
| Target location | 3.53 | 0.740 | 138.58 | 160.24 |
| Return electrode | 4.42 | 0.352 | 134.42 | 151.43 |
| Timing | 2.82 | 0.244 | 133.94 | 146.21 |
| Current density | 0.39 | 0.534 | 134.03 | 146.30 |
| Duration | 0.34 | 0.563 | 133.51 | 145.78 |
| Blinding | 1.14 | 0.768 | 136.30 | 153.32 |
Number of studies = 53, number of effects = 88. QM = Moderator test, AIC = Akaikes information criterion, BIC = Bayesian information criterion.
Moderators
Task
Task emerged as a significant moderator of tDCS effects on response inhibition. The standardized mean differences of comparisons between active and sham tDCS utilizing the SST showed a significant departure from zero (g = − 0.22, p = 0.01, 95% CI [− 0.38, − 0.06]). This indicates that the active tDCS condition was associated with a decrease in SSRT, which shows a small but significant improvement in response inhibition. In contrast, the standardized mean differences of comparisons using the GNGT did not show a significant difference from zero (g = 0.01, p = 0.890, 95% CI [− 0.16, 0.19]), indicating that FA did not differ between active and sham tDCS. This suggests that there was no improvement in response inhibition. Difference between tasks can be seen in Fig. 2. However, residual heterogeneity was increased (QE = 155.56, p < 0.0001). Testing the remaining moderators for significance showed no results (see Table 4). Q-tests of heterogeneity were all significant (see supplementary materials Table 8).
Figure 2.
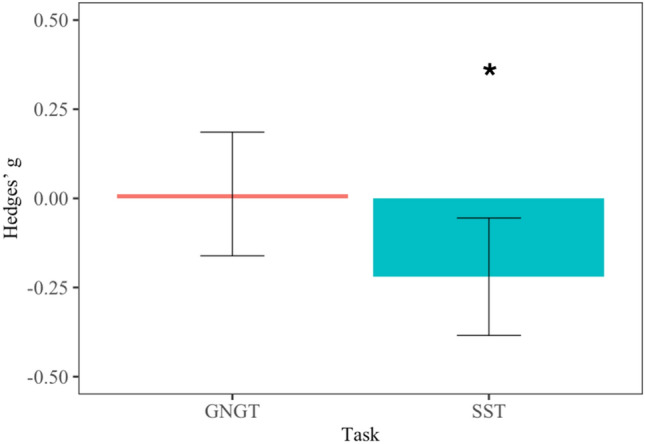
Bar graph displaying effect sizes of transcranial direct current stimulation effects on performance in the Stop Signal Task (SST) and Go/NoGo Task (GNGT). Performance in the GNGT did not significantly differ between active and sham tDCS (no difference from zero; p = 0.890), whereas performance in the SST was significantly improved in active as compared to sham tDCS (significant difference from zero; p = 0.01).
Publication bias
Assessing publication bias revealed no severe bias. Visually inspecting funnel plots (see Fig. 3) and using Gregg’s test (z = − 1.12, p = 0.263) suggest that there is no evidence of funnel plot asymmetry, and thus no small sample bias. In addition, a rank correlation test showed no significance (τ = − 0.07, p = 0.371). Risk assessment for potential bias was conducted with the Cochrane risk assessment tool40. Cochrane risk of bias assessment identified seven studies that pose an overall higher risk of bias (see supplementary Table 7).
Figure 3.
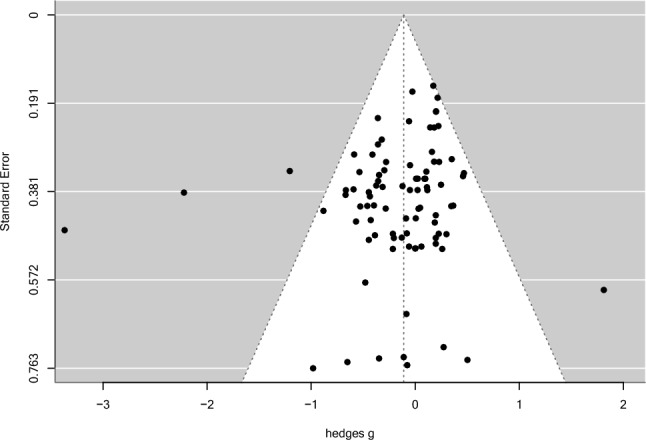
Funnel plot of effect sizes and standard error differences (hedges g).
Discussion
This meta-analysis aimed to compare variances in response inhibition performance between active and sham tDCS. Contrary to our hypothesis, no significant difference in variance between active and sham tDCS was found (CVR = 1). The number of studies showing higher variability in active tDCS (CVR > 1) and higher variability in sham tDCS (CVR < 1) were evenly distributed. None of the moderator variables were significant. Our secondary aim was to validate results from a previous meta-analysis20 focusing on mean effects. In contrast to Schroeder et al.20, no effects of tDCS on response inhibition were observed. However, and in line with20, task significantly moderated tDCS effects on response inhibition. Specifically, performance in the SST was significantly improved by active tDCS but not in the GNGT.
Active and sham tDCS groups did not differ in their variability in response inhibition, indicated by equal variances between active and sham tDCS. Specifically, 50 percent of the comparisons showed higher variances of active over sham tDCS whereas the other 50 percent showed the lower variance in active relative to sham tDCS. This pattern suggests that CVR was evenly distributed around 1, which could be attributable to chance or factors that we did not account for. None of the investigated moderators could explain any trend of this distribution. Therefore, variation in inter-individual responsiveness to tDCS does not appear to explain the heterogeneity in the literature regarding response inhibition.
The equal distribution of studies with a CVR of above and below one, plus the notably wide range of CVR [0.34; 2.5] suggest that studies may be underpowered and effects estimates are inaccurate. Nonetheless, there could be a number of factors other than individual differences that are associated with heterogeneous findings regarding tDCS efficacy. First, increased stimulation duration may be associated with a reversal of anodal or cathodal effects. In our data, stimulation duration was not found to be a significant moderator. It is worth noting, however, that earlier studies have demonstrated that applying anodal tDCS for over 20 min can have reverse effects and result in inhibition41. Similar findings were observed with cathodal tDCS, as a 20-min stimulation elicited excitatory effects42. This effect might contribute to a small amount of heterogeneity43, but it cannot be generalized to the majority of studies where tDCS delivers the intended effects. Circumstances under which stimulation duration can have reversed effects require further clarification.
Second, cathodal tDCS specifically has been shown to account for heterogenous findings in studies using cognitive tasks. Research investigating tDCS effects on motor and cognitive functions revealed that cathodal tDCS was associated with the expected inhibitory effect in studies investigating motor responses but not studies addressing cognitive-behavioral domains such as language, memory, and executive functions14. Furthermore, a meta-analysis showed that cathodal HD-tDCS effects on impulsivity and other cognitive functions were mixed and reported that heterogeneity within studies exceeded heterogeneity between studies44. This might suggest there are factors within studies, such as individual differences and not difference between studies, such as methodology differences that contribute to mixed findings. However, this is not in line with our results. Nonetheless, the effect of cathodal tDCS may be biased in our data, because it may be underrepresented due to the low number of studies using cathodal tDCS (21 comparison) compared to anodal tDCS (67 comparison).
Finally, the majority of included studies in our data recruited healthy individuals, where response inhibition is typically preserved. Individuals with intact response inhibition perform relatively well and may display less heterogeneous responses to tDCS. Patient groups may react differently since mental health conditions are variable and may introduce more variance31,45,46. On the other hand, a meta-analysis revealed that tDCS treatment effect variability in patients did not differ between active and sham tDCS in all patient groups. Only Schizophrenia was associated with a modest increase of variance in active versus sham tDCS36. Our data did not permit a subgroup analysis comparing patients to healthy participants due to the low number of patient samples. Qualitative inspections suggest that CVR may not show a systematic increase in patients.
Standardized mean differences
Overall, there was no mean difference between active and sham tDCS. This finding is in contrast with previous research, which supported a small effect of tDCS on response inhibition20. This may be explained by a factor that cancelled out the effect. For instance, the moderator analysis revealed that tDCS effects on response inhibition are task dependent. For the SST, active tDCS was associated with improved performance compared to sham tDCS, while performance in the GNGT was comparable between active and sham tDCS. In line with previous research20, the effect is small but robust.
FMRI meta-analysis indicate that SST and GNGT are associated with brain activity in the rIFG47 and pre-supplementary motor areas48. Nonetheless, both tasks exhibit differences in signal processing, which may explain the difference in tDCS effects. Whereas the SST involves recruitment of frontal control components prior to stimulus detection, the GNGT might involve motor components at later stages49. Furthermore, differences in neural recruitment may stem from disparities in task demands. Both tasks usually present different types of stimuli, which may require distinct cognitive demands. Indeed, while the SST presents the go stimuli and immediate stop signal during stop trials, the GNGT replaces the go with the no-go stimulus49. Moreover, the SST usually requires participants to respond by indicating a direction, whereas the GNGT often involves letters or pictures. GNGT studies were shown to vary in task complexity, where increased complexity requires higher demands of working memory50 and, thus, additional cognitive resources. Most studies included in this meta-analysis stimulated prefrontal regions, which may be more beneficial for SST performance than for GNGT and could contribute to differences in tDCS effectiveness. Further research is needed to understand the mechanisms behind each task and how tDCS may affect them.
Our prediction that the position of the electrodes would moderate the relationship between tDCS effects and response inhibition was not supported. Unlike a previous meta-analysis20, target and reference electrodes were not identified as significant moderators. This lack of effect may be explained by the problem that clustering and simplifying variables could result in loss of information. Yet, using the precise location of target and reference electrodes would increase the number of levels within a variable, which may result in a power problem. The parameter space is, yet, too large to include each individual location. Decisions on using the optimal location for modulating response inhibition may also be informed by different neural mechanisms underlying SST and GNGT performance.
Limitations
The findings of this meta-analysis must be considered under the following limitations. First, the majority of included studies suffers from small sample sizes, which reduces the precision of their respective effect sizes51. Second, bias assessment found low overall risk for two studies (~ 4%) and only 5 studies (~ 9%) were preregistered. Hence, transparency in the reporting of the reviewed tDCS literature was compromised, and, in combination with small sample sizes, particularly at risk for overestimated effect sizes51. We note that although a test for small study effects (publication bias) was not significant, this test itself is limited by the number of included studies (here 53) and hence a non-significant result does not exclude an overestimation in effect sizes52. Third, we imputed a correlation coefficient for intra-trial correlations. To calculate such a coefficient, we relied on paired sample t-tests, which were not conducted in all studies. We used a subset of six studies that provided a paired t-test, and averaged those correlations, which may be a source of inaccuracy in the calculation of this coefficient. Nonetheless, our ITCC of 0.58 was similar to coefficients from previous research (0.59) investigating variance in tDCS responses36. Fourth, we used single session tDCS studies, which do not include repeated measurements. Longitudinal designs with multiple sessions may be more beneficial as they can capture effects over time which should increase the robustness of the observed effects. Finally, tDCS parameters were heterogeneous. For instance, only three studies used HD-tDCS, which is not sufficient to draw reliable conclusions. This meta-analysis was not pre-registered.
Implications and future directions
Our discussion highlights the importance of studying sources of heterogeneity regarding inter-individual. Factors that increase heterogeneity and potentially contribute to mixed findings need to be identified. Furthermore, research should allow for larger samples and, importantly, include more patient groups. Additionally, information on multiple sessions may become increasingly more available and meta-analysis focusing on multi-session tDCS may account for how tDCS effects last in the long run. Finally, methodology should be considered as the priority. Multicenter studies with clinical populations may encompass various tDCS montages for comparative analysis to determine important factors for successful tDCS administration. The easy and affordable use in clinical and forensic settings make tDCS a promising tool as an add-on-therapy to modulate response inhibition. A recently formed consortium may help promoting standardization and allow future mega-analyses on more harmonized data sets53. Lastly, to provide sufficient transparency and mitigate risks for biases, studies should be preregistered, and ideally peer-reviewed before data collection as so-called Registered Reports that provide an acceptance in principle independent of statistical outcomes53,54.
Conclusion
We conclude that there is no difference in variances between active and sham tDCS conditions. This absence of a difference suggests that, for response inhibition, inter-individual variability may not account for heterogeneity of results in the literature. Uncertainty persists regarding factors, both between and within studies, that may contribute to heterogeneity in tDCS outcomes. Mean tDCS effects on response inhibition did not differ between active and sham conditions. Task emerged as a significant moderator, revealing that studies using the SST showed significantly improved response inhibition in the active tDCS condition. Studies using the GNGT, on the other hand, showed no differences between active and sham tDCS. Therefore, tDCS seems effective in improving response inhibition measured with the SST.
Methods
Eligibility criteria
This meta-analysis included single session tDCS studies that used the stop-signal task (SST) and/or the Go-NoGo task (GNGT). Studies that used parallel or crossover designs qualified for inclusion. Thus, eligible studies were single or double-blind and sham-controlled. Studies with only an active control condition were excluded. We included studies using healthy individuals and/or neurological and psychiatric patients.
Search strategy
Methodological steps adhered to the Preferred Reporting Items for Systematic reviews (PRISMA)55. The literature search in PubMed and Web of Science was conducted ended on the 21.04.2023. Review and meta-analyses were examined for further studies but discarded for the meta-analysis. Three articles56–58 were found in another meta-analysis20. Search terms used in PubMed and Web of Science databases are displayed in Table 5.
Table 5.
Terms for the PRISMA literature search.
| Search step | PubMed (abstract/title) | Web of science (abstract) |
|---|---|---|
| 1 | “transcranial direct current stimulation” OR “trans-cranial direct current stimulation” OR “tDCS” OR “brain stimulation” | “transcranial direct current stimulation” OR “trans-cranial direct current stimulation” OR “tDCS” OR “brain stimulation” |
| AND | AND | |
| 2 | “response inhibition” OR “action inhibition” OR inhibitory control” OR “inhibitory response control” OR “inhibitory action control” OR “impulse control” OR “self-control” OR “motor inhibition” OR “inhibitory motor control” OR “impuls*” | “response inhibition” OR “action inhibition” OR inhibitory control” OR “inhibitory response control” OR “inhibitory action control” OR “impulse control” OR “self-control” OR “motor inhibition” OR “inhibitory motor control” OR “impuls*” |
| OR | OR | |
| 3 | “stop-signal-task" OR “SST” OR “stop-task” OR “stop signal reaction time” OR “SSRT” | “stop-signal-task" OR “SST” OR “stop-task” OR “stop signal reaction time” OR “SSRT” |
| OR | OR | |
| 4 | “go-nogo” OR “go-/nogo” OR “go/no-go” OR “go-no-go" OR “GNG” OR “GNGT” | “go-nogo” OR “go-/nogo” OR “go/no-go” OR “go-no-go" OR “GNG” OR “GNGT” |
| 5 |
Apply inclusion criteria (applied in the following order): a. Original research article (i.e. no review, metal-analysis) b. English language c. Human subjects d. Stop Signal and/or Go No-Go task e. tDCS study |
|
Study selection
Studies were selected based on the eligibility criteria described above. After the exclusion of duplicates, all non-eligible articles were discarded via title and abstract screening—and subsequently full text screening (Fig. 4). Two raters—LL and CG—conducted the literature screening independently from each other. Inter-rater reliability was κ = 0.848. Rater DM screened the remaining articles that did not meet initial agreement. An overview of all included studies can be found in the supplementary material (Supplementary Table 9).
Figure 4.

PRISMA flowchart of the literature search.
TDCS parameters
The extraction of tDCS parameters was based on previous research. We selected polarity consisting of anodal and cathodal stimulation14, as well as target and return electrode position, study design, timing, current density, intensity, stimulation duration, blinding, and task20.
Outcome variables
The SST and GNGT were selected as the primary behavioral measure for assessing response inhibition. The studies of interest included stop-signal reaction time (SSRT) and false alarms (FA) for the SST and GNGT, respectively. SSRT is a measure that is usually reported in milliseconds as it was used in this analysis. FA are commonly reported as the number or percentage of false alarms.
Data extraction
Summary data of both behavioral measures have been used to extract mean (M), standard deviation (SD) and sample size (N) for active and sham tDCS conditions. If data were not found, we searched through other meta-analyses. One meta-analysis20 provides a comprehensive data summary for response inhibition. If summary data were only available in the form of figures, we used the Webplotdigitizer59 to extract M and SD. Standard errors (SEs) and 95% confidence intervals were transformed into SDs (see supplementary Formulas 1 and 2). Summary statistics limited to pre-post differences had to be excluded due to their incompatibility with lnCVR. The final dataset included 53 studies and 88 comparisons. The final data set and the R-script are available in the supplementary materials.
Data pre-processing
Some studies provided more than one comparison, comparing multiple active conditions to one sham group. To account for the multiple use of one sham group we divided N of the sham group by the number of trial arms36,60. Subsequently, to calculate the variance ratio for crossover studies, we used an intra-trial correlation coefficient (ITCC, see supplementary Formula 3). This ITCC considers intra-trial correlation to account for the relationship between active and sham sessions underwent by each participant61. Several studies did not report the necessary SD of mean difference of paired t-tests between active and sham groups, which is crucial for calculating the ITCC (see supplementary materials Formula 4). The ITCC was calculated based on 8 comparisons deemed suitable for this imputation. The average coefficient was 0.58, which was used to account for the relationship between active and sham tDCS.
Effect sizes for variances
The calculation of effect sizes was based on previous research using the lnCVR35,38,62. The central idea of lnCVR is to divide the SD of the active group by the SD of the sham group to gain information on which variance is larger. One of its major advantages is that it accounts for mean–variance relationships35,62. Senior et al.62 propose different effect size calculations for independent—or parallel—designs, and dependent—or crossover—designs. The formulas for the effect size and sampling distribution in this meta-analysis were validated by previous research62. All formulas are presented in the supplementary materials (Formulas 5, 6, 7 and 8 respectively).
Multilevel meta-analysis for lnCVR
We conducted a multi-level meta-analysis (MLMA) with the metafor package63 implemented in R Version 2023.12 that can account for dependent effect sizes coming from the same study. The effect sizes and sampling distribution based on the lnCVR were entered in a MLMA. The restricted maximum likelihood method was used for model fitting. This mixed-effects model included three random factors: study ID, study design, and publication year. As fixed factors the following moderators were included: tDCS polarity (anodal vs cathodal), timing (online vs offline), task (SST vs GNGT), current density, return electrode location and stimulation location. Moderators were individually added to the MLMA, meaning one model was calculated for each moderator. Significant contribution of each moderator was evaluated on the basis of their p-values20,44. Q-tests of heterogeneity were inspected.
Multilevel meta-analysis of standardized mean differences
Another MLMA was conducted to investigate standardized mean effects of tDCS on response inhibition and followed the same steps as the previous MLMA. The dependent variable was hedges g, which measured differences in mean task performance between active and sham tDCS. Heterogeneity of mean effect was assessed with Cochranes Q-test. Data and code are available in the supplementary materials.
Supplementary Information
Author contributions
LL, CW and UH conceptualised the study. UH acquired the funding. LL, CG and DM conducted the systematic review and collected data, LL, CW, DMM, CG data processing and analysis. LL, CG, DM, RG, CW, contributed to the interpretation of results. LL wrote the original draft of the manuscript and made revision on subsequent drafts, addressing critical review comments made by CW, CG, DM, UH, DMM, RG. All authors disclosed they had full access to data and accept responsibilities for publication.
Funding
Open Access funding enabled and organized by Projekt DEAL. This work was funded by the Deutsche Forschungsgemeinschaft (DFG, German Research Foundation) [269953372/GRK2150] and the START-Program of the Faculty of Medicine of the RWTH Aachen University [06/22].
Data availability
Data and the analysis script are provided within the supplementary materials.
Competing interests
The authors declare no competing interests.
Footnotes
Publisher's note
Springer Nature remains neutral with regard to jurisdictional claims in published maps and institutional affiliations.
Supplementary Information
The online version contains supplementary material available at 10.1038/s41598-024-70065-7.
References
- 1.Xu, P., Wu, D., Chen, Y., Wang, Z. & Xiao, W. The effect of response inhibition training on risky decision-making task performance. Front. Psychol.11, 1806 (2020). 10.3389/fpsyg.2020.01806 [DOI] [PMC free article] [PubMed] [Google Scholar]
- 2.Liu, W., Peeters, N., Fernández, G. & Kohn, N. Common neural and transcriptional correlates of inhibitory control underlie emotion regulation and memory control. Soc. Cogn. Affect. Neurosci.15, 523–536 (2020). 10.1093/scan/nsaa073 [DOI] [PMC free article] [PubMed] [Google Scholar]
- 3.Dillon, D. G. & Pizzagalli, D. A. Inhibition of action, thought, and emotion: A selective neurobiological review. Appl. Prev. Psychol.12, 99–114 (2007). 10.1016/j.appsy.2007.09.004 [DOI] [PMC free article] [PubMed] [Google Scholar]
- 4.Verbruggen, F. et al. A consensus guide to capturing the ability to inhibit actions and impulsive behaviors in the stop-signal task. eLife8, e46323 (2019). 10.7554/eLife.46323 [DOI] [PMC free article] [PubMed] [Google Scholar]
- 5.Abramovitch, A. & Cooperman, A. The cognitive neuropsychology of obsessive-compulsive disorder: A critical review. J. Obsessive-Compuls. Relat. Disord.5, 24–36 (2015). 10.1016/j.jocrd.2015.01.002 [DOI] [Google Scholar]
- 6.Gillespie, S. M., Lee, J., Williams, R. & Jones, A. Psychopathy and response inhibition: A meta-analysis of go/no-go and stop signal task performance. Neurosci. Biobehav. Rev.142, 104868 (2022). 10.1016/j.neubiorev.2022.104868 [DOI] [PubMed] [Google Scholar]
- 7.Moeller, F. G., Barratt, E. S., Dougherty, D. M., Schmitz, J. M. & Swann, A. C. Psychiatric aspects of impulsivity. Am. J. Psychiatry158, 1783–1793 (2001). 10.1176/appi.ajp.158.11.1783 [DOI] [PubMed] [Google Scholar]
- 8.Senkowski, D. et al. Assessing inhibitory control deficits in adult ADHD: A systematic review and meta-analysis of the stop-signal task. medRxiv10.1101/2022.07.09.22277429 (2022). 10.1101/2022.07.09.22277429 [DOI] [PMC free article] [PubMed] [Google Scholar]
- 9.Smith, J. L., Mattick, R. P., Jamadar, S. D. & Iredale, J. M. Deficits in behavioural inhibition in substance abuse and addiction: A meta-analysis. Drug Alcohol Depend.145, 1–33 (2014). 10.1016/j.drugalcdep.2014.08.009 [DOI] [PubMed] [Google Scholar]
- 10.Wu, M., Hartmann, M., Skunde, M., Herzog, W. & Friederich, H. C. Inhibitory control in bulimic-type eating disorders: A systematic review and meta-analysis. PLoS ONE8, e83412 (2013). 10.1371/journal.pone.0083412 [DOI] [PMC free article] [PubMed] [Google Scholar]
- 11.Gavazzi, G. et al. Subregional prefrontal cortex recruitment as a function of inhibitory demand: An fMRI metanalysis. Neurosci. Biobehav. Rev.10.1016/j.neubiorev.2023.105285 (2023). 10.1016/j.neubiorev.2023.105285 [DOI] [PubMed] [Google Scholar]
- 12.Hajek, T., Alda, M., Hajek, E. & Ivanoff, J. Functional neuroanatomy of response inhibition in bipolar disorders—Combined voxel based and cognitive performance meta-analysis. J. Psychiatr. Res.47, 1955–1966 (2013). 10.1016/j.jpsychires.2013.08.015 [DOI] [PubMed] [Google Scholar]
- 13.Nitsche, M. A. et al. Transcranial direct current stimulation: State of the art 2008. Brain Stimul.1, 206–223 (2008). 10.1016/j.brs.2008.06.004 [DOI] [PubMed] [Google Scholar]
- 14.Jacobson, L., Koslowsky, M. & Lavidor, M. tDCS polarity effects in motor and cognitive domains: A meta-analytical review. Exp. Brain Res.216, 1–10 (2012). 10.1007/s00221-011-2891-9 [DOI] [PubMed] [Google Scholar]
- 15.Friehs, M., Frings, C. & Hartwigsen, G. Effects of single-session transcranial direct current stimulation on reactive response inhibition. Neurosci. Biobehav. Rev.128, 749–765 (2021). 10.1016/j.neubiorev.2021.07.013 [DOI] [PubMed] [Google Scholar]
- 16.Rezvanian, S., Saraei, M., Mohajeri, H. & Hassani-Abharian, P. The effect of different transcranial direct current stimulation (tDCS) protocols on drug craving and cognitive functions in methamphetamine addicts. BASIC Clin. Neurosci.13, 349–356 (2022). 10.32598/bcn.2021.1929.1 [DOI] [PMC free article] [PubMed] [Google Scholar]
- 17.Dambacher, F. et al. No effects of bilateral tDCS over inferior frontal gyrus on response inhibition and aggression. PLoS ONE10, e0132170 (2015). 10.1371/journal.pone.0132170 [DOI] [PMC free article] [PubMed] [Google Scholar]
- 18.Schroeder, P. A., Seewald, A. & Svaldi, J. Spotlight on the left frontal cortex: No evidence for response inhibition from cathodal high-definition transcranial direct current stimulation over left inferior frontal gyrus or left dorsolateral prefrontal cortex. J. Cogn. Neurosci.34, 1090–1102 (2022). 10.1162/jocn_a_01849 [DOI] [PubMed] [Google Scholar]
- 19.Narmashiri, A. & Akbari, F. The effects of transcranial direct current stimulation (tDCS) on the cognitive functions: A systematic review and meta-analysis. Neuropsychol. Rev.10.1007/s11065-023-09627-x (2023). 10.1007/s11065-023-09627-x [DOI] [PubMed] [Google Scholar]
- 20.Schroeder, P., Schwippel, T., Wolz, I. & Svaldi, J. Meta-analysis of the effects of transcranial direct current stimulation on inhibitory control. Brain Stimul.13, 1159–1167 (2020). 10.1016/j.brs.2020.05.006 [DOI] [PubMed] [Google Scholar]
- 21.Vergallito, A., Feroldi, S., Pisoni, A. & Romero Lauro, L. J. Inter-individual variability in tDCS effects: A narrative review on the contribution of stable, variable, and contextual factors. Brain Sci.12, 522 (2022). 10.3390/brainsci12050522 [DOI] [PMC free article] [PubMed] [Google Scholar]
- 22.Plewnia, C. et al. Effects of transcranial direct current stimulation (tDCS) on executive functions: Influence of COMT Val/Met polymorphism. Cortex49, 1801–1807 (2013). 10.1016/j.cortex.2012.11.002 [DOI] [PubMed] [Google Scholar]
- 23.Weidler, C. et al. The influence of the COMT Val158Met polymorphism on prefrontal TDCS effects on aggression. Sci. Rep.14, 3437 (2024). 10.1038/s41598-024-53930-3 [DOI] [PMC free article] [PubMed] [Google Scholar]
- 24.Wiegand, A., Nieratschker, V. & Plewnia, C. Genetic modulation of transcranial direct current stimulation effects on cognition. Front. Hum. Neurosci.10.3389/fnhum.2016.00651 (2016). 10.3389/fnhum.2016.00651 [DOI] [PMC free article] [PubMed] [Google Scholar]
- 25.Opitz, A., Paulus, W., Will, S., Antunes, A. & Thielscher, A. Determinants of the electric field during transcranial direct current stimulation. Neuroimage109, 140–150 (2015). 10.1016/j.neuroimage.2015.01.033 [DOI] [PubMed] [Google Scholar]
- 26.Fehring, D. et al. Investigating the sex-dependent effects of prefrontal cortex stimulation on response execution and inhibition. Biol. Sex Differ.10.1186/s13293-021-00390-3 (2021). 10.1186/s13293-021-00390-3 [DOI] [PMC free article] [PubMed] [Google Scholar]
- 27.McCann, H. & Beltrachini, L. Does participant’s age impact on tDCS induced fields? Insights from computational simulations. Biomed. Phys. Eng. Express7, 045018 (2021). 10.1088/2057-1976/ac0547 [DOI] [PubMed] [Google Scholar]
- 28.Filmer, H. L., Ehrhardt, S. E., Shaw, T. B., Mattingley, J. B. & Dux, P. E. The efficacy of transcranial direct current stimulation to prefrontal areas is related to underlying cortical morphology. Neuroimage196, 41–48 (2019). 10.1016/j.neuroimage.2019.04.026 [DOI] [PubMed] [Google Scholar]
- 29.Razza, L. B. et al. Investigating the variability of prefrontal tDCS effects on working memory: An individual E-field distribution study. Cortex172, 38–48 (2024). 10.1016/j.cortex.2023.10.025 [DOI] [PubMed] [Google Scholar]
- 30.Dedoncker, J., Brunoni, A. R., Baeken, C. & Vanderhasselt, M.-A. A systematic review and meta-analysis of the effects of transcranial direct current stimulation (tDCS) over the dorsolateral prefrontal cortex in healthy and neuropsychiatric samples: Influence of stimulation parameters. Brain Stimul.9, 501–517 (2016). 10.1016/j.brs.2016.04.006 [DOI] [PubMed] [Google Scholar]
- 31.Mizutani-Tiebel, Y. et al. Differences in electric field strength between clinical and non-clinical populations induced by prefrontal tDCS: A cross-diagnostic, individual MRI-based modeling study. NeuroImage Clin.34, 103011 (2022). 10.1016/j.nicl.2022.103011 [DOI] [PMC free article] [PubMed] [Google Scholar]
- 32.Batsikadze, G., Paulus, W., Grundey, J., Kuo, M.-F. & Nitsche, M. A. Effect of the nicotinic α4β2-receptor partial agonist varenicline on non-invasive brain stimulation-induced neuroplasticity in the human motor cortex. Cereb. Cortex25, 3249–3259 (2015). 10.1093/cercor/bhu126 [DOI] [PubMed] [Google Scholar]
- 33.Weidler, C. et al. Consequences of prefrontal tDCS on inhibitory control and reactive aggression. Soc. Cogn. Affect. Neurosci.17, 120–130 (2022). 10.1093/scan/nsaa158 [DOI] [PMC free article] [PubMed] [Google Scholar]
- 34.Grundey, J. et al. Nicotine modulates human brain plasticity via calcium-dependent mechanisms. J. Physiol.596, 5429–5441 (2018). 10.1113/JP276502 [DOI] [PMC free article] [PubMed] [Google Scholar]
- 35.Nakagawa, S. et al. Meta-analysis of variation: Ecological and evolutionary applications and beyond. Methods Ecol. Evol.6, 143–152 (2015). 10.1111/2041-210X.12309 [DOI] [Google Scholar]
- 36.Homan, S. et al. Treatment effect variability in brain stimulation across psychiatric disorders: A meta-analysis of variance. Neurosci. Biobehav. Rev.124, 54–62 (2021). 10.1016/j.neubiorev.2020.11.033 [DOI] [PubMed] [Google Scholar]
- 37.Bell, S. B. & DeWall, N. Does transcranial direct current stimulation to the prefrontal cortex affect social behavior? A meta-analysis. Soc. Cogn. Affect. Neurosci.13, 899–906 (2018). 10.1093/scan/nsy069 [DOI] [PMC free article] [PubMed] [Google Scholar]
- 38.Senior, A. M., Gosby, A. K., Lu, J., Simpson, S. J. & Raubenheimer, D. Meta-analysis of variance: An illustration comparing the effects of two dietary interventions on variability in weight. Evol. Med. Public Health2016, 244–255 (2016). 10.1093/emph/eow020 [DOI] [PMC free article] [PubMed] [Google Scholar]
- 39.Brugger, S. P. & Howes, O. D. Heterogeneity and homogeneity of regional brain structure in schizophrenia: A meta-analysis. JAMA Psychiatry74, 1104–1111 (2017). 10.1001/jamapsychiatry.2017.2663 [DOI] [PMC free article] [PubMed] [Google Scholar]
- 40.Sterne, J. A. C. et al. RoB 2: A revised tool for assessing risk of bias in randomised trials. BMJ366, l4898 (2019). 10.1136/bmj.l4898 [DOI] [PubMed] [Google Scholar]
- 41.Monte-Silva, K. et al. Induction of late LTP-like plasticity in the human motor cortex by repeated non-invasive brain stimulation. Brain Stimul.6, 424–432 (2013). 10.1016/j.brs.2012.04.011 [DOI] [PubMed] [Google Scholar]
- 42.Batsikadze, G., Moliadze, V., Paulus, W., Kuo, M. & Nitsche, M. Partially non-linear stimulation intensity-dependent effects of direct current stimulation on motor cortex excitability in humans. J. Physiol.591, 1987–2000 (2013). 10.1113/jphysiol.2012.249730 [DOI] [PMC free article] [PubMed] [Google Scholar]
- 43.Wynn, S. C., Driessen, J. M. A., Glennon, J. C., Brazil, I. A. & Schutter, D. J. L. G. Cerebellar transcranial direct current stimulation improves reactive response inhibition in healthy volunteers. Cerebellum Lond. Engl.18, 983–988 (2019). 10.1007/s12311-019-01047-z [DOI] [PMC free article] [PubMed] [Google Scholar]
- 44.Ostrowski, J., Svaldi, J. & Schroeder, P. A. More focal, less heterogeneous? Multi-level meta-analysis of cathodal high-definition transcranial direct current stimulation effects on language and cognition. J. Neural Transm.129, 861–878 (2022). 10.1007/s00702-022-02507-3 [DOI] [PMC free article] [PubMed] [Google Scholar]
- 45.Gray, J. P., Müller, V. I., Eickhoff, S. B. & Fox, P. T. Multimodal abnormalities of brain structure and function in major depressive disorder: A meta-analysis of neuroimaging studies. Am. J. Psychiatry177, 422–434 (2020). 10.1176/appi.ajp.2019.19050560 [DOI] [PMC free article] [PubMed] [Google Scholar]
- 46.Picó-Pérez, M. et al. Modality-specific overlaps in brain structure and function in obsessive-compulsive disorder: Multimodal meta-analysis of case-control MRI studies. Neurosci. Biobehav. Rev.112, 83–94 (2020). 10.1016/j.neubiorev.2020.01.033 [DOI] [PubMed] [Google Scholar]
- 47.Cai, W., Ryali, S., Chen, T., Li, C.-S.R. & Menon, V. Dissociable roles of right inferior frontal cortex and anterior insula in inhibitory control: Evidence from intrinsic and task-related functional parcellation, connectivity, and response profile analyses across multiple datasets. J. Neurosci.34, 14652–14667 (2014). 10.1523/JNEUROSCI.3048-14.2014 [DOI] [PMC free article] [PubMed] [Google Scholar]
- 48.Swick, D., Ashley, V. & Turken, U. Are the neural correlates of stopping and not going identical? Quantitative meta-analysis of two response inhibition tasks. Neuroimage56, 1655–1665 (2011). 10.1016/j.neuroimage.2011.02.070 [DOI] [PubMed] [Google Scholar]
- 49.Raud, L., Westerhausen, R., Dooley, N. & Huster, R. J. Differences in unity: The go/no-go and stop signal tasks rely on different mechanisms. NeuroImage210, 116582 (2020). 10.1016/j.neuroimage.2020.116582 [DOI] [PubMed] [Google Scholar]
- 50.Simmonds, D. J., Pekar, J. J. & Mostofsky, S. H. Meta-analysis of Go/No-go tasks demonstrating that fMRI activation associated with response inhibition is task-dependent. Neuropsychologia46, 224–232 (2008). 10.1016/j.neuropsychologia.2007.07.015 [DOI] [PMC free article] [PubMed] [Google Scholar]
- 51.Algermissen, J. & Mehler, D. M. May the power be with you: Are there highly powered studies in neuroscience, and how can we get more of them?. J. Neurophysiol.119, 2114–2117 (2018). 10.1152/jn.00765.2017 [DOI] [PubMed] [Google Scholar]
- 52.Simmonds, M. Quantifying the risk of error when interpreting funnel plots. Syst. Rev.4, 1–7 (2015). 10.1186/s13643-015-0004-8 [DOI] [PMC free article] [PubMed] [Google Scholar]
- 53.Kuhn, T. et al. The ENIGMA Neuromodulation Working Group: Goals, Challenges, and Opportunities for the Field. (2024).
- 54.Allen, C. & Mehler, D. M. Open science challenges, benefits and tips in early career and beyond. PLoS Biol.17, e3000246 (2019). 10.1371/journal.pbio.3000246 [DOI] [PMC free article] [PubMed] [Google Scholar]
- 55.Page, M. J. et al. The PRISMA 2020 statement: An updated guideline for reporting systematic reviews. BMJ10.1136/bmj.n71 (2021). 10.1136/bmj.n71 [DOI] [PMC free article] [PubMed] [Google Scholar]
- 56.Boggio, P. S. et al. Go-no-go task performance improvement after anodal transcranial DC stimulation of the left dorsolateral prefrontal cortex in major depression. J. Affect. Disord.101, 91–98 (2007). 10.1016/j.jad.2006.10.026 [DOI] [PubMed] [Google Scholar]
- 57.Reinhart, R. M. & Woodman, G. F. Causal control of medial–frontal cortex governs electrophysiological and behavioral indices of performance monitoring and learning. J. Neurosci.34, 4214–4227 (2014). 10.1523/JNEUROSCI.5421-13.2014 [DOI] [PMC free article] [PubMed] [Google Scholar]
- 58.Stramaccia, D. F., Penolazzi, B., Altoè, G. & Galfano, G. TDCS over the right inferior frontal gyrus disrupts control of interference in memory: A retrieval-induced forgetting study. Neurobiol. Learn. Mem.144, 114–130 (2017). 10.1016/j.nlm.2017.07.005 [DOI] [PubMed] [Google Scholar]
- 59.Rohatgi, A. WebPlotDigitizer: 4.6. (2022).
- 60.Chapter 23, Including Variants on Randomized Trials. (Wiley Blackwell, 2019).
- 61.Higgins, J., Sandra, E. & Tianjing, L. Chapter 23, Including variants on randomized trials (Second edition). (eds Higgins, J. et al.) (Wiley Blackwell, 2019). 10.1002/9781119536604.ch23.
- 62.Senior, A. M., Viechtbauer, W. & Nakagawa, S. Revisiting and expanding the meta-analysis of variation: The log coefficient of variation ratio. Res. Synth. Methods11, 553–567 (2020). 10.1002/jrsm.1423 [DOI] [PubMed] [Google Scholar]
- 63.Viechtbauer, W. Conducting meta-analyses in R with the metafor package. J. Stat. Softw.36, 1–48 (2010). 10.18637/jss.v036.i03 [DOI] [Google Scholar]
Associated Data
This section collects any data citations, data availability statements, or supplementary materials included in this article.
Supplementary Materials
Data Availability Statement
Data and the analysis script are provided within the supplementary materials.