

Abstract
Understanding the mechanical characteristics of rocks when subjected to direct tension is crucial for assessing the stability of rock formations. Within the scope of this research, a series of tests was conducted using Tage tuff to assess the deformation behavior and crack extension of rock under direct tension. The axial, lateral, and shear strain fields as well as crack propagation, localized deformation behavior, and failure mode of the rocks were analyzed using three-dimensional digital image correlation method. The results showed that the axial strain fields on the specimen surface were heterogeneous, with different locations and localization occurring in the pre-peak stage, which was similar to the evolution of shear strain, whereas the lateral strain only showed slight changes. The crack extension direction was inferred, indicating that both tensile and shear stress occurred in the tests. Furthermore, different stress–strain responses were observed for the inside and outside of the localized bands. Then, the surface patterns of specimen failure were scanned and analyzed to assess the failure mode and residual strength of the specimen under direct tensile stress. Finally, the results of direct tension, uniaxial compression, and Brazilian split tests for Tage tuff were compared, and the complete stress–strain curve of uniaxial tension (UT) was simulated using a nonlinear-variable-compliance constitutive equation. This study provides a deeper understanding into the damage behavior of rocks under direct tension.
Keywords: Direct tension, Digital image correlation, Localization, Failure mode, Constitutive equation
Subject terms: Civil engineering, Imaging and sensing
Introduction
The stability of rock structures, including tunnels, underground excavations, and slopes, is contingent upon a thorough understanding of both the tensile and compressive properties of rocks1,2. Previous research has established that rocks exhibit lower strength when subjected to tension compared to compression and that tensile damage commonly occurs in rocks, resulting in the rupture and collapse of rock structures3,4. Previous investigations have shown a sustained efforts to investigating the tensile properties of rocks under different test conditions5–7. The tensile strength of rocks is widely measured by following the International Society for Rock Mechanics (ISRM) standard, which includes both direct and indirect test methods. The Brazilian splitting test is widely recognized as the standard method for investigating the tensile characteristics of rocks. Nevertheless, an increasing number of studies have shown that the splitting strength is lower than the direct tensile strength and crack extension is initiated from the contact position between the rock disk and loading head5,8,9. The bending test method is used by applying three- or four-point bending to cubic or cylindrical specimens10,11. However, the specimen shape and loading rate affect the test results. The direct tension test is deemed the most suitable technique for assessing the tensile characteristics of rocks. Although it’s difficult to conduct the direct tension test, some valuable results have been obtained through this test in previous studies.
Okubo and Fukui4,12 derived full stress–strain curves for nine Japanese rock samples employing a linear combination of stress and strain. Their analysis revealed that the residual strength post-failure and the stress–strain curve under tension closely resemble those under compression. Then, their innovative test method facilitated the first-ever detailed examination of how loading rates impact the tensile strength of coals (anthracite), with the acquisition of full stress–strain curves. The research by Li et al.7, which included direct tension tests on granite, indicated that the material's direct tensile strength is positively influenced by an increase in the strain rate. Cen et al.13 studied the tensile behavior of rock bedding planes by conducting direct tension tests on cylindrical specimens. The results showed that different rock specimens exhibit different grain-scale fractures on the fracture surfaces, and the mechanical properties, including the elastic modulus, deformation modulus, peak strain, and tensile strength, show considerable dependence on the tensile strain rate. Yang et al.2 explored the damage mechanism, displacement distribution, and tensile strain of dog-bone-shaped granite specimens and found that the damage behavior is related to the strain gradient. Hashiba and Fukui14 focused the effect of water on the deformation and failure of four rock types under uniaxial tension, they found that the stress–strain curves exhibited strong nonlinearity before peak strength. Subsequently, they used a crack extension model to simulate the stress–strain behavior of rocks. Huang et al.1,15 studied the triaxial direct tensile properties of rocks. Moreover, they investigated the effects of the loading rate and confining pressure on tensile strength, deformation, fracture, and energy conversion in rocks. The failure mode of the rock specimen transitioned from tensile to mixed tensile–shear failure and subsequently to mixed compressive–shear failure with the increasing confining pressure. Parras and Diederichs16 examined the relationship between the direct tensile strength and crack initiation threshold. Hashiba et al.5 analyzed the effect of the test apparatus on the results of the direct tensile tests by conducting associated tests in seven laboratories. The results showed that the direct tensile strength is independent of the type of test apparatus used.
The core of the previous studies was concentrated on stress–strain curves, tensile strength, and the effect of testing factors. However, only few investigations have been conducted on the progression of deformation fields and strain localization under direct tension. In this study, the direct tensile tests were conducted on Tage tuff, resulting in the acquisition of complete stress–strain curves that extend into the post-failure region. The three-dimensional digital image correlation (3D-DIC) method was employed to obtain the full-field strain on the specimen surface. Accordingly, the deformation fields, strain localization phenology, and crack evolution were analyzed. The residual tensile strength was also discussed based on the 3D-scaning results of the fracture surface. This study makes significant contributions toward elucidating the tensile failure mechanism of rocks, which is essential in assessing the stability of rocks for rock engineering.
Material and methods
Specimen description
The direct tensile tests were performed on Tage tuff from Japan, which predominantly composed of albite and feldspar, with minor calcite content. The average uniaxial compressive strength and Young’s modulus of Tage tuff were ~ 15.38 MPa and 2.5 GPa, respectively. Moreover, the Poisson’s ratio and density were 0.32 and 1.77 g/cm3, respectively17. A large rock block was processed into cylindrical test specimens (25 mm in diameter and 50 mm in height) via core drilling and cutting. The specimens' end surfaces were carefully ground and polished to meet the standards of ISRM with variations in the flatness of the end surfaces being less than 0.02 mm. Furthermore, specimens were coated with a random pattern, created by spraying white and black paints on the specimen surface to use the 3D-DIC method. Firstly, matt white paint was sprayed on the specimen surface as an underpainting and then matt black paint was used to create black speckles. The speckle pattern showed the irregular random distribution with the high contrast. At last, all specimens were subsequently air-dried in the laboratory for at least two weeks before undergoing testing.
Test method
Figure 1 shows the 20-kN servo-controlled test instrument used to conduct the direct tensile tests. Such test apparatus has been successfully used to investigate the direct tensile behavior and loading rate dependency of rocks and coals, as reported by Okubo et al.4,12,14. The tensile displacement rate was 5 × 10⁻⁴ mm/s. The load and displacement were measured by loading cell and linear variable differential transformer (LVDT), respectively. The specimen was bonded using epoxy resin to the upper and lower platens of the test apparatus for 24 h, respectively. The testing of one specimen requires at least 48 h, which allows its accurate self-alignment with the resin and platens to avoid eccentric tension, as described by Okubo et al.4 and Hashiba et al.5.
Figure 1.
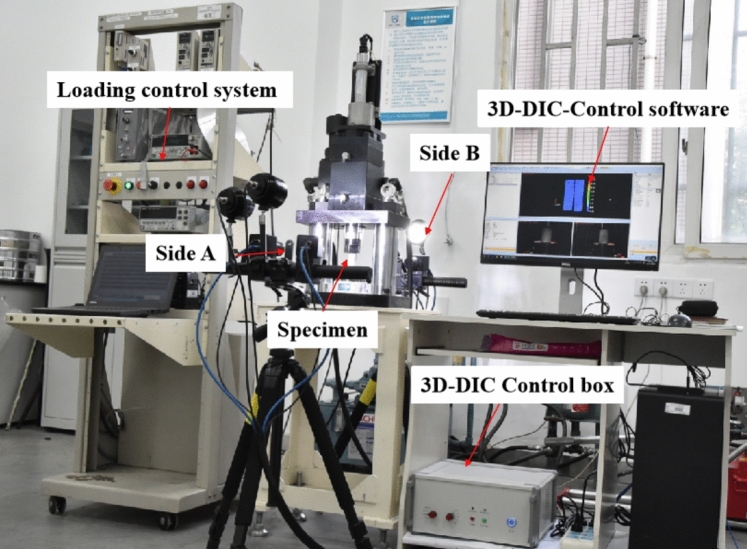
Test system used in the direct tensile tests in this study.
During the tensile test, the epoxy resin underwent deformation and the LVDT measurement could not reflect the actual deformation of the specimen18. Although strain gauges affixed to the specimen can be used to obtain the actual strain. Once they break owing to specimen failure, the stress–strain curve cannot be obtained in the post-failure region. Thus, the 3D-DIC technique, extensively utilized within the domain of rock mechanics, was employed to measure the rock deformation. The specimen’s strain can be obtained using 3D-DIC method without any influence of the deformation of the resin. Here the 3D-DIC test system (with four cameras connected and controlled synchronously by the test apparatus) was used during the tensile tests. Detailed information on the 3D-DIC system is reported by Tang et al.18,19. The frequency of the image collection was 5 Hz. To cover a larger measurement region, the cameras were divided into two groups for the front (Side A) and back (Side B) of the specimen.
Results
Preliminary experiment
The centric tension of specimens is important in ensuring the accuracy of the direct tension test. Okubo and Fukui12 attached four strain gauges on the specimen to obtain four stress–strain curves with good consistency. In this study, the 3D-DIC method was used to obtain the strain of the specimens using virtual extensometers. Therefore, the agreement between the stress–strain curves also needs to be examined.
Preliminary direct tensile tests of the Tage tuff specimens were conducted using six virtual extensometers (three on Side A and three on Side B) to measure the axial strain through image calculation. Figure 2 shows the six stress–strain curves in pre-failure region. The two groups of curves exhibit good agreement up to a stress of 0.77 MPa. Subsequently, the deviations among the curves increases with increasing stress owing to the heterogeneity of the rock, indicating more evident non-uniform deformation.
Figure 2.
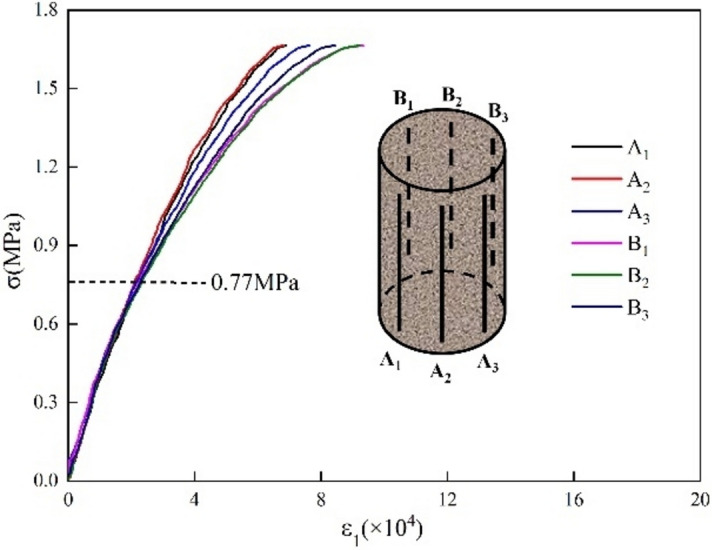
Stress–strain curves at different positions.
Complete stress–strain curve and full-field strain evolution
The typical complete stress–strain curve is presented as Fig. 3, with the strain obtained from virtual extensometer A2. The curve exhibits a linear increase when the stress is < 0.77 MPa. The curve gradually bends to the right with increasing stress, indicating increased inelastic deformation until the peak stress is reached with a peak strain of 7.47 × 10⁻⁴. The peak strain can be categorized into elastic and inelastic strains (εi = 2.95 × 10⁻⁴), for which the slope of the straight line represents the linear part of the stress–strain curve. After the peak point, the stress rapidly decreases to a residual stress of 0.60 MPa; thereafter, it decreases gradually. The residual strength still exists at ~ 0.4 MPa even after specimen failure. To analyze the strain fields and crack evolution on the specimen surfaces, ten stages (A–K) were marked on the stress–strain curve to represent the stress levels at 50%, 70%, 90%, 95%, and 100% of the peak strength (A–E) in pre-failure region and at 95%, 85%, 70%, 50%, and 25% of the peak strength (F–K) in the post-failure region, as shown in Fig. 3. The results for Sides A and B were obtained and analyzed.
Figure 3.
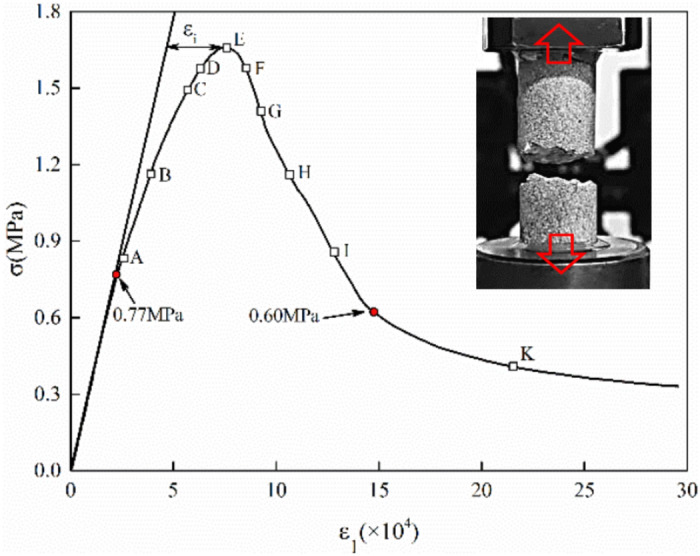
Stress–strain curve of the Tage tuff specimens under direct tension.
Figure 4a shows the development of the axial strain fields in pre-failure region, as observed from Sides A and B under different stress levels. Both strain fields measured from Sides A and B exhibit uniform deformation at lower stress levels (e.g., Stage A). While the tensile stress increases to reach Stage B, the strain field of Side A remains almost homogeneous, whereas that of Side B exhibits slight variations, as indicated by the red boxes. When the tensile stress reaches Stages C and D, a larger inelastic deformation is produced in the specimen, as indicated by the stress–strain curve. The strain fields also increase at different rates with evident strain concentration, particularly on Side B. The concentration region indicates the crack initiation and extension in the specimen. As the stress increases to the peak strength (Stage E), strain localization occurs at the bottom of Side B, indicating that the crack propagated from the middle of Side B at a faster rate than that of Side A.
Figure 4.

Evolution of the axial strain fields on Sides A and B: (a) pre-failure region and (b) post-failure region.
Figure 4b shows the evolution of the axial strain fields in the post-failure region. A significant localized band is formed at the bottom of Side B. The width of the band increases with stress decreasing, indicating that the cracks are extended and connected to form macrocracks. Furthermore, the strain field on Side A remains unchanged before Stage G, suggesting that some parts of the specimen maintained their integrity and load capacity in the post-failure region, which partially explains the residual strength of the rocks under direct tension from a macroscopic perspective. When the stress reaches Stage I, localization occurs and propagates from right to left until localization bands are formed at Stage K. Although localization bands can be observed in both Sides A and B, this does not imply the penetration of the macro-crack through the specimen; instead, this shows that the cracks are connected on the specimen surface. Notably, when the localized band appears at the bottom of the specimen, the strain at the top of the specimen is reduced owing to spring-back in a segment of specimen. The direction of the crack extension is inferred by comparing the strain field evolution in Stages C-K.
As the direction of the axial strain is parallel to that of the tensile stress, the axial strain field demonstrates significant variations during the direct tension test. However, the lateral strain fields only show minimal changes, which indicate the nearly homogenous deformation in the lateral direction. This is attributed to the fact that unlike metals, which are ductile materials, rocks are brittle materials. Moreover, the loading direction directly affects strain evolution. When uniaxial direct tensile stress is applied, the lateral strain of the rock specimen is considerably lower than the axial strain. Figure 5 shows the lateral strain fields at Stages I and K of Sides A and B after peak strength. The results show nearly homogeneous patterns, except for the small regions in red circles, which correspond to the localized bands in Fig. 4. Based on the aforementioned results, the evolution of the axial and lateral strain fields is discussed. Interestingly, the shear strain field exhibits variations at different stress stages. Figure 6 shows the shear strain fields in the post-failure region. The shear strain concentration is clearly observed at the bottom of the specimen. This can be attributed to the crack extension rather than the eccentric tension or rotation of the specimen. It is evidenced by the two colors of the localized bands, which represent the contrast directions for the shear strain. For Side A, the crack extends from right to left, as shown in Fig. 4b (H–K); however, the crack extension direction (H–K) changes, as indicated by the red arrows in Fig. 6. For Side B, the crack spreads outward from the middle, as shown in Fig. 4(C–K); the crack extension directions are presented by the red arrows in Fig. 6(F–K). During the crack extension process, the associated shear behavior induces shear strain, indicating the relative sliding of the fracture plane. Therefore, both tensile and shear activities occur under the uniaxial direct tension of rocks. Moreover, the crack propagation and failure modes are more complex than those expected before the test.
Figure 5.

Lateral strain fields at stage I and K for (a) Side A and (b) Side B.
Figure 6.

Shear strain fields from stage F to K for Sides A and B.
Local deformation behavior
Even the evolution patterns of the strain fields including localization were qualitatively analyzed in the previous section, quantitative analysis of the strain evolution is required based on the virtual extensometers positioned both within and beyond the strain localization zone. Five axial (L1–L5) and three lateral (R1–R3) extensometers were installed on Sides A and B, respectively. As shown in Fig. 7, L1 was positioned in a vertical orientation along the length of the specimen, while L2 and R1 were positioned vertically and horizontally inside the localization band. Other extensometers were placed outside the localization band.
Figure 7.
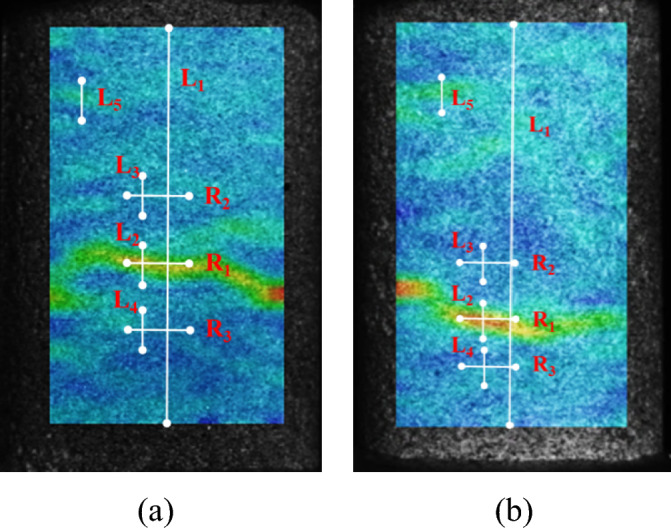
Locations of the virtual extensometers in (a) Side A and (b) Side B.
Figure 8 shows the evolution of the axial and lateral strain curves of the test specimen under direct tension. The stress curves are also plotted for comparison. For the axial strains obtained from Side A, the strain curves obtained from all the virtual extensometers are similar until the tensile stress reaches 1.35 MPa (approximately 80% of peak strength), as illustrated in Fig. 8a. Subsequently, the strain obtained from L5 exhibits a faster increase than that associated with other extensometers, indicating slight crack propagation in the upper right sector of the specimen. Although the stress reaches the peak strength, there are no clear variations in the strain value. These results are consistent with the strain field patterns shown in Fig. 4a (Side A). When the stress decreases to 1.03 MPa after reaching the peak strength, the strain obtained from L2 placed inside the localization band increases abruptly, indicating evident tensile deformation owing to crack generation and coalescence. Conversely, the strain obtained from L3–L5 placed outside the localization band gradually decreases owing to spring-back deformation outside the localization band of the specimen. These results indicate that initial or early cracks are not necessarily the leading cracks that cause the macroscopic failure of rocks. Therefore, the crack extension rate may be an important controlling parameter for rock tensile rupture.
Figure 8.

Evolution of strains of the rock specimens under direct tension from the virtual extensometers: (a) axial strain in Side A, (b) axial strain in Side B, (c) lateral strain in Side A, and (d) lateral strain in Side B.
Figure 8b shows the axial strains obtained from Side B, which exhibit similar variation tendency as those shown in Fig. 8a. The difference is the rapid increase in the strain in the localized region before the peak strength. Furthermore, the strain curve of L2 increases abruptly (Fig. 8a) and gradually (Fig. 8b). This can be ascribed to the location of L2 on Side B, which is in the region where the crack is initiated. Furthermore, L2 on Side A is located along the crack propagation path. This phenomenon proved the effect of the crack extension direction, as discussed in Section “Local deformation behavior”.
Figures 8(c,d) show the variations of the lateral strains on Sides A and B, respectively. The lateral strains are an order of magnitude smaller than the axial strains. Hence, the fluctuations of the curves are relatively large. For Side A, the lateral strains obtained from R1–R3 decrease until the stress decreases to 1.03 MPa in the post-failure region, indicating specimen shrinkage. The same turning point is observed for the axial strain evolution. After the turning point, the lateral strain obtained from R1 placed inside the localization band increases rapidly followed by a slight decrease and the lateral strains obtained from R2 and R3 placed outside the localization band exhibits a similar tendency with more gradual variations. The strain curves for Side B exhibit similar variations as those for Side A, except for the strain obtained from R1, which increases rapidly with the turning point of the strain corresponding to the peak strength.
Failure mode
Figure 9a shows the typical surface pattern of the failure of the test specimen under direct tension. As can be seen, the failure surface exhibits macro-asperities with distinct height variations. Huang et al.15 noted that the fracture surface of granite was smooth and nearly perpendicular to the axial stress direction. This is attributed to the higher brittleness of granite than that of Tage tuff in this study. The surface patterns of failure are similar to those described by Okubo and Fukui12, who investigated Tage tuff.
Figure 9.

Typical surface pattern of failure for the test specimen under direct tension for: (a) actual failure surface and (b) 3D scanned failure surface.
Figure 9b shows the scanning results of the failure surface obtained using the 3D-scanner. The dotted red lines represent Sides A and B. The maximum height variation of the failure surface was ~ 3 mm, which indicates the heterogeneity of the specimen. In addition, the crack extension directions obtained from 3D-DIC analysis follow the red solid arrows from Sides B to A, which correspond to the evolution of the localization bands shown in Figs. 4 and 6. During the rock fracture process, friction is generated between locations with height differences (such as those marked by the red solid boxes), indicating the mixed tensile–shear failure of the rock specimens under direct tension. This also contributes to the residual strength observed in the post-failure region.
Discussion
Comparison with uniaxial compression and split tests
The results of uniaxial compression (UC) and Brazilian tests (BTs) conducted on Tage tuff were compared with that of direct tension. The specimens used in BT were discs with a diameter and thickness of 25 and 13 mm, respectively, while the specimens used in UC are of the same size as those used in direct tension. All specimens were cylindered from the same block.
Figure 10 shows the complete curves of UC, uniaxial tension (UT), and BT, which were normalized by the peak strength and strain due to the large variation of all three peak strengths. The distinction among the stress–strain curves reflects the difference in the crack evolution and failure mechanism under different stress paths. In pre-failure region, the UT curve slightly concaves in the upward direction, and the curves of BT and UC slightly concave in the downward direction, finally reaching a nearly linear stage. This could be because crack extension occurs only under direct tensile stress, without the cracks fully closing. The curves of BT and UC show better consistency, thus reflecting their similarities in stress distribution and crack evolution. In the post-failure region, stress decreases gradually, with a similar tendency in UC and UT, while that in BT decreases rapidly followed by an increase with fluctuation. The residual strength of BT is larger than those of UC and UT. Moreover, the failure mode and crack distribution could be the factors contributing toward the distinction beyond the peak point on the stress–strain curve under different stress paths.
Figure 10.
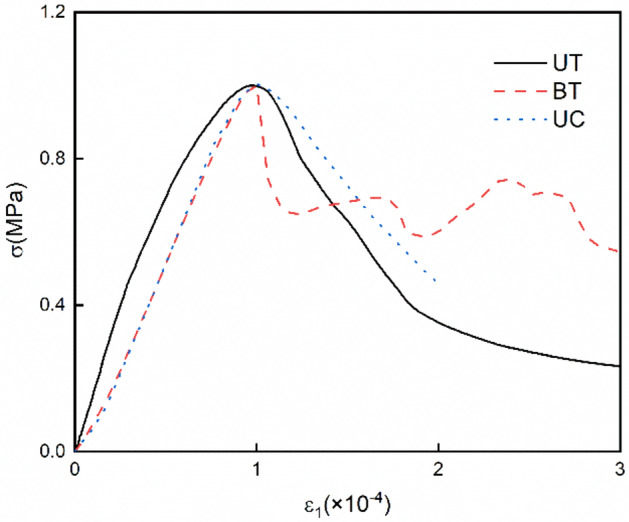
Stress–strain curves of BT, UT, and UC.
Figure 11 shows the failure specimen after UC and BT tests. Note that both UC and BT were conducted under compressive stress. The specimen in UC and UT showed a combined shear and tension failure modes. As loading continues after peak strength (post-failure region), the load capacity of the specimen, mainly imparted by the friction in fracture planes, thus resulting in stress, decreases gradually to a smaller residual strength. The BT failure mode involves a narrow central crack and a wedge-shape fragment at the up-loading edge, which is a typical failure pattern observed in many previous studies. Although visible cracks were formed, the specimen has higher load capacity on both sides of cracks, resulting in a higher residual strength. Thus, although UC, UT, and BT tests of the rock were conducted considering different loading paths, their failure mechanisms are closely associated with each other.
Figure 11.
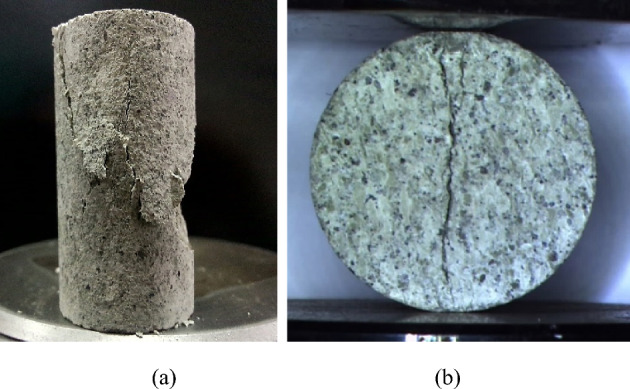
Failure mode of specimens under (a) UC and (b) BT.
Simulation of complete curves of direct tension
Figure 10 presents that the stress–strain curve for Tage tuff shows nonlinearity in UC than in UT and BT. To simulate the complete stress–strain curve of UC and considering the nonlinear phenomenon, the authors’ research group proposed a nonlinear-variable compliance-constitutive equation, which can simulate the damage and time-dependent behavior of rocks20–22.
| 1 |
| 2 |
| 3 |
| 4 |
where t is the time; ε is the strain comprising the elastic and inelastic strains, ε3 and ε1, respectively; σ is the stress; and λ presents variable compliance, which is the strain–stress ratio. In addition, parameters α1, α3,n1, n3, m1, and m3 are constants23. Table 1 lists the constant values for Tage tuff obtained using the methods by Okubo et al.23.
Table 1.
Values of calculated constants.
| Conditions | Values of constants | Initial values | |||||||
|---|---|---|---|---|---|---|---|---|---|
| Rock | Test | α1 | α3 | n1 | n3 | m1 | m3 | ε1 | λ |
| Tage tuff | UT | 10–4 | 1 | 45 | 40 | 11 | 21 | 0 | 1 |
Figure 12 presents the calculated and tested stress–strain curves of Tage tuff under direct tension. The calculated and tested curves correspond well from the origin to the peak strength, while slightly deviating after peak strength owing to the complicated crack progression and damage behavior after rock failure. The nonlinear-variable compliance-constitutive equation could satisfactorily simulate the direct tensile behavior of Tage tuff.
Figure 12.
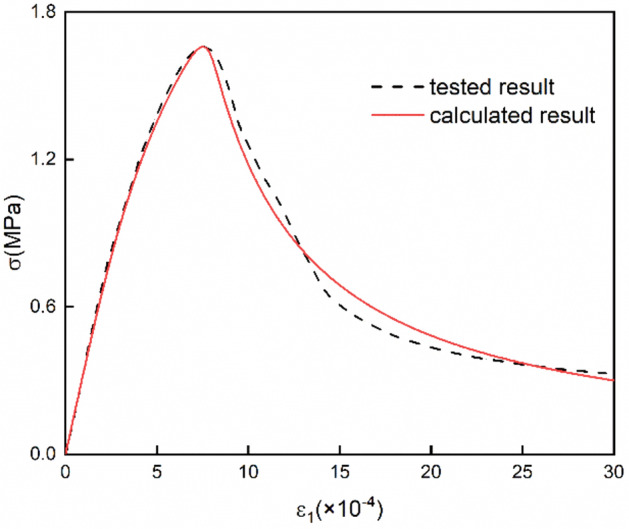
Tested and calculated complete stress–strain curves of Tage tuff under UT.
Conclusions
In this study, direct tension tests were conducted on Tage tuff and the 3D-DIC method was utilized to acquire the strain fields on the specimen's surface. The evolution of the axial, lateral, and shear strain fields was analyzed along with crack propagation based on the stress–strain curve. Subsequently, the deformation behaviors inside and outside the localized bands were investigated. Furthermore, the failure mode of the rock specimen was examined. Finally, all the three tests, namely, UC, UT, and BT were compared, and the complete stress–strain curve for UT was simulated. The principal conclusions drawn from this research are outlined below:
The axial strain fields were heterogeneous at different locations on the specimen surface. The variations in the axial strain became increasingly evident at different strain rates with increasing tensile stress. The deformation first concentrated on Side B, whereas the deformation remained nearly homogeneous for Side A in the pre-failure region. Localized bands were gradually formed in the post-failure region, indicating that the crack propagated from the middle of Side B to Side A.
The lateral strain fields of the specimen exhibited minimal variations, which suggested that only small lateral deformation occurred under direct tension. The shear strain field exhibited variations and localized bands were observed. The evolution of shear bands indicated the crack extension in the specimen with both tensile and shear behavior. These findings can provide a deeper insight into the failure mechanisms of rocks during direct tension tests.
During the crack extension and formation of localized bands, different stress–strain responses were observed based on the placement of the virtual extensometers positioned both within and beyond the localized bands. The axial strain increased abruptly in the post-failure region for Side A, whereas the axial strain increased rapidly in the pre-failure region for Side B, which was consistent with the observed strain field evolution and crack extension. The evolution of the lateral strains demonstrated similar variation tendencies for Sides A and B.
The failure mode of the specimen was examined via 3D scanning. The crack extension directions followed the evolution of localization bands. The specimen exhibited a mixed tensile–shear failure mode under direct tension, and friction was generated between locations with height differences on the failure surface, which contributed to the residual strength of rocks. In future studies, the micro-failure mechanism of the rocks under direct tension should be further investigated in detail.
The distinction among the stress–strain curves can reflect the difference in the crack evolution and failure mechanism under different loading paths. Regarding the pre-peak strength, the curve of UT slightly concaves upward, while those of BT and UC coincide. In the post-failure region, the residual strength of BT is larger than those in UC and UT, which could be attributed to the failure modes of specimens. The nonlinear-variable compliance-constitutive equation was employed to accurately simulate the stress–strain curve of direct tension for Tage tuff.
Acknowledgements
This research was funded by Natural Science Foundation of Chongqing, China (CSTB2023NSCQ-MSX0055, CSTC2021JCYJ-MSXMX0354), Science and Technology Research Program of Chongqing Municipal Education Commission (KJZD-K202301307, KJZD-K202201304, KJQN202201314), Scientific and Technological Research Projects of Henan Province (232102320243) and the Chongqing University of Arts and Sciences Foundation (P2021TM09).
Author contributions
X.G. and Y.T. wrote the main manuscript. Y.T. designed the research. J.L. and H.Z. revised the manuscript. C.C. and F.Z. conduct the tests. S.O. conducted the calculation of constitutive equation. All authors reviewed the manuscript.
Data availability
Data supporting the results of the study can be accessed upon reasonable request from the corresponding author.
Competing interests
The authors declare no competing interests.
Footnotes
Publisher's note
Springer Nature remains neutral with regard to jurisdictional claims in published maps and institutional affiliations.
References
- 1.Huang, D., Liu, Y., Cen, D., Peng, J. & Zeng, B. Mechanical responses of granite under confined direct tensile testing: Fracture, strength, energy conversion and mechanism. Rock Mech. Rock Eng.56, 143–166 (2023). 10.1007/s00603-022-03080-7 [DOI] [Google Scholar]
- 2.Yang, G., Cai, Z., Zhang, X. & Fu, D. An experimental investigation on the damage of granite under uniaxial tension by using a digital image correlation method. Opt. Laser. Eng.73, 46–52 (2015). 10.1016/j.optlaseng.2015.04.004 [DOI] [Google Scholar]
- 3.Panteleev, I. et al. Experimental investigation of the Spatio-temporal localization of deformation and damage in Sylvinite specimens under uniaxial tension. Eng. Fract. Mech.129, 38–44 (2014). 10.1016/j.engfracmech.2014.08.004 [DOI] [Google Scholar]
- 4.Okubo, S., Fukui, K. & Qi, Q. Uniaxial compression and tension tests of anthracite and loading rate dependence of peak strength. Int. J. Coal Geol.68, 196–204 (2006). 10.1016/j.coal.2006.02.004 [DOI] [Google Scholar]
- 5.Hashiba, K. et al. Literature survey and experimental study on the direct tension test on rocks. Geotech. Test. J.40, 20160201 (2017). 10.1520/GTJ20160201 [DOI] [Google Scholar]
- 6.Hashiba, K., Fukui, K. & Kataoka, M. Modeling of complete stress-strain curves and time-dependent behaviors of rocks under uniaxial tension. Mater. Trans.59, 747–753 (2018). 10.2320/matertrans.M-M2018808 [DOI] [Google Scholar]
- 7.Li, H. et al. Direct tension test for rock material under different strain rates at quasi-static loads. Rock Mech. Rock Eng.46, 1247–1254 (2013). 10.1007/s00603-013-0406-7 [DOI] [Google Scholar]
- 8.Yu, Y., Zhang, J. & Zhang, J. A modified brazilian disk tension test. Int. J. Rock Mech. Min.46, 421–425 (2009). 10.1016/j.ijrmms.2008.04.008 [DOI] [Google Scholar]
- 9.Wang, Q. Z., Jia, X. M., Kou, S. Q., Zhang, Z. X. & Lindqvist, P. A. The flattened Brazilian disc specimen used for testing elastic modulus, tensile strength and fracture toughness of brittle rocks: Analytical and numerical results. Int. J. Rock Mech. Min.41, 245–253 (2004). 10.1016/S1365-1609(03)00093-5 [DOI] [Google Scholar]
- 10.Li, B. Q. & Einstein, H. H. Comparison of visual and acoustic emission observations in a four point bending experiment on barre granite. Rock Mech. Rock Eng.50, 2277–2296 (2017). 10.1007/s00603-017-1233-z [DOI] [Google Scholar]
- 11.Zhang, H. et al. Damage and fracture investigation of three-point bending notched sandstone beams by Dic and ae techniques. Rock Mech. Rock Eng.48, 1297–1303 (2015). 10.1007/s00603-014-0635-4 [DOI] [Google Scholar]
- 12.Seisuke, O. & Fukui, K. Complete stress-strain curves for various rock types in uniaxial tension. Int. J. Rock Mech. Min.33, 549–556 (1996). 10.1016/0148-9062(96)00024-1 [DOI] [Google Scholar]
- 13.Cen, D., Huang, D., Song, Y. & Jiang, Q. Direct tensile behavior of limestone and sandstone with bedding planes at different strain rates. Rock Mech. Rock Eng.53, 2643–2651 (2020). 10.1007/s00603-020-02070-x [DOI] [Google Scholar]
- 14.Hashiba, K. & Fukui, K. Effect of water on the deformation and failure of rock in uniaxial tension. Rock Mech. Rock Eng.48, 1751–1761 (2015). 10.1007/s00603-014-0674-x [DOI] [Google Scholar]
- 15.Huang, D. et al. Effect of confining pressure on deformation and strength of granite in confined direct tension tests. B. Eng. Geol. Environ.81, 110 (2022). 10.1007/s10064-022-02609-y [DOI] [Google Scholar]
- 16.Perras, M. A. & Diederichs, M. S. A review of the tensile strength of rock: Concepts and testing. Geotech. Geol. Eng.32, 525–546 (2014). 10.1007/s10706-014-9732-0 [DOI] [Google Scholar]
- 17.Tang, Y. et al. Mechanism and effect of stress level on the generalized relaxation behavior of tage tuff under triaxial compression. Rock Mech. Rock Eng.56, 6173–6187 (2023). 10.1007/s00603-023-03395-z [DOI] [Google Scholar]
- 18.Tang, Y., Zhang, H., Guo, X. & Ren, T. Literature survey and application of a full-field 3D-Dic technique to determine the damage characteristic of rock under triaxial compression. Int. J. Damage Mech.31, 1082–1095 (2022). 10.1177/10567895221089660 [DOI] [Google Scholar]
- 19.Tang, Y., Okubo, S., Xu, J. & Peng, S. Progressive failure behaviors and crack evolution of rocks under triaxial compression by 3D digital image correlation. Eng. Geol.249, 172–185 (2019). 10.1016/j.enggeo.2018.12.026 [DOI] [Google Scholar]
- 20.Hashiba, K. & Fukui, K. Time-dependent behaviors of granite: Loading-rate dependence, creep, and relaxation. Rock Mech. Rock Eng.49, 2569–2580 (2016). 10.1007/s00603-016-0952-x [DOI] [Google Scholar]
- 21.Okubo, S. & Fukui, K. An analytical investigation of a variable-compliance-type constitutive equation. Rock Mech. Rock Eng.39, 233–253 (2006). 10.1007/s00603-005-0070-7 [DOI] [Google Scholar]
- 22.Zhang, H., Tang, Y., Yu, J. & Okubo, S. Index of loading rate dependency of class I and class Ii rocks behavior in uniaxial compressive and Brazilian tensile tests. J. Cent. South Univ.30, 477–487 (2023). 10.1007/s11771-023-5260-5 [DOI] [Google Scholar]
- 23.Okubo, S., Fukui, K. & Gao, X. Rheological behaviour and model for porous rocks under air-dried and water-saturated conditions. Open Civil Eng. J.2, 88–98 (2008). 10.2174/1874149500802010088 [DOI] [Google Scholar]
Associated Data
This section collects any data citations, data availability statements, or supplementary materials included in this article.
Data Availability Statement
Data supporting the results of the study can be accessed upon reasonable request from the corresponding author.