Abstract
REBaCuO (REBCO, RE = rare earth)-coated conductor is a competitive option in terms of current-carrying capacity and high-stress durability in developing high-field magnets for nuclear magnetic resonance (NMR) research. Meanwhile, a technical challenge in utilizing a stand-alone REBCO NMR magnet is an unexpected difference in the field uniformity between the designed and measured values after being constructed and charged, i.e., harmonic errors. Bortot et al., and Li et al., reported analytic evidence of the related issue. However, sufficient research has not yet been conducted, so evidence should be supplemented further. Here we report harmonic errors due to screening current and inconsistent conductor thickness, confirmed by a 400 MHz 1H NMR magnet development project. The magnet was first charged up to its operating current, and then multiple overcharge-discharge cycles were applied, which was an empirically optimized operation protocol. A field mapping device obtained magnetic fields at designated locations in the room-temperature bore. The result showed over 100 ppm field uniformity difference between designed and measured values. A simulation model was developed considering screening current and inconsistent conductor thickness for reproducing the field distribution. Comparison of voltages and fields between simulation and measurement validated the model. Further analysis of the overcharge-discharge effect on harmonic errors demonstrated that even and odd-order harmonics are mainly attributed to screening current and geometric inconsistency while confirming the limitation of the screening current mitigation effect. Hence, we concluded that the desirable requirement of the sub-ppm level field uniformity generation might be barely possible with the current REBCO NMR magnet design approach.
Subject terms: Electrical and electronic engineering, NMR spectroscopy, Superconducting properties and materials, Applied physics
Introduction
High-temperature superconductor magnet technology utilizing REBa2Cu3O7-x (REBCO, RE=rare earth)-coated conductors and a no-insulation (NI) winding approach1 has opened a new horizon for high-field exploration2–5 and correspondingly played a key role in developing high-field applications6–10. It notably improves operation stability, high-stress durability, field performance, and compactness, thus now being extended to the public and even private sectors beyond the laboratory level. Magnetic resonance (MR) devices, e.g., nuclear magnet resonance (NMR) and magnetic resonance imaging (MRI), are desirable and eligible applications for utilizing high-field superconductor magnets since magnetic field intensity can notably improve NMR lineshape or MR image resolution, although they require the sub-ppm level field uniformity. Indeed, low-temperature superconductor (LTS) magnets were actively considered during the historical development of the MR magnets, in order to generate a higher magnetic field. However, they are now reaching the upper limit of the magnetic field: 25 T for NMR11 and 12 T for MRI12. In addition, the liquid helium shortage crisis has intensified some technical issues regarding using LTS magnets for MR applications. As a result, REBCO magnets with less liquid helium usage, e.g., conduction cooling, have recently been considered as alternatives to address relevant issues and break the magnetic field upper limit13–15.
As one part of the relevant research, in 2014, the Korea Basic Science Institute (KBSI) launched a project to demonstrate the potential of using REBCO-coated conductors for an integrated NMR spectrometer system incorporating a superconductor magnet, conduction cooling cryocooler, active and passive shim coil sets, field-lock module, and others. A collaborative team was established to investigate the expected technical challenges when an NI REBCO magnet is utilized in an NMR spectrometer. As a result, we decided to design, construct, and test a 9.4 T stand-alone superconductor magnet for a 400 MHz 1H NMR spectrometer. This project was proceeded by two stages: a 3 T 66 mm prototype NMR magnet development (called “NMR-Demo”) and then a 9.4 T 66 mm NMR magnet development16–21. The first stage demonstrated design and analysis approaches, e.g., using metal-insulation (MI) coils to mitigate the so-called NI charging delay22 and screening current-induced field (SCF) to investigate harmonic errors while obtaining its target field intensity of 3 T and field uniformity of <1 ppm under a conduction-cooling environment at 20 K in 2016. The results led to two conclusions: (1) the MI technique mitigated the charging time delay without affecting operational stability issues, and (2) magnetic field distribution was notably different from the design result, but the current sweep reversal operation could mitigate the difference23. The second stage culminated with the successful development of a 9.4 T all-REBCO NMR magnet in 2018 by obtaining sub-ppm level field uniformity and the corresponding NMR signal after applying a series of passive shimming, active shimming, and field lock techniques24. Through the NMR magnet development project, the team concluded that a practical challenge of an NI REBCO NMR magnet is the unexpected field uniformity degradation, i.e., harmonic errors, notably different from the designated one at the design stage.
Here, we report screening current and manufacturing tolerance of REBCO-coated conductors as potential causes of harmonic errors, which have yet to be discussed sufficiently25,26. This paper describes the design, construction, test, and simulation results in detail and evaluates harmonic errors due to screening current and geometric inconsistency of coated conductors. We have developed a simulation model that considers screening current and inconsistent conductor thickness to investigate measured coil voltages and spatial magnetic fields. Our model reproduced measurement results of screening current-induced voltages and fields obtained from the NMR magnet tests, which showed better agreement between simulation and measurement when compared to simulation results without considering two factors (screening current and geometric inconsistency of coated conductors). Further analysis evaluated the variation of harmonic coefficients depending on overcharge-discharge cycles. Simulation results of the overcharge-discharge effect on harmonic errors analyzed that odd-order harmonic coefficients were poorly mitigated by the cycles, unlike substantial mitigation in even-order coefficients. This analysis concluded that screening current and geometric inconsistency contribute to harmonic errors mainly in even- and odd-order harmonic coefficients.
Results
Design and construction
Table 1 summarizes the design results. The 9.4 T 66 mm KBSI all-REBCO NMR magnet comprises 48 double-pancake (DP) coils wound with 4.1, 5.1, 6.1, 7.1, and 8.1 mm wide conductors. In the design, multi-width and inner-notch approaches were incorporated. The multi-width approach was used to reduce the total conductor usage by increasing the minimum value of the anisotropic field-dependent critical current () in a stack of REBCO coils, thus increasing the operating current27. The inner notch approach was used to satisfy the sub-ppm level field uniformity28–30. One design target was to minimize the absolute value of zonal harmonic coefficients. The other target was to secure sufficient margin > 20% for guaranteeing a reliable and stable operation status in a conduction cooling environment. The measured data was used for the magnet operating current estimation where the target operating temperature was assumed to be < 20 K. The winding bore was set to be at least 50 mm because the room temperature bore requires at least a 30 mm diameter spherical volume. The gap between DP coils was the constant value of 0.6 mm (anodized aluminum sheet thickness), and that between single-pancake (SP) coils in each DP coil was 0.2 mm (G10 sheet thickness). Lastly, the outer radius of all the coils was set to be constant, making the fabrication of the outer joint between adjacent DP coils easy. It should be noted that the SCF was intentionally not considered in the design stage as investigating the resultant harmonic errors through the validated design approach is one of the research targets.
Table 1.
Key parameters of the 9.4 T REBCO NMR Magnet.
| Key parameter | |
|---|---|
| Conductor | |
| Width[mm] | 4.1 – 8.1 |
| Thickness[mm] | 0.12 |
| Total usage[km] | 8.7 (4.1-mm equivalent) |
| Critical current [A/mm] | > 200/4.1 (77K, self-field) |
| Magnet | |
| Number of DP coils | 48 |
| Turn per DP coils | 360–390 |
| Inner radius, [mm] | 50–51.3 |
| Outer radius, [mm] | 73.4 |
| Overall height, 2b[mm] | 512 |
| Central field, [T] | 9.4 (400 MHz H frequency) |
| Operating current, [A] | 190 |
| Operating temperature, [K] | 20 |
| Magnet inductance[H] | 8.5 |
| Contact resistance31[m] | 10.5 (10 considered) |
| Time constant[s] | 810 (8.5 [H]/ 10.5 [m]) |
| Field uniformity | |
| cm[ppm] | < 1 (ideal before shimming) |
| [T/cm] | − 0.8053 |
| [T/cm] | − 0.1243 |
| [T/cm] | − 0.6149 |
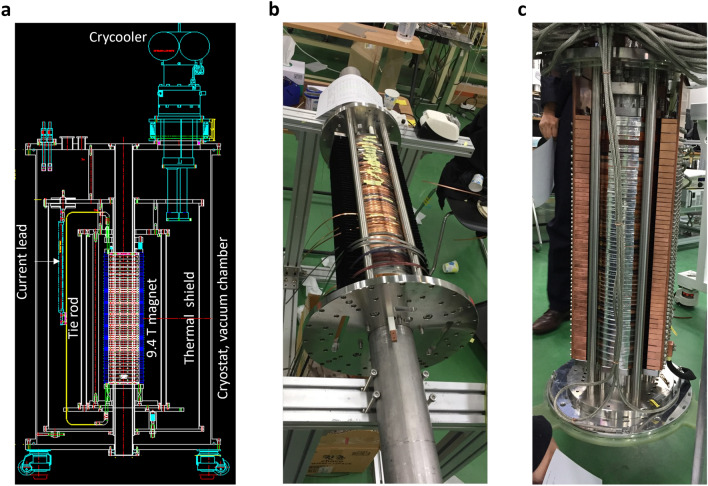
Figure 1 presents system design, outer joint fabrication, and construction results of the magnet. SuNAM Co., Ltd. fabricated every DP using stainless steel-cladded conductors. The constant winding tension of 5 kg was applied. We tested every DP in a liquid nitrogen bath at 77 K to evaluate the coil , the power-law index value, and the spatial field distribution in each DP’s bore. An in-house three-dimensional field mapper that consists of a calibrated Hall probe and two motors for xy-plane and z-axis scanning was utilized to measure fields at designated positions23. After the 77 K measurements, all the DPs were stacked according to a construction table specified to optimize harmonic errors based on the mapping results. A few extra turns were wound or unwound to make the outer diameter of DPs consistent. The measured average and standard deviation of each SP’s outer radius were 72.9 mm and 0.25 mm, unlike the designed value of 73.4 mm (constant). We added co-winding turns to match the designed outer radius, not to change the number of superconducting turns. The DP-to-DP outer joint was made using the so-called DP-to-DP splice joint20. In this process, we carefully terminated the soldering procedure to be symmetric to avoid asymmetric field errors. Korea Institute of Machinery & Materials assembled reinforcement parts for mechanical supports to mitigate vibration noise and cooling parts for the conduction cooling channel connected to the main cold head of a cryocooler.
Figure 1.
(a) System design, (b) outer joint fabrication process and (c) construction results of the 9.4 T REBCO NMR magnet.
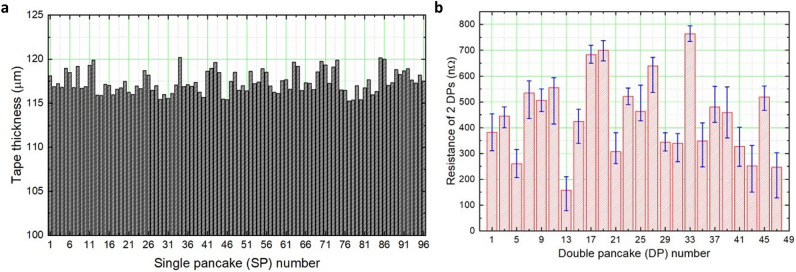
Table 2 summarizes the actual dimensions of inner and outer diameters (ID and OD) for all 96 SPs. Before and after stacking DPs, we carefully inspected the dimensions of every SP, e.g., inner diameter, outer diameter, conductor thickness, conductor width, and overall height. There was a negligible deviation in overall height and each coil width compared to the design table. However, the inspection results showed a significant deviation in the average of each SP’s conductor thickness, calculated by dividing the radial build by the number of turns. Through further research, we confirmed that the deviation of conductor thickness could be attributed to the flattening progress of the copper surface by accumulating radial compressive force during the coil winding and elastic deformation by uniaxial longitudinal winding tension32.
Table 2.
Measured dimensions of inner diameter (ID), outer diameter (OD), and the number of turns (Turn) of all the SPs in the KBSI 400 MHz 9.4 T all-REBCO NMR magnet. Units for ID and OD are in millimeters.
| SP1 | SP2 | SP3 | SP4 | SP5 | SP6 | SP7 | SP8 | SP9 | SP10 | SP11 | SP12 | SP13 | SP14 | SP15 | SP16 | |
|---|---|---|---|---|---|---|---|---|---|---|---|---|---|---|---|---|
| ID | 50.0 | 50.0 | 50.0 | 50.0 | 50.0 | 50.0 | 51.0 | 50.0 | 50.0 | 50.0 | 50.0 | 50.0 | 50.0 | 50.0 | 50.0 | 50.0 |
| OD | 73.0 | 72.8 | 72.9 | 72.8 | 73.2 | 73.1 | 72.8 | 73.2 | 72.8 | 72.8 | 73.3 | 73.4 | 72.6 | 72.6 | 72.8 | 72.8 |
| Turn | 195 | 195 | 195 | 195 | 195 | 195 | 195 | 195 | 195 | 195 | 195 | 195 | 195 | 195 | 195 | 195 |
| SP17 | SP18 | SP19 | SP20 | SP21 | SP22 | SP23 | SP24 | SP25 | SP26 | SP27 | SP28 | SP29 | SP30 | SP31 | SP32 | |
|---|---|---|---|---|---|---|---|---|---|---|---|---|---|---|---|---|
| ID | 50.0 | 50.0 | 50.0 | 50.0 | 50.0 | 50.0 | 51.9 | 51.9 | 51.9 | 51.9 | 50.0 | 50.0 | 50.5 | 50.5 | 50.5 | 50.5 |
| OD | 73.0 | 72.8 | 72.9 | 72.8 | 73.2 | 73.1 | 72.8 | 73.2 | 72.8 | 72.8 | 73.3 | 73.4 | 72.6 | 72.6 | 72.8 | 72.8 |
| Turn | 195 | 195 | 195 | 195 | 195 | 195 | 179 | 179 | 179 | 179 | 195 | 195 | 191 | 191 | 191 | 191 |
| SP33 | SP34 | SP35 | SP36 | SP37 | SP38 | SP39 | SP40 | SP41 | SP42 | SP43 | SP44 | SP45 | SP46 | SP47 | SP48 | |
|---|---|---|---|---|---|---|---|---|---|---|---|---|---|---|---|---|
| ID | 50.0 | 50.0 | 50.5 | 50.5 | 50.5 | 50.5 | 50.0 | 50.0 | 51.7 | 51.7 | 51.7 | 51.7 | 50.0 | 50.0 | 51.4 | 51.4 |
| OD | 73.0 | 72.8 | 72.9 | 72.8 | 73.2 | 73.1 | 72.8 | 73.2 | 72.8 | 72.8 | 73.3 | 73.4 | 72.6 | 72.6 | 72.8 | 72.8 |
| Turn | 195 | 195 | 191 | 191 | 191 | 191 | 195 | 195 | 181 | 181 | 181 | 181 | 195 | 195 | 183 | 183 |
| SP49 | SP50 | SP51 | SP52 | SP53 | SP54 | SP55 | SP56 | SP57 | SP58 | SP59 | SP60 | SP61 | SP62 | SP63 | SP64 | |
|---|---|---|---|---|---|---|---|---|---|---|---|---|---|---|---|---|
| ID | 51.4 | 51.4 | 50.0 | 50.0 | 51.7 | 51.7 | 51.7 | 51.7 | 50.0 | 50.0 | 50.5 | 50.5 | 50.5 | 50.5 | 50.0 | 50.0 |
| OD | 73.0 | 72.8 | 72.9 | 72.8 | 73.2 | 73.1 | 72.8 | 73.2 | 72.8 | 72.8 | 73.3 | 73.4 | 72.6 | 72.6 | 72.8 | 72.8 |
| Turn | 183 | 183 | 195 | 195 | 181 | 181 | 181 | 181 | 195 | 195 | 191 | 191 | 191 | 191 | 195 | 195 |
| SP65 | SP66 | SP67 | SP68 | SP69 | SP70 | SP71 | SP72 | SP73 | SP74 | SP75 | SP76 | SP77 | SP78 | SP79 | SP80 | |
|---|---|---|---|---|---|---|---|---|---|---|---|---|---|---|---|---|
| ID | 50.5 | 50.5 | 50.5 | 50.5 | 50.0 | 50.0 | 51.9 | 51.9 | 51.9 | 51.9 | 50.0 | 50.0 | 50.0 | 50.0 | 50.0 | 50.0 |
| OD | 73.0 | 72.8 | 72.9 | 72.8 | 73.2 | 73.1 | 72.8 | 73.2 | 72.8 | 72.8 | 73.3 | 73.4 | 72.6 | 72.6 | 72.8 | 72.8 |
| Turn | 191 | 191 | 191 | 191 | 195 | 195 | 179 | 179 | 179 | 179 | 195 | 195 | 195 | 195 | 195 | 195 |
| SP81 | SP82 | SP83 | SP84 | SP85 | SP86 | SP87 | SP88 | SP89 | SP90 | SP91 | SP92 | SP93 | SP94 | SP95 | SP96 | |
|---|---|---|---|---|---|---|---|---|---|---|---|---|---|---|---|---|
| ID | 50.0 | 50.0 | 50.0 | 50.0 | 50.0 | 50.0 | 50.0 | 50.0 | 50.0 | 50.0 | 50.0 | 50.0 | 50.0 | 50.0 | 50.0 | 50.0 |
| OD | 73.0 | 72.8 | 72.9 | 72.8 | 73.2 | 73.1 | 72.8 | 73.2 | 72.8 | 72.8 | 73.3 | 73.4 | 72.6 | 72.6 | 72.8 | 72.8 |
| Turn | 195 | 195 | 195 | 195 | 195 | 195 | 195 | 195 | 195 | 195 | 195 | 195 | 195 | 195 | 195 | 195 |
Figure 2 summarizes the conductor thickness and 77 K outer joint resistance measurement results. Interestingly, despite a consistent procedure in fabricating outer joints, we confirmed the significant deviation in measured outer joint resistances. This observation led us to conclude that the stainless-steel cladding layer mitigates the NI charging delay issue but substantially hinders consistent outer joint fabrication, probably due to the non-uniform cladding state, thus causing significant deviation in the joint resistance even with a consistent joint fabrication process.
Figure 2.
Measurement results of (a) tape thickness, and (b) joint resistance between DP coils.
Test charge and real NMR operations
Figure 3 shows the test charge operation results of the 9.4 T 10 K conduction cooling experiment. This experiment was performed at SuNAM to evaluate the magnet in terms of the reliability of the operation without a magnet quench and the central field performance. We confirmed that the operating temperature was 10 K, the operating current charged up to its target current of 187.5 A (designed) to generate the target magnetic field of 9.4 T, and there was no magnet quench, finally leading to a decision to move the magnets from the construction site, SuNAM, to the installation site, KBSI. From this operation, we observed a 4 mV inductive voltage increase from 168 to 172 mV at the beginning of the magnet charge, referring to the measured magnet voltage during the selected time section between 0 and 2.5 h in Fig. 3. No resistive voltage increase appeared, so we concluded that screening current-induced voltage (SCV), attributed to time-varying SCF, caused the voltage change.
Figure 3.
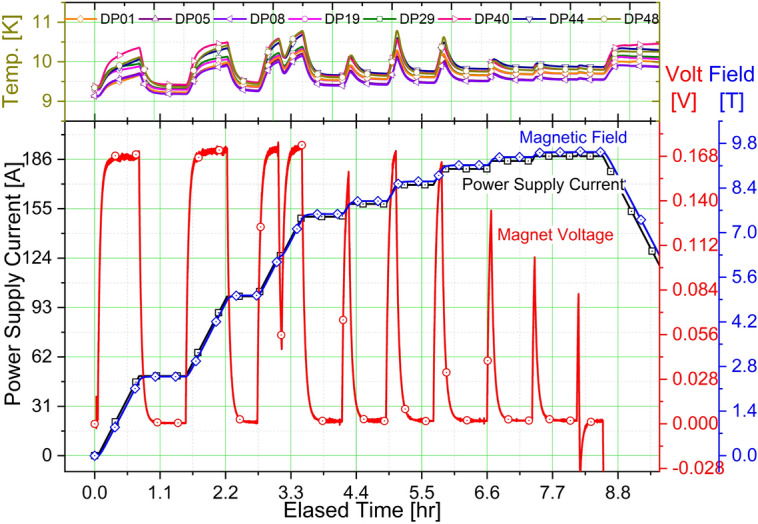
A 9.4 T 10 K conduction cooling test charge results: temperatures, magnet voltage, and the central field.
A 9.4 T-test charge operation was also conducted at KBSI. We confirmed negligible changes in voltages, temperatures, and the central field before (SuNAM) and after (KBSI) the magnet installation. Therefore, we decided to integrate the magnet into an NMR system. It should be noted here that we could not have measured temperatures, two-DP pair voltages, and the central magnetic field after the integration. An 88-channel data acquisition system collected the measurement results of two-DP pair voltages, temperatures, and magnetic fields during the test charges. However, after being integrated, most channels were replaced with an 8-channel real-time active shimming device, field-locking system, and other required systems to obtain NMR signals. Instead, during the NMR operation, we measured the magnet current and voltage, which were measured from a Danfysik power supply’s terminals, and a field distribution in the room-temperature bore of the magnet using a field mapper.
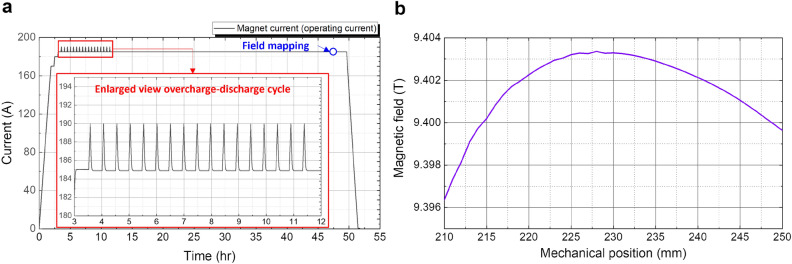
Figure 4 shows the 400 MHz NMR operation results. The overcharge-discharge cycle, a sort of the current sweep reversal technique33, was applied several times to mitigate screening current and, correspondingly, SCF. The peak current for the overcharge-discharge cycle operation was set to be 190 A, while the nominal operating current was 185 A. This experimental setup was an empirically optimized magnet operation protocol based on our previous work23. Note that there was a 2.5 A (from 187.5 to 185 A) difference in the magnet current between the 9.4-T test charge and 400 MHz NMR operations. The difference was attributed to a discrepancy between 9.4 T (designed) and the required magnetic field corresponding to 400 MHz 1H resonant frequency. We determined to proceed with the field mapping only once after >30 h, which was set to be more than a hundred times the magnet time constant, has passed from the end of the overcharge-discharge cycles, considering the NI leak current releasing and temporal magnetic field varying induced by screening current relaxation. The field mapper measured axial magnetic fields along the magnet axis every 1 mm from 210 to 250 mm in a relative coordinate, where 0 mm and 256 mm stand for the magnet’s bottom and center. In addition, the mapper was held at every designated position for a few seconds to avoid measurement error due to motor vibration.
Figure 4.
The 400 MHz 9.4 T 10 K NMR operation results: (a) an optimized charge protocol and (b) magnetic fields.
From the NMR operation, we confirmed that the magnetic field center was changed by about 28 mm, compared with the location at the design stage: the designed center was 256 mm, but the measured center was 228 mm. In addition, the field uniformity was degraded by over 123 ppm compared with the designed uniformity ( ppm) near the field center. One intriguing observation was odd-order harmonic coefficients in representing the measured field. If there is no asymmetricity in the geometric dimensions of every coil during the magnet construction, then screening current can only cause even-order harmonic coefficients34. This question led us to analyze the effect of screening current and inconsistent conductor thickness on harmonic errors through numerical simulations based on our measurement results.
Screening current simulation for current densities, fields, and inductances
From the test charge and NMR operations, we discussed inductive voltage change by SCV and harmonic errors by SCF. We have endeavored to develop a multiphysics simulation model to reproduce measured results precisely34–39. Our model combines the circuit analysis and H-formulation-based finite element method (FEM) models to simulate magnetic fields and voltages simultaneously. In addition, the model also combines harmonic analysis, which is a post-processing work that uses the simulated results of current density. The following simulation works will validate our simulation method in reproducing measured SCV and SCF and discuss harmonic errors. Some details were described in the “Methods” section.
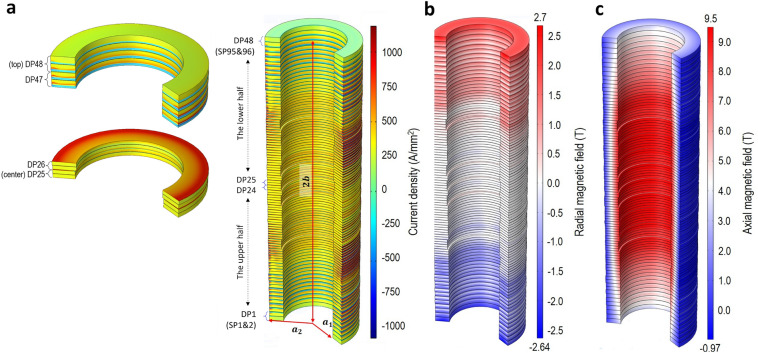
Figure 5 presents the simulation results of current density and magnetic fields in the magnet current of 190 A. A FEM simulation approach with edge-element for H-formulation and domain homogenization was selected, which has been validated at the NMR magnet level by our previous studies of the 3 T NMR Demo magnet35. In addition, we also considered measurement results of information, geometric dimensions, multiple overcharge-discharge cycles, and temperatures. The power-law model for the electromagnetic E–J constitutive law was assigned as a material property. However, the index n-value is set to be a constant value of 30, considering the strong pinning force at low temperatures and the corresponding marginal variation.
Figure 5.
Simulation results of: (a) current density; (b) radial magnetic field; and (c) axial magnetic field.
In this screening current simulation, the circuit model with variable inductance38,39 was used to calculate the azimuthal current of each SP for the current constraint for the H-formulation model. We assumed that the magnet was charged from 0 to 190 A with a constant ramp rate of 20 mA/s as provided in Figs. 3, 4. Figure 6 shows the simulation result of the variable inductance of each two-DP pair, calculated every 10 A from 10 to 190 A, where total inductance means the sum of self and mutual inductances. In addition, this figure compares the total inductance of each two-DP pair with and without consideration of screening current while emphasizing the screening current effect on SCV related to the time derivative of SCF.
Figure 6.
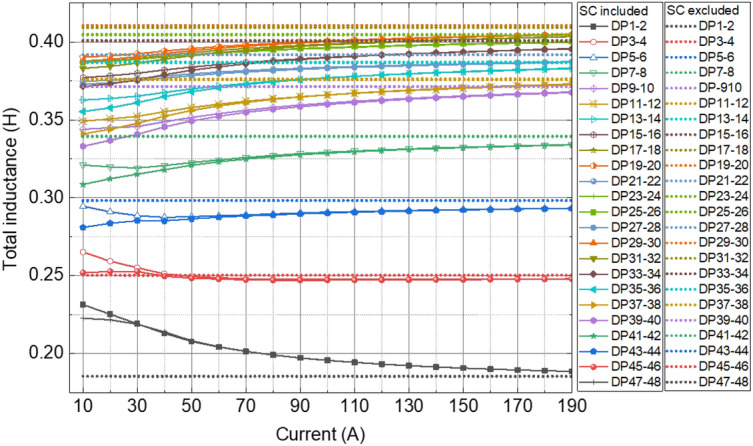
Calculation results of screening current-dependent inductance variation. Total inductance means the sum of self and mutual inductances. Screening current causes SCF changing time-derivative of flux linkage in every DP and generating SCV.
From this simulation, we confirmed notable non-uniformity of current density in the top and bottom DPs and better uniformity in the central ones, as shown in Fig. 5a. This observation leads to a correlation between non-uniformity and inductance change. There is notable inductance variation at the top and bottom two-DP pairs, while the variation becomes smaller toward the central pairs. We also confirmed that the magnet inductance continuously increases depending on the magnet current from 8.1 to 8.3 H, consistent with the observed inductive voltage increase of 4 mV (0.2 H 20 mA/s). This simulation demonstrates that the “macroscopic” inductance of a magnet increases, a consistent observation with the superconductor nature that the magnetic storage energy per unit current increases as the transport current increases. However, the “microscopic” inductance of a coil seemingly depends on the non-uniformity of current density related to adjacent coils.
Comparison of SCV and SCF between simulation and measurement
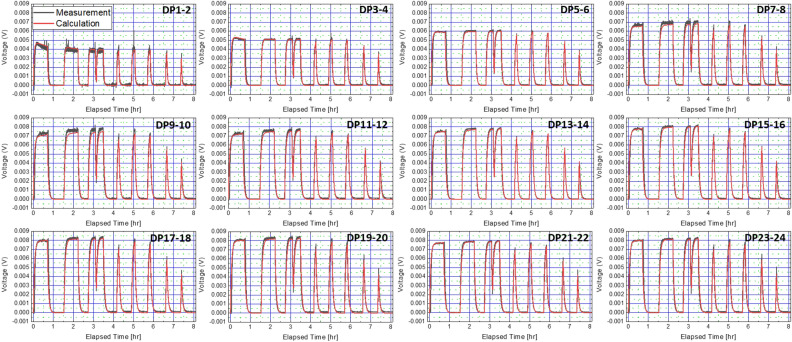
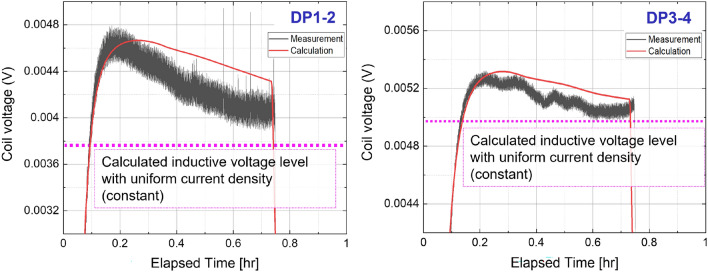
Our simulation model was used to analyze measured SCV related to the measured inductive voltage change shown in Fig. 3. Figure 7 compares simulated and measured two-DP pair (hereafter ‘module coil’) voltages in the selected lower half of the magnet in consideration of the symmetric configuration showing, though not perfect, reasonable conformity. This comparison concludes a good agreement between simulation and measurement, leading to a validation that the simulation approach is able to reproduce screening current and its collateral effect, i.e., SCF and SCV, despite indirect comparison for SCF. Figure 8 presents an enlarged view of selected module coil voltages to show the notable inductive voltage variation near the bottom of the 9.4 T magnet, further complementing that the validation is probably reasonable. As predicted from the calculation results of the inductance variation shown in Fig. 6, significant inductive voltage variation is confirmed at the bottom module coils, DP1–2 and DP3–4, where the radial field intensity is higher than that of other module coils and, accordingly, where the induction of screening current is comparably high. Note that, in the coil voltage simulation, the variable inductance depending on the magnet current provided in Fig. 3 was first calculated using the so-called energy method, where screening current and its relaxation were taken into account. Then, the results were used in a lumped circuit simulation considering 24 module coils and their electric components, e.g., inductances and contact resistances.
Figure 7.
Comparison results of module coil voltages in the lower half of the 9.4 T REBCO NMR magnet.
Figure 8.
Enlarged view of selected module coil voltages. Uniform current density means excluding screening current.
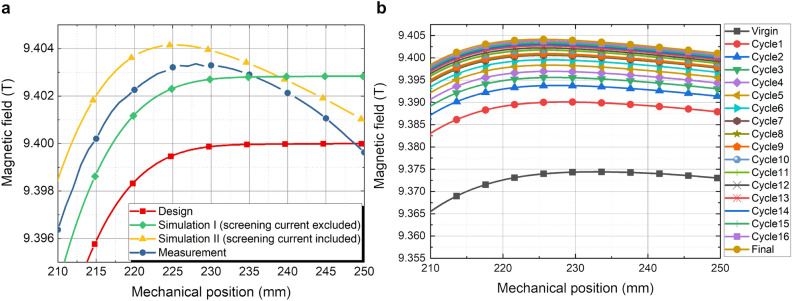
Our simulation model was also used to analyze measured SCF related to the measured spatial magnetic fields shown in Fig. 4. Figure 9 shows (a) a comparison between measurement and simulation results and evaluates (b) the overcharge-discharge cycle effect on spatial magnetic fields. The simulation results evaluate the effects of screening current and inconsistent conductor thickness on the magnetic field distribution and field uniformity mitigation. Therefore, we concluded that the two factors must be considered to analyze the magnetic field of a REBCO magnet precisely for NMR applications.
Figure 9.
(a) Comparison results between simulation and measurement at the time when the overcharge-discharge cycles are terminated and (b) simulation results of spatial field variation depending on the number of overcharge-discharge cycles.
In detail, Fig. 9a compares simulation and measurement results of magnetic fields in the selected range along the magnet axis, emphasizing the difference between the designed (Design), measured (Measurement), and simulated (Simulation I and II) field distribution. Note that Simulation I considers measured conductor thickness only, while Simulation II considers measured conductor thickness and screening current. We confirmed that the difference in the peak magnitude of the field intensity between Simulation II and Measurement is 2 mT, where the error is hundreds ppm level. The simulated field uniformity is 107 ppm within a 1 cm diameter spherical volume at the target field center (z = 228 mm), and the measured one is 123 ppm from the field mapping. This simulation study supplements the direct comparison for spatial magnetic fields, thus complementing the validity of our simulation model in reproducing not only SCV but also SCF.
Figure 9b illustrates the time-dependent response of the spatial magnetic field according to the number of overcharge-discharge cycles. In this figure, Virgin, Cycle, and Final present the simulation results when: (1) the magnet was charged up to 185 A first; (2) each overcharge-discharge cycle was applied; and (3) the field mapping proceeded. We have confirmed that the magnetic field intensity and uniformity are mitigated as the overcharge-discharge cycle suppresses screening currents in the REBCO NMR magnet. In addition, it has also been confirmed that the simulated result of the location change of the target field center is consistent with the measurement at the final state. The in silico study of the FEM simulation reproducing the selected electromagnetic behaviors of the 9.4 T NMR magnet enabled us to conduct zonal harmonic coefficient analysis, leading to further discussion that overcharge-discharge cycles only suppressing screening current mainly mitigates even-order harmonic coefficients and marginally odd-order ones in harmonic errors.
Discussion on the effect of overcharge-discharge cycles on harmonic errors
Table 3 further analyzes the spatial and temporal variation of magnetic fields with harmonic coefficients, while Fig. 10 visualizes the overcharge-discharge cycle’s effect on harmonic coefficient improvement provided in the table. Each zonal harmonic coefficient is calculated with the segmentation method proposed and validated by our previous study34. This analysis clarifies that overcharge-discharge cycles effectively improve the even-order harmonic coefficients but marginally on the odd-order ones. For instance, , , and are notably changed up to 100% compared to their peak value, while , , and are marginally changed less than 5%. marginally varies because it mainly depends on the total sum of currents in the magnet rather than SCF. One intriguing observation is that the overcharge-discharge cycle’s effect exponentially decreases according to the number of cycles (). The sum of two exponential functions was used to express each coefficient, calculating the convergence value: 9.400, 2.009, – 1.792, 8.321, 2.221, 8.292, -3.024 for – in Table 3:
| 1 |
Table 3.
Zonal harmonic coefficients up to the sixth order.
| The nth order zonal harmonic coefficients: [T/mn] | |||||||
|---|---|---|---|---|---|---|---|
| Coeff. | |||||||
| Expo. | |||||||
| Virgin | 9.372 | 1.997 | − 4.401 | 8.206 | 0.2204 | 8.689 | 2.594 |
| Cycle1 | 9.387 | 2.003 | − 3.028 | 8.248 | 0.7946 | 8.495 | 0.1853 |
| Cycle2 | 9.390 | 2.001 | − 2.721 | 8.263 | 1.063 | 8.452 | − 0.5120 |
| Cycle3 | 9.392 | 2.006 | − 2.543 | 8.272 | 1.241 | 8.425 | − 0.9461 |
| Cycle4 | 9.393 | 2.006 | − 2.434 | 8.279 | 1.362 | 8.408 | − 1.226 |
| Cycle5 | 9.395 | 2.007 | − 2.326 | 8.285 | 1.483 | 8.391 | − 1.505 |
| Cycle6 | 9.396 | 2.007 | − 2.250 | 8.290 | 1.573 | 8.378 | − 1.706 |
| Cycle7 | 9.397 | 2.007 | − 2.188 | 8.295 | 1.651 | 8.398 | − 1.876 |
| Cycle8 | 9.397 | 2.007 | − 2.135 | 8.298 | 1.717 | 8.359 | − 2.018 |
| Cycle9 | 9.397 | 2.008 | − 2.081 | 8.301 | 1.782 | 8.349 | − 2.161 |
| Cycle10 | 9.398 | 2.008 | − 2.039 | 8.304 | 1.838 | 8.342 | − 2.279 |
| Cycle11 | 9.398 | 2.008 | − 1.999 | 8.306 | 1.889 | 8.334 | − 2.389 |
| Cycle12 | 9.398 | 2.008 | − 1.965 | 8.309 | 1.934 | 8.328 | − 2.485 |
| Cycle13 | 9.399 | 2.009 | − 1.931 | 8.311 | 1.979 | 8.321 | − 2.581 |
| Cycle14 | 9.399 | 2.009 | − 1.901 | 8.314 | 2.020 | 8.316 | − 2.666 |
| Cycle15 | 9.399 | 2.009 | − 1.894 | 8.314 | 2.032 | 8.315 | − 2.689 |
| Cycle16 | 9.400 | 2.009 | − 1.885 | 8.315 | 2.044 | 8.313 | − 2.716 |
| Final | 9.400 | 2.009 | − 1.877 | 8.316 | 2.058 | 8.312 | − 2.742 |
Figure 10.
Visualization of spatial and temporal field behavior with zonal harmonic coefficients.
Meanwhile, we evaluated the overcharge-discharge effect on even-order and odd-order harmonic coefficients using the exponential function and the convergence value of each harmonic coefficient. The overcharge-discharge cycle can only mitigate screening current, validating the correlation between substantial screening current mitigation and even-order harmonic coefficient variation. On the other hand, the simulation result demonstrates that the odd-order coefficients barely vary by screening-current mitigation. This result lead us to conclude that odd-order harmonic coefficients are attributed to inconsistent conductor thickness rather than screening current since we considered the effect of only two factors, screening current and inconsistent conductor, on harmonic errors in this simulation work. Additionally, we could have deduced that the overcharge-discharge technique is limited in addressing the field uniformity degradation issue at the sub-ppm level unless the conductor manufacturing tolerance converges to zero. Here, our findings suggest threefold. A design approach considering the screening current effect on harmonic errors must be addressed for a REBCO NMR magnet, even though a series of shimming techniques can mitigate 100 ppm level field uniformity. In addition, research endeavors to improve manufacturing tolerance, e.g., conductor thickness, are needed. Finally, the geometric errors should be examined at the purchase phase so that designers can consider them in the stand-alone NMR REBCO magnet design to avoid unnecessary odd-order errors.
Lastly, we would like to discuss potential determinants of odd-order harmonic coefficients and options to alleviate this issue. Besides inconsistent conductor thickness, there are many influencing factors: cross-over innermost turn in every DP, outer joints, temperature distribution, axial and radial displacements of conductors, uneven critical current density, and others. However, if we assume to use ideal conductors, it would be predicted that odd-order harmonic coefficients barely appear since we always carefully consider symmetricity in the design and construction, except for some inevitable asymetricities, e.g., uneven critical current density across the width in conductors and cryogenic non-uniformity. This prediction concludes inevitable “asymmetric” quantities might be attributed to unnecessary odd-order harmonic coefficients. In this aspect, the layer-winding approach using a single conductor may have some advantages in maintaining a symmetrical structure compared to the double-pancake winding approach using multiple conductors, leading to the option of using a layer-wound REBCO magnet for NMR research40. In addition, a liquid helium cooling approach with a recondensing system may also be a practical option to address cryogenic non-uniformity. Meanwhile, using heaters would be an option to alleviate screening current and, thus, even-order harmonics.
In conclusion, we have investigated the detrimental effects of screening current and inconsistent REBCO-coated conductor thickness on degrading magnetic field uniformity. This work confirmed that overcharge-discharge cycles suppressed screening current, which caused a significant variation of even-order harmonics. Indeed, as the number of applied overcharge-discharge cycles increased, they changed to converge to specific values. However, the values were still inconsistent with the designated ones at the design stage. In addition, it was confirmed that the odd-order harmonics resulted from the manufacturing error, i.e., undesirable inconsistency of REBCO-coated conductor thickness. Hence, they were not notably manipulated in any operational manner. These findings suggest that it is barely possible to create a highly uniform field distribution at the sub-ppm level with a current stand-alone REBCO magnet design technology by the magnet itself. Based on this work, we can note why a GHz-level NMR magnet has difficulties developing by utilizing a stand-alone REBCO magnet, even though it can create higher fields than its low-temperature superconductor (LTS) counterparts. Indeed, all the reported GHz-level NMR magnets are composed of an LTS main magnet to generate most of the magnetic field intensity and an HTS insert magnet to generate the rest of the field intensity up to a target field. However, we believe it would be possible to develop a stand-alone REBCO magnet for GHz-level NMR research if the conductor manufacturing process is improved to produce consistent conductor thickness41, SCF is considered in the magnet design42–44, and optimal operation techniques exist.
Methods
Critical current parameterization
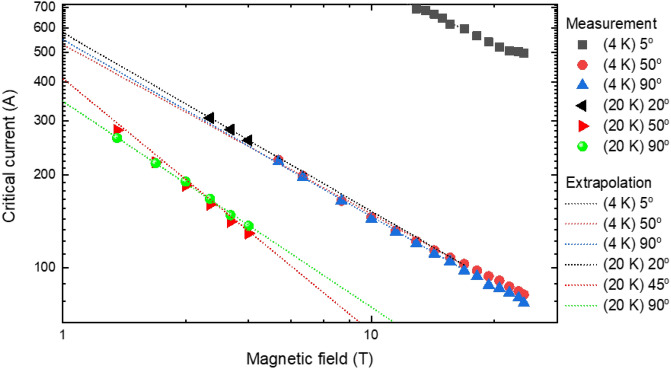
Figure 11 shows the field and temperature-dependent critical current information of a sample of used REBCO conductors measured at selected magnetic fields, magnetic field angles, and temperatures, where the field angle of 90 corresponds to the direction parallel to the REBCO c-axis. Based on the data, interpolation, extrapolation, and curve fitting techniques are incorporated to supplement insufficient the field and temperature-dependent critical current information. Three steps complete the parameterization work. First, to be replete with the angle dependency information from the measured results, Fourier seires analysis is used to reconstruct considering symmetricity against the field angle of the anisotropic , e.g., .
| 2 |
where n, , stand for an interger to index the harmonics, the number of measured points, and the Fourier expansion coefficient. Next, the following equation formulate the field dependency of the conductor at each temperature:
| 3 |
where and are the fitting coefficients depending on the field angle, evaluated from the measurement result at each angle. Last, the temperature dependency is interpolated using two selected temperatures, and :
| 4 |
Note that an iterative process is adopted to find all the coefficients in a numerical way that minimizes the difference between measured and reconstructed results.
Figure 11.
Measurement results of the field and temperature dependent critical current of a selected conductor.
Screening current calculation
The governing equations45 of a 2D axisymmetric FEM simulation for an NI REBCO solenoid coil are described with Faraday’s law and Ampére’s circuital law in a cylindrical coordinate (r,,z),:
| 5 |
where , , , and are radial magnetic field, axial magnetic field, azimuthal electric field, azimuthal current density, and the conductivity. Note that is the non-linear conductivity of REBCO tape varying by electric field, commonly modeled by the power law relationship46 assuming a homogeneous medium47:
| 6 |
where B, , , , and are magnetic field intensity, magnetic field angle, critical electric field (usually assigned with 1 µV/cm), field-dependent critical current density, and field-dependent index value for the law39. In addition, the continuity equation should be always satisfied:
| 7 |
where and are the operating current and conductor thickness. The well-known H-formulation approach implements (4)–(6) in a FEM simulation program, thus calculating screening current: (4) a governing equation, (5) a material property, and (6) a weak constraint. Note that this simulation does not consider the transverse current along the turn-to-turn contact. Fortunately, the 9.4 T all-REBCO NMR magnet has negligible transverse current, mainly due to the extremely slow ramp rate of 20 mA/s, though NI configuration, so this simulation approach is still available.
Harmonics calculation
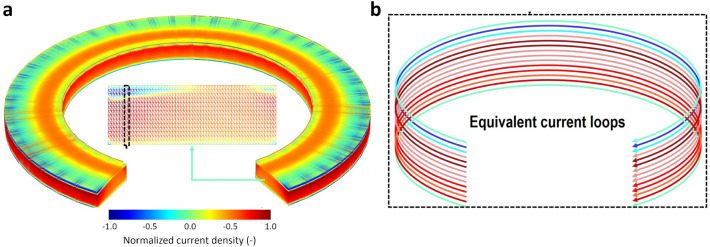
The classical harmonic analysis assuming uniform current density in a solenoid magnet48 is unavailable in the 9.4 T all-REBCO NMR magnet analysis due to non-uniform distribution by screening current. Thus, we have reported and validated a numerical method to calculate zonal harmonic coefficients34. Therefore, in this paper, we briefly introduce the approach named the segmentation method and its key principle. Basically, it is a post-processing calculation that uses the screening current simulation results, consisting of three steps: first, transforming current densities of screening current simulation results into equivalent current loops; second, calculating spatial harmonic coefficients induced by current loops using analytic formulae of harmonic expansion of current loop’s magnetic field; and last, superposing all the harmonic coefficients of all the current loops. Figure 12 illustrates the key principle of non-uniform current density transformation into ideal current loops, and the following equations formulate the calculation of zonal harmonic coefficients of a solenoid magnet with non-uniform current density
| 8 |
is the equivalent current of the Nth element in the FEM simulation, where there are nodes in each finite element. is the ith nodal value of the Nth element where is corresponding area for of the Nth element (technically dividing the element area evenly by finding the center of mass). r, , , , , , Zn are, respectively, position vector in spherical coordinate, associated Legendre polynomial of degree n and order m, permeability of free space, magnitude of loop current, radius of the loop current , polar angle of the field-mapping point, and the nth order zonal harmonic coefficient. and are the total number of finite elements and the corresponding magnetic fields expressed with harmonics.
Figure 12.
Conceptual drawings for the transformation process from (a) non-uniform current densities into (b) loop currents.
Inductance calculation
The conventional methods of self and mutual inductances calculation, i.e., the direct integration of Neumann formulae or magnetic vector potential assuming the uniform current density system49–51, cannot calculate inductance variation by screening current. Hence, we proposed a numerical calculation method using the finite element method (FEM) simulation approach based on the so-called energy method in our previous paper38. The following equations ilustrate the proposed method:
| 9 |
where , and are the stored magnetic energy, induced magnetic fields by two coils when the operating current I flows in the coils at time t. We should note here that all the field quantities, e.g., in a cylindrical coordinate, are already defined in FEM simulation software as primary variables. In addition, numerical integral operators are also provided in simulation software without any additional user-defined operator. However, inner product operations must be performed carefully and organized by multiplying the same coordinate variables, e.g., in a cylindrical coordinate.
| 10 |
L, M, , and I present, respectively, self-inductance, mutual-inductance, flux linkage, and current in coils. The subscripts indicate which coils are the sources of magnetic flux or flux linkage. is the current increment corresponding to the time increment (). With these equations, the self-inductance of each coil and mutual inductances can be calculated at every time step of the screening current simulation results, leading to a lumped circuit simulation to reproduce measured coil voltages.
Acknowledgements
This work was supported by a KBSI grant (D39611). This work was also supported in part by the National Research Foundation of Korea through National R&D Program funded by the Ministry of Science and ICT under Grant 2022M3I9A1073924, and in part by the BK21 FOUR program of the Education and Research Program for Future ICT Pioneers, Seoul National University in 2024.
Author contributions
J.K. and S.H. supervised the work and the writing; J.B. and S.H. conceived the idea and performed the NMR magnet modeling and screening current analysis; J.B. and J.T.L participated in writing the manuscript; Y.K., M.K., H.L. contributed to the coil construction, instrumentation, and preliminary tests; K.K. contributed to Hall sensor calibration and critical current measurement; J.Y.J. and Y.J.H. performed NMR test and contributed to obtaining NMR signal at KBSI; M.C.A. and H.Y. contributed to design and fabricate multiple-cylinders structure of ferro-shimming; S.I., Y-J. H., and H.Y. designed and constructed cryostat and low-vibration mechanical support; SG.L. supervised the NMR magnet development project.
Data availability
The data that support the findings of this study are available from the corresponding author upon reasonable request.
Competing interests
The authors declare no competing interests.
Footnotes
The original online version of this Article was revised: The Acknowledgements section in the original version of this Article was incomplete. Full information regarding the correction made can be found in the correction for this Article.
Publisher's note
Springer Nature remains neutral with regard to jurisdictional claims in published maps and institutional affiliations.
Change history
10/15/2024
A Correction to this paper has been published: 10.1038/s41598-024-75403-3
Contributor Information
Jaemin Kim, Email: jmkim.snu@snu.ac.kr.
Seungyong Hahn, Email: hahnsy@snu.ac.kr.
References
- 1.Hahn, S., Park, D. K., Bascunan, J. & Iwasa, Y. HTS pancake coils without turn-to-turn insulation. IEEE Trans. Appl. Supercond.21, 1592–1595 (2010). [DOI] [PMC free article] [PubMed] [Google Scholar]
- 2.Hahn, S. et al. 45.5-tesla direct-current magnetic field generated with a high-temperature superconducting magnet. Nature570, 496–499 (2019). [DOI] [PubMed] [Google Scholar]
- 3.Liu, J. et al. World record 32.35 tesla direct-current magnetic field generated with an all-superconducting magnet. Supercond. Sci. Technol.33, 03LT01 (2020). [Google Scholar]
- 4.Fazilleau, P., Chaud, X., Debray, F., Lécrevisse, T. & Song, J.-B. 38 mm diameter cold bore metal-as-insulation HTS insert reached 32.5 T in a background magnetic field generated by resistive magnet. Cryogenics106, 103053 (2020). [Google Scholar]
- 5.Suetomi, Y. et al. Quench and self-protecting behaviour of an intra-layer no-insulation (LNI) REBCO coil at 31.4 T. Supercond. Sci. Technol.34, 064003 (2021). [Google Scholar]
- 6.Weijers, H. W. et al. Progress in the development and construction of a 32-T superconducting magnet. IEEE Trans. Appl. Supercond.26, 4300807 (2016). [Google Scholar]
- 7.Hashi, K. et al. Achievement of 1020 MHz NMR. J. Mag. Reson.256, 30–33 (2015). [DOI] [PubMed] [Google Scholar]
- 8.Awaji, S. et al. First performance test of a 25 T cryogen-free superconducting magnet. Supercond. Sci. Technol.30, 065001 (2017). [Google Scholar]
- 9.Wikus, P., Frantz, W., Kümmerle, R. & Vonlanthen, P. Commercial gigahertz-class NMR magnets. Supercond. Sci. Technol.35, 033001 (2022). [Google Scholar]
- 10.Bascuñán, J., Hahn, S., Park, D. K. & Iwasa, Y. A 1.3-GHz LTS/HTS NMR magnet—a progress report. IEEE Trans. Appl. Supercond.21, 2092–2095 (2010). [DOI] [PMC free article] [PubMed] [Google Scholar]
- 11.Roth, G. Ultra-high field magnets at Bruker. In UHF Workshop at NIH, vol. 11 (2015).
- 12.Boulant, N. & Quettier, L. Commissioning of the Iseult CEA 11.7 T whole-body MRI: Current status, gradient-magnet interaction tests and first imaging experience. Magn. Reson. Mater. Phys. Biol. Med.2023, 1–15 (2023). [DOI] [PMC free article] [PubMed] [Google Scholar]
- 13.MacManus-Driscoll, J. L. & Wimbush, S. C. Processing and application of high-temperature superconducting coated conductors. Nat. Rev. Mater.6, 587–604 (2021). [Google Scholar]
- 14.Zhou, Y.-H., Park, D. & Iwasa, Y. Review of progress and challenges of key mechanical issues in high-field superconducting magnets. Natl. Sci. Rev.10, nwad001 (2023). [DOI] [PMC free article] [PubMed] [Google Scholar]
- 15.Molodyk, A. & Larbalestier, D. C. The prospects of high-temperature superconductors. Science380, 1220–1222 (2023). [DOI] [PubMed] [Google Scholar]
- 16.Kim, K. L. et al. 400-MHz/60-mm All-REBCO nuclear magnetic resonance magnet: Magnet design. IEEE Trans. Appl. Supercond.26, 4302604 (2016). [Google Scholar]
- 17.Hwang, Y., Jang, J., Ahn, M., Park, Y. & Lee, S. Feasibility study for reduction of the screening current induced field in a 2G high temperature superconducting coil. Supercond. Sci. Technol.29, 105008 (2016). [Google Scholar]
- 18.Hwang, Y. J. et al. A study on mitigation of screening current induced field with a 3-T 100-mm conduction-cooled metallic cladding REBCO magnet. IEEE Trans. Appl. Supercond.27, 4701605 (2016). [Google Scholar]
- 19.In, S. et al. Experimental study on a conduction cooling system for an HTS NMR magnet. IEEE Trans. Appl. Supercond.27, 4602605 (2017). [Google Scholar]
- 20.Jang, J. Y. et al. Design, construction and 13 K conduction-cooled operation of a 3 T 100 mm stainless steel cladding all-REBCO magnet. Supercond. Sci. Technol.30, 105012 (2017). [Google Scholar]
- 21.Hwang, Y. J., Jang, J. Y., Lee, S., Lee, J. & Lee, W. S. Experimental study of the effect of the current sweep cycle on the magnetic field stability of a REBCO coil. Cryogenics89, 163–167 (2018). [Google Scholar]
- 22.Kim, J. et al. Effect of resistive metal cladding of HTS tape on the characteristic of no-insulation coil. IEEE Trans. Appl. Supercond.26, 4601906 (2016). [Google Scholar]
- 23.Jang, J. Y. et al. Reproducibility of the field homogeneity of a metal-clad no-insulation all-REBCO magnet with a multi-layer ferromagnetic shim. Supercond. Sci. Technol.33, 025005 (2020). [Google Scholar]
- 24.Lee, S. et al.Development Progress of Metal-Clad No-Insulation All-REBCO Magnet for 400 MHz High Resolution NMR (MEM18 (Andong, 2018).
- 25.Li, Y. et al. Magnetization and screening current in 800 MHz (18.8 T) an REBCO nuclear magnetic resonance insert magnet: Experimental results and numerical analysis. Supercond. Sci. Technol.32, 105007 (2019). [Google Scholar]
- 26.Bortot, L. et al. Numerical analysis of the screening current-induced magnetic field in the hts insert dipole magnet feather-m2. 1-2. Supercond. Sci. Technol.33, 125008 (2020). [Google Scholar]
- 27.Hahn, S. et al. A 78-mm/7-T multi-width no-insulation ReBCO magnet: Key concept and magnet design. IEEE Trans. Appl. Supercond.24, 4602705 (2013). [Google Scholar]
- 28.Bascuñán, J., Hahn, S., Kim, Y., Song, J. & Iwasa, Y. 18.8-T/90-mm AllGdBCO insert for a 1.3 GHz LTS/HTS NMR magnet: Design and double pancake coil fabrication. IEEE Trans. Appl. Supercond.24, 4300904 (2014). [DOI] [PMC free article] [PubMed] [Google Scholar]
- 29.Iwasa, Y. et al. A high-resolution 1.3-GHz/54-mm LTS/HTS NMR magnet. IEEE Trans. Appl. Supercond.25, 4301205 (2015). [DOI] [PMC free article] [PubMed] [Google Scholar]
- 30.Bascuñán, J., Michael, P., Hahn, S., Lecrevisse, T. & Iwasa, Y. Construction and test results of coil 2 of a three-coil 800-MHz REBCO insert for the 13-GHz high-resolution NMR magnet. IEEE Trans. Appl. Supercond.27, 4300504 (2017). [DOI] [PMC free article] [PubMed] [Google Scholar]
- 31.Iwasa, Y. et al. A high-resolution 1.3-ghz/54-mm lts/hts nmr magnet. IEEE Trans. Appl. Supercond.25, 4301205 (2014). [DOI] [PMC free article] [PubMed] [Google Scholar]
- 32.Park, J., Kim, J., Yan, Y. & Hahn, S. Diameter change of dry wound rebco solenoid pancake coil by winding tension. IEEE Trans. Appl. Supercond.34, 8400605 (2024). [Google Scholar]
- 33.Yanagisawa, Y. et al. Effect of coil current sweep cycle and temperature change cycle on the screening current-induced magnetic field for Ybco-coated conductor coils. Adv. Cryogenic Eng.57, 1372–1380 (2011). [Google Scholar]
- 34.Bang, J. et al. A numerical method to calculate spatial harmonic coefficients of magnetic fields generated by screening currents in an HTS magnet. IEEE Trans. Appl. Supercond.30, 4901405 (2020). [Google Scholar]
- 35.Bang, J. et al. Field measurement and analysis of a 3 T 66 mm no-insulation HTS NMR magnet with screening current and manufacturing uncertainty considered. IEEE Trans. Appl. Supercond.29, 4601305 (2019). [Google Scholar]
- 36.Bang, J. et al. A customized electric heater to mitigate screening current by optimal control on temperature distribution in a high-temperature superconductor coil. J. Appl. Phys.132, 183911 (2022). [Google Scholar]
- 37.Bang, J. et al. A real-time monitoring system for investigating electromagnetic behaviors of an HTS coil. IEEE Trans. Appl. Supercond.32, 9001505 (2022). [Google Scholar]
- 38.Bang, J., Park, J., Choi, K., Kim, G. & Hahn, S. A numerical method to calculate screening current-dependent self and mutual inductances of rebco coils. Supercond. Sci. Technol.36, 085003 (2023). [Google Scholar]
- 39.Bang, J. et al. The effect of field-dependent n-value on screening current, voltage, and magnetic field of REBCO coil. IEEE Trans. Appl. Supercond.34, 4902105 (2024). [Google Scholar]
- 40.Baburin, K. et al. Design, manufacturing and tests of an All-HTS 20 T magnet. IEEE Trans. Appl. Supercond.34, 4605604 (2024). [Google Scholar]
- 41.Wang, M. et al. A novel REBCO conductor design to reduce screening-current field in REBCO magnets. Phys. Scr.94, 105803 (2019). [Google Scholar]
- 42.Yan, Y., Li, Y. & Qu, T. Screening current induced magnetic field and stress in ultra-high-field magnets using REBCO coated conductors. Supercond. Sci. Technol.35, 014003 (2021). [Google Scholar]
- 43.Trillaud, F., Berrospe-Juarez, E., Zermeño, V. M. & Grilli, F. Electromagneto-mechanical model of high temperature superconductor insert magnets in ultra high magnetic fields. Supercond. Sci. Technol.35, 054002 (2022). [Google Scholar]
- 44.Shao, L. et al. Numerical analysis of screening-current induced strain in a 16 T REBCO insert magnet within a 20 T background field. IEEE Access11, 115392–115402 (2023). [Google Scholar]
- 45.Brambilla, R., Grilli, F. & Martini, L. Development of an edge-element model for AC loss computation of high-temperature superconductors. Supercond. Sci. Technol.20, 16–24 (2007). [Google Scholar]
- 46.Rhyner, J. Magnetic properties and AC-losses of superconductors with power-law current-voltage characteristics. Phys. C212, 292–300 (1993). [Google Scholar]
- 47.Zermeno, V. M. R., Abrahamsen, A. B., Mijatovic, N., Jensen, B. B. & Soerensen, M. P. Calculation of AC losses in stacks and coils made of second generation high temperature superconducting tapes for large scale applications. J. Appl. Phys.114, 173901 (2013). [Google Scholar]
- 48.Iwasa, Y. Case Studies in Superconducting Magnets: Design and Operational Issues (Springer Science & Business Media, 2009).
- 49.Rosa, E. B. & Grover, F. W. Formulas and Tables for the Calculation of Mutual and Self-Inductance 169 (US Government Printing Office, 1948).
- 50.Garrett, M. W. Calculation of fields, forces, and mutual inductances of current systems by elliptic integrals. J. Appl. Phys.34, 2567–2573 (1963). [Google Scholar]
- 51.Hoer, C. & Love, Y. Exact inductance equations for rectangular conductors with applications to more complicated geometries. J. Res. Nat. Bureau Standards-C. Eng. Instrum.69, 127–137 (1965). [Google Scholar]
Associated Data
This section collects any data citations, data availability statements, or supplementary materials included in this article.
Data Availability Statement
The data that support the findings of this study are available from the corresponding author upon reasonable request.


