

Abstract
Purpose
The cross-sectional area (CSA) of the cervical vagus nerve (VN), as assessed through ultrasonography, might be linked to autonomic nervous system dysfunction. Hypertension is the primary factor associated with cerebral white matter lesions (WMLs), but there is also evidence of a connection with autonomic nervous system dysfunction. However, the associations between WMLs and VN size are unclear. Our objective was to investigate the associations between WMLs and VN size in patients with vascular risk factors.
Methods
The CSA of the VN was evaluated using carotid ultrasonography in patients with a history of stroke (acute or chronic) and comorbidities (n = 196, 70.2 ± 12.7 years). Common carotid artery (CCA) intima-media thickness and interadventitial diameter (IAD) were also measured. The severity of the WMLs was assessed by the Fazekas classification and Scheltens’ scale.
Results
The CSA of the right VN (2.08 ± 0.65 mm2) was significantly greater than that of the CSA of the left VN (1.56 ± 0.44 mm2) (P < 0.001). Multiple linear regression analyses revealed that older age, hypertension, increased right CCA IAD, and decreased CSA of the right VN (standardized partial regression coefficient [β] − 0.226; P < 0.001) were independently associated with the severity of WMLs (Scheltens’ scale). A decreased CSA of the left VN was also associated with the severity of WMLs (β = − 0.239; P < 0.001).
Conclusion
VN size determined via ultrasonography was associated with the severity of WMLs. While these findings do not establish a causal relationship, they suggest that autonomic nervous system dysfunction is involved in the progression of WMLs.
Supplementary Information
The online version contains supplementary material available at 10.1007/s40477-024-00936-2.
Keywords: Vagus nerve size, White matter lesions, Ultrasonography, Hypertension
Introduction
The cervical vagus nerve (CVN) is typically located dorsomedially between the common or internal carotid artery and the internal jugular vein. The main component of CVN fibers is the parasympathetic nervous system, which modulates heart rate, respiratory rate, and gastrointestinal activity. CVN afferent fibers influence the nucleus tractus solitarius and the dorsal motor nucleus of the vagus nerve. Subsequently, these nuclei directly or indirectly project to various brain regions, including the locus coeruleus, dorsal raphe nucleus, amygdala, hippocampus, and cerebral cortex [1]. The VN plays various roles in transmitting bidirectional signals between the brain and peripheral organs via autonomic function, anti-inflammatory mechanisms, and regulation of blood–brain barrier permeability [2]. VN stimulation has been applied in the treatment of various central nervous system diseases, such as epilepsy, depression, anxiety, and migraine, and in the rehabilitation of stroke patients [2].
Recently, high-frequency ultrasonography has been utilized to evaluate CVN morphology noninvasively. Several studies have been conducted to verify the normal values of the cross-sectional area (CSA) of the CVN in healthy individuals [3]. Several cross-sectional studies found that a decreased CSA of the CVN was associated with a diagnosis or the progression of Parkinson’s disease [4, 5]. In addition, a decreased CSA of the CVN was also observed in patients with diabetes mellitus [6].
The common pathophysiology in both diabetes mellitus and Parkinson's disease is autonomic nervous system dysfunction. These patients sometimes suffer from symptoms of blood pressure fluctuations, such as orthostatic hypotension [7]. Several studies have shown that blood pressure variability and orthostatic hypotension are associated with the progression of cerebral white matter lesions (WMLs) [8, 9]. WMLs, which are considered a cerebral small vessel disease, are known to cause cognitive impairment, dementia and disability [10, 11]. Blood pressure variability, including orthostatic hypotension, is associated with cognitive decline and a greater risk of dementia [12–14]. The rostral ventrolateral medulla (RVLM), which is involved in the regulation of the autonomic nervous system, is an important central site for the maintenance of sympathetic vasomotor tone and blood pressure regulation [15]. We previously reported that RVLM compression was associated with increased blood pressure variability among acute ischemic stroke patients [16]. In that study, RVLM compression was mildly associated with WMLs. To date, there have been no reports on whether autonomic dysfunction, as reflected by a decreased VN size or RVLM compression, is associated with the severity of WMLs. The aim of this study was to investigate the associations among VN size, RVLM compression and the severity of WMLs in patients with vascular risk factors.
Methods
Subjects
This was a single-center hospital-based retrospective study. Patients with cerebrovascular disease (acute stroke or chronic stroke) and other atypical neurological problems, such as dizziness, underwent a clinically indicated ultrasonographic examination of their carotid artery systems between February 2020 and December 2023 at Hiroshima University Hospital. Of the 756 patients who underwent carotid ultrasonography for the evaluation of carotid atherosclerosis, the CSA of the VN was evaluated for 209 patients in typical clinical settings. Of these 209 patients, 200 patients who underwent magnetic resonance imaging (MRI) in typical clinical settings within 6 months before or after the day when carotid ultrasonography was performed were included in this study. Patients with a history of Parkinson’s disease (n = 3) or inflammatory peripheral neuropathy (n = 1) were excluded. Finally, 196 patients were analyzed in the present study. Baseline clinical characteristics, including age, sex, height, body weight, body mass index (BMI), hypertension, diabetes mellitus, dyslipidemia, atrial fibrillation and history of stroke (ischemic or hemorrhagic), were recorded. The criteria for hypertension, diabetes mellitus, dyslipidemia, and atrial fibrillation were previously defined [17]. The study conformed to the Declaration of Helsinki and was approved by the ethics committees at Hiroshima University, including the institutional review board (approval number E2023-0201). This study was performed under the opt-out method, as it was performed using clinical records. Informed consent for participation was not obtained from the participants.
Carotid ultrasonography
Vagus nerve size by ultrasonography
Ultrasound was performed to evaluate the CSA of the VN using a LOGIQTME9 XD clearTM2.0 (GE Healthcare, Wauwatosa, WI, USA) with a 10–15 MHz linear array transducer. Ultrasonography and measurements of the CSA of the VN were performed by one of three experienced technicians (T.N., F.E., and A.H.) who were certified by the Japan Academy of Neurosonology. Cross-sectional imaging of the VN was recorded bilaterally at the level of the thyroid gland. The VN was identified within the carotid sheath between the internal jugular vein and the carotid artery, with the transducer placed transversely on the lateral neck (Fig. 1A). During the study, all subjects were placed in a supine position and rotate their heads away from the scanning side. The CSA of the VN was obtained using the trace method, measuring along the inner aspect of the hyperechoic epineurium (Fig. 1B). The CSA of the VN (right VN and left VN) was measured twice by technicians, and the mean CSA was calculated. Between each measurement, echo transducer was completely removal. The intraclass correlation coefficient (ICC) (1, 2) was consistently high for each technician (T.N.: n = 125, 0.956 for right VN, 0.938 for left VN; F.E.: n = 43, 0.776 for right VN, 0.828 for left VN; A.H.: n = 28, 0.937 for right VN, 0.878 for left VN). For the interrater correlation, ICC (2.1) for the CSA of the VN was calculated for 10 patients in a preliminary study using a different cohort as follows: between T.N. and A.H., 0.878 for right VN and 0.823 for left VN; between T.N. and F.E., 0.922 for right VN and 0.928 for left VN.
Fig. 1.
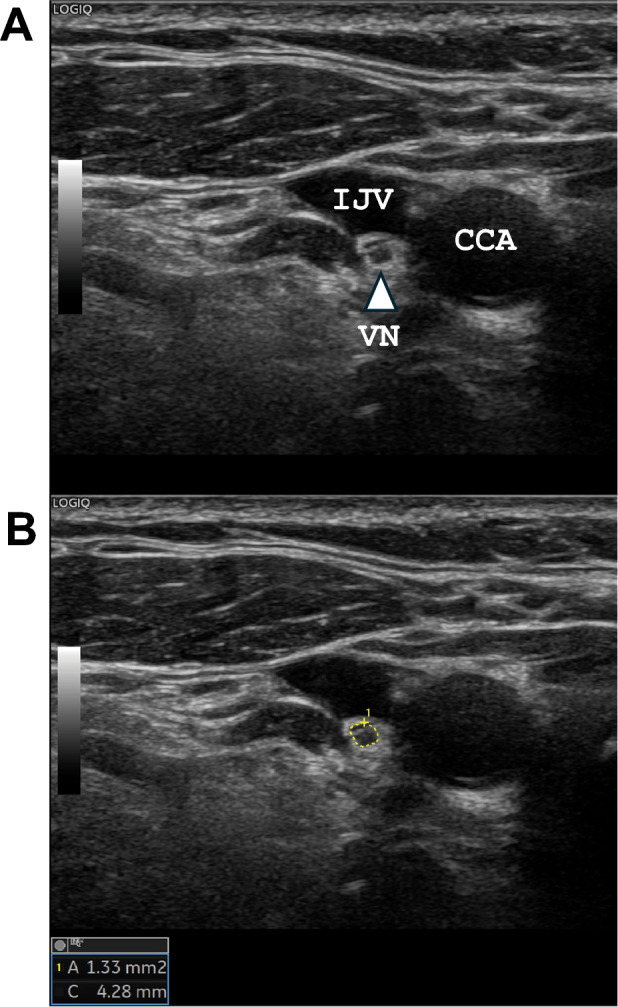
Ultrasonographic image of the vagus nerve (VN). The right VN is shown as a small, rounded, hypoechoic structure between the common carotid artery (CCA) and the internal jugular vein (IJV) (A, triangle arrow). The cross-sectional area of the VN was measured by manual tracing (B, yellow circle)
Carotid artery measurements by ultrasonography
The common carotid arteries (CCAs) were evaluated using high-resolution B-mode duplex ultrasonography with a 7.5-MHz linear probe. Optimal bilateral visualization of the carotid artery was performed with the patients lying in the supine position and their necks slightly extended. We measured the maximal intima-media thickness (IMT) at the far wall of the distal CCA (CCA-IMT), which is the 10-mm section of the artery proximal to the starting point of the carotid bulb. In addition, we measured the common carotid interadventitial diameter (IAD) on both sides.
Magnetic resonance imaging
MRI was performed with a 3.0 T scanner (SIGNA, GE Medical Systems, Fairfield, CT, USA or Philips Ingenia, Philips Medical Systems, Best, the Netherlands). The imaging protocol consisted of T1-weighted spin‒echo, T2-weighted spin‒echo and fluid-attenuated inversion recovery (FLAIR) sequences. The severity of the WMLs was rated visually on the FLAIR images using the Fazekas scale as follows: no lesions, grade 0; punctate lesions, grade 1; early confluent lesions, grade 2; and confluent lesions, grade 3 [18]. Periventricular hyperintensity (PVH) and deep white matter hyperintensity (DWMH) were graded separately on FLAIR or T2-weighted spin‒echo images according to the Fazekas scale. In addition, deep white matter changes (frontal, temporal, parietal, and occipital lobes) were assessed using Scheltens’ scale, with the total possible score ranging from 0 to 24. Periventricular white matter changes (range, 0–6) were assigned scores of 0–2 [19]. The Scheltens’ score was defined as the sum of these ratings (range, 0–30). The assessment of WMLs followed the principle of excluding infarcted or hemorrhagic areas. Additionally, gradient-echo T2*-weighted MRI (GRE) was performed to evaluate the presence of cerebral microbleeds (CMBs). CMBs were defined as homogeneous round lesions with diameters ≤ 10 mm characterized by signal intensity loss on the GRE image. The presence or absence of RVLM vascular compression was evaluated using 3D time-of-flight imaging. The RVLM was located at the root entry zone of cranial nerves IX and X. The upper and lower borders of the root entry zone were determined by the uppermost and lowest fibers of the IX/X nerve bundle entering the medulla; the anterior border of the root entry zone was defined as the transition of the olivary convexity to the concavity of the retro-olivary sulcus; and the posterolateral border was located at the junction of parenchymal brain tissue and individual nerve fiber [16]. Two stroke neurologists (T.N. and F.E.) who were unaware of the clinical details of the patients graded the severity of the PVH (Fazekas rating), DWMH (Fazekas rating) and WMLs (Scheltens’ rating) and identified CMBs and RVLM compression. Joint assessments were conducted by the stroke neurologists (T.N. and F.E.) when necessary to reach a consensus.
Statistical analysis
Statistical analyses were performed using JMP 17.0 statistical software (SAS Institute, Cary, NC, USA). The data are expressed as the means ± standard deviations (SDs) or medians (25th and 75th percentiles) for the continuous variables and as frequencies and percentages for the discrete variables. The statistical significance of intergroup differences was assessed by the χ2 test, unpaired t test, Mann‒Whitney U test or Kruskal‒Wallis test, as appropriate. Relationships between the CSA of the VN (right or left) and the other variables and the relationships between WMLs and the other variables were examined by Spearman’s correlation. Indicators of the severity of WMLs were identified using a multiple linear regression model that included the CSA of the right VN and other variables identified by a backward selection procedure using P > 0.10 of the likelihood ratio test as the exclusion criterion (Model 1). A similar analysis of the CSA of the left VN was performed (Model 2). P < 0.05 indicated statistical significance.
Results
A total of 196 patients (128 males and 68 females, 70.2 ± 12.7 years of age) were enrolled in the study. The baseline clinical characteristics of the patients are presented in Table 1. Of these 196 patients, 108 (55.1%) were acute ischemic stroke patients. The CSA of the right VN (2.08 ± 0.65 mm2) was significantly greater than the left CSA (1.56 ± 0.44 mm2) in these patients (paired t test, t = 15.80, P < 0.001; Fig. 2A). In addition, the CSA of the right VN was positively correlated with the CSA of the left VN (Spearman’s correlation analysis, ρ = 0.734, P < 0.001; Fig. 2B). The CSAs of both VNs were significantly greater in male patients than in female patients (Table 1). Univariate regression analysis revealed that the CSA of the right VN was significantly correlated with age, male sex, height, weight and BMI (Supplemental Table 1). The associations between the CSA of the left VN and age, sex, and physical findings were similar. Vascular risk factors and atherosclerosis findings in the carotid artery were not associated with the CSA of either VN. Only age was independently associated with the CSAs of both VNs after adjusting for sex and physical findings (height and weight) (Supplemental Table 2). Male sex was associated with the CSAs of both VNs after adjusting for age and BMI (Supplemental Table 2).
Table 1.
Baseline characteristics
| All n = 196 |
Male n = 128 |
Female n = 68 |
P | |
|---|---|---|---|---|
| Age (years) | 70.2 ± 12.7 | 70.5 ± 11.4 | 69.7 ± 14.8 | 0.65 |
| Height (cm) | 162.0 ± 9.4 | 166.9 ± 6.5 | 152.7 ± 6.4 | < 0.001 |
| Weight (kg) | 60.1 ± 12.9 | 64.4 ± 10.8 | 52.2 ± 12.9 | < 0.001 |
| Body mass index (kg/m2) | 22.8 ± 4.0 | 23.1 ± 3.4 | 22.3 ± 4.9 | 0.21 |
| Hypertension | 146 (74.5) | 96 (75.0) | 50 (73.5) | 0.86 |
| Diabetes mellitus | 60 (30.6) | 49 (38.3) | 11 (16.2) | 0.002 |
| Dyslipidemia | 114 (58.2) | 72 (56.3) | 42 (61.8) | 0.54 |
| Atrial fibrillation | 28 (14.3) | 20 (15.6) | 8 (11.8) | 0.53 |
| Stroke type | ||||
| Acute ischemic stroke | 108 (55.1) | 71 (55.5) | 37 (54.4) | 0.95 |
| Acute hemorrhagic stroke | 11 (5.6) | 7 (5.5) | 4 (5.9) | |
| Chronic stroke (ischemic or hemorrhagic) | 23 (11.7) | 16 (12.5) | 7 (10.3) | |
| Asymptomatic carotid atherosclerosis | 38 (19.4) | 23 (18.0) | 15 (22.1) | |
| Others | 16 (8.2) | 11 (8.6) | 5 (7.4) | |
| Carotid ultrasonography findings | ||||
| Right CCA IAD (mm) | 7.69 ± 1.00 | 7.90 ± 0.93 | 7.32 ± 0.97 | < 0.001 |
| Right CCA max-IMT (mm) | 1.45 ± 0.97 | 1.50 ± 0.97 | 1.35 ± 1.03 | 0.30 |
| Left CCA IAD (mm) | 7.59 ± 0.97 | 7.79 ± 0.87 | 7.23 ± 1.04 | < 0.001 |
| Left CCA max-IMT (mm) | 1.41 ± 0.89 | 1.47 ± 0.97 | 1.29 ± 0.74 | 0.30 |
| CSA of right VN (mm2) | 2.08 ± 0.65 | 2.18 ± 0.70 | 1.89 ± 0.52 | 0.003 |
| CSA of left VN (mm2) | 1.56 ± 0.44 | 1.62 ± 0.46 | 1.45 ± 0.38 | 0.011 |
| MRI findings | ||||
| PVH (Fazekas rating) | 1 (1–2) | 1 (1–2) | 1 (1–2) | 0.82 |
| DWMH (Fazekas rating) | 1 (1–2) | 1 (1–2) | 1 (0.3–2) | 0.31 |
| WMLs (Scheltens’ rating) | 8 (5–2) | 8.5 (5–12.8) | 8 (5–12) | 0.88 |
| Cerebral microbleeds (n = 195) | 41 (21.0) | 30 (23.6) | 11 (16.2) | 0.27 |
| Number of cerebral microbleeds (n = 195) | 0 (0–0) | 0 (0–0) | 0 (0–0) | 0.19 |
| RVLM compression | 64 (32.7) | 39 (30.5) | 25 (36.8) | 0.42 |
The data are presented as the means ± SD for age, height, weight, body mass index, and carotid ultrasonography findings; medians (interquartile ranges) for the Fazekas score, Scheltens’ score and number of cerebral microbleeds; and number (%) for patients
IAD interadventitial diameter, CCA common carotid artery, IMT intima-media thickness, CSA cross-sectional area, MRI magnetic resonance imaging, PVH periventricular hyperintensity, DWMH deep white matter hyperintensity, WMLs white matter lesions, RVLM rostral ventrolateral medulla
Fig. 2.

A The cross-sectional area (CSA) of the right vagus nerve (VN) was significantly larger than that of the left VN (paired t test, P < 0.001). B The CSA of the right VN was positively correlated with that of the left VN (Spearman’s correlation analysis, ρ = 0.734, P < 0.001). The presence of nearly all the data points below the identity line suggested that the CSA of the L-VN was smaller than that of the R-VN
Table 2.
Associations between periventricular hyperintensity (PVH), vascular risk factors, carotid ultrasonography findings, and other magnetic resonance imaging (MRI) findings
| PVH | |||||
|---|---|---|---|---|---|
| Fazekas 0 (n = 33) |
Fazekas 1 (n = 81) |
Fazekas 2 (n = 66) |
Fazekas 3 (n = 16) |
P | |
| Age (years) | 57.2 ± 16.4 | 70.1 ± 9.4 | 74.7 ± 9.6 | 79.6 ± 9.2 | < 0.001 |
| Male sex | 22 (66.7) | 53 (65.4) | 39 (59.1) | 14 (87.5) | 0.20 |
| Height (cm) | 164.7 ± 8.2 | 163.0 ± 9.3 | 159.2 ± 9.3 | 162.6 ± 9.9 | 0.023 |
| Weight (kg) | 63.1 ± 13.9 | 62.4 ± 14.5 | 56.7 ± 10.1 | 56.8 ± 8.3 | 0.019 |
| Body mass index (kg/m2) | 23.1 ± 4.4 | 23.3 ± 4.5 | 22.3 ± 3.0 | 21.6 ± 3.8 | 0.25 |
| Hypertension | 16 (48.5) | 60 (74.1) | 57 (86.4) | 13 (81.3) | < 0.001 |
| Diabetes mellitus | 6 (18.2) | 23 (28.4) | 26 (39.4) | 5 (31.3) | 0.17 |
| Dyslipidemia | 14 (42.4) | 46 (56.8) | 43 (65.2) | 11 (68.8) | 0.14 |
| Atrial fibrillation | 1 (3.0) | 12 (14.8) | 12 (18.2) | 3 (18.8) | 0.21 |
| Stroke type | |||||
| Acute ischemic stroke | 17 (51.5) | 36 (44.4) | 43 (65.2) | 12 (75.0) | 0.20 |
| Acute hemorrhagic stroke | 2 (6.1) | 7 (8.6) | 2 (3.0) | 0 (0.0) | |
| Chronic stroke (ischemic or hemorrhagic) | 2 (6.1) | 11 (13.6) | 7 (10.6) | 3 (18.8) | |
| Asymptomatic carotid atherosclerosis | 9 (27.3) | 20 (24.7) | 8 (12.1) | 1 (6.3) | |
| Others | 3 (9.1) | 7 (8.6) | 6 (9.1) | 0 (0.0) | |
| Carotid ultrasonography | – | – | |||
| Right CCA IAD (mm) | 7.07 ± 1.03 | 7.69 ± 0.95 | 7.84 ± 0.91 | 8.31 ± 1.04 | < 0.001 |
| Right CCA max-IMT (mm) | 0.97 ± 0.53 | 1.51 ± 1.14 | 1.53 ± 0.85 | 1.72 ± 1.01 | 0.018 |
| Left CCA IAD (mm) | 7.03 ± 1.01 | 7.62 ± 0.91 | 7.67 ± 0.96 | 8.24 ± 0.72 | < 0.001 |
| Left CCA max-IMT (mm) | 1.08 ± 0.71 | 1.37 ± 0.93 | 1.54 ± 0.85 | 1.73 ± 1.09 | 0.049 |
| CSA of right VN (mm2) | 2.24 ± 0.67 | 2.19 ± 0.70 | 1.95 ± 0.57 | 1.76 ± 0.55 | 0.012 |
| CSA of left VN (mm2) | 1.68 ± 0.44 | 1.61 ± 0.44 | 1.50 ± 0.42 | 1.31 ± 0.35 | 0.017 |
| MRI findings | |||||
| DWMH (Fazekas rating) | 0 (0–1) | 1 (1–1) | 2 (1–2) | 3 (3–3) | < 0.001 |
| WMLs (Scheltens’ rating) | 3 (1.5–5) | 7 (4–9) | 12 (9–15) | 19.5 (17–21.8) | < 0.001 |
| Cerebral microbleeds, (n = 195) | 3 (9.1) | 12 (15.0) | 17 (25.8) | 9 (56.3) | < 0.001 |
| Number of cerebral microbleeds (n = 195) | 0 (0–0) | 0 (0–0) | 0 (0–1) | 1 (0–3.8) | < 0.001 |
| RVLM compression | 7 (21.2) | 26 (32.1) | 25 (37.9) | 6 (37.5) | 0.40 |
The data are presented as the means ± SD for age, height, weight, body mass index, and carotid ultrasonography findings; medians (interquartile ranges) for the Fazekas score, Scheltens’ score and number of cerebral microbleeds; and number (%) for patients
IAD interadventitial diameter, CCA common carotid artery, IMT intima-media thickness, CSA cross-sectional area, MRI magnetic resonance imaging, PVH periventricular hyperintensity, DWMH deep white matter hyperintensity, WMLs white matter lesions, RVLM rostral ventrolateral medulla
Associations between MRI findings (PVH or DWMH) and carotid ultrasonography findings
Clinical characteristics according to the severity of PVH (Fazekas) are shown in Table 2. Age and hypertension were strongly associated with the severity of PVH. An increased CCA IAD was also associated with PVH, and the CCA max-IMT was slightly associated with PVH. A decreased CSA of the VN was also associated with the severity of PVH. Clinical characteristics according to the severity of DWMH (Fazekas) are shown in Table 3. Like for the PVH, age, hypertension, and CCA IAD were strongly associated with the severity of DWMH. A decreased CSA of the right VN was associated with DWMH (P = 0.012), but a decreased CSA of the left VN was not associated with DWMH (P = 0.088). Unlike PVH, the CCA max-IMT was not associated with DWMH, while atrial fibrillation and RVLM compression were associated with DWMH (P = 0.028 and P = 0.032).
Table 3.
Associations between deep white matter hyperintensity (DWMH), vascular risk factors, carotid ultrasonography findings, and other magnetic resonance imaging (MRI) findings
| DWMH | |||||
|---|---|---|---|---|---|
| Fazekas 0 (n = 37) |
Fazekas 1 (n = 83) |
Fazekas 2 (n = 58) |
Fazekas 3 (n = 18) |
P | |
| Age (years) | 59.0 ± 16.1 | 69.9 ± 10.4 | 75.4 ± 7.8 | 78.5 ± 11.2 | < 0.001 |
| Male sex | 20 (54.1) | 58 (69.9) | 36 (62.1) | 14 (77.8) | 0.23 |
| Height (cm) | 162.9 ± 9.4 | 162.5 ± 8.8 | 160.7 ± 10.0 | 161.8 ± 10.0 | 0.63 |
| Weight (kg) | 62.8 ± 14.0 | 60.9 ± 13.8 | 58.1 ± 11.4 | 57.4 ± 9.8 | 0.25 |
| Body mass index (kg/m2) | 23.5 ± 4.2 | 23.0 ± 4.4 | 22.4 ± 3.4 | 21.9 ± 3.4 | 0.42 |
| Hypertension | 17 (46.0) | 62 (74.7) | 51 (87.9) | 16 (88.9) | < 0.001 |
| Diabetes mellitus | 10 (27.0) | 24 (28.9) | 21 (36.2) | 5 (27.8) | 0.74 |
| Dyslipidemia | 16 (43.2) | 48 (57.8) | 38 (65.5) | 12 (66.7) | 0.16 |
| Atrial fibrillation | 3 (8.1) | 8 (9.6) | 15 (25.9) | 2 (11.1) | 0.028 |
| Stroke type | 0.12 | ||||
| Acute ischemic stroke | 15 (40.5) | 43 (51.8) | 37 (63.8) | 13 (72.2) | |
| Acute hemorrhagic stroke | 3 (8.1) | 6 (7.2) | 2 (3.5) | 0 (0.0) | |
| Chronic stroke (ischemic or hemorrhagic) | 4 (10.8) | 9 (10.8) | 7 (12.1) | 3 (16.7) | |
| Asymptomatic carotid atherosclerosis | 10 (27.0) | 21 (25.3) | 5 (8.6) | 2 (11.1) | |
| Others | 5 (13.5) | 4 (4.8) | 7 (12.1) | 0 (0.0) | |
| Carotid ultrasonography | – | – | |||
| Right CCA IAD (mm) | 6.90 ± 0.96 | 7.78 ± 0.87 | 7.89 ± 0.95 | 8.28 ± 1.02 | < 0.001 |
| Right CCA max-IMT (mm) | 1.31 ± 1.19 | 1.42 ± 0.96 | 1.51 ± 0.82 | 1.66 ± 0.98 | 0.59 |
| Left CCA IAD (mm) | 7.05 ± 1.08 | 7.66 ± 0.96 | 7.71 ± 0.88 | 7.96 ± 0.79 | 0.002 |
| Left CCA max-IMT (mm) | 1.14 ± 0.67 | 1.46 ± 0.96 | 1.45 ± 0.84 | 1.58 ± 1.08 | 0.22 |
| CSA of right VN (mm2) | 2.33 ± 0.82 | 2.11 ± 0.62 | 1.96 ± 0.57 | 1.80 ± 0.49 | 0.012 |
| CSA of left VN (mm2) | 1.64 ± 0.44 | 1.59 ± 0.48 | 1.5 ± 0.39 | 1.34 ± 0.33 | 0.088 |
| MRI findings | |||||
| PVH (Fazekas rating) | 0 (0−1) | 1 (1−2) | 2 (1−2) | 3 (2−3) | < 0.001 |
| WMLs (Scheltens’ rating) | 3 (1.5−5) | 8 (5−10) | 12 (9−15) | 19.5 (15.8−22) | < 0.001 |
| Cerebral microbleeds, (n = 195) | 4 (10.8) | 14 (17.1) | 14 (24.1) | 9 (50.0) | 0.006 |
| Number of cerebral microbleeds (n = 195) | 0 (0−0) | 0 (0−0) | 0 (0−0.3) | 0.5 (0−2.3) | 0.004 |
| RVLM compression | 7 (18.9) | 24 (28.9) | 27 (46.7) | 6 (33.3) | 0.032 |
The data are presented as the means ± SD for age, height, weight, body mass index, and carotid ultrasonography findings; medians (interquartile ranges) for the Fazekas score, Scheltens’ score and number of cerebral microbleeds; and number (%) for patients
IAD interadventitial diameter, CCA common carotid artery, IMT intima-media thickness, CSA cross-sectional area, MRI magnetic resonance imaging, PVH periventricular hyperintensity, DWMH deep white matter hyperintensity, WMLs white matter lesions, RVLM rostral ventrolateral medulla
Associations between WMLs and VN Size
Scatter plots of WMLs (Scheltens’ rating score) and the CSA of the VN (right or left) are shown in Fig. 3. The CSAs of both VNs were negatively correlated with the severity of WMLs (right: ρ = − 0.400, P < 0.001; left: ρ − 0.409, P < 0.001). Other indicators associated with the severity of WMLs are shown in Table 3. Multiple linear regression analyses revealed that older age (standardized partial regression coefficient [β] 0.290; P < 0.001), hypertension (β 0.144; P = 0.027), increased right CCA IAD (β 0.181; P = 0.011), and decreased CSA of the right VN (β − 0.226; P < 0.001) were independently associated with the severity of WMLs (Model 1). A decreased CSA of the left VN was also associated with the severity of WMLs (β = − 0.239; P < 0.001, Model 2) (Table 4).
Fig. 3.

Scatter plots of the vagus nerve (VN) and white matter lesions (WMLs). A The CSA of the right VN (R-VN) was negatively correlated with the severity of WMLs (Spearman’s correlation analysis, ρ = − 0.400, P < 0.001). B The CSA of the left VN (L-VN) was negatively correlated with the severity of WMLs (Spearman’s correlation analysis, ρ = − 0.409, P < 0.001)
Table 4.
Indicators of cerebral white matter lesions (WMLs) using univariate or multivariate analysis
| WMLs | ||||||
|---|---|---|---|---|---|---|
| Spearman’s correlation | Multiple linear regression (Model 1) | Multiple linear regression (Model 2) | ||||
| ρ | P | β | P | β | P | |
| Age (years) | 0.525 | < 0.001 | 0.290 | < 0.001 | 0.277 | < 0.001 |
| Male sex | 0.011 | 0.88 | − | − | − | − |
| Height (cm) | − 0.177 | 0.013 | − | − | − | − |
| Weight (kg) | − 0.213 | 0.003 | − 0.115 | 0.095 | − 0.122 | 0.075 |
| Body mass index (kg/m2) | − 0.149 | 0.037 | − | − | − | − |
| Hypertension | 0.294 | < 0.001 | 0.144 | 0.027 | 0.150 | 0.020 |
| Diabetes mellitus | 0.131 | 0.068 | − | − | − | − |
| Dyslipidemia | 0.105 | 0.144 | − | − | − | − |
| Atrial fibrillation | 0.180 | 0.012 | − | − | − | − |
| Carotid ultrasonography | − | − | − | − | ||
| Right CCA IAD (mm) | 0.272 | < 0.001 | 0.181 | 0.011 | 0.190 | 0.007 |
| Right CCA max-IMT (mm) | 0.184 | 0.011 | − | − | − | − |
| Left CCA IAD (mm) | 0.201 | 0.005 | − | − | − | − |
| Left CCA max-IMT (mm) | 0.102 | 0.16 | − | − | − | − |
| CSA of right VN (mm2) | − 0.400 | < 0.001 | − 0.226 | < 0.001 | − | − |
| CSA of left VN (mm2) | − 0.409 | < 0.001 | − | − | − 0.239 | < 0.001 |
| RVLM compression | 0.138 | 0.054 | − | − | − | − |
Model 1. Indicators were identified using multiple linear regression, including the CSA of the right VN and other variables (age, male sex, height, body mass index, hypertension, diabetes mellitus, dyslipidemia, atrial fibrillation, right CCA IAD, right CCA max-IMT, left CCA max-IMT, and RVLM compression), by a backward selection procedure using P > 0.10 of the likelihood ratio test as the exclusion criterion
Model 2. The same analysis as Model 1, incorporating left-VN as an adjusting factor instead of right-VN
IAD interadventitial diameter, CCA common carotid artery, IMT intima-media thickness, CSA cross-sectional area, RVLM rostral ventrolateral medulla
Discussion
In this study, age was strongly associated with the CSA of the VN in patients with vascular risk factors. The CSAs of both VNs were independently associated with the severity of WMLs after adjusting for age, sex, vascular risk factors, carotid atherosclerosis and RVLM compression.
Several studies have reported normal values for the CSA of the VN using ultrasonography [3, 20]. In general, the CSA of the right VN is larger than that of the left VN because of the asymmetry in the visceral nerve distribution for cardiac function or the gastric plexus [20, 21]. Our results were consistent with previous findings of differences between the right and left sides. Previous reports have shown that the anatomical level at which measurements are taken affects the CSA of the VN [3]. The CSA of the VN was smaller at the thyroid gland level on both sides than at the common carotid bifurcation level. A recent meta-analysis showed that the mean CSA at the thyroid gland level was 2.39 mm2 for the right VN and 1.87 mm2 for the left VN [3]. The CSAs of the VNs in our cohort were smaller than the previously reported values. Although there is no definitive consensus on whether factors such as age, sex, height, or weight affect the size of the VN[3, 20, 21], factors such as age and petite body size might influence the size of the VN. In the present study, vascular risk factors, including diabetes mellitus, were not associated with the CSA of the VN. Tawfik et al. reported that patients with diabetes mellitus had a smaller CSA of the VN than did those without diabetes mellitus [6]. On the other hand, associations between decreased VN size and diabetes mellitus were not observed in other previous studies [22, 23]. Although atrial fibrillation was not associated with the CSA of the VN in our cohort, a decreased CSA of the right VN has been associated with the future development of atrial fibrillation in acute ischemic stroke patients [24]. Further evidence is crucial for determining whether these vascular risk factors may be associated with the CSA of the VN.
Our novel findings were that a decreased CSA of the VN was associated with the severity of WMLs. To our knowledge, this study is the first report to demonstrate associations between the CSA of the VN and WMLs and to consider RVLM and atherosclerotic findings in carotid arteries. Older age and hypertension are considered the main risk factors for cerebral WMLs [10, 25]. In this study, older age was strongly associated with decreased VN size. Therefore, older age may be a common etiological factor in the progression of WMLs and atrophy of the VN. Another possible etiology might be autonomic dysfunction, including blood pressure variability. Blood pressure variability was also associated with the severity or progression of WMLs [13, 14]. One limitation of this study was the lack of investigations into blood pressure variability. Diabetes mellitus was also associated with the severity of WMLs [26]. The duration of diabetes may also affect autonomic nerve system dysfunction. In the present study, diabetes mellitus was not associated with the severity of WMLs and the size of VN. Further investigation is needed to determine whether the extent and control status of diabetes duration affect WMLs and VN size.
Recently, imbalances in the gut microbiota have been linked to neurological diseases, such as Parkinson's disease and stroke, indicating a potential brain–gut interaction [27]. In addition, there have recently been several reports on the association between the gut microbiome and cerebral small vessel disease, including WMLs [28, 29]. The connection between the gut microbiota and the brain is thought to involve a complex network, with the VN playing a significant role [30]. It might be worthwhile to explore how the gut microbiota may influence the association between the severity of WMLs and VN size in future investigations.
Interestingly, the factors associated with PVH differed slightly from those associated with DWMH. PVH was associated with large vessel arteriosclerosis, indicated by CCA max-IMT. On the other hand, DWMH was associated with atrial fibrillation and RVLM compression. Several studies have shown that atrial fibrillation is associated with DWMH rather than PVH due to the microembolic pathway [31, 32]. There are limited reports on the correlation between compression of the RVLM and WMLs, but we have previously explored this association in patients with acute ischemic stroke [16]. Among 622 acute ischemic stroke patients, 213 (34.2%) exhibited vascular RVLM compression. Patients with RVLM compression had a greater frequency of severe DWMH with a Fazekas score of 3 than did those without RVLM compression, but this association was not observed for severe PVH with a Fazekas score of 3 [16]. Our current findings demonstrated a similar association between RVLM compression and DWMH to that observed in our previous study. This study might provide valuable insights into the distinct progression mechanisms of PVH and DWMH.
This study has several limitations. First, our study had a small sample size and a cross-sectional design, which limited our ability to make causal inferences. Second, this was a study that retrospectively investigated patients who underwent carotid ultrasound and MRI examinations as part of routine medical care, and it specifically limited the measurement of VN size to three designated technicians. Therefore, there may be selection bias. Third, the majority of our study subjects were acute-phase stroke patients. When considering the association between VN size and blood pressure variability in the future, it may be necessary to also consider healthy individuals. Fourth, all sonographic examinations were performed by three specific, well-trained ultrasound technicians certified by the Japan Academy of Neurosonology. The measurement site for the VN was predetermined through consensus, and interrater reliability was assessed. However, a detailed evaluation of the interrater reliability among the examiners of the patients in this study was not conducted. Fifth, several studies reported that measurements of CSA were performed three times, and mean values were calculated [3, 20]. We measured the CSA of the VN twice and adopted the average, but for a more accurate assessment, it might be better to measure it five times, exclude the highest and lowest values, and then average the remaining three measurements. Sixth, we did not collect other vascular risk factors such as smoking habit, the levels of cholesterol levels and homocysteine levels. These factors were thought to be associated with the severity of WMLs [26]. Finally, most of the subjects in this study were patients with acute stroke or chronic stroke. Therefore, the assessment of WMLs followed the standard practice of excluding infarcted or hemorrhagic areas. However, there were cases where this evaluation was challenging. It will be worth investigating the causal relationship between WMLs and VN size among patients without a history of stroke.
In conclusion, VN size determined via ultrasonography was associated with the severity of WMLs. While these findings do not establish a causal relationship, they suggest that autonomic nervous system dysfunction is involved in the progression of WMLs.
Supplementary Information
Below is the link to the electronic supplementary material.
Acknowledgements
This study was supported in part by research grants from the Japan Society for the Promotion of Science KAKENHI [grant numbers 20K16579, 21K10210, 22H03454, and 23H02827] and the Nakatomi Foundation.
Author contributions
TN wrote the first draft of the manuscript, performed data curation and the statistical analysis, interpreted the data. FE and AH corrected the data and critically revised the article for important intellectual content. SA, SN, and ST critically revised the article for important intellectual content. HK and HM supervised the study and critically revised the article for important intellectual content. All authors contributed to the article and approved the submitted version.
Funding
Open Access funding provided by Hiroshima University. This study was supported in part by research grants from the Japan Society for the Promotion of Science KAKENHI [grant numbers 20K16579, 21K10210, 22H03454, and 23H02827] and the Nakatomi Foundation.
Data availability
The data that supported the findings of this study are available from the corresponding author upon reasonable request.
Declarations
Conflicts of interest
Dr. Maruyama received Grants-in-Aid for Scientific Research (23H02827) and research support from Eisai, Takeda Pharmaceutical, Otsuka Pharmaceutical, Nihon Pharmaceutical, Shionogi, Teijin Pharma, Fuji Film, Sumitomo Pharma, Nihon Medi-Physics, Daiichi Sankyo, Kyowa Kirin, Sanofi, Novartis, Tsumura, Japan Blood Products Organization, Chugai Pharmaceutical, Mitsubishi Tanabe Pharma, and Viatris, which are unrelated to the submitted work. All other authors declare that they have no conflicts of interest.
Ethical approval
The study conformed to the Declaration of Helsinki and was approved by the ethics committees at Hiroshima University, including the institutional review board (approval number E2023-0201). This study was performed under the opt-out method, as it was performed using clinical records.
Informed consent
Informed consent for participation was not obtained from the participants.
Footnotes
Publisher's Note
Springer Nature remains neutral with regard to jurisdictional claims in published maps and institutional affiliations.
References
- 1.Berthoud HR, Neuhuber WL (2020) Functional and chemical anatomy of the afferent vagal system. Auton Neurosci 85:1–17 10.1016/S1566-0702(00)00215-0 [DOI] [PubMed] [Google Scholar]
- 2.Wang Y, Zhan G, Cai Z, Jiao B, Zhao Y, Li S et al (2021) Vagus nerve stimulation in brain diseases: therapeutic applications and biological mechanisms. Neurosci Biobehav Rev 127:37–53 10.1016/j.neubiorev.2021.04.018 [DOI] [PubMed] [Google Scholar]
- 3.Abdelnaby R, Elsayed M, Mohamed KA, Dardeer KT, Sonbol YT, ELgenidy A, et al (2022) Sonographic reference values of vagus nerve: a systematic review and meta-analysis. J Clin Neurophysiol 39:59–71 10.1097/WNP.0000000000000856 [DOI] [PubMed] [Google Scholar]
- 4.Abdelnaby R, Moawad MHED, Shabib AS, Mohamed KA, Ebrahim MA, Aboutaleb AM et al (2023) Sonographic vagus nerve atrophy in Parkinson’s disease: myth or fact? A systematic review and meta-analysis of recent evidence answers. Parkinsonism Relat Disord 112:105451 10.1016/j.parkreldis.2023.105451 [DOI] [PubMed] [Google Scholar]
- 5.Tsukita K, Taguchi T, Sakamaki-Tsukita H, Tanaka K, Suenaga T (2018) The vagus nerve becomes smaller in patients with Parkinson’s disease: a preliminary cross-sectional study using ultrasonography. Parkinsonism Relat Disord 55:148–149 10.1016/j.parkreldis.2018.06.002 [DOI] [PubMed] [Google Scholar]
- 6.Tawfik EA, Walker FO, Cartwright MS, El-Hilaly RA (2017) Diagnostic ultrasound of the vagus nerve in patients with diabetes. J Neuroimaging 27:589–593 10.1111/jon.12452 [DOI] [PubMed] [Google Scholar]
- 7.Wieling W, Kaufmann H, Claydon VE, van Wijnen VK, Harms MPM, Juraschek SP et al (2022) Diagnosis and treatment of orthostatic hypotension. Lancet Neurol 21:735–746 10.1016/S1474-4422(22)00169-7 [DOI] [PMC free article] [PubMed] [Google Scholar]
- 8.Starmans NL, Wolters FJ, Leeuwis AE, Bron EE, Brunner La Rocca HP, Staals J et al (2023) Twenty-four hour blood pressure variability and the prevalence and the progression of cerebral white matter hyperintensities. J Cereb Blood Flow Metab 43:801–811 10.1177/0271678X221149937 [DOI] [PMC free article] [PubMed] [Google Scholar]
- 9.Wei D, Wang Y, Yang X, Jin L (2022) Association of white mater lesions with orthostatic hypotension. Am J Transl Res 14:2410–2418 [PMC free article] [PubMed] [Google Scholar]
- 10.Pantoni L (2010) Cerebral small vessel disease: from pathogenesis and clinical characteristics to therapeutic challenges. Lancet Neurol 9:689–701 10.1016/S1474-4422(10)70104-6 [DOI] [PubMed] [Google Scholar]
- 11.Kalaria RN (2012) Cerebrovascular disease and mechanisms of cognitive impairment: evidence from clinicopathological studies in humans. Stroke 43:2526–2534 10.1161/STROKEAHA.112.655803 [DOI] [PubMed] [Google Scholar]
- 12.Godai K, Kabayama M, Gondo Y, Yasumoto S, Sekiguchi T, Noma T et al (2020) Day-to-day blood pressure variability is associated with lower cognitive performance among the Japanese community-dwelling oldest-old population: the SONIC study. Hypertens Res 43:404–411 10.1038/s41440-019-0377-5 [DOI] [PubMed] [Google Scholar]
- 13.Ernst ME, Ryan J, Chowdhury EK, Margolis KL, Beilin LJ, Reid CM et al (2021) Long-term blood pressure variability and risk of cognitive decline and dementia among older adults. J Am Heart Assoc 10:e019613 10.1161/JAHA.120.019613 [DOI] [PMC free article] [PubMed] [Google Scholar]
- 14.Ma Y, Blacker D, Viswanathan A, van Veluw SJ, Bos D, Vernooij MW et al (2021) Visit-to-visit blood pressure variability, neuropathology, and cognitive decline. Neurology 96:e2812–e2823 10.1212/WNL.0000000000012065 [DOI] [PMC free article] [PubMed] [Google Scholar]
- 15.Guyenet PG, Stornetta RL, Holloway BB, Souza GMPR, Abbott SBG (2018) Rostral ventrolateral medulla and hypertension. Hypertension 72:559–566 10.1161/HYPERTENSIONAHA.118.10921 [DOI] [PMC free article] [PubMed] [Google Scholar]
- 16.Nezu T, Hosomi N, Kuzume D, Naito H, Aoki S, Morimoto Y et al (2020) Effects of vascular compression on the rostral ventrolateral medulla for blood pressure variability in stroke patients. J Hypertens 38:2443–2450 10.1097/HJH.0000000000002575 [DOI] [PubMed] [Google Scholar]
- 17.Eto F, Nezu T, Aoki S, Kamimura T, Naito H, Shiga Y et al (2022) The association between nutritional intake one week after admission and outcome in acute ischemic stroke patients. J Stroke Cerebrovasc Dis 31:106812 10.1016/j.jstrokecerebrovasdis.2022.106812 [DOI] [PubMed] [Google Scholar]
- 18.Fazekas F, Chawluk JB, Alavi A, Hurtig HI, Zimmerman RA (1987) MR signal abnormalities at 1.5 T in Alzheimer’s dementia and normal aging. AJR Am J Roentgenol 149:351–356 10.2214/ajr.149.2.351 [DOI] [PubMed] [Google Scholar]
- 19.Scheltens P, Barkhof F, Leys D, Pruvo JP, Nauta JJ, Vermersch P et al (1993) A semiquantative rating scale for the assessment of signal hyperintensities on magnetic resonance imaging. J Neurol Sci 114:7–12 10.1016/0022-510X(93)90041-V [DOI] [PubMed] [Google Scholar]
- 20.Drakonaki E, Konschake M, Chlouverakis G, Tsiaoussis J (2023) Ultrasound morphometry of the cervical vagus nerve for daily clinical practice: reference values for cross sectional area and fascicle count. Ann Anat 250:152137 10.1016/j.aanat.2023.152137 [DOI] [PubMed] [Google Scholar]
- 21.Pelz JO, Belau E, Henn P, Hammer N, Classen J, Weise D (2018) Sonographic evaluation of the vagus nerves: protocol, reference values, and side-to-side differences. Muscle Nerve 57:766–771 10.1002/mus.25993 [DOI] [PubMed] [Google Scholar]
- 22.Xiong F, Wang Q, Hu Y, Jiang X, Liu L, Han Y et al (2023) Ultrasound characteristics of the cervical vagus nerve in patients with type 2 diabetes and diabetic peripheral neuropathy. Endokrynol Pol 74:421–429 [DOI] [PubMed] [Google Scholar]
- 23.Kotb MA, Bedewi MA, Almalki DM, AlAseeri AA, Alhariqi BA, Soliman SB et al (2023) The vagus nerve cross-sectional area on ultrasound in patients with type 2 diabetes. Medicine (Baltimore) 102:e36768 10.1097/MD.0000000000036768 [DOI] [PMC free article] [PubMed] [Google Scholar]
- 24.Oura K, Itabashi R, Yamaguchi Oura M, Kiyokawa T, Hirai E, Maeda T (2021) Cross-sectional area of the vagus nerve on carotid duplex ultrasound and atrial fibrillation in acute stroke: a retrospective analysis. eNeurologicalSci 25:100378 10.1016/j.ensci.2021.100378 [DOI] [PMC free article] [PubMed] [Google Scholar]
- 25.Pantoni L, Garcia JH (1997) Pathogenesis of leukoaraiosis: a review. Stroke 28:652–659 10.1161/01.STR.28.3.652 [DOI] [PubMed] [Google Scholar]
- 26.Lin Q, Huang WQ, Ma QL, Lu CX, Tong SJ, Ye JH et al (2017) Incidence and risk factors of leukoaraiosis from 4683 hospitalized patients: a cross-sectional study. Medicine (Baltimore) 96:e7682 10.1097/MD.0000000000007682 [DOI] [PMC free article] [PubMed] [Google Scholar]
- 27.Cryan JF, O’Riordan KJ, Sandhu K, Peterson V, Dinan TG (2020) The gut microbiome in neurological disorders. Lancet Neurol 19:179–194 10.1016/S1474-4422(19)30356-4 [DOI] [PubMed] [Google Scholar]
- 28.Fongang B, Satizabal C, Kautz TF, Wadop YN, Muhammad JAS, Vasquez E et al (2023) Cerebral small vessel disease burden is associated with decreased abundance of gut Barnesiella intestinihominis bacterium in the Framingham Heart Study. Sci Rep 13:13622 10.1038/s41598-023-40872-5 [DOI] [PMC free article] [PubMed] [Google Scholar]
- 29.Saji N, Murotani K, Hisada T, Tsuduki T, Sugimoto T, Kimura A et al (2021) The association between cerebral small vessel disease and the gut microbiome: a cross-sectional analysis. J Stroke Cerebrovasc Dis 30:105568 10.1016/j.jstrokecerebrovasdis.2020.105568 [DOI] [PubMed] [Google Scholar]
- 30.Han Y, Wang B, Gao H, He C, Hua R, Liang C et al (2022) Vagus nerve and underlying impact on the gut microbiota-brain axis in behavior and neurodegenerative diseases. J Inflamm Res 15:6213–6230 10.2147/JIR.S384949 [DOI] [PMC free article] [PubMed] [Google Scholar]
- 31.Mayasi Y, Helenius J, McManus DD, Goddeau RP, Jun-O’Connell AH, Moonis M et al (2018) Atrial fibrillation is associated with anterior predominant white matter lesions in patients presenting with embolic stroke. J Neurol Neurosurg Psychiatry 89:6–13 10.1136/jnnp-2016-315457 [DOI] [PMC free article] [PubMed] [Google Scholar]
- 32.Kobayashi A, Iguchi M, Shimizu S, Uchiyama S (2012) Silent cerebral infarcts and cerebral white matter lesions in patients with nonvalvular atrial fibrillation. J Stroke Cerebrovasc Dis 21:310–317 10.1016/j.jstrokecerebrovasdis.2010.09.004 [DOI] [PubMed] [Google Scholar]
Associated Data
This section collects any data citations, data availability statements, or supplementary materials included in this article.
Supplementary Materials
Data Availability Statement
The data that supported the findings of this study are available from the corresponding author upon reasonable request.