

Abstract
In the present study, single-walled carbon nanotubes (SWCNTs) incorporating chitosan-graft-gelatin (CS-g-GEL/SWCNTs) hydrogels were fabricated with multiple advantages, including cost-effectiveness, high efficiency, biodegradability, and ease of separation for methylene blue (MB) dye from aqueous solution. To verify the successful formulation of the prepared hydrogels, various characterization methods such as NMR, FTIR, XRD, FE-SEM, TGA, BET, and EDX were employed. The removal efficiency of CS-g-GEL/SWCNTs nanocomposite hydrogel increased significantly to 98.87% when the SWCNTs percentage was increased to 20%. The highest adsorption was observed for pH = 9, an adsorbent dose = 1.5 g L−1, a temperature = 25 °C, a contact time = 60 min, and a contaminant concentration = 20 mg L−1. Based on the thermodynamic results, spontaneous adsorption occurred from a negative Gibbs free energy (ΔG°). In addition, the thermodynamic analysis of the adsorption process revealed an average enthalpy of − 21.869 kJ mol−1 for the adsorption process at a temperature range of 25–45 °C, which indicates its spontaneous and exothermic behavior. The Langmuir isotherm model was successfully used to describe the equilibrium behavior of adsorption. The pseudo-first-order model better described adsorption kinetics compared to the pseudo-second-order, intra-particle, and Elovich models. CS-g-GEL/SWCNTs hydrogels have improved reusability for five consecutive cycles, suggesting that they may be effective for removing anionic dyes from aquatic environments.
Subject terms: Environmental sciences, Chemistry
Introduction
Dyes are extensively employed in industries such as textiles, cosmetics, paper manufacturing, pharmaceuticals, and printing1,2. Because of their complex chemical structures and aromatic rings within their structures, several dyes are toxic and non-biodegradable3,4. The dyes must therefore be removed from wastewater to ensure they can be discharged into the environment. In the textile industry, methylene blue (MB) is considered a commonly used dye because of its low cost and ease of availability5. MB dye finds wide-ranging uses in various domains, including the medical sciences, biology, chemistry, and dyeing industries. Nevertheless, because of its hazardous nature, prolonged exposure to MB can result in precordial pain, excessive sweating, vomiting, skin discoloration, anemia, hypertension, and mental disorientation. Researchers are attempting to remove MB from wastewater using various methods and materials in light of the toxicity of MB6. As a result, just like the rest of the dyes, they should be removed before being discarded in the environment in order to avoid damaging the environment7,8. Although membrane filtration, electrochemical procedures, coagulation-flocculation, ion exchange, flotation, and reverse osmosis are all viable options for removing MB, adsorption is by far the most used technique due to its ease of use and high success rate9–11.
Commercial chitosan (CS) is a cationic biopolymer made from the deacetylation of chitin, one of the most abundant natural polysaccharides next to cellulose in the world. It is biocompatible, nontoxic, biodegradable, good adsorbent, and can form membranes12,13. The polymeric structure of this compound consists of hydroxyl and amino functional groups14. These groups can serve as active sites with multifunctional properties for removing dyes and metal ions. Furthermore, the compound can provide intermolecular and intramolecular hydrogen bonds for the adsorption of dye molecules. However, it has been reported that CS is not an effective adsorbent for cationic dyes since it is a natural cationic polysaccharide15. This limitation has been lifted by modifying CS with a wide range of organic and inorganic components16,17. Several studies have recently been conducted to enhance its capacity for adsorption and mechanical and acid stability by impregnating carbon nanotubes and using chemical crosslinking agents such as epichlorohydrin and glutaraldehyde18–20. However, the crosslinkers used in many commercial hydrogels are often toxic or costly21. Therefore, developing and using environmentally friendly and bio-based crosslinkers is important. Gelatin (GEL) is a biodegradable polypeptide that can serve as a crosslinker for polysaccharide-based hydrogels and is derived from collagen in animal tissues like porcine skin. Its non-toxicity, biodegradability, and biocompatibility make it a promising crosslinker.
Nanofillers have been found to enhance the properties of polymer nanocomposite materials, including chitosan22,23. Recent studies have drawn attention to carbon-based nanomaterials, including graphene oxide, carbon nanotubes, and sodium carbide, because of their unique properties related to structure, shape, elasticity, excellent strength, and higher thermal stability24,25. Due to their extremely high aspect ratio and low density, carbon nanotubes (CNTs) are distinguished from carbon-based nanoparticles26. The CNTs have a nanosized diameter and are hollow cylindrical microstructures27,28. Because of their better structural integrity, excellent mechanical properties, high surface area, low weight, and chemical stability, CNTs have potential applications for catalyst supports, chemical sensors, drug delivery, energy storage, and adsorption29. However, because of its hydrophobic nature, its application is limited due to its costly manufacturing process and poor dispersibility. This shortcoming can be addressed by adding it to other polymers in order to improve its solubility and adsorption properties28.
A hydrogel is a three-dimensional polymer network that can absorb large quantities of water30,31. The ability of a hydrogel to adsorb water is affected by various factors, including its porosity and the number of binding sites or functional groups it contains. Hydrogels also can physically adsorb heavy metal ions due to the existence of polar functional groups like OH and COOH28,32. The low toxicity, low cost, high abundance, and hydrophilicity of polysaccharides have made them particularly attractive for bio-based hydrogels. Polysaccharide-based hydrogels are being researched for their potential capacity to adsorb dyes and heavy metal ions. Copello et al. prepared chitosan hydrogel/SiO2 hybrid materials as biosorbents via the sol–gel method, and the composites prepared have the potential to serve as biosorbents33. Ma et al.34 reported that magnetic gel bead adsorbent containing graphene oxide modified Fe3O4 for cationic dye removal, and the adsorption capacity of the prepared hydrogel bead for MB reached 21.325 mg g−1. Makhado et al.32 synthesized sodium alginate/poly (acrylic acid) containing multi-walled carbon nanotubes to remove MB from an aqueous solution, and the prepared hydrogel nanocomposite demonstrated a maximum adsorption capacity of 1596.0 mg g−1.
The combination of CS and GEL in the nanocomposite hydrogels, without the use of commercial and toxic crosslinkers, offers advantages such as biodegradability, making them environmentally friendly. In addition, the incorporation of single-walled carbon nanotubes (SWCNTs) into the CS-g-GEL hydrogel matrix leads to a synergistic effect that enhances the adsorption capacity of MB. SWCNTs provide additional adsorption sites, thereby improving the overall adsorption efficiency. Meanwhile, the hydrogel matrix plays a vital role in enhancing the stability and structural integrity of the nanocomposite. Additionally, compared to other studies, the porosity of the prepared hydrogel provides ample space for the dye molecules to be trapped or immobilized within the pores. This prevents desorption or leaching of the dye molecules from the hydrogel, enhancing its adsorption capacity and stability. In this study, CS-g-GEL/SWCNTs nanocomposite hydrogel was synthesized as an inexpensive, safe, and effective adsorbent for removing MB dye. NMR, FTIR, TGA, EDX, FE-SEM, and XRD techniques were used to determine the structure of the hydrogel. In order to assess the effectiveness of the adsorbent, several parameters were evaluated, including temperature, contact time, dye concentration, dosage, and pH. Pseudo-first-order models, pseudo-second-order models, intra-particle diffusion, and Elovich models were utilized to analyze the kinetic behavior of this process in considerable detail. In addition, the thermodynamic behavior of the prepared hydrogel was investigated. The efficiency of CS-g-GEL/SWCNTs nanocomposite hydrogel for dye removal has been studied for five consecutive cycles.
Results and discussion
Synthesis mechanism of CS-based hydrogels
There are several different methods for making chitosan hydrogels. Both chemical bonding and non-covalent physical interactions have been used to create networks. Physical interaction (hydrogen bonds between CS and ammonium-ion) and covalent bonding (covalent bonds between CS and formaldehyde, and formaldehyde with GEL) pathway for GEL attachment on CS are depicted in Fig. 1. The amine groups in CS are protonated to facilitate dissolution under acidic conditions (NH3+) at pH < 6.5. A covalent bond was established between CS and formaldehyde by interacting with amino groups (Fig. 1). Because of the chemical activation of CS, amino groups were bonded with free aldehydes (NH2). As a result of an attack by a nucleophile (GEL), iminium ions formed the CS-g-GEL hydrogel. The interaction involving the chitosan NH3+ groups and the gelatin oxygens contributes significantly to the process of the sol–gel transition. Also, in order to produce the CS-g-GEL/SWCNTs hydrogel described in this paper, a solution of ammonia was added to the mixture. Several mechanisms were responsible for the gelation process, including hydrogen bonding, electrostatic attraction, and hydrophobic interactions. Also, SWCNTs-impregnated CS-g-GEL hydrogels can improve the removal of MB dye. In the case of SWCNTs and hydrogel, hydrogen bonding plays a crucial role in their interaction. The hydroxyl and amino groups present in CS and GEL’s peptide backbone and can form hydrogen bonds with the carbon atoms on the surface of SWCNTs. This interaction facilitates adhesion and promotes the formation of stable complexes. Another type of interaction observed between SWCNTs and CS-g-GEL is π–π stacking. In GEL, aromatic amino acids such as phenylalanine and tyrosine can engage in π–π stacking with the conjugated system of carbon atoms present in SWCNTs. This stacking interaction further strengthens the bonds between the two entities, enhancing their overall stability. CS-g-GEL/SWCNTs hydrogel can also entrap MB dye molecules more efficiently when SWCNTs and GEL are present. It is also possible for MB dye molecules to be trapped in gaps between CS and GEL bonds or in gaps between CS and formaldehyde that did not fill with SWCNTs. Also, aromatic dye molecules, such as MB, possess a conjugated system of electrons. This π-electron system can undergo π–π stacking interactions with the carbon atoms present in SWCNTs. These attractive forces further facilitate the entrapment and removal of dye molecules.
Figure 1.

Synthesis pathway of CS-g-GEL/SWCNTs hydrogel.
Characterization of hydrogel
1H-NMR analysis
To analyze the CS-g-GEL hydrogel, 1H NMR spectroscopy was performed in D2O. Figure 2 shows that the chemical shift at 1.96 ppm is due to the acetyl group (–CH3), whereas the chemical shift at 2.83 ppm is due to the proton H2 of CS. H3–H6 and protons of CS give a chemical shift between 3.70 and 3.95 ppm. The formation of methylene groups can explain the peak at 2.59 ppm during the crosslinking of GEL and CS (H8, H9). The presence of a signal at 5.10 ppm (H1) can be attributed to the hydrogen atom forming a bond with the anomeric carbon. Based on the results of the 1H NMR analysis of GEL, Table 1 and Fig. 2 show typical peaks for the amino acids (I, II, III, IV, V, VI, VII). The signals corresponding to amino acids shifted when GEL was grafted onto CS35. The observed peaks corresponding to various functional groups and amino acids confirm the successful grafting of GEL into CS and provide evidence of the crosslinking process.
Figure 2.

1H NMR spectrum (500 MHz, D2O, 25 °C) of CS-g-GEL.
Table 1.
1HNMR characteristic proton of the amino acids of GEL involved in CS-g-GEL35.
| Characteristic proton of the amino acids of GEL involved in CS-g-GEL | Amino acid abbreviation | Chemical shift of protons (ppm) |
|---|---|---|
| γ-threonine (CH3) | I | 1.41 |
| β-threonine (CH) | II | 4.59 |
| β-serine (CH2) | III | 3.87 |
| ε-hydroxylysine (CH2) | IV | 3.08 |
| ε-lysine (CH2) | V | 3.21 |
| γ-hydroxyproline (CH) | VI | 5.10 |
| β-hydroxyproline (CH2) | VII | 2.59 |
FTIR analysis
Figure 3 illustrates the IR spectrum of the synthesized hydrogels. As shown in Fig. 3, the broad peak observed in CS can be assigned to the stretching vibration of –OH. The absorption peaks at 1650 and 1585 cm−1 may also be because of the amide groups36. There is a stretching frequency of 2867 cm−1 observed for the methylene group. For the gelatin spectrum, the wide band at 3500 cm−1 is attributed to the O–H and N–H stretching vibration. The peak at 1643 cm−1 primarily results from stretching vibrations associated with the C=O group. The absorption peak at 1537 cm−1 is attributed to the N–H deformation vibration37. A few C=O groups can be observed in the spectra of SWCNTs, originating from the adsorption of CO and CO2. It has been determined that the peak at 1650 cm−1 results from the vibrational stretching of the C=C bond, while the peak at 1381 cm−1 is due to the vibrational stretching of the C–C bond. Peaks between 1050 and 1160 cm−1 represent C–O bonds in the hydroxyl group38. Figure 3 shows the IR spectra of CS-g-GEL. The broad peak at 3350 cm−1 could be assigned to N–H and OH stretching vibrations. The peaks at 1000–1160 cm−1 could be due to C-N stretching absorptions. The N-acetyl groups were detected at about 1561 cm−1 (C=O stretching of amide I), while the absorption band of N–H bending can be seen at 1655 cm−1. The strong peak at around 1400 cm−1 (C–O–R) could be attributed to the crosslinking point of GEL and CS. The CS-g-GEL/SWCNTs nanocomposite hydrogel displayed slight variations in stretching frequency39. For CS-g-GEL/SWCNTs nanocomposite hydrogel containing MB dye, the absorption band at 895 and 1245 cm−1 could be assigned to S–OR and N–O amine oxide, confirming the presence of dye in the hydrogel. According to Fig. 1, after the adsorption of the MB dye molecules onto the adsorbents, the FTIR spectra of the adsorbents did not differ significantly; only minor variations in their peak range and intensity were observed. As a result of these findings, the MB dye molecule was found to form a physical bond with the surface of the adsorbents due to hydrogen bonds and weak van der Waals forces.
Figure 3.
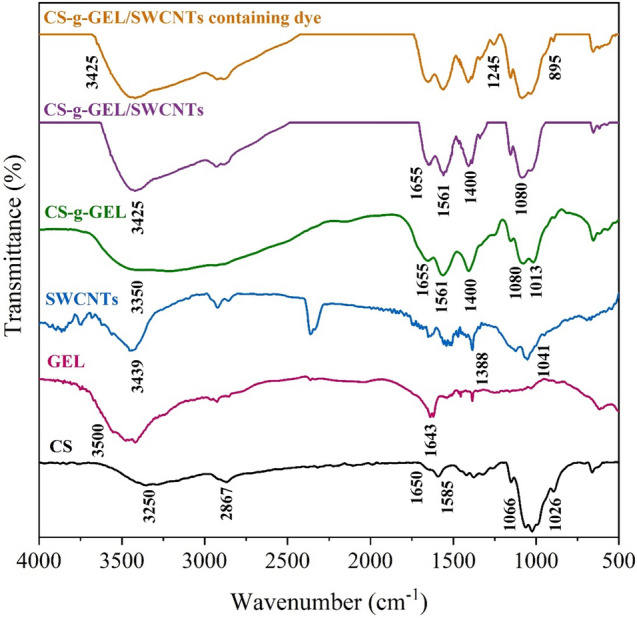
FTIR spectra of the CS, GEL, SWCNTs, CS-g-GEL, CS-g-GEL/SWCNTs, and CS-g-GEL/SWCNTs containing dye hydrogels.
TGA analysis
CS-g-GEL and CS-g-GEL/SWCNTs nanocomposite hydrogels were tested for thermal stability using TGA. The results showed two steps in weight loss for CS-g-GEL hydrogel. Weight loss at 132 °C is due to water physically adsorbing, which is approximately 8.16%. The maximum thermal decomposition of hydrogel bonds and pyranose ring of chitosan occurs at 132–600 °C, which accounts for about 78% of CS-g-GEL weight loss (Fig. 4a). For CS-g-GEL/SWCNTs nanocomposite hydrogel, three weight loss steps were observed. A three-step weight loss process was observed for CS-g-GEL/SWCNTs nanocomposite hydrogel. Water physically adsorbed to the hydrogel results in the first weight loss up to 119 °C. According to the results, the second step, about 8.5%, results from SWCNTs being loaded into the polymer structure and possibly interacting with the polymer. Between 216 and 600 °C, a weight loss of 66% is attributed to the thermal decomposition of the polymer structure and the gradual degradation of the polymer structure (Fig. 4b). Comparing CS-g-GEL with CS-g-GEL/SWCNTs, nanocomposite hydrogels showed a gradual, three-step decomposition pattern, indicating higher thermal stability for nanocomposite hydrogels. The differential thermogravimetry (DTG) results of the CS-g-GEL and CS-g-GEL/SWCNTs nanocomposite hydrogels were also investigated. DTG analysis was used to confirm CS-g-GEL degradation in two steps and CS-g-GEL/SWCNTs degradation in three steps between 27 and 600 °C.
Figure 4.

TGA and DTG curves of CS-g-GEL (a), and CS-g-GEL/SWCNTs (b), nitrogen sorption- desorption (c), and Pore size distribution of CS-g-GEL and CS-g-GEL/SWCNTs hydrogels (d).
BET surface area and BJH pore size distribution
Figure 4c displays the results of nitrogen adsorption–desorption isotherms for CS-g-GEL and CS-g-GEL/SWCNTs hydrogels. The CS-g-GEL hydrogel demonstrates a gradual increase in adsorbed amount as the relative pressure increases. At the maximum relative pressure of 0.99361, the amount adsorbed is 8.36805 cm3 g−1 STP. These findings suggest that there is only a moderate level of porosity and surface area, as the adsorption capacity does not significantly increase at higher pressures. The CS-g-GEL/SWCNTs hydrogel demonstrates a significantly greater adsorption capacity at all relative pressures. At the maximum relative pressure of 0.99596, the amount of adsorbed material reaches 49.76418 cm3 g−1 STP. This displays a significant improvement in porosity and surface area resulting from the inclusion of single-walled carbon nanotubes (SWCNTs). Based on the data, it is evident that the CS-g-GEL/SWCNTs hydrogel demonstrates better adsorption properties and a larger surface area compared to the CS-g-GEL hydrogel. This is evident from the higher quantity adsorbed even at lower relative pressures. Figure 4d displays the findings of the BET analysis for the CS-g-GEL hydrogel, specifically showing how the volume of pores is distributed across various pore widths. The pore volume reaches its maximum value of 0.01176 cm3 g−1 when the pore width is 33.53029 nm. Additional notable peaks are observed at pore widths of 22.72774 nm and 17.43237 nm, which correspond to pore volumes of 0.00944 and 0.00737 cm3 g−1, respectively. The distribution of the CS-g-GEL hydrogel indicates that it mainly consists of pores within the mesoporous range (2–50 nm). However, the pore volumes are very small, suggesting that the hydrogel has restricted porosity. CS-g-GEL/SWCNTs hydrogel illustrates a significantly different and improved distribution of pore volume in comparison to the CS-g-GEL hydrogel. The maximum pore volume, measuring 0.08569 cm3 g−1, is found when the pore width is 8.82333 nm. Additional significant peaks are observed with pore volumes of 0.08217 cm3 g−1 at 10.73221 nm and 0.0815 cm3 g−1 at 7.16699 nm. This hydrogel exhibits significant pore volumes throughout a spectrum of pore sizes, with a wide peak ranging from 3 to 25 nm, suggesting a greater abundance of small mesopores and an overall enhancement in porosity. The CS-g-GEL/SWCNTs hydrogel demonstrates much greater pore volumes across a wider spectrum of pore widths in comparison to the CS-g-GEL hydrogel. The addition of single-walled carbon nanotubes (SWCNTs) significantly increases the porosity of the hydrogel, making it more appropriate for applications that require a large surface area and porosity, such as adsorption and catalysis. CS-g-GEL/SWCNTs hydrogel exhibits improved surface characteristics, including enhanced pore volume and a wider range of pore sizes. It becomes evident that the inclusion of SWCNTs in the hydrogel matrix greatly improves its surface properties.
Morphological properties
Figure 5a, b displays FE-SEM results of the freeze-dried CS-g-GEL and CS-g-GEL/SWCNTs nanocomposite hydrogels. After freeze-drying, the Chitosan-g-Gelatin hydrogel displayed a dense structure, as shown in Fig. 5a. CS-g-GEL was observed to have uniform spheres of similar sizes within the hydrogel structure after loading SWCNTs into the hydrogel. This confirms the successful loading of SWCNTs into the CS-g-GEL/SWCNTs hydrogel (Fig. 5b). Figure 5c illustrates the cross-sectional morphology of CS-g-GEL hydrogel. The FE-SEM image reveals that the hydrogel has a microporous structure and a three-dimensional network of crosslinks, similar to other previously studied hydrogels. It is suggested that the interconnections between pores in CS-g-GEL hydrogel result from crosslinked networks. The porous structure of hydrogels allows them to swell, and their hydroxyl and amide groups allow them to bind MB more quickly. It was found that SWCNTs were well dispersed within the polymer matrix of the CS-g-GEL/SWCNTs nanocomposite hydrogel (Fig. 5d). SWCNTs can enhance the surface area available for MB dye adsorption.
Figure 5.

FESEM images of the freeze-dried of CS-g-GEL (a), and CS-g-GEL/SWCNTs (b) hydrogels, the cross-sectional of CS-g-GEL (c), CS-g-GEL/SWCNTs (d) and CS-g-GEL/SWCNTs containing dye (e) hydrogels.
It should be noted that following the adsorption of the MB dye onto the nanocomposites, the hydrogel became almost saturated, indicating that molecules of dye had filled the pores inside the nanocomposites (Fig. 5e).
The elemental composition of CS-g-GEL, CS-g-GEL/SWCNTs, and CS-g-GEL/SWCNTs containing dye was evaluated by EDX analysis. In Fig. 6a, carbon and oxygen are the most predominant components of CS-g-GEL. The EDX spectrum of the CS-g-GEL/SWCNTs hydrogel (Fig. 6b) shows the presence of carbon, oxygen, sulfur (S), and cobalt (Co) in small percentages. The detection of cobalt signifies the effective incorporation of single-walled carbon nanotubes (SWCNTs) into the hydrogel, as cobalt is commonly employed in the production of SWCNTs. The EDX examination of the CS-g-GEL/SWCNTs containing dye hydrogel (Fig. 6c) additionally reveals the presence of iron (Fe), along with carbon, oxygen, sulfur, and cobalt. The rise in carbon and sulfur content indicates that the MB dye has been well integrated into the hydrogel matrix. The EDX analysis provides conclusive proof of the successful incorporation of SWCNTs and dyes into the CS-g-GEL hydrogel, as indicated by the presence of new elemental peaks in the spectra of the modified hydrogels.
Figure 6.

EDX analysis of CS-g-GEL (a) CS-g-GEL/SWCNTs (b), and CS-g-GEL/SWCNTs containing dye (c) hydrogels, and XRD analysis of SWCNTs and CS-g-GEL/SWCNTs hydrogel (d).
XRD analysis
Figure 6d shows the results of the X-ray diffraction analysis of SWCNT and CS-g-GEL/SWCNT nanocomposite hydrogel. According to Fig. 6d, pristine SWCNTs exhibit peaks at 2θ = 11.89°, 25.73°, and 43.10°, which are assigned to the (001), (002), and (100) planes of graphitic carbon. There is a maximum peak at 25.73° associated with crystalline carbon, while there is a maximum peak at 43.10° related to disordered carbon40. No distinct peak was observed for the CS-g-GEL/SWCNT nanocomposite hydrogel, possibly because of the complete dispersion of SWCNT during the fabrication of the nanocomposite structure. Additionally, the formation of the nanocomposite involves interactions between the polymer matrix and SWCNTs, potentially leading to new bonding configurations that mask or alter the original crystalline patterns of SWCNTs. The presence of chitosan and gelatin could create a complex matrix that scatters X-rays differently, obscuring the typical diffraction patterns of SWCNTs. Also, This low concentration, coupled with the high dispersion, might not provide enough ordered structure to generate detectable diffraction peaks41. This indicates that the polymeric matrix has been totally incorporated with the SWCNT NPs.
This can result in the nanocomposite hydrogel having improved thermal properties and resistance. The basal plane of SWCNT disappears when CS-g-GEL/SWCNT nanocomposite hydrogel is formed, and a broad peak is replaced at 2θ = 12.113°–19.505°. CS-g-GEL/SWCNT hydrogel has some XRD pattern peaks, indicating an amorphous structure.
The effect of various parameters on the adsorption efficiency
Effect of SWCNTs
As depicted in Fig. 7a, b, adding SWCNT up to 20% weight was found to increase the removal (%) of adsorbent considerably. In terms of removal efficiency, the following increases were observed: 20% CS-g-GEL/SWCNTs (90.7%) > 15% CS-g-GEL/SWCNTs (83.5%) > 10% CS-g-GEL/SWCNTs (76.5%) > 7.5% CS-g-GEL/SWCNTs (73.3%) > CS-g-GEL (20.33%). Because SWCNT NPS display an inert chemical surface for the absorption of pollutants and have a large effective surface area, dye adsorption increases sharply with the weight percentage of SWCNT NPs within the hydrogel. Therefore, more dye than was initially added to the solution is eliminated, and this may be attributed to SWCNTs in the structure of nanocomposite adsorbent, which involves a more active site for the adsorption of MB. Furthermore, aromatic dye molecules like MB contain a conjugated electron system. This system of π–electrons can engage in π–π stacking interactions with the carbon atoms found in SWCNTs, leading to enhanced entrapment and elimination of dye molecules. Therefore, when the percentage of SWCNTs is 20% (related to a 98.87% maximum dye removal), the highest uptake is obtained, according to Fig. 7a, b.
Figure 7.

The effect of SWCNTs percentage (%) (a), photograph of visual changes at different of SWCNTs percentage (%) (b), the effect of different pH (c), photograph of visual changes at different pH (d), the effect of different amount of adsorbent dosage (e), and photograph of visual changes at different adsorbent dosage (f) on removal of MB dye.
Effect of pH
Figure 7c, d displays the results of the study of CS-g-GEL/SWCNTs adsorption capacities for 20 mg L−1 MB solution at various pH values (pH 3–10), while other parameters were kept constant at 1 g L−1 for the adsorbent, 10 mg L−1 for the dye, 60 min for the contact time, and 25 degrees for the temperature. There was a decrease in the adsorptive capacity for CS-g-GEL/SWCNTs with a decrease in the pH of the initial solution. At pH = 10, the highest adsorption capacity was observed for adsorbent (CS-g-GEL/SWCNTs), while at pH = 4, It was found to have the lowest adsorption capability. According to the results, the pH of the MB solution significantly affected the adsorption capacity of the hydrogel. Based on the results shown, an increase in pH from 9 to 10 significantly improved the removal percentage. The removal rate was 95.73% at pH = 10. Before pH = 9, the slope is relatively low, whereas after pH = 9, the slope is steep. With increasing solution pH, MB dye adsorption efficiency increased significantly, suggesting that chemical interactions might be involved in the adsorption mechanism, as shown by the FTIR analysis. MB is a cationic dye and carries a positive charge in its molecular structure. The positive charge is attributed to an abundance of quaternary ammonium ions within the dye molecule. These positively charged groups make MB highly soluble in water and enable it to interact with negatively charged surfaces or molecules through electrostatic interactions. The positively charged MB dye molecules can interact with negatively charged sites on the hydrogel surface (such as deprotonated amino groups in CS in pH over than 7) through electrostatic attractions. This allows for the adsorption of MB onto the hydrogel. The increased positive charge on the CS-g-GEL/SWCNTs hydrogel at higher pH promotes electrostatic attraction between the hydrogel and the MB dye molecules. This attraction allows for the adsorption of the dye onto the surface of the hydrogel through electrostatic interactions. The stronger the electrostatic attraction, the higher the adsorption efficiency. The presence of SWCNTs in the chitosan hydrogel introduces additional surface chemistry factors. SWCNTs have a high surface area and can provide adsorption sites for methylene blue molecules through van der Waals forces or π-π stacking interactions. The combination of CS and SWCNTs in the hydrogel structure creates a synergistic effect, enhancing the overall adsorption efficiency.
This lower adsorption occurs at lower pH levels since the composite surface charge had a positive charge, thereby creating a pH environment that prevented cationic MB from adsorbing. As mentioned before, since MB dye is cationic, the surface of the dye has an electrostatic charge where the adsorption sites are present. In addition, MB dye cannot approach chitosan surfaces due to the protonation of hydroxyl and amine groups42. This resulted in electrostatic repulsions between the dye molecule and the surface, causing a low percentage of dye removal.
Effect of adsorbent dose
As depicted in Fig. 7e, f, MB dye adsorption was investigated using different adsorbent dosages (0.5–4 g L−1). For CS-g-GEL/SWCNTs nanocomposite hydrogel, the removal (%) increased from 62 to 91% with an increase in hydrogel dosage from 0.5 to 1.5 g. By further increasing the amount of adsorbent, the removed MB percentage increased by less than 5%. As a result of the decrease in residual dye cations in the solution, there may be a slight increase in MB removal caused by low potential adsorption of adsorbate sites. An increase in adsorbent dosage may have resulted in increased availability of surface area and unsaturated active sites on the solution; therefore, more dye can be removed and adsorbed onto the hydrogel. Additionally, 1.5–2 g L−1 of adsorbent dose demonstrated the greatest adsorption efficiency since a further increase in efficiency was not detected above this level.
Effect of temperature and thermodynamic study
As shown in Fig. 8a, the temperature significantly affects the adsorbent. The adsorption efficiency of MB dye decreased significantly at temperatures between 25 and 45 °C. Consequently, the adsorption process was most efficient at a temperature of 25 °C. Adsorption could be adversely affected by heating because of the exothermic nature of the process. The decrease in surface activity can be attributed to an increase in temperature. MB dye molecules could be desorption from the surface of adsorbents at high temperatures due to weakened adsorption forces between dye molecules and adsorbents43. Thermodynamic parameters, including enthalpy (ΔH°), entropy (ΔS°), and Gibbs free energy (ΔG°), have been calculated using Eqs. (1), (2)).
| 1 |
| 2 |
Figure 8.

The effect of temperature on MB dye removal (a), the photograph of visual changes at different of temperatures on MB dye removal (b), and the Van-t-Hoff linear relationship for determining thermodynamic parameters (c).
In the given equations, KD (KD = qe/Ce) represents the equilibrium constant, R denotes the universal gas constant (8.314 J mol−1 K−1), and T signifies the absolute temperature in Kelvin (K).
Figure 8b and Table 2 present the result of the equation ln KD versus 1/T in the temperature range 25–45 °C as well as the slope (ΔH°) and intercept (ΔS°) calculated from the plot, respectively. A negative value of ΔG° suggests that adsorption is spontaneous and is desirable for the dye adsorption on CS-g-GEL/SWCNTs hydrogel. As temperature rises, the magnitude of ΔG° decreases, indicating less spontaneous adsorption. As temperature increases, ΔG° decreases, indicating that the adsorption process performs better at lower temperatures. Table 2 shows the thermodynamic parameters associated with the adsorption process of the MB dye by plotting ln KD vs. 1/T. CS-g-GEL/SWCNTs nanocomposite hydrogel was shown to have an ΔH° value of − 87.629 kJ mol−1, which indicates an exothermic adsorption process with the importance of temperature being emphasized44. This implies that heat is released during the adsorption of MB dye onto the hydrogel. Furthermore, a negative value was found for the ΔS° parameter, indicating no random collision between the MB dye molecules and the surface of the adsorbent, indicating that random collisions were reduced. The negative entropy change suggests that the dye molecules are more ordered on the hydrogel surface compared to their state in the solution41.
Table 2.
MB dye thermodynamic parameters using CS-g-GEL hydrogels containing SWCNTs.
| Adsorbent | T (oC) | ΔG° (KJ mol−1) | ΔH° (KJ mol−1) | ΔS° (J mol−1 K−1) |
|---|---|---|---|---|
| CS-g-GEL/SWCNTs hydrogel | 25 | − 8.540 | − 87.629 | − 265.540 |
| 30 | − 7.707 | |||
| 35 | − 5.118 | |||
| 40 | − 4.112 | |||
| 45 | − 3.739 |
Effect of time and kinetic study
In wastewater treatment systems, equilibrium contact time plays a critical role45. Adsorbents employed in wastewater treatment systems are most effective when they can adsorb contaminants (including dyes and heavy metals) and attain an equilibrium within a short time after being added to the system41. According to Fig. 9a, b, contact time (10–250 min) significantly affects adsorption efficiency. As the contact time increased up to 80 min, the adsorption efficiency increased. An increase in contact time may lead to an increase in MB dye adsorption efficiency because the surface and empty active sites suffice to place the dye molecules. The equilibrium of the adsorption process was reached after 80 min.
Figure 9.

The effect of contact time (a), the photograph of visual changes at different contact time (b), the non-linear relationship of kinetic models for MB dye adsorption process (c), and linear relationship for intra-particle diffusion model (d) (at pH: 10, optimal adsorbent dose, temperature:25 °C, dye concentration: 20 mg L−1, mixing speed of 500 rpm).
It is important to note that kinetic behavior plays an important role in controlling the quantity of contaminant adsorbing and the time required for the adsorption process. In the time range of 10–250 min, the kinetic behavior of the MB dye adsorption was investigated using the CS-g-GEL/SWCNTs hydrogel as an adsorbent. Various kinetic models, including pseudo-first order (PFO), pseudo-second-order (PSO), Elovich, and intra-particle diffusion were determined using Eqs. (3)–(5)46:
| 3 |
| 4 |
| 5 |
where qt and qe correspond to dye adsorption capacities per grams of dry adsorbent (mg g−1), k1 refers to the constant rate of adsorption (min−1), k2 corresponds to the pseudo-second-order kinetic rate (g mg−1 min−1), α indicates the initial absorbance (mg g−1 min−1), and β indicates the desorption constant (g mg−1).
As can be seen in Fig. 9c and Table 3, the non-linear relationship between PFO, PSO, and Elovich kinetic models are used to determine the variables for MB dye adsorption using adsorbent. The PFO model parameters for the CS-g-GEL/SWCNTs hydrogel show a calculated equilibrium adsorption capacity (qe cal) of 29.385 mg g−1 and a rate constant (K1) of 0.178. The R2 value of 0.724 and adjusted R2 of 0.697 suggest a moderate fit to the experimental data. This indicates that the adsorption process may not fully follow the PFO kinetics, implying that other mechanisms might be involved. The PSO model provides a much better fit with an R2 value of 0.968 and an adjusted R2 of 0.965. The calculated equilibrium adsorption capacity (qe cal) is 30.448 mg g−1, and the rate constant (K2) is 0.014. Results show that the adsorption process follows the PSO model regarding its kinetic behavior since it has a higher correlation coefficient. For the Elovich model, the parameters α and β are 4.004 mg g−1 min−1 and 0.654 g mg−1, respectively. The α parameter for CS-g-GEL/SWCNTs hydrogel suggests higher MB dye adsorption efficiency of CS-g-GEL/SWCNTs hydrogel adsorbent46. The R2 value of 0.861 and adjusted R2 of 0.847 suggest a reasonably good fit. This model indicates that the adsorption process may involve heterogeneous surfaces and suggests a complex adsorption mechanism.
Table 3.
The kinetic constants and parameters for adsorption by using CS-g-GEL/SWCNTs hydrogel.
| Kinetic model | CS-g-GEL/SWCNTs hydrogel |
|---|---|
| Pseudo-first order model | |
| qe cal | 29.385 |
| K1 | 0.178 |
| R2 | 0.724 |
| Adj. R2 | 0.697 |
| Pseudo-second order model | |
| qe.cal | 30.448 |
| K2 | 0.014 |
| R2 | 0.968 |
| Adj. R2 | 0.965 |
| Elovich | |
| α (mg g−1 min−1) | 4.004 |
| β (g mg−1) | 0.654 |
| R2 | 0.861 |
| Adj. R2 | 0.847 |
| Intra-particle diffusion model | |
| Ki,1 (mg (g min1/2)−1) | 0.025 |
| I1 (mg g−1) | 29.780 |
| R2 | 0.898 |
| Ki,2 (mg (g min1/2)−1) | 0.793 |
| I2 (mg g−1) | 23.214 |
| R2 | 0.900 |
Various studies have used the intra-particle diffusion model to study the kinetics of dye adsorption, predicting that dye adsorption capacity changes with t1/247. The intra-particle diffusion model's linear dependence is demonstrated in Eq. (6):
| 6 |
where Kint (mg (g min1/2)−1) corresponds to the intra-particle diffusion rate, determined based on the slope of the qt versus t1/2 (Fig. 9d). Based on this model, it can be concluded that the intra-particle diffusion will be the limiting step in the adsorption; if the qt plot vs. t1/2 can be plotted as a straight line, and if it cannot be plotted as a straight line, then the liquid film diffusion will be the limiting step48. There is a list of parameters and the correlation coefficient (R2) associated with the intra-particle diffusion model in Table 3. Figure 9d shows that a diagram of qt versus t1/2 for MB dye adsorption shows a non-linear relationship, suggesting that the adsorption process involves complex processes that include adsorption and intra-particle diffusion49.
Effect of initial concentration of MB dye and isotherm study
An analysis of the effect of the initial concentration of MB dye ranging from 10 to 100 mg L−1 on removal efficiency is shown in Fig. 10a, b. It was found that a dye concentration of 10 mg L−1 produced the highest adsorption efficiency (98.6%). The results of our study indicate that the initial dye concentration can be one of the negative factors affecting the adsorption efficiency. A decrease in adsorption efficiency was observed as dye concentration increased. Depending on the initial concentration of contaminants, the amount of adsorption can change significantly. It is important to note that both active sites and concentration gradients are essential in determining the initial concentration. Typically, an increase in the initial dye concentration results in a decrease in the percentage of dye removal. This is due to the fact that the total number of active sites available for dye adsorption remains constant. When the concentration is low, there will be more active sites. As concentrations increase, these sites are expected to be able to fill up more rapidly. Thus, the adsorption capacity increases with increasing initial concentrations (Fig. 10a, b). The higher gradient in contaminant concentration is most likely responsible for this phenomenon. Moreover, high concentrations of dye molecules can potentially reduce the availability of active sites on the adsorbent surface or intensify the electrostatic repulsion between the adsorbent surface and the MB molecules50.
Figure 10.

The effect of initial concentration of MB dye on the removal efficiency, the photograph of visual changes of different initial concentration (b), the relation between non-linear isotherm models and MB dye adsorption using CS-g-GEL/SWCNTs (c), and reusability of CS-g-GEL/SWCNTs hydrogel.
It is important to study equilibrium concentration when it comes to the adsorption process since it indicates how the adsorbed phase (contaminant) can be related to the surface of the adsorbate. Several isotherm models can be employed in order to study equilibrium behavior. Langmuir, Freundlich, and Temkin models were utilized to examine the isotherms in this study. The nonlinear correlation of the isotherm models is given by Eqs. (7)–(9), respectively.
| 7 |
| 8 |
| 9 |
where qe refers to equilibrium adsorption capacities and qm refers to maximum adsorption capacities (mg g−1), kL represents the Langmuir constant, kf represents the Freundlich constant, and n represents the Freundlich parameter. A and B are parameters in the Temkin isotherm equation, which is used to describe the adsorption process. A represents the adsorption efficiency, while B represents the energy of adsorption.
Figure 10c and Table 4 for the non-linear relationship between the isotherm models present adsorption process constants and variables obtained for MB dye adsorption of adsorbent. The Freundlich isotherm has a value n of 2.297, suggesting favorable adsorption conditions and a heterogeneous surface51. The Freundlich constant (Kf) is 14.309 (mg g−1 (L mg−1)1/n), indicating the hydrogel’s adsorption capability. The results show that based on equilibrium data, the Freundlich model fits the MB dye adsorption using CS-g-GEL/SWCNTs (with a higher R2). Therefore, the Freundlich isotherm model describes the adsorption equilibrium. As a result, it may be suggested that heterogeneous surfaces have a greater role than homogeneous surfaces in the adsorption of the investigated dye. The Langmuir isotherm model parameters for the CS-g-GEL/SWCNTs hydrogel show a maximum adsorption capacity (qm) of 69.919 mg g−1. This relatively high value shows that the hydrogel has considerable adsorption capability. The Langmuir constant (KL) is 0.155 L mg−1, indicating the affinity between the adsorbent and adsorbate. The separation factor (RL) ranges from 0.060 to 0.243, suggesting good adsorption (0 < RL < 1). The Temkin isotherm values show a heat of adsorption (bT) of 12.520 kJ mol−1, indicating physical adsorption. The Temkin constant (AT) of 2.831 L g−1 represents the adsorption potential. The Temkin model is reasonably well-fitted, as indicated by the R2 value of 0.889. This model assumes that the adsorption energy decreases linearly with surface coverage due to adsorbent-adsorbate interactions46.
Table 4.
MB dye adsorption constants and parameters obtained from isotherm models.
| Models | Parameters | CS-g-GEL/SWCNTs hydrogel |
|---|---|---|
| Langmuir | qm (mg g−1) | 69.919 |
| KL (L mg−1) | 0.155 | |
| R2 | 0.893 | |
| RL | 0.060–0.243 | |
| Freundlich | n | 2.297 |
| Kf (mg g−1 (L mg−1)1/n) | 14.309 | |
| R2 | 0.963 | |
| Temkin | bT (kJ mol−1) | 12.520 |
| AT (L g−1) | 2.831 | |
| R2 | 0.889 |
Reusability and desorption studies
The reusability and regeneration of adsorbents are essential in practical applications. Adsorption–desorption cycle experiments were conducted in order to determine the effectiveness of regeneration of the CS-g-GEL/SWCNTs nanocomposite hydrogel. The diagram of the adsorption–desorption cycle is shown in Fig. 10d, showing the desorption of the hydrogel with a hydrochloric acid solution after MB adsorption. A protonation process under acidic conditions led to the desorption of contaminants from the hydrogel. According to Fig. 10d, adsorption efficiency decreased from 97.54 to 84.27% after five cycles, and the adsorption amount gradually decreased. Compared to previous studies, the dye removal of CS-g-GEL/SWCNTs nanocomposite hydrogel reached 85% after five cycles, a higher percentage than the dye removal of previously studied materials52–54. Because of the strong chemical interactions between dye molecules and the hydrogel surface, specific active sites may be occluded by dye molecules and become challenging to desorb55. FT-IR analysis was performed on the hydrogel retrieved, which did not show any degradation (Fig. 11). Based on the FT-IR spectra of the recovered hydrogel, the structure of the gel appears to be intact and stable. Comparing this to the recovered hydrogel after the 5th runs (b), there is a notable shift and intensity change in the peaks. The peak at 1245 cm−1 could correspond to C–N stretching vibrations, indicating possible cross-linking or interaction changes after the hydrogel was used multiple times. The appearance of a peak at 895 cm−1 in the recovered hydrogel could be due to Si–O–Si asymmetric stretching vibrations, suggesting potential interactions with MB dye.
Figure 11.
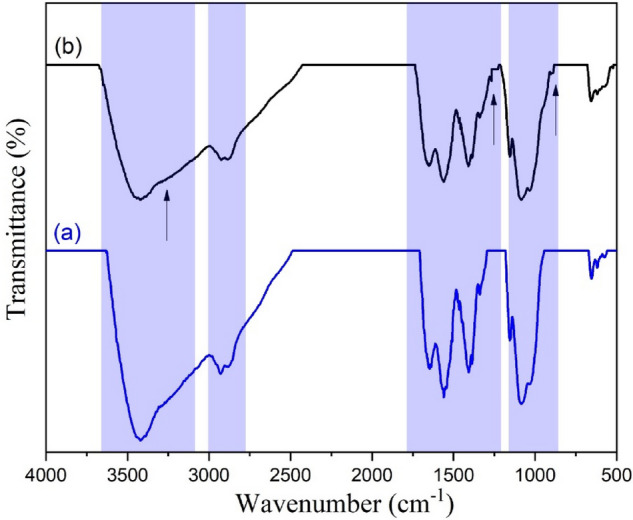
FT-IR spectra CS-g-GEL/SWCNTs nanocomposite hydrogel: (a) fresh hydrogel, (b) recovered hydrogel after 5th runs.
Mechanism of adsorption
The specific surface area and the chemistry of an adsorbent are important factors in determining its adsorption capacity. The specific surface area and the chemistry of an adsorbent are important factors in determining its adsorption capacity. The porosity and morphology of the adsorbent are the first factors. The latter, however, is closely related to the surface area of the adsorbent and its reactivity and density. When the surface of the adsorbent is impregnated with SWCNTs, some pores are blocked. However, this also introduces large numbers of reactive functional sites. Molecular interactions between MB and CS functional groups can occur via covalent, electrostatic, and hydrogen bonds. The surface of SWCNTs can also increase the adsorption of the material surface. In addition, aromatic dye molecules like MB exhibit a conjugated system of electrons. This system of π-electrons can engage in π–π stacking interactions with the carbon atoms found in SWCNTs. A schematic representation of CS-g-GEL/SWCNTs hydrogel and MB interactions is shown in Fig. 12. Table 5 shows CS-g-GEL/SWCNTs hydrogel adsorption capacity compared with other adsorbents utilized in the MB dye adsorption.
Figure 12.

Adsorption mechanism of CS-g-GEL/SWCNTs hydrogel and MB dye.
Table 5.
CS-g-GEL/SWCNTs hydrogel adsorption capacity compared with other adsorbents utilized in the MB dye adsorption.
| Adsorbent | Maximum adsorption capacity (mg g−1) for MB dye | References |
|---|---|---|
| MIL-101(Cr) | 22 | 40 |
| Wheat shells | 21.50 | 49 |
| CMC/kC/AMMT composite beads | 10.75 | 56 |
| Starch-based high-performance adsorptive hydrogel | 296.766 | 57 |
| N-isopropylacrylamide/itaconic acid/pumice composite hydrogel | 22.18 | 58 |
| Poly(AMPS-co-IA) | 24.10 | 59 |
| Activated lignin-chitosan composite extrudates | 36.25 | 60 |
| CS-g-GEL/SWCNTs | 69.91 | Present study |
Conclusion
Dyes and pigments primarily pollute wastewater streams from various industries. CS-g-GEL/SWCNTs hydrogels have been developed to remove MB dye from an aqueous solution. FTIR, TGA, XRD, and FE-SEM studies confirmed that the synthesized hydrogels were successfully prepared, and SWCNTs were incorporated into CS-g-GEL/SWCNTs hydrogels. The maximum adsorption was observed for pH = 9, an adsorbent dose = 1.5 g L−1, a temperature = 25 °C, a contact time = 60 min, and a contaminant concentration = 20 mg L−1. Regarding thermal stability, the CS-g-GEL/SWCNTs hydrogels showed enhanced properties. The adsorption process was also explained and hypothesized using kinetic, isothermal, and thermodynamic models. CS-g-GEL/SWCNTs nanocomposite hydrogel has several advantages, including being nontoxic, affordable, and easily separable. According to FE-SEM, the surface of adsorbents has many surface pores that may contribute to MB dye adsorption efficiency. The thermodynamic findings indicated that spontaneous adsorption started at a negative Gibbs free energy (ΔG°). Furthermore, the adsorption process’s average enthalpy at a temperature range of 25–45 °C was found to be − 21.869 kJ mol−1 by thermodynamic analysis, indicating that it behaves exothermically and spontaneously. It was successful to explain the equilibrium behavior of adsorption using the Langmuir isotherm model. In comparison to the intra-particle, Elovich, and pseudo-second-order models, the pseudo-first-order model provided a more accurate description of adsorption kinetics. These nanocomposite hydrogels were found to have significantly higher adsorption performance than other adsorbents reported previously because of their excellent reusability for five successive cycles. Based on the presented results, the formulation of CS-g-GEL/SWCNTs nanocomposite hydrogels provides a suitable method for removing MB dye from aqueous solutions and purifying dye-containing aqueous solutions.
Experimental
Materials and chemicals
Chitosan with medium molecular weight (MW 200,000 and 98% deacetylation), Methylene blue, and gelatin type A from porcine skin were obtained from Sigma-Aldrich. Glacial acetic acid, formaldehyde 37%, ammonia 25% were obtained from Merck (Darmstadt, Germany). Ethanol (≥ 99.8%) was obtained from Neutron Pharmachemical, Tehran, Iran. SWCNTs were acquired from the Research Institute of Petroleum Industry (RIPI) in Tehran, Iran. The SWCNTs were synthesized using the catalytic chemical vapor deposition (CCVD) method.
Synthesis method
CS-g-GEL hydrogel has been prepared similarly to the recently reported method for multi-responsive nanohydrogel networks of chitosan20. In order to produce CS-g-GEL, 1200 mg of CS was dissolved in a 1% (v/v) acetic acid solution. After stirring with a magnetic stirrer for eight hours, a clear CS solution was obtained. In the next step, 5 mL of 37% formaldehyde was added slowly. After adding 500 mg of GEL as a crosslinking agent to the CS solution, the mixture was stirred using a magnetic stirrer for a duration of six hours. To disperse SWCNTs completely, a concentration of 0–20 wt.% of SWCNTs was added to the mixture. Subsequently, the mixture was subjected to sonication at a temperature of 25 °C for a duration of 20 min. This process ensured the thorough dispersion of the nanotubes. The hydrogel was then formed by adding 25% ammonia solution (20 mL) immediately. To ensure the removal of any unreacted and unbonded materials within the hydrogel, it was rinsed several times with ethanol and methanol and filtered using a vacuum pump. Afterward, it was placed in a vacuum oven for drying at 50 °C.
Characterization of hydrogels
The XRD spectrum was utilized to examine the structure of SWCNT and CS-g-GEL/SWCNT nanocomposite hydrogel using Siemens D500 with a scanning speed of 1/min and wavelength of 1.5048 Å. 1H NMR spectrum was measured on an Avance Bruker DRX-500 spectrometer. Deuterium (D2O) was employed as the solvent, and the signal from the solvent was used to calibrate the system. (D2O): δ (1H) = 4.79 ppm. As part of the study, Fourier transforms infrared (FTIR) spectra were obtained without further sample preparation using an Agilent Cary 630 FTIR spectrometer (Agilent Technologies/EUA). Field emission Scanning Electron Microscopy (FE-SEM) and the energy-dispersive X-ray (EDX) of the samples were studied using a Mira III Model TeScan device (Czech Republic). Thermogravimetric analysis (TGA) was carried out using an STA 449F3 Calorimeter manufactured by Netzsch/Germany (Model TGA 50, Japan). The experiment involved Running the sample through a heating process at 10 °C min−1 in a nitrogen atmosphere, covering a temperature range of 25–600 °C. Brunauer–Emmett–Teller (BET) and Barrett-Joyner-Halenda (BJH) measurements were performed on hydrogels using a surface area analyzer (Quadrasorb 2 MP, Quantachrome Instruments, USA).
Adsorption study of hydrogels
MB dye adsorption was carried out discontinuously in 100 ml flasks using CS-g-GEL/SWCNTs nanocomposite hydrogel. Firstly, the effect of SWCNTs amount, ranging from 0 to 20 wt.% was assessed on the adsorption efficiency. In the next step, HCl and NaOH (0.1 M) were used to regulate the pH of aqueous solutions, and 500 mg L−1 of the Cs-g-GEL nanocomposite was added to a solution that contained MB dye (10 mg L−1) and stirred for 60 min at 25 °C. A spectrophotometer equipped with UV–Vis was used to measure the concentration of MB dye in the aqueous media after the CS-g-GEL/SWCNTs nanocomposite hydrogels were separated from the liquid phase. After determining the optimal pH, other parameters were evaluated to determine their effect on MB dye removal at the optimum pH. Several parameters were determined to be used in the experiment, which included the temperature (25–45 °C), adsorbent content (0.5–4 g L−1), contact time (10–250 min), and MB dye concentration (10–100 mg L−1). MB adsorption tests were conducted at each step by the investigated adsorbent in three replicas, with an average value calculated. The adsorption capacity (qt, mg g−1) and removal (R (%)) can be calculated using the following equation:
| 10 |
| 11 |
In the given equation, Ci represents the initial concentration of MB dye in grams per liter (g L−1), Ce represents the final concentration of MB dye in grams per liter (g L−1), V represents the volume of the solution used in liters (L), and m represents the mass of the dry adsorbent used in grams (g).
Supplementary Information
Author contributions
CRediT authorship contribution statement Conceptualization: B.F.F., M.J.; Data curation: F.B., M.J. and B.F.F.; Formal analysis: B.F.F. and S.K.; Investigation: B.F.F. and M.J.; Methodology: M.J. and B.F.F.; Project administration: B.F.F.; Resources: B.F.F.; Software: M.J., S.K. and B.F.F.; Supervision: M.R.N.; Validation: M.R.N., B.F.F. and M.J.; Visualization: B.F.F. and M.J.; Roles/Writing—original draft: B.F.F., F.B., and M.J.; Writing—review & editing: F.B., M.J. and B.F.F. All authors reviewed the manuscript.
Data availability
All data generated or analysed during this study are included in this published article and its supplementary information files.
Competing Interests
The authors declare no competing interests.
Footnotes
Publisher's note
Springer Nature remains neutral with regard to jurisdictional claims in published maps and institutional affiliations.
Supplementary Information
The online version contains supplementary material available at 10.1038/s41598-024-69969-1.
References
- 1.Rubangakene, N. O. et al. Effective decontamination of methylene blue from aqueous solutions using novel nano-magnetic biochar from green pea peels. Environ. Res.220, 115272. 10.1016/j.envres.2023.115272 (2023). 10.1016/j.envres.2023.115272 [DOI] [PubMed] [Google Scholar]
- 2.Bazzazan, S. et al. Engineered UIO-66 metal-organic framework for delivery of curcumin against breast cancer cells: An in vitro evaluation. J. Drug Deliv. Sci. Technol.79, 104009. 10.1016/j.jddst.2022.104009 (2023). 10.1016/j.jddst.2022.104009 [DOI] [Google Scholar]
- 3.Rubangakene, N. O. et al. Biosorption of Congo Red dye from aqueous solutions using pristine biochar and ZnO biochar from green pea peels. Chem. Eng. Res. Design189, 636–651. 10.1016/j.cherd.2022.12.003 (2023). 10.1016/j.cherd.2022.12.003 [DOI] [Google Scholar]
- 4.Unuabonah, E. I., Adebowale, K. O. & Dawodu, F. A. Equilibrium, kinetic and sorber design studies on the adsorption of Aniline blue dye by sodium tetraborate-modified Kaolinite clay adsorbent. J. Hazard. Mater.157, 397–409. 10.1016/j.jhazmat.2008.01.047 (2008). 10.1016/j.jhazmat.2008.01.047 [DOI] [PubMed] [Google Scholar]
- 5.Rahmi, I. & Mustafa, I. Methylene blue removal from water using H2SO4 crosslinked magnetic chitosan nanocomposite beads. Microchem. J.144, 397–402. 10.1016/j.microc.2018.09.032 (2019). 10.1016/j.microc.2018.09.032 [DOI] [Google Scholar]
- 6.Lakkaboyana, S. K., Khantong, S., Asmel, N. K., Yuzir, A. & Wan-Yaacob, W. Z. Synthesis of copper oxide nanowires-activated carbon (AC@CuO-NWs) and applied for removal methylene blue from aqueous solution: Kinetics, isotherms, and thermodynamics. J. Inorg. Organometal. Polym. Mater.29, 1658–1668. 10.1007/s10904-019-01128-w (2019). 10.1007/s10904-019-01128-w [DOI] [Google Scholar]
- 7.Uko, L., Noby, H., Zkria, A. & ElKady, M. Electrospraying of bio-based chitosan microcapsules using novel mixed cross-linker: Experimental and response surface methodology optimization. Materials15, 23 (2022). 10.3390/ma15238447 [DOI] [PMC free article] [PubMed] [Google Scholar]
- 8.Lakkaboyana, S. K. et al. Synthesis and characterization of Cu(OH)2-NWs-PVA-AC Nano-composite and its use as an efficient adsorbent for removal of methylene blue. Sci. Rep.11, 5686. 10.1038/s41598-021-84797-3 (2021). 10.1038/s41598-021-84797-3 [DOI] [PMC free article] [PubMed] [Google Scholar]
- 9.Pavan, F. A., Mazzocato, A. C. & Gushikem, Y. Removal of methylene blue dye from aqueous solutions by adsorption using yellow passion fruit peel as adsorbent. Bioresourc. Technol.99, 3162–3165. 10.1016/j.biortech.2007.05.067 (2008). 10.1016/j.biortech.2007.05.067 [DOI] [PubMed] [Google Scholar]
- 10.Elkady, M. F. & Hassan, H. S. Photocatalytic degradation of malachite green dye from aqueous solution using environmentally compatible Ag/ZnO polymeric nanofibers. Polymers13, 2033 (2021). 10.3390/polym13132033 [DOI] [PMC free article] [PubMed] [Google Scholar]
- 11.Vallinayagam, S. et al. Recent developments in magnetic nanoparticles and nano-composites for wastewater treatment. J. Environ. Chem. Eng.9, 106553. 10.1016/j.jece.2021.106553 (2021). 10.1016/j.jece.2021.106553 [DOI] [Google Scholar]
- 12.Cheng, Y. et al. Exploring the potential of a polyvinyl alcohol/chitosan-based nanofibrous matrix for erythromycin delivery: Fabrication, in vitro and in vivo evaluation. RSC Adv.13, 18450–18460. 10.1039/D3RA02987E (2023). 10.1039/D3RA02987E [DOI] [PMC free article] [PubMed] [Google Scholar]
- 13.Lakkaboyana, S. K., Soontarapa, K., Vinaykumar-Marella, R. K. & Kannan, K. Preparation of novel chitosan polymeric nanocomposite as an efficient material for the removal of Acid Blue 25 from aqueous environment. Int. J. Biol. Macromol.168, 760–768. 10.1016/j.ijbiomac.2020.11.133 (2021). 10.1016/j.ijbiomac.2020.11.133 [DOI] [PubMed] [Google Scholar]
- 14.Jahanbakhshi, M. & Shahrousvand, M. Preparation and characterization of cross-linked poly (vinyl alcohol-co-methyl methacrylate) colloidal nanoparticles from hydrolysis of poly (vinyl acetate-co-methyl methacrylate) as a promising cancer drug delivery system. Int. J. Polym. Mater. Polym. Biomater.73, 250–265 (2024). 10.1080/00914037.2022.2155158 [DOI] [Google Scholar]
- 15.Jawad, A. H., Abdulhameed, A. S., Malek, N. N. A. & Alothman, Z. A. Statistical optimization and modeling for color removal and COD reduction of reactive blue 19 dye by mesoporous chitosan-epichlorohydrin/kaolin clay composite. Int. J. Biol. Macromol.164, 4218–4230. 10.1016/j.ijbiomac.2020.08.201 (2020). 10.1016/j.ijbiomac.2020.08.201 [DOI] [PubMed] [Google Scholar]
- 16.Khanday, W. A., Asif, M. & Hameed, B. H. Cross-linked beads of activated oil palm ash zeolite/chitosan composite as a bio-adsorbent for the removal of methylene blue and acid blue 29 dyes. Int. J. Biol. Macromol.95, 895–902. 10.1016/j.ijbiomac.2016.10.075 (2017). 10.1016/j.ijbiomac.2016.10.075 [DOI] [PubMed] [Google Scholar]
- 17.Bahalkeh, F., Habibi-juybari, M., Zafar-Mehrabian, R. & Ebadi, M. Removal of Brilliant Red dye (Brilliant Red E-4BA) from wastewater using novel Chitosan/SBA-15 nanofiber. Int. J. Biol. Macromol.164, 818–825. 10.1016/j.ijbiomac.2020.07.035 (2020). 10.1016/j.ijbiomac.2020.07.035 [DOI] [PubMed] [Google Scholar]
- 18.Farasati Far, B. et al. A Review on biomedical application of polysaccharide-based hydrogels with a focus on drug delivery systems. Polymers14, 5432 (2022). 10.3390/polym14245432 [DOI] [PMC free article] [PubMed] [Google Scholar]
- 19.Farasati-Far, B. et al. An updated review on advances in hydrogel-based nanoparticles for liver cancer treatment. Livers3, 161–189 (2023). 10.3390/livers3020012 [DOI] [Google Scholar]
- 20.Farasati Far, B., Omrani, M., Naimi Jamal, M. R. & Javanshir, S. Multi-responsive chitosan-based hydrogels for controlled release of vincristine. Commun. Chem.6, 28. 10.1038/s42004-023-00829-1 (2023). 10.1038/s42004-023-00829-1 [DOI] [PMC free article] [PubMed] [Google Scholar]
- 21.Hu, W., Wang, Z., Xiao, Y., Zhang, S. & Wang, J. Advances in crosslinking strategies of biomedical hydrogels. Biomater. Sci.7, 843–855. 10.1039/C8BM01246F (2019). 10.1039/C8BM01246F [DOI] [PubMed] [Google Scholar]
- 22.Gonçalves, J. O. et al. Chitosan hydrogel scaffold modified with carbon nanotubes and its application for food dyes removal in single and binary aqueous systems. Int. J. Biol. Macromol.142, 85–93. 10.1016/j.ijbiomac.2019.09.074 (2020). 10.1016/j.ijbiomac.2019.09.074 [DOI] [PubMed] [Google Scholar]
- 23.Liu, Y., Huang, S., Zhao, X. & Zhang, Y. Fabrication of three-dimensional porous β-cyclodextrin/chitosan functionalized graphene oxide hydrogel for methylene blue removal from aqueous solution. Colloids Surfaces A: Physicochem. Eng. Aspects539, 1–10. 10.1016/j.colsurfa.2017.11.066 (2018). 10.1016/j.colsurfa.2017.11.066 [DOI] [Google Scholar]
- 24.Farasati-Far, B. et al. Poly(3-thienylboronic acid) coated magnetic nanoparticles as a magnetic solid-phase adsorbent for extraction of methamphetamine from urine samples. J. Dispers. Sci. Technol.1–11, 2022. 10.1080/01932691.2022.2124169 (2022). 10.1080/01932691.2022.2124169 [DOI] [Google Scholar]
- 25.Dastneshan, A. et al. Cefazolin encapsulated UIO-66-NH2 nanoparticles enhance the antibacterial activity and biofilm inhibition against drug-resistant S. aureus: In vitro and in vivo studies. Chem. Eng. J.455, 140544. 10.1016/j.cej.2022.140544 (2023). 10.1016/j.cej.2022.140544 [DOI] [Google Scholar]
- 26.Hannachi, E., Almessiere, M. A., Slimani, Y., Baykal, A. & Ben Azzouz, F. AC susceptibility investigation of YBCO superconductor added by carbon nanotubes. J. Alloys Compd.812, 152150. 10.1016/j.jallcom.2019.152150 (2020). 10.1016/j.jallcom.2019.152150 [DOI] [Google Scholar]
- 27.Aqel, A., El-Nour, K. M. M. A., Ammar, R. A. A. & Al-Warthan, A. Carbon nanotubes, science and technology part (I) structure, synthesis and characterisation. Arab. J. Chem.5, 1–23. 10.1016/j.arabjc.2010.08.022 (2012). 10.1016/j.arabjc.2010.08.022 [DOI] [Google Scholar]
- 28.Jayalakshmi, R. & Jeyanthi, J. Spectroscopic investigation of carbon nanotube as nano-filler entrapped in chitosan hydrogel beads. J. Mol. Struct.1237, 130386. 10.1016/j.molstruc.2021.130386 (2021). 10.1016/j.molstruc.2021.130386 [DOI] [Google Scholar]
- 29.Shahidi, S. & Moazzenchi, B. Carbon nanotube and its applications in textile industry—a review. J. Textile Inst.109, 1653–1666. 10.1080/00405000.2018.1437114 (2018). 10.1080/00405000.2018.1437114 [DOI] [Google Scholar]
- 30.Hosseini, S. et al. Fabrication of pH-responsive amphiphilic poly(vinyl alcohol-methyl methacrylate) copolymer nanoparticles for application in cancer drug delivery systems. Iran. J. Sci.48, 99–111. 10.1007/s40995-023-01573-w (2024). 10.1007/s40995-023-01573-w [DOI] [Google Scholar]
- 31.Jahanbakhshi, M. & Shahrousvand, M. Modeling and Control of Drug Delivery Systems 67–77 (Elsevier, 2021). [Google Scholar]
- 32.Makhado, E. & Hato, M. J. Preparation and characterization of sodium alginate-based oxidized multi-walled carbon nanotubes hydrogel nanocomposite and its adsorption behaviour for methylene blue dye. Front. Chem.9, 145. 10.3389/fchem.2021.576913 (2021). 10.3389/fchem.2021.576913 [DOI] [PMC free article] [PubMed] [Google Scholar]
- 33.Copello, G. J., Mebert, A. M., Raineri, M., Pesenti, M. P. & Diaz, L. E. Removal of dyes from water using chitosan hydrogel/SiO2 and chitin hydrogel/SiO2 hybrid materials obtained by the sol–gel method. J. Hazard. Mater.186, 932–939. 10.1016/j.jhazmat.2010.11.097 (2011). 10.1016/j.jhazmat.2010.11.097 [DOI] [PubMed] [Google Scholar]
- 34.Ma, J. et al. Magnetic graphene oxide-containing chitosan-sodium alginate hydrogel beads for highly efficient and sustainable removal of cationic dyes. Int. J. Biol. Macromol.193, 2221–2231. 10.1016/j.ijbiomac.2021.11.054 (2021). 10.1016/j.ijbiomac.2021.11.054 [DOI] [PubMed] [Google Scholar]
- 35.Brossier, T. et al. Photoprintable gelatin-graft-poly(trimethylene carbonate) by stereolithography for tissue engineering applications. Biomacromolecules22, 3873–3883. 10.1021/acs.biomac.1c00687 (2021). 10.1021/acs.biomac.1c00687 [DOI] [PubMed] [Google Scholar]
- 36.Farasati Far, B. et al. Synthesis and characterization of chitosan/collagen/polycaprolactone hydrogel films with enhanced biocompatibility and hydrophilicity for artificial tendon applications. Int. J. Biol. Macromol.253, 127448. 10.1016/j.ijbiomac.2023.127448 (2023). 10.1016/j.ijbiomac.2023.127448 [DOI] [PubMed] [Google Scholar]
- 37.Farasati Far, B. et al. Enhanced antibacterial activity of porous chitosan-based hydrogels crosslinked with gelatin and metal ions. Sci. Rep.14, 7505. 10.1038/s41598-024-58174-9 (2024). 10.1038/s41598-024-58174-9 [DOI] [PMC free article] [PubMed] [Google Scholar]
- 38.Yakymchuk, O. M., Perepelytsina, O. M., Dobrydnev, A. V. & Sydorenko, M. V. Effect of single-walled carbon nanotubes on tumor cells viability and formation of multicellular tumor spheroids. Nanoscale Res. Lett.10, 150. 10.1186/s11671-015-0858-7 (2015). 10.1186/s11671-015-0858-7 [DOI] [PMC free article] [PubMed] [Google Scholar]
- 39.Venkatesan, J., Jayakumar, R., Mohandas, A., Bhatnagar, I. & Kim, S.-K. Antimicrobial activity of chitosan-carbon nanotube hydrogels. Materials7, 3946–3955 (2014). 10.3390/ma7053946 [DOI] [PMC free article] [PubMed] [Google Scholar]
- 40.Sapkota, K. P., Lee, I., Hanif, M. A., Islam, M. A. & Hahn, J. R. Solar-light-driven efficient ZnO–single-walled carbon nanotube photocatalyst for the degradation of a persistent water pollutant organic dye. Catalysts9, 896 (2019). 10.3390/catal9060498 [DOI] [Google Scholar]
- 41.Safarzadeh, H. et al. Adsorption ability evaluation of the poly(methacrylic acid-co-acrylamide)/cloisite 30B nanocomposite hydrogel as a new adsorbent for cationic dye removal. Environ. Res.212, 113349. 10.1016/j.envres.2022.113349 (2022). 10.1016/j.envres.2022.113349 [DOI] [PubMed] [Google Scholar]
- 42.Jin, L. & Bai, R. Mechanisms of lead adsorption on chitosan/PVA hydrogel beads. Langmuir18, 9765–9770. 10.1021/la025917l (2002). 10.1021/la025917l [DOI] [Google Scholar]
- 43.Asif-Tahir, M., Bhatti, H. N. & Iqbal, M. Solar Red and Brittle Blue direct dyes adsorption onto Eucalyptus angophoroides bark: Equilibrium, kinetics and thermodynamic studies. J. Environ. Chem. Eng.4, 2431–2439. 10.1016/j.jece.2016.04.020 (2016). 10.1016/j.jece.2016.04.020 [DOI] [Google Scholar]
- 44.Pelalak, R. et al. Oak wood ash/GO/Fe3O4 adsorption efficiencies for cadmium and lead removal from aqueous solution: Kinetics, equilibrium and thermodynamic evaluation. Arab. J. Chem.14, 102991. 10.1016/j.arabjc.2021.102991 (2021). 10.1016/j.arabjc.2021.102991 [DOI] [Google Scholar]
- 45.Safarzadeh, H., Peighambardoust, S. J. & Peighambardoust, S. H. Application of a novel sodium alginate-graft-poly(methacrylic acid-co-acrylamide)/montmorillonite nanocomposite hydrogel for removal of malachite green from wastewater. J. Polym. Res.30, 157. 10.1007/s10965-023-03531-x (2023). 10.1007/s10965-023-03531-x [DOI] [Google Scholar]
- 46.Foroutan, R. et al. Carbon nanotubes/β-cyclodextrin/MnFe2O4 as a magnetic nanocomposite powder for tetracycline antibiotic decontamination from different aqueous environments. J. Environ. Chem. Eng.9, 106344. 10.1016/j.jece.2021.106344 (2021). 10.1016/j.jece.2021.106344 [DOI] [Google Scholar]
- 47.Nithya, R. et al. Removal of Cr(VI) from aqueous solution using chitosan-g-poly(butyl acrylate)/silica gel nanocomposite. Int. J. Biol. Macromol.87, 545–554. 10.1016/j.ijbiomac.2016.02.076 (2016). 10.1016/j.ijbiomac.2016.02.076 [DOI] [PubMed] [Google Scholar]
- 48.Vitela-Rodriguez, A. V. & Rangel-Mendez, J. R. Arsenic removal by modified activated carbons with iron hydro(oxide) nanoparticles. J. Environ. Manage.114, 225–231. 10.1016/j.jenvman.2012.10.004 (2013). 10.1016/j.jenvman.2012.10.004 [DOI] [PubMed] [Google Scholar]
- 49.Bulut, Y. & Aydın, H. A kinetics and thermodynamics study of methylene blue adsorption on wheat shells. Desalination194, 259–267. 10.1016/j.desal.2005.10.032 (2006). 10.1016/j.desal.2005.10.032 [DOI] [Google Scholar]
- 50.Shen, T., Luo, J., Zhang, S. & Luo, X. Hierarchically mesostructured MIL-101 metal–organic frameworks with different mineralizing agents for adsorptive removal of methyl orange and methylene blue from aqueous solution. J. Environ. Chem. Eng.3, 1372–1383. 10.1016/j.jece.2014.12.006 (2015). 10.1016/j.jece.2014.12.006 [DOI] [Google Scholar]
- 51.Farasati Far, B. et al. Decontamination of Congo red dye from aqueous solution using nanoclay/chitosan-graft-gelatin nanocomposite hydrogel. J. Mol. Liquids395, 123839. 10.1016/j.molliq.2023.123839 (2024). 10.1016/j.molliq.2023.123839 [DOI] [Google Scholar]
- 52.Cui, J. et al. Facile fabrication of chitosan-based adsorbents for effective removal of cationic and anionic dyes from aqueous solutions. Int. J. Biol. Macromol.165, 2805–2812. 10.1016/j.ijbiomac.2020.10.161 (2020). 10.1016/j.ijbiomac.2020.10.161 [DOI] [PubMed] [Google Scholar]
- 53.Bo, C. et al. Copolymer-type magnetic graphene oxide with dual-function for adsorption of variety of dyes. J. Taiwan Inst. Chem. Eng.138, 104499. 10.1016/j.jtice.2022.104499 (2022). 10.1016/j.jtice.2022.104499 [DOI] [Google Scholar]
- 54.Ren, L., Tang, Z., Du, J., Chen, L. & Qiang, T. Recyclable polyurethane foam loaded with carboxymethyl chitosan for adsorption of methylene blue. J. Hazard. Mater.417, 126130. 10.1016/j.jhazmat.2021.126130 (2021). 10.1016/j.jhazmat.2021.126130 [DOI] [PubMed] [Google Scholar]
- 55.Kong, Q., Wang, X., Zhao, X. & Lou, T. Preparation of millimeter-scale hollow sphere with cationic chitosan/ dimethyl diallyl ammonium chloride /carboxymethyl cellulose terpolymer and its selective removal of anionic dye. J. Clean. Prod.331, 130017. 10.1016/j.jclepro.2021.130017 (2022). 10.1016/j.jclepro.2021.130017 [DOI] [Google Scholar]
- 56.Liu, C., Omer, A. M. & Ouyang, X.-K. Adsorptive removal of cationic methylene blue dye using carboxymethyl cellulose/k-carrageenan/activated montmorillonite composite beads: Isotherm and kinetic studies. Int. J. Biol. Macromol.106, 823–833. 10.1016/j.ijbiomac.2017.08.084 (2018). 10.1016/j.ijbiomac.2017.08.084 [DOI] [PubMed] [Google Scholar]
- 57.Chen, L. et al. Fabrication of starch-based high-performance adsorptive hydrogels using a novel effective pretreatment and adsorption for cationic methylene blue dye: Behavior and mechanism. Chem. Eng. J.405, 126953. 10.1016/j.cej.2020.126953 (2021). 10.1016/j.cej.2020.126953 [DOI] [Google Scholar]
- 58.Taşdelen, B., Çifçi, D. İ & Meriç, S. Preparation of N-isopropylacrylamide/itaconic acid/Pumice highly swollen composite hydrogels to explore their removal capacity of methylene blue. Colloids Surfaces A: Physicochem. Eng. Aspects519, 245–253. 10.1016/j.colsurfa.2016.11.003 (2017). 10.1016/j.colsurfa.2016.11.003 [DOI] [Google Scholar]
- 59.Coşkun, R. & Delibaş, A. Removal of methylene blue from aqueous solutions by poly(2-acrylamido-2-methylpropane sulfonic acid-co-itaconic acid) hydrogels. Polym. Bull.68, 1889–1903. 10.1007/s00289-011-0664-z (2012). 10.1007/s00289-011-0664-z [DOI] [Google Scholar]
- 60.Albadarin, A. B. et al. Activated lignin-chitosan extruded blends for efficient adsorption of methylene blue. Chem. Eng. J.307, 264–272. 10.1016/j.cej.2016.08.089 (2017). 10.1016/j.cej.2016.08.089 [DOI] [Google Scholar]
Associated Data
This section collects any data citations, data availability statements, or supplementary materials included in this article.
Supplementary Materials
Data Availability Statement
All data generated or analysed during this study are included in this published article and its supplementary information files.