

Abstract
MELAS (mitochondrial encephalomyopathy, lactic acidosis, stroke-like episodes) is a progressive neurodegenerative disease caused by pathogenic mitochondrial DNA variants. The pathogenic mechanism of MELAS remains enigmatic due to the exceptional clinical heterogeneity and the obscure genotype-phenotype correlation among MELAS patients. To gain insights into the pathogenic signature of MELAS, we designed a comprehensive strategy integrating proteomics and metabolomics in dermal fibroblasts from a patient harboring the ultra-rare MELAS pathogenic variant m.14453G>A, affecting the mitochondrial respiratory Complex I. Her asymptomatic and non-carrier mother served as a negative control. This unique pair of dermal fibroblasts provided an ideal ex vivo cellular paradigm to understand the MELAS pathogenesis. Global proteomics was achieved by data-dependent acquisition (DDA) and validated by data-independent acquisitions (DIA) using both Spectronaut and the recently developed MaxDIA platforms. Comprehensive metabolite coverage was achieved for both polar and nonpolar metabolites in both reverse and normal phase LC-MS/MS analyses. Multi-omics integration of MELAS fibroblasts revealed OXPHOS dysregulation with a predominant downregulation of a battery of Complex I subunits, as well as alteration of the key bioenergetic pathways, glycolysis, tricarboxylic acid cycle, and fatty acid β-oxidation. Most clinically relevant is the dysregulation of the arginine biosynthesis pathway, likely due to blocked argininosuccinate synthase, which is congruent with the MELAS cardinal symptom of stroke-like episodes and its current treatment by arginine infusion. In conclusion, our global proteomic and metabolomic analyses on patient-derived fibroblasts demonstrated a comprehensive and integrated multi-omics workflow with great clinical and therapeutic potential to discover therapeutic targets and design personalized interventions.
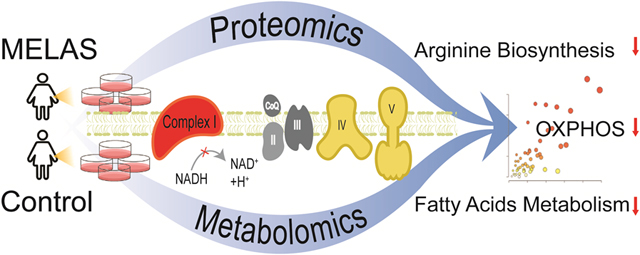
Graphic Abstract
Comprehensive mass spectrometry-based proteomics and metabolomics uncovered dysregulation of key bioenergetic pathways and arginine biosynthesis in MELAS syndrome, a mitochondrial disease due to mtDNA mutations.
INTRODUCTION
The maternally inherited mitochondrial disease MELAS (mitochondrial encephalomyopathy, lactic acidosis, stroke-like episodes syndrome) is a progressive neurodegenerative disease with great genetic and clinical heterogeneity (1). MELAS has a predominant childhood onset with no gender bias. The neurological features of MELAS include stroke-like episodes, encephalopathy with seizures, lactic acidosis, hearing loss, myopathy, neuropathy, tremor, cognitive defects, and dementia. MELAS patients also exhibit non-neurological symptoms, such as cardiomyopathy, nephropathy, diabetes mellitus and gastrointestinal (1). MELAS is caused by mitochondrial pathogenic variants affecting the oxidative phosphorylation (OXPHOS) pathway, responsible for ATP synthesis.
About 80% of MELAS patients harbor the maternally inherited variant m.3243A>G mapping in the MT-TL1 gene encoding the mitochondrial tRNALeu(UUR) (2,3). MELAS can also be due to additional mitochondrial pathogenic variants with a very low frequency, such as m.1630A>G mapping in the MT-TV gene encoding the mitochondrial tRNAVal (4–6), m.13514A>G mapping in the ND5 gene encoding the NADH dehydrogenase 5 subunit of Complex I (7), and m.14453G>A mapping in the ND6 gene encoding the NADH dehydrogenase 6 subunit of Complex I (8). These mitochondrial MELAS variants only affect a subset of the multi-copy mitochondrial genome, a phenomenon called heteroplasmy stemming from a variable ratio of mutant and wild type mitochondrial DNA (mtDNA) coexisting within cells. Mitochondria become dysfunctional in terms of OXPHOS, when the population of mutated mtDNAs overwhelms the wild type mtDNA population. Consequently, patients harboring a MELAS variant generally are symptomatic when the load of dysfunctional mitochondria exceeds a certain threshold of heteroplasmy, a threshold that is tissue-specific and varies among patients. This genetic heterogeneity compounded by the unprecedented clinical heterogeneity among MELAS patients has made the genotype-phenotype relationship elusive, and consequently the pathogenic MELAS mechanisms (9). These hurdles have hampered progress toward curative interventions and reliable biomarkers and therapeutic targets.
In this study, we designed a global and integrated mass spectrometry (MS)-based strategy for parallel proteomics and metabolomics to provide novel insights into the pathogenic pathways of MELAS. Integrated proteomics and metabolomics were conducted on dermal fibroblasts derived from a female exhibiting the cardinal symptoms of MELAS, stroke-like episodes, seizures, lactic acidosis, and cognitive defects. This patient harbored the rare mitochondrial variant m.14453G>A with a 65% heteroplasmy, affecting the mitochondrial-encoded subunit NADH dehydrogenase 6 of the OXPHOS Complex I. This pathogenic variant was not detected in her mother’s fibroblasts, making this de novo mitochondrial variant ultra-rare. The provides an
The strength of our study for understanding the MELAS mitochondrial pathogenesis via proteomics and metabolomics platforms is two-fold: 1) the ideal ex vivo cellular paradigm by pairing dermal fibroblasts from the symptomatic female with her non-carrier mother sas a negative control; and 2) our comprehensive coverage and mutual validation of identified proteins and metabolites using various modes of LC-MS/MS with a combination of data-dependent (DDA) and data-independent acquisitions (DIA). For the past decades, DDA has been the first and standard strategy in shotgun proteomics, where the most abundant sets of MS1 ions are individually selected and isolated for sequential MS2 fragmentation. For label-free global proteomics, identification is achieved at MS2 level, and quantification is often achieved at MS1 level. However, for complex biological samples, DDA proteomics often faces challenges to identify low abundant and coeluting peptides, as well as missing values from different biological/technical replicates. As an alternative strategy to DDA proteomics, DIA isolates and fragments all MS1 ions within a given m/z window regardless of their intensities. Both identification and quantification are achieved at the MS2 level with less missing values and better reproducibility compared to DDA. But DIA generates highly convoluted spectra and requires tailored computational algorithms for data analysis. With the rapid advancements of DIA data analysis, multiple software platforms are available to analyze DIA data, such as Spectronaut, Skyline, DIA-Umpire, and the most recently developed MaxDIA method in Maxquant platform. (11,12). In this study, we conducted global DDA proteomics of MELAS fibroblasts vs. controls and validated the findings with DIA analysis. The performance of the newly launched MaxDIA platform was evaluated in comparison to the Spectronaut platform.
We report m.14453G>A-specific proteomic and metabolomic fingerprints present in dermal fibroblasts from a symptomatic MELAS patient compared to her asymptomatic mother as a perfect negative control group revealing pathogenic pathways congruent with the patient’s Complex I deficiency, chronic energy deficit, and redox imbalance.
EXPERIMENTAL
Subject, Skin Biopsy, and Fibroblast Culture
This study was approved by the Institutional Review Board of the George Washington University and Children’s National Medical Center. It was conducted in accordance with the ethical principles of the Declaration of Helsinki of 1975 (revised 1983). Patient skin biopsy was performed only after receiving written informed consent with permission to study the derived dermal fibroblasts.
Skin biopsy was performed on a 22-year-old symptomatic female harboring the m.14453G>A variant and her 53-year-old asymptomatic mother, as a negative control. Dermal fibroblasts were derived from a 2 mm punch skin biopsy in Dulbecco’s Modified Eagle Medium (DMEM; Gibco) supplemented with 2 mM glutamine, 2.5 mM pyruvate, 0.2 mM uridine, FGF-2 (10 ng/ml) and 20% fetal bovine serum as described in a previous study (6). Derived dermal fibroblasts were frozen at passage 2 and never used beyond passage 10.
Determination of Heteroplasmy
Total DNA was extracted from dermal cultured fibroblasts at passage 3 using the QIAmp DNA mini kit according to the manufacturer’s recommendations (Qiagen; Germantown, MD). Heteroplasmy was determined using a Long-Range PCR (LR-PCR)-based Next Generation sequencing (NGS) approach as described (13). We applied a very stringent detection method by choosing the very stringent cut-off of 1.33% heteroplasmy based on three S.D. above the mean error, which resulted in a 99.9 % confidence (10).
Lysis of Dermal Fibroblasts and Biomolecule Extraction
Dermal fibroblasts derived from the MELAS patient and her noncarrier mother were grown in four independent biological replicates. Fibroblasts were washed twice with Phosphate-buffered saline and immediately pelleted and flash frozen in liquid nitrogen. Proteins, polar metabolites, and nonpolar metabolites were enriched from the pelleted fibroblasts using methanol/chloroform/water extraction (14,15). Briefly, 300 μL of ice-cold methanol, chloroform, and MilliQ water were sequentially added to each cell pellet sample. The biphasic mixture was vigorously vortexed, incubated on ice for 10 min, vortexed again, and clarified by centrifugation at 12,000 rpm for 15 min at 4 °C. The mixture stratified into three layers: the top methanol/water fraction containing polar small molecules, the middle layer of protein precipitate, and the bottom chloroform fraction containing nonpolar metabolites and lipids. Different classes of biomolecules were collected separately in Eppendorf tubes and stored at −80°C.
Protein Sample Preparation
Protein pellets were dissolved in lysis buffer containing 150 mM NaCl, 50 mM Tris, and 0.1% (w/v) Rapigest (Waters). Cell lysates were vortexed and sonicated with QSonica Q700 Sonicator in ice-cold water bath with alternating cycles of 1min on and 30 s off for a total of 15 min. The protein solution was clarified by centrifugation at 12000 rpm for 10 min at 4 °C. Total protein concentrations from each sample was determined and normalized using DCA colorimetric protein assay (Bio-Rad). Protein reduction and alkylation were performed by adding tris(2-carboxylethyl) phosphine (TCEP) at 5 mM for 30 min at 37 °C in a ThermoMixer, followed by iodoacetamide (IAA) addition at 15 mM in dark for 30 min at 37 °C. Another 5 mM TCEP was added for 10 min to quench excessive IAA. Trypsin/Lys-C mix (Promega) was used for protein digestion (1:30 ratio w/w) for 16 h at 37 °C in a ThermoMixer. Digestion reaction was quenched with 10% trifluoroacetic acid until pH < 2, incubated at 37 °C for 45 min, and clarified by centrifugation at 12000 rpm for 10 min at 4 °C to precipitate and remove Rapigest. Peptides were desalted using a Waters C18 96-well extraction plate following the manufacture protocol, dried, and stored at −30 °C until LC-MS/MS analysis.
Metabolite Sample Preparation
Polar metabolites (methanol/water fraction) and nonpolar metabolites and lipids (chloroform fraction) were dried separately in SpeedVac and reconstituted in 50/50 acetonitrile/water (LC-MS grade) and 50/50 acetonitrile/isopropanol, respectively. Metabolite samples were normalized based on total protein concentrations. Samples were briefly sonicated, clarified by centrifugation at 12000 rpm for 10 min at 4 °C, and stored at −30 °C until LC-MS/MS analysis.
nanoLC-MS/MS for DDA and DIA Proteomic Analyses
A Dionex Ultimate 3000 RSLCnano system coupled with a Thermo Scientific Q-Exactive HFX Orbitrap Mass Spectrometer was used for proteomic analysis. The mobile phase A was 0.1% FA in water, and mobile phase B was 0.1% formic acid (FA) in acetonitrile. Peptides were trapped on an Acclaim PepMap C18 column (3 μm, 100 Å, 75 μm × 2 cm) and separated on an Easy-spray PepMap C18 column (2 μm, 100 Å, 75 μm × 75 cm) with a 210 min LC gradient and 55 °C column temperature. The flow rate was 0.2 μL/min. The quadrupole mass filtering was set from m/z 380 to 1500 with a resolving power of 120000 (at m/z 200 FWHM). For DDA analysis, a top 40 method was conducted with a MS resolving power of 120K and a MS/MS resolving power of 7500. Parent masses were isolated with a m/z 1.4 window and fragmented with higher-energy collision dissociation at a normalized collision energy (NCE) of 30%. The maximum injection times (maxIT) were 50 ms for MS and 35 ms for MS/MS. The dynamic exclusion time was 30 s. The automatic gain control (AGC) was 1 × 10⁶ for MS and 2 × 10⁵ for MS/MS. For DIA analysis, a staggered MS2 window was used with 8 Dalton isolation and 69 loop counts from m/z 400–1000 range. The resolving power was 30K, and NCE was 30%. AGC target was 5 × 10⁵, and the maxIT was 20 ms. MS precursor scan was acquired in parallel to the DIA scan with a mass range of m/z 380–1500, a resolving power of 60K, maxIT of 30 ms, and AGC of 1 × 10⁶.
UHPLC-MS/MS for Polar and Nonpolar Metabolomic Analysis
A Vanquish Duo UHPLC system coupled with a Thermo Scientific Q-Exactive HFX Orbitrap Mass Spectrometer was used for metabolomic analysis. Same sample was analyzed twice on a reverse phase (RP) and a hydrophilic interaction chromatography (HILIC) column. For RPLC-MS, metabolites were separated using a Luna Omega Polar C18 column (1.6 μm, 100 Å, 100 × 2.1mm) with a 20 min gradient and 30 °C column temperature. The mobile phase A was 0.1% FA in water, and mobile phase B was 0.1% FA in acetonitrile. The flowrate was 0.3 mL/min. The quadrupole mass filtering was set from m/z 70 to 800 with a resolving power of 45000 (at m/z 200 FWHM), operated on positive electrospray ionization (ESI) mode. For HILIC LC-MS, a Kinetex HILIC column (2.6 μm, 100 Å, 150 × 2.1mm) was used with a 37 min gradient and 30 °C column temperature. The mobile phase A was 95% water, 5% acetonitrile with 10 mM ammonium acetate. The mobile phase B was 5% water, 95% acetonitrile with 10 mM ammonium acetate. The flowrate was 0.3 mL/min. MS data acquisition for each replicate was obtained in full MS mode. The quadrupole mass filtering was set from m/z 70 to 1000 with a resolving power of 45000 (at m/z 200 FWHM), operated on both positive and negative ESI mode. The maximum injection times were 50 ms for full MS mode. The automatic gain control (AGC) was 1 × 10⁶ for full MS mode.
Two quality control (QC) samples were created by pooling a small aliquot from each sample for polar and nonpolar fractions. The QC sample was injected in conditions described above but in top 10 DDA modes to assist with confident metabolite identification. MS resolving power was 45000 and MS2 resolving power was 7500, with an isolation window of m/z 1.2, NCE of 30%, and dynamic exclusion of 30 s. The MaxITs were 30 ms for MS and 50 ms for MS2. The AGCs were 1 × 10⁶ for MS and 2 × 10⁵ for MS/MS.
Metabolite standard mixture containing 66 metabolites (e.g., amino acids, nucleotides, neurotransmitters, organic acids and metabolites from metabolic energy pathways). from in-house metabolomics library was analyzed using the same RPLC-MS and HILIC-MS methods described above. The full MS, retention time, and MS/MS fragments from metabolite standards as well as the QC samples were used to assist with metabolite identifications from the fibroblast samples.
DDA and DIA Proteomics Data Analysis
The DDA proteomics dataset was analyzed with Thermo Fisher Proteome Discoverer (2.4.1.15) software. Swiss-Prot Homo sapiens database (reviewed) was used for human protein identification with 1% false discovery rate cut-off. Proteomics contamination database (from Max Planck Institute of Biochemistry) was included as the contamination marker. Known mitochondrial proteins from Uniprot was included as the mitochondrial marker. Trypsin was used as the enzyme with 3 maximum missed cleavages. Methionine oxidation and acetylation of protein N-terminus were included as variable modifications. Cysteine carbamidomethylation was included as a fixed modification. Chromatographic alignment was conducted with a maximum retention time shift of 2 min and a minimum signal-to-noise ratio of 5. Precursor mass tolerance was 25 ppm. The max fold change is set to 500. Data was normalized by total peptide amount with no missing value imputation.
The DIA dataset was analyzed using two software platforms: Spectronaut 15 (Biognosys) and recently launched MaxDIA using MaxQuant (2.0.1.0) (11,12). The default parameters were used and the enzyme and modification settings are the same as DDA data analysis. In Spectronaut, swiss-Prot Homo sapiens database (reviewed) was used in direct DIA mode. Global imputing function for missing values was turned off. In Maxquant, MaxDIA was used in discovery mode using FASTA file UP000005640_9606 (H. sapiens) and in silico generated library files as suggested by MaxDIA software (12).
Metabolomics Data Analysis
Metabolomics dataset was analyzed with Thermo Fisher Compound Discoverer (3.2) software. The maximum retention time shift was 1 min. Mass tolerance was 5 ppm. The minimum peak intensity was 1×10⁵, and signal-to-noise ratio was 3. DDA acquisitions of QC samples were included for metabolite identification. Four datasets were analyzed separately for polar-RP, polar-HILIC, nonpolar-RP and nonpolar-HILIC data. Positive and negative ESI modes were combined in each dataset. Metabolite identification was conducted based on our previously established flowchart that includes accurate mass matching and MS/MS matching to online metabolite databases as well as spectral matching to in-house standard library. MzCloud, ChemSpider, HMDB, KEGG, and LIPID MAPS were selected as metabolite libraries in the Compound Discoverer software. The in-house metabolite standard library contained the retention time, MS1, MS/MS, and detected LC mode for 66 common metabolites, such as amino acids, nucleotides, neurotransmitters, organic acids, and metabolites from TCA cycle and glycolysis.
Statistical analysis and Bioinformatics
Proteomics data were exported in the excel format and further analyzed with R for statistical analysis (t-test) and Spearman’s correlation. Metabolomics data from 4 different LC modes were combined for further multivariate statistical analysis. Principal component analysis (PCA) and joint pathway analysis were conducted with MetaboAnalyst 5.0. (http://www.metaboanalyst.ca/)(16).
Data availability:
The proteomics and metabolomics datasets have been deposited in the MassIVE online depository (https://massive.ucsd.edu) with the identifier ***.
RESULTS & DISCUSSION
Advantages of ex-vivo Patient-derived Fibroblasts System
We obtained skin biopsies to derive dermal fibroblasts from the symptomatic MELAS female and her noncarrier mother as a negative control group. We opted for this ex vivo cellular MELAS paradigm based on its several well-established advantages (17,18): 1) skin biopsy is a non-invasive procedure; 2) the derived fibroblasts can be propagated and stored for future studies to identity personalized biomarkers, genetic markers, and therapeutic targets; 3) they are suitable for high-throughput omics analysis; 4) in contrast with blood and urine, heteroplasmy of a specific mitochondrial pathogenic variant in dermal fibroblasts does not decline with age of the patient nor vary between genders, essential for bringing to light the MELAS pathogenic mechanisms by integrated analyses of omic-driven phenotypes, heteroplasmic severity, and disease burden (19); and 5) they provide intact mitochondria in contrast with biofluid samples, like blood and urine.
Experimental Workflow of Integrated Proteomics and Metabolomics
We concomitantly performed MS-based proteomics and metabolomics of patient-derived fibroblasts with four biological replicates using the overall workflow illustrated in Figure 1. We simultaneously extracted proteins, polar metabolites, and nonpolar metabolites and lipids from the symptomatic patient’s fibroblasts (N=4) and those of her asymptomatic and noncarrier mother (N=4) as a control group using the methanol/chloroform/water extraction method (14,15). Proteomics was conducted with nanoLC-MS/MS with DDA method and validated by DIA. DirectDIA in Spectronaut, newly launched MaxDIA in Maxquant, and DDA method were comparatively evaluated for MELAS fibroblasts proteomics. Metabolomics was performed in both RPLC-MS and HILIC LC-MS platform for polar and nonpolar metabolites to achieve a comprehensive coverage and mutual validation of metabolite identification and quantification. Additional LC-MS/MS analysis of pooled samples and in-house metabolite standards assisted the confident identification of metabolites. Quantitative and qualitative information of all identified proteins and metabolites were combined into the same molecular processes and pathways to understand mitochondrial dysfunctions and pathogenesis involved in MELAS.
Figure 1. Schematic workflow of integrated MS-based proteomics and metabolomics for the MELAS disease.
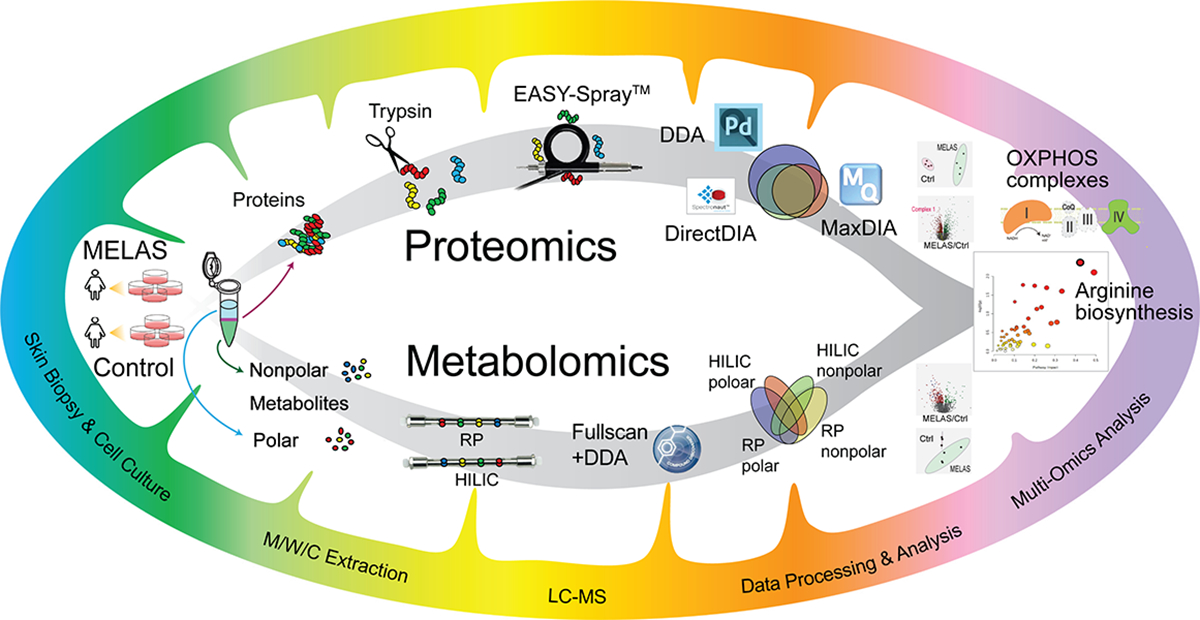
Proteins, polar metabolites, and nonpolar metabolites were extracted simultaneously from patient skin fibroblasts cultures. LC/MS-based proteomics and metabolomics were conducted in parallel and integrated for pathway analysis.
Global Proteomic Analysis Reveals the m.14453G>A-specific Fingerprints of Complex I Deficiency
To identify the MELAS proteomics signature specific for the pathogenic m.14453G>A variant, we performed DDA proteomic analysis followed by DIA for validation. After removing contaminants and decoys, we identified a total of 6994 protein groups from DDA, 4587 from Spectronaut (directDIA) and 4868 from MaxDIA (Figure 2A). DirectDIA results notably returned no or minimum missing values, whereas DDA and MaxDIA results contained 19.7% and 17.0% missing values of reproducible protein groups from all replicates, respectively. From these identified protein groups, 5487 from DDA, 4587 from Spectronaut, and 3141 from MaxDIA were reproducibly quantified in at least 3 replicates in one group (MELAS or control) (Supplemental Figure S1). Spearman’s correlations of these three data analysis platforms indicated the good correlation of protein fold changes (Figure 2B). Among the commonly quantified 2054 protein groups, 1243 proteins (60.5%) shared consistent trend (increase or decrease) in MELAS vs. Ctrl groups in all 3 datasets (Supplemental Table S1). Principal component analysis of DDA, directDIA, and MaxDIA results showed complete separation between the MELAS (symptomatic daughter) and the control (asymptomatic mother) groups (Figure 2C). Volcano plots of the quantified proteins in three data analysis platforms were shown in Figure 2D. Most statistically significantly changed proteins (p<0.05) were validated among three platforms. A total of 174 proteins were significantly altered in all 3 datasets with the same changing trend. Particularly, many mitochondrial Complex I subunits showed consistent down-regulation in all three datasets (Figure 2D), in concordance with the patient’s genetic diagnosis of a de novo m.14453G>A variant targeting the mitochondrial-encoded ND6 subunit of Complex I (NADH:ubiquinone oxidoreductase). Mitochondrial Lon protease (LONP1) and glucose-6-phosphate 1-dehydrogenase (G6PD) were found to be significantly up-regulated, in agreement with other MELAS studies on the predominant pathogenic variant m.3243A>G (23, 24).
Figure 2. Proteomics results comparing DDA (Proteome Discoverer), DirectDIA (Spectronaut), and MaxDIA (Maxquant).
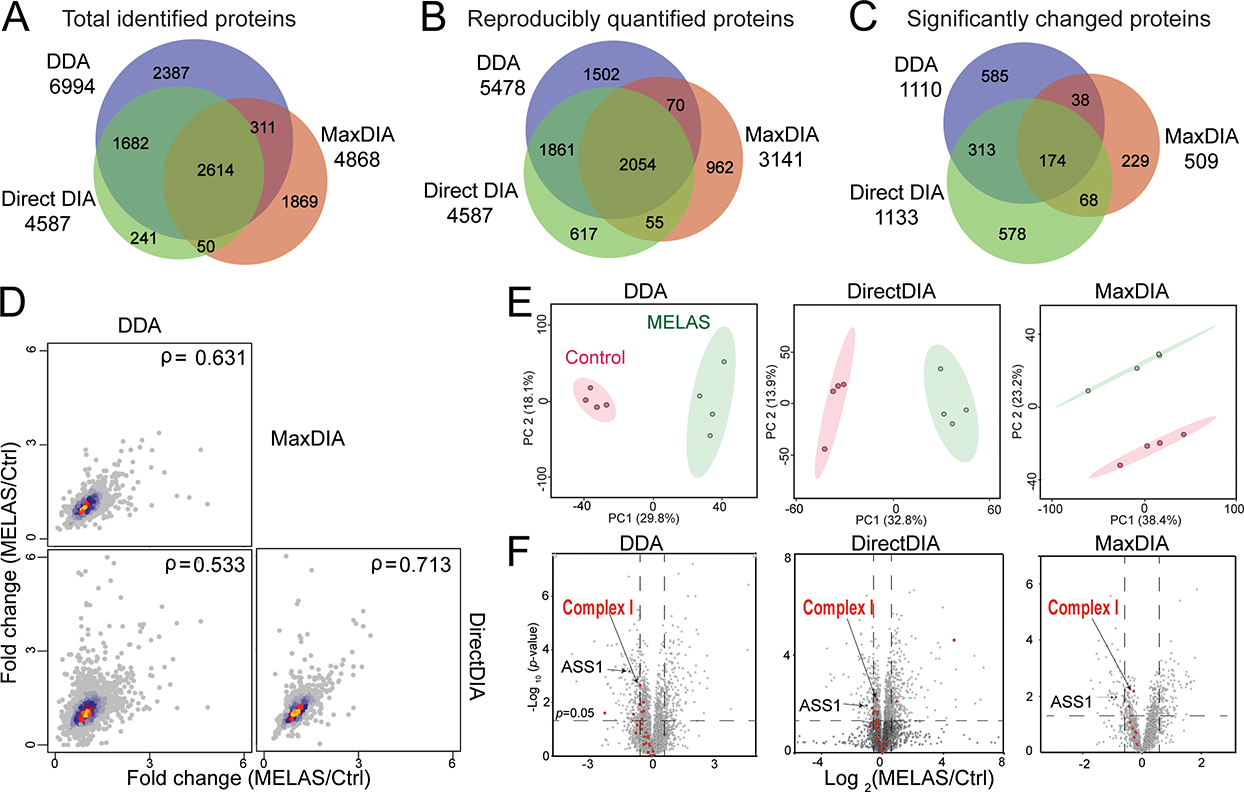
(A) Venn diagram of total protein identifications from DDA, DirectDIA, and MaxDIA. (B) Spearman’s correlation protein fold changes (diseased/control) in DDA, DirectDIA and MaxDIA. (C) Principal component analyses of the control and diseased groups. The ellipses indicate 95% confidence region. (D) Volcano plots MELAS m.14453G>A (symptomatic carrier daughter) and control (asymptomatic and noncarrier mother).
To further elucidate the mitochondrial respiratory chain deficiency caused by MELAS, Figure 3 detailed the protein changes among the five OXPHOS multisubunit enzymatic complexes. The OXPHOS system is composed of a series of four distinct respiratory complexes, Complex I to IV, and an ATP synthase, also referred to as Complex V. Mitochondrial ATP synthesis is the result of electron transfer through the first four complexes, with Complex I and Complex II being the two points of entry, and ATP synthesis occurring at Complex V (20). Electrons are provided by oxidation of the reducing equivalents, NADH and FADH2, originating from the metabolic pathways, glycolysis, the tricarboxylic acid (TCA) cycle, also known as Krebs cycle, and fatty acid oxidation. Complex I is an L-shaped multi-subunit complex with a hydrophobic membrane arm anchored in the mitochondrial inner membrane that is perpendicularly linked to a hydrophilic peripheral or matrix protruding into the mitochondrial matrix (21). The ND6 subunit is required for the proper assembly of Complex I (22,23). Among the downregulated expression levels of nuclear-encoded subunits, it is worth highlighting the subunits NDUFS2, NDUFS8, NDUFA9, and NDUFB8, which interact with ND6 during the early steps of the membrane arm assembly (24). Equally important is the dysregulation of the two NDUFV1 and NDUFV2 core subunits of the N module, along with the structural subunit NDUFS6, thereby affecting the binding of the reduced agent NADH and consequently accepting electrons by Complex I prior to their transfer to the downstream OXPHOX complexes for ATP synthesis. Our proteomic profile also revealed dysregulation of the OXPHOS pathway via altered levels of expression of Complex IV. Most notably are the two subunits COX4I1 and COX5A, which are the required building blocks along with the mitochondrial-encoded MT-CO1 to initiate Complex IV assembly. Interestingly, our proteomic results revealed dysregulated expression of the subunits, COX6B1 and NDUFA4, required for the last two steps of Complex IV assembly, also known to harbor pathogenic variants linked to mitochondrial diseases with an OXPHOS deficit. Of note is the detected upregulated expression levels of six subunits of Complex V (ATP synthase), a potential compensatory response for the patient’s Complex I deficiency caused by the m.14453G>A variant.
Figure 3. Altered OXPHOS protein abundances caused by the MELAS m.14453G>A variant.
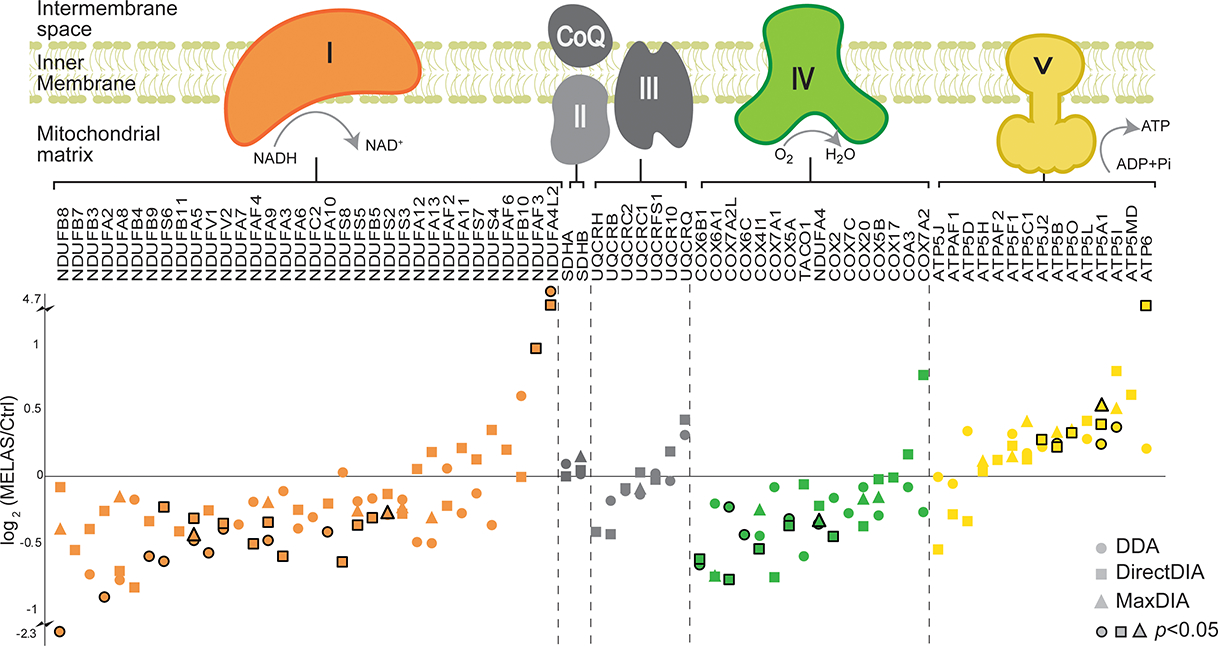
Log2 fold change from DDA, DirectDIA and MaxDIA was plotted for identified proteins. Stroked dots indicate the changes were statistically significant (P<0.05).
Comprehensive Metabolomics revealed dysregulated fatty acid metabolism in MELAS
Metabolomics has been recognized to be closest to the phenotype compared to other omics approaches (25,26). Metabolites represent the downstream result of endogenous genetic/protein regulations and exogenous influences. To achieve a comprehensive coverage of metabolites influenced by the pathogenic m.14453G>A variant, four different HPLC-MS modes were conducted for patient-derived metabolite fractions. Confident metabolite identification was obtained using our previously established flowchart that involves accurate and MS/MS matching to online metabolite database and spectral matching with an in-house metabolite standard library. From the polar metabolite fraction, 661 metabolites were identified using RP column, and 460 metabolites were identified using HILIC column. From the nonpolar fraction, 262 metabolites were identified using RP column, and 181 metabolites were identified using HILIC column (Figure 4A). All the features from different LC modes were combined to conduct principal component analysis (PCA), where total segregation was achieved between the MELAS group (carrier symptomatic daughter) and the control group (asymptomatic and noncarrier mother) (Figure 4B). PCA and volcano plots of individual LC-MS modes are included in the Supplemental Figures S2 and S3.
Figure 4. Metabolomic fingerprints of the MELAS m.14453G>A variant.
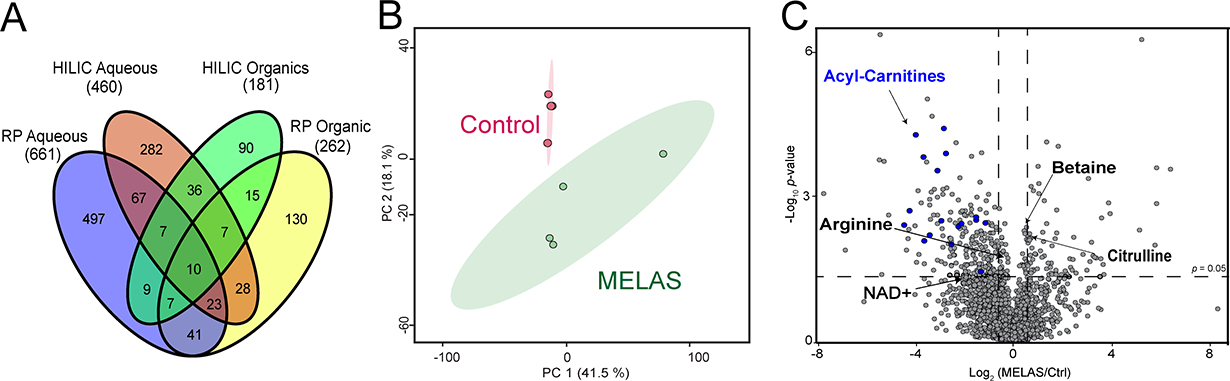
(A) Venn diagram of metabolites identified from polar/nonpolar fractions using RP or HILIC mode. (B) Principal component analysis from combined feature list from all different LC-MS modes. The ellipses indicate 95% confidence region. (C) Volcano plot analysis generated from four independent replicates for the MELAS m.14453G>A and control groups.
We found that key metabolites related to bioenergetic pathways were altered in MELAS group compared to the control group, as shown in the volcano plot (Figure 4C). Most notably are the decreased levels of acylcarnitines in the presence of the MELAS m.14453G>A variant, indicative of a defective fatty acid metabolism in the patient-derived fibroblasts (Figure 4C). Acylcarnitines modulate the mitochondrial energy metabolism by converting long-chain fatty acids into long-chain acyl-CoAs to overcome the permeability barrier of the inner mitochondrial membrane, thereby allowing their transport into the mitochondrial matrix for fatty acid oxidation occurs that is coupled to the OXPHOS pathway for ATP synthesis (Supplemental Figure S4). This deficiency in acylcarnitine levels further aggravates the chronic energy deficit due to the patient’s Complex I deficiency caused by the m.14453G>A variant. In keeping with the OXPHOS deficit, are our metabolomic results of reduced levels of nicotinamide adenine dinucleotide (NAD+) in the patient’s fibroblasts, resulting in decreased NAD+/NADH ratio, a hallmark of OXPHOS deficit in mitochondrial diseases (27–29). Complex I deficiency caused by the m.14453G>A variant leads to accumulation of NADH since Complex I is the major site for oxidation of the reduced NADH agent into NAD+, a key step to provide electrons for mitochondrial ATP synthesis (30).
Our metabolomic analysis also exposed a deficit in arginine levels in the context of the m.14453G>A variant (Figure 4C), in keeping with the reported decreased plasma levels of arginine in MELAS patients harboring the most frequent mitochondrial variant m.3243A>G (1). Thus, the patient’s arginine fingerprint validates our metabolomic method and the most prevalent clinical manifestations of recurrent stroke-like episodes (SLEs) in this patient. In MELAS patients, SLEs are nonischemic and the result of impaired blood flow in small intracerebral arteries and arterioles caused by abnormal proliferation of dysfunctional mitochondria in the vascular endothelial cells and smooth muscle cells in combination of low plasma levels of arginine (1,31).
Multi-omics joint pathway analysis highlights redox imbalance and dysregulated arginine biosynthesis in MELAS
To unmask the m14453G>A specific bioenergetic signature, we performed a protein-metabolite joint pathway analysis. Our analysis revealed several significantly enriched metabolic pathways (Figure 5A, Table 1). Among these dysregulated pathways, arginine biosynthesis pathway has the highest clinical relevance to the MELAS pathophysiology. The key nodal enzyme, arginosuccinate synthase 1 (ASS1) is significantly down-regulated, causing the decreased level of the final product arginine (Figure 5B). Arginine deficiency might be worsened by the up-regulation of nitric oxide synthase (NOS) enzymes, which convert arginine into nitric oxide (NO) and citrulline, a precursor of arginine via the enzymes ASS1 and arginosuccinate lyase (ASL1). The increased levels of citrulline and ASL1 enzyme may represent the compensatory response of cells to regulate arginine biosynthesis but fails to rescue the damage caused by ASS1 deficiency. The prevailing pathogenic mechanism of stroke-like episodes observed in MELAS patients postulates decreased NO availability in the vascular endothelial cells due to endothelial dysfunction causing impaired patency of small cerebral arteries and arterioles (32,33). Further aggravating the endothelial NO deficit is the proliferation of dysfunctional mitochondria housing an increased cytochrome c oxidase activity, which promotes binding and sequestration of NO (34).
Figure 5. Joint proteomic and metabolomic pathway analysis.
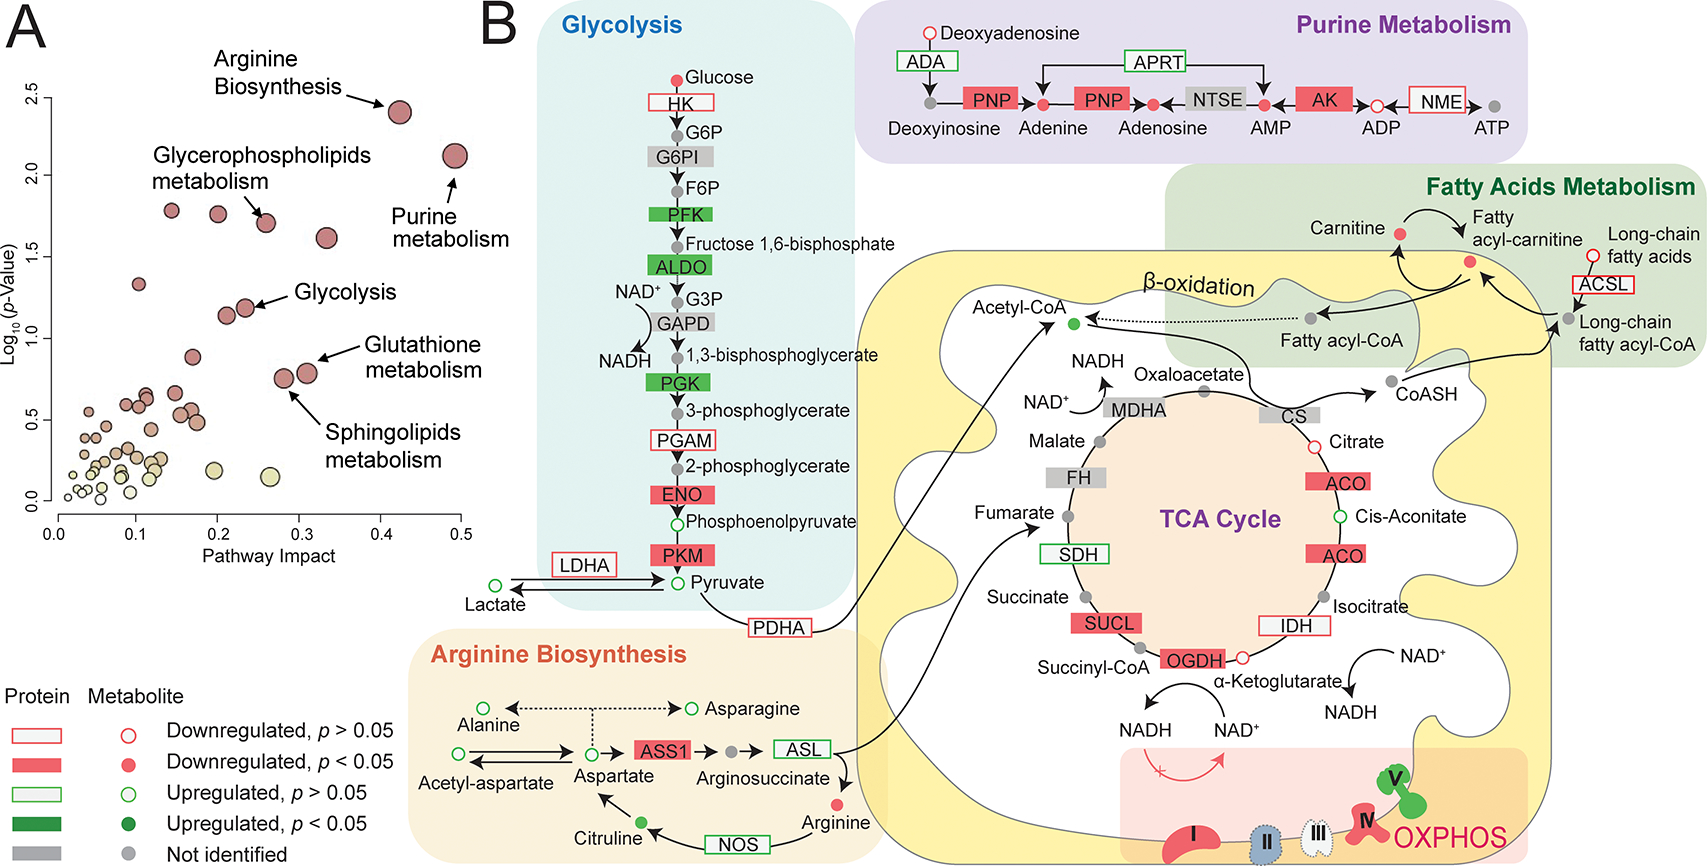
(A) Joint pathway analysis showing enriched pathways with high pathway impact and low pathway p-value. (B) Highlighted key metabolic pathway segments with both protein and metabolite coverage.
Table 1.
Joint pathway analysis results
| Pathway name | Pathway impact score | Pathway p-value | # proteins | # metabolites | Significant Protein Gene IDs | Significant Compound KEGG IDs |
|---|---|---|---|---|---|---|
|
| ||||||
| Arginine biosynthesis | 0.423 | 0.00428 | 1/12/22a | 3/8/23a | ASS1; | C00062; C00064; C00026; |
| Purine metabolism | 0.491 | 0.00789 | 3/67/130 | 7/11/ 95 | AK1; PNP; GMPS; | C00064; C04677; C00575; C00002; C00020; C00147; C03373; |
| Mucin type O-glycan biosynthesis | 0.143 | 0.0171 | 3/13/36 | 0/0/17 | GALNT5;GALNT1; GALNT2; | NA |
| Alanine, aspartate and glutamate metabolism | 0.200 | 0.0179 | 3/22/37 | 2/8/28 | ASS1; GFPT1; GFPT2; | C00064; C00026; |
| Glycerophospholipid metabolism | 0.259 | 0.0203 | 5/35/98 | 1/6/56 | LPCAT2; PLPP3; LCLAT1; GPD2; PLA2G15; | C04230; |
| D-Glutamine and D-glutamate metabolism | 0.333 | 0.0251 | 0/4/5 | 2/3/13 | NA | C00064; C00026; |
| Amino sugar and nucleotide sugar metabolism | 0.103 | 0.0481 | 3/5/49 | 2/6/116 | UAP1; GFPT1; GFPT2; | C00167; C00096. |
# of statistically significant/# of identified/# total
The wide range of dysregulated metabolisms may be due to redox imbalance in MELAS patient. Redox imbalance is a direct consequence of uncoupled electron transport chain (25). In the case of Complex I deficiency causing MELAS, NADH could not be consumed by Complex I to generate NAD+. This leads to a decreased NAD+/NADH ratio, which has been commonly used to indicate redox imbalance and perturbation in key bioenergetic pathways, including glycolysis and TCA cycle (27–29,35–38). We identified significantly downregulated NAD+ in the metabolomics result, congruent iwth the potential redox imbalance in the patient group. Altered proteins and metabolites from glycolysis, TCA cycle, and fatty acids metabolism were annotated in Figure 5B. NAD+/NADH is widely utilized in cells as an electron carrier and redox cofactor, regulating over 200 enzymes, including citrate synthase, α-ketoglutarate dehydrogenase, pyruvate dehydrogenase (39). In addition, redox imbalance accounts for the dysregulated pyruvate metabolism and in part explains lactic acidosis in MELAS patients. Decreased NAD+/NADH ratio is known to inhibit pyruvate dehydrogenase and prevent the conversion of pyruvate to acetyl-CoA, causing pyruvate accumulation. Meanwhile, decreased NAD+/NADH ratio concurrently activates lactate dehydrogenase, which shunts the accumulated pyruvate to lactate, leading to elevated lactate levels in MELAS patient (29). Interestingly, we found significantly upregulated pyruvate dehydrogenase kinase 1(PDK1). PDK1 inhibits pyruvate dehydrogenase via phosphorylation, which exaggerates the dysregulation of pyruvate metabolism (40).
CONCLUSIONS
In summary, we designed an integrated proteomics and metabolomics workflow to achieve a comprehensive proteome and metabolome coverage in patient-derived fibroblasts. Our proteomics studies provided clues on the disassembled OXPHOS complexes and the genotype-phenotype correlation of mitochondrial dysfunction caused by the m.14453G>A variant. Deficiency in Complex I is common in MELAS syndrome (41,42). Complex I deficit not only impact the electron transport chain, but also the TCA cycle, since Complex I facilitates the conversion of α-ketoglutarate to succinyl-CoA in TCA cycle. Impaired mitochondrial energy production is a hallmark of the MELAS pathology, which results in a plethora of phenotypic manifestations targeting several organs. The energy-demanding cells, such as muscle cells and neurons, are particularly vulnerable to such energy deficiency, congruent with two of the cardinal symptoms of MELAS, encephalopathy and myopathy. Our MELAS metabolomics analyses revealed dysregulation of fatty acid metabolism, glycerolipid metabolism, sphingolipid signaling pathway, one carbon metabolism, and glutathione metabolism. Our MELAS integrated multi-omics analysis provided evidence for redox imbalance and dysregulated arginine biosynthesis. Decreased NAD+/NADH ratio, caused by Complex I deficiency, may be the driving force of disturbed pyruvate metabolism and the clinical manifestation of lactic acidosis in MELAS. Furthermore, our metabolomic study highlights the dysregulated arginine biosynthesis in this MELAS patient despite her daily oral arginine administration. Decreased arginine level and elevated citrulline level, as well as downregulated ASS1 protein level could serve as potential therapeutic target for treatment. Our findings suggest that the conversion of citrulline into arginine was impeded at the level of ASS1 enzyme. Insufficient arginine level may further aggravate the NO deficiency and therefore the stroke-like episodes in MELAS patients. With various highlighted proteins and metabolites, this pilot study set the stage for future investigations on the identification of MELAS biomarkers using a large cohort of MELAS patients harboring specific pathogenic mitochondrial variants.
Supplementary Material
Figure S1. Venn diagram of reproducible protein identification from DDA, DirectDIA, and MaxDIA.
Figure S2. Metabolomics principal component analysis plots for individual RP and HILIC modes and ESI modes.
Figure S3. Metabolomics volcano plots for individual RP and HILIC modes and ESI modes.
Table S1. Protein ID List
Table S2. Metabolite ID list
Acknowledgements
This study is financially supported by the GW UFF grant (L.H.), the Department of Defense [W81XWH-20–1-0061] (A.C.) and the NIH National Institute of Child Health and Human Development [1U54HD090257]. L.H. acknowledges the ORAU Ralph E. Powe Junior Faculty Enhancement Award. H.L. acknowledge the Bourdon F. Scribner Fellowship from GW Chemistry Department. We thank the Vertes lab at GW for the access of the SpeedVac equipment. We thank Ashley M. Frankenfield in the Hao Lab for the assistance with Spectronaut software. We thank all the members in the Hao Lab for helpful discussions.
Footnotes
Conflicts of Interest
The authors declare no competing financial interest.
References
- 1.El-Hattab AW, Adesina AM, Jones J, Scaglia F. MELAS syndrome: Clinical manifestations, pathogenesis, and treatment options. Mol Genet Metab. 2015;116(1–2):4–12. [DOI] [PubMed] [Google Scholar]
- 2.Goto YI, Nonaka I, Horai S. A mutation in the tRNALeu(UUR) gene associated with the MELAS subgroup of mitochondrial encephalomyopathies. Vol. 348, Nature. 1990. p. 651–3. [DOI] [PubMed] [Google Scholar]
- 3.Kobayashi Y, Momoi MY, Tominaga K, Momoi T, Nihei K, Yanagisawa M, et al. A point mutation in the mitochondrial tRNALeu (UUR) gene in MELAS (mitochondrial myopathy, encephalopathy, lactic acidosis and stroke-like episodes). Biochem Biophys Res Commun. 1990;173(3):816–22. [DOI] [PubMed] [Google Scholar]
- 4.Bataillard M, Chatzoglou E, Rumbach L, Sternberg D, Tournade A, Laforêt P, et al. Atypical MELAS syndrome associated with a new mitochondrial tRNA glutamine point mutation. Neurology. 2001;56(3):405–7. [DOI] [PubMed] [Google Scholar]
- 5.Glatz C, D’Aco K, Smith S, Sondheimer N. Mutation in the mitochondrial tRNA Val causes mitochondrial encephalopathy, lactic acidosis and stroke-like episodes. Mitochondrion. 2011;11(4):615–9. [DOI] [PMC free article] [PubMed] [Google Scholar]
- 6.Uittenbogaard M, Wang H, Zhang VW, Wong LJ, Brantner CA, Gropman A, et al. The nuclear background influences the penetrance of the near-homoplasmic m.1630 A > G MELAS variant in a symptomatic proband and asymptomatic mother. Mol Genet Metab. 2019;126(4):429–38. [DOI] [PMC free article] [PubMed] [Google Scholar]
- 7.Corona P, Antozzi C, Carrara F, D’Incerti L. A novel mtDNA mutation in the ND5 subunit of complex I in two MELAS patients. Ann …. 2001;1:104–34. [DOI] [PubMed] [Google Scholar]
- 8.Ravn K, Wibrand F, Hansen FJ, Horn N, Rosenberg T, Schwartz M. An mtDNA mutation, 14453GτA, in the NADH dehydrogenase subunit 6 associated with severe MELAS syndrome. Eur J Hum Genet. 2001;9(10):805–9. [DOI] [PubMed] [Google Scholar]
- 9.Gorman GS, Chinnery PF, DiMauro S, Hirano M, Koga Y, McFarland R, et al. Mitochondrial diseases. Nat Rev Dis Prim. 2016;2:1–23. [DOI] [PubMed] [Google Scholar]
- 10.Zhang W, Cui H, Wong LJC. Comprehensive one-step molecular analyses of mitochondrial genome by massively parallel sequencing. Clin Chem. 2012;58(9):1322–31. [DOI] [PubMed] [Google Scholar]
- 11.Bruderer R, Bernhardt OM, Gandhi T, Miladinović SM, Cheng LY, Messner S, et al. Extending the limits of quantitative proteome profiling with data-independent acquisition and application to acetaminophen-treated three-dimensional liver microtissues. Mol Cell Proteomics. 2015;14(5):1400–10. [DOI] [PMC free article] [PubMed] [Google Scholar]
- 12.Sinitcyn P, Hamzeiy H, Salinas Soto F, Itzhak D, McCarthy F, Wichmann C, et al. MaxDIA enables library-based and library-free data-independent acquisition proteomics. Nat Biotechnol. 2021; [DOI] [PMC free article] [PubMed] [Google Scholar]
- 13.Cui H, Li F, Chen D, Wang G, Truong CK, Enns GM, et al. Comprehensive next-generation sequence analyses of the entire mitochondrial genome reveal new insights into the molecular diagnosis of mitochondrial DNA disorders. Genet Med. 2013;15(5):388–94. [DOI] [PubMed] [Google Scholar]
- 14.E.G. B, W.J. D. A rapid method of total lipid extraction and purfication. Can J Biochem Psychiatry. 1959;37(5):422–422. [DOI] [PubMed] [Google Scholar]
- 15.Muthubharathi BC, Gowripriya T, Balamurugan K. Metabolomics: small molecules that matter more. Mol Omi. 2021;17(2):210–29. [DOI] [PubMed] [Google Scholar]
- 16.Pang Z, Chong J, Zhou G, De Lima Morais DA, Chang L, Barrette M, et al. MetaboAnalyst 5.0: Narrowing the gap between raw spectra and functional insights. Nucleic Acids Res. 2021;49(W1):W388–96. [DOI] [PMC free article] [PubMed] [Google Scholar]
- 17.Saada A. Mitochondria: Mitochondrial OXPHOS (dys) function ex vivo - The use of primary fibroblasts. Int J Biochem Cell Biol. 2014;48(1):60–5. [DOI] [PubMed] [Google Scholar]
- 18.Uittenbogaard M, Chiaramello A. Maternally inherited mitochondrial respiratory disorders: from pathogenetic principles to therapeutic implications. Mol Genet Metab. 2020;131(1–2):38–52. [DOI] [PMC free article] [PubMed] [Google Scholar]
- 19.Grady JP, Pickett SJ, Ng YS, Alston CL, Blakely EL, Hardy SA, et al. mt DNA heteroplasmy level and copy number indicate disease burden in m.3243A>G mitochondrial disease. EMBO Mol Med. 2018;10(6):1–13. [DOI] [PMC free article] [PubMed] [Google Scholar]
- 20.Acin-Perez R, Enriquez JA. The function of the respiratory supercomplexes: The plasticity model. Biochim Biophys Acta - Bioenerg. 2014;1837(4):444–50. [DOI] [PubMed] [Google Scholar]
- 21.Sazanov LA. A giant molecular proton pump: Structure and mechanism of respiratory complex I. Nat Rev Mol Cell Biol. 2015;16(6):375–88. [DOI] [PubMed] [Google Scholar]
- 22.Bai Y, Attardi G. The mtDNA-encoded ND6 subunit of mitochondrial NADH dehydrogenase is essential for the assembly of the membrane arm and the respiratory function of the enzyme. EMBO J. 1998;17(16):4848–58. [DOI] [PMC free article] [PubMed] [Google Scholar]
- 23.Perales-Clemente E, Fernández-Vizarra E, Acín-Pérez R, Movilla N, Bayona-Bafaluy MP, Moreno-Loshuertos R, et al. Five Entry Points of the Mitochondrially Encoded Subunits in Mammalian Complex I Assembly. Mol Cell Biol. 2010;30(12):3038–47. [DOI] [PMC free article] [PubMed] [Google Scholar]
- 24.Mimaki M, Wang X, McKenzie M, Thorburn DR, Ryan MT. Understanding mitochondrial complex I assembly in health and disease. Biochim Biophys Acta - Bioenerg. 2012;1817(6):851–62. [DOI] [PubMed] [Google Scholar]
- 25.Li H, Uittenbogaard M, Hao L, Chiaramello A. Clinical Insights into Mitochondrial Neurodevelopmental and Neurodegenerative Disorders: Their Biosignatures from Mass Spectrometry-Based Metabolomics. Metabolites. 2021;11(4):233. [DOI] [PMC free article] [PubMed] [Google Scholar]
- 26.Patti GJ, Yanes O, Siuzdak G. Metabolomics: the apogee of the omics trilogy. Nat Rev Mol Cell Biol. 2012;13(4):263–9. [DOI] [PMC free article] [PubMed] [Google Scholar]
- 27.Nunnari J, Suomalainen A. Mitochondria: In sickness and in health. Cell. 2012;148(6):1145–59. [DOI] [PMC free article] [PubMed] [Google Scholar]
- 28.Cantó C, Menzies KJ, Auwerx J. NAD+ Metabolism and the Control of Energy Homeostasis: A Balancing Act between Mitochondria and the Nucleus. Cell Metab. 2015;22(1):31–53. [DOI] [PMC free article] [PubMed] [Google Scholar]
- 29.Esterhuizen K, van der Westhuizen FH, Louw R. Metabolomics of mitochondrial disease. Mitochondrion. 2017;35:97–110. [DOI] [PubMed] [Google Scholar]
- 30.Karamanlidis G, Lee CF, Garcia-Menendez L, Kolwicz SC, Suthammarak W, Gong G, et al. Mitochondrial complex i deficiency increases protein acetylation and accelerates heart failure. Cell Metab. 2013;18(2):239–50. [DOI] [PMC free article] [PubMed] [Google Scholar]
- 31.Koga Y, Povalko N, Nishioka J, Katayama K, Kakimoto N, Matsuishi T. MELAS and l-arginine therapy: Pathophysiology of stroke-like episodes. Ann N Y Acad Sci. 2010;1201:104–10. [DOI] [PubMed] [Google Scholar]
- 32.Toda N, Okamura T. The pharmacology of nitric oxide in the peripheral nervous system of blood vessels. Pharmacol Rev. 2003;55(2):271–324. [DOI] [PubMed] [Google Scholar]
- 33.Green DJ, Maiorana A, O’Driscoll G, Taylor R. Effect of exercise training on endothelium-derived nitric oxide function in humans. J Physiol. 2004;561(1):1–25. [DOI] [PMC free article] [PubMed] [Google Scholar]
- 34.Sproule DM, Kaufmann P. Mitochondrial encephalopathy, lactic acidosis, and strokelike episodes: Basic concepts, clinical phenotype, and therapeutic management of MELAS syndrome. Ann N Y Acad Sci. 2008;1142:133–58. [DOI] [PubMed] [Google Scholar]
- 35.Srivastava S. Emerging therapeutic roles for NAD + metabolism in mitochondrial and age-related disorders. Clin Transl Med. 2016;5(1). [DOI] [PMC free article] [PubMed] [Google Scholar]
- 36.Voet D, Voet JG. Biochemistry, 2nd edit. 1995;613:21205. [Google Scholar]
- 37.Munnich A, Rötig A, Chretien D, Cormier V, Bourgeron T, Bonnefont JP, et al. Clinical presentation of mitochondrial disorders in childhood. J Inherit Metab Dis. 1996;19(4):521–7. [DOI] [PubMed] [Google Scholar]
- 38.Munnich A, Rötig A, Chretien D, Saudubray JM, Cormier V, Rustin P. Clinical presentations and laboratory investigations in respiratory chain deficiency. Eur J Pediatr. 1996;155(4):262–74. [DOI] [PubMed] [Google Scholar]
- 39.Naviaux RK. Metabolic features of the cell danger response. Mitochondrion. 2014;16:7–17. [DOI] [PubMed] [Google Scholar]
- 40.McFate T, Mohyeldin A, Lu H, Thakar J, Henriques J, Halim ND, et al. Pyruvate dehydrogenase complex activity controls metabolic and malignant phenotype in cancer cells. J Biol Chem. 2008;283(33):22700–8. [DOI] [PMC free article] [PubMed] [Google Scholar]
- 41.Chol M, Lebon S, Bénit P, Chretien D, De Lonlay P, Goldenberg A, et al. The mitochondrial DNA G13513A MELAS mutation in the NADH dehydrogenase 5 gene is a frequent cause of Leigh-like syndrome with isolated complex I deficiency. J Med Genet. 2003;40(3):188–91. [DOI] [PMC free article] [PubMed] [Google Scholar]
- 42.Liolitsa D, Rahman S, Benton S, Carr LJ, Hanna MG. Is the mitochondrial complex I ND5 gene a hot-spot for MELAS causing mutations? Ann Neurol. 2003;53(1):128–32. [DOI] [PubMed] [Google Scholar]
Associated Data
This section collects any data citations, data availability statements, or supplementary materials included in this article.
Supplementary Materials
Figure S1. Venn diagram of reproducible protein identification from DDA, DirectDIA, and MaxDIA.
Figure S2. Metabolomics principal component analysis plots for individual RP and HILIC modes and ESI modes.
Figure S3. Metabolomics volcano plots for individual RP and HILIC modes and ESI modes.
Table S1. Protein ID List
Table S2. Metabolite ID list
Data Availability Statement
The proteomics and metabolomics datasets have been deposited in the MassIVE online depository (https://massive.ucsd.edu) with the identifier ***.