

Abstract
Immune checkpoint blockade is a promising approach to activate antitumor immunity and improve the survival of patients with cancer. V-domain immunoglobulin suppressor of T cell activation (VISTA) is an immune checkpoint target; however, the downstream signaling mechanisms are elusive. Here, we identify leucine-rich repeats and immunoglobulin-like domains 1 (LRIG1) as a VISTA binding partner, which acts as an inhibitory receptor by engaging VISTA and suppressing T cell receptor signaling pathways. Mice with T cell–specific LRIG1 deletion developed superior antitumor responses because of expansion of tumor-specific cytotoxic T lymphocytes (CTLs) with increased effector function and survival. Sustained tumor control was associated with a reduction of quiescent CTLs (TCF1+ CD62Lhi PD-1low) and a reciprocal increase in progenitor and memory-like CTLs (TCF1+ PD-1+). In patients with melanoma, elevated LRIG1 expression on tumor-infiltrating CD8+ CTLs correlated with resistance to immunotherapies. These results delineate the role of LRIG1 as an inhibitory immune checkpoint receptor and propose a rationale for targeting the VISTA/LRIG1 axis for cancer immunotherapy.
INTRODUCTION
Immune checkpoint inhibitors (ICIs) targeting programmed cell death protein 1 (PD-1) and cytotoxic T lymphocyte associated protein 4 (CTLA-4) boost antitumor T cell responses and improve survival in patients with cancer (1). However, the overall response rate to existing ICI therapies remains low; therefore, the identification of alternative immune checkpoints as therapeutic targets is required. Recent studies have established the role of “stem-like” tumor-specific CD8+ T cells that express T cell factor–1 (TCF-1) and respond to ICI therapies by exiting quiescent states with a proliferative burst (2–8). The mechanisms that maintain the quiescence of TCF-1+ stem-like T cells are not well defined and may underlie the clinical resistance to current immunotherapies.
V domain immunoglobulin suppressor of T cell activation (VISTA)—also known as Dies1, Gi24, PD-1H, or DD1α—is a B7 family immune checkpoint protein and a next-generation immunotherapy target (9–14). Previous studies have indicated that VISTA inhibits T cell activation by two modes of action: VISTA expressed on antigen-presenting cells (APCs) mediates the “trans” suppression by engaging its cognate receptor on T cells, whereas VISTA expressed on T cells elicits “cis” intrinsic suppression (9, 11, 15). In preclinical tumor models, blocking VISTA boosted antitumor immune responses by augmenting the expansion and effector function of cytotoxic T cells (12, 13, 16). Despite the report of PSGL-1 as an acidic pH-dependent binding partner of VISTA (17), other studies have shown that VISTA inhibits T cell activation at neutral pH, possibly through alternative unidentified receptors (9, 15, 18). VSIG3, another binding partner of VISTA, is minimally expressed in normal tissues and absent in immune cell types, rendering it unable to mediate the immunoregulatory function of VISTA under a steady state or during an immunization process (19). Although these studies support VISTA as a potent regulator of antitumor immunity, its elusive signaling mechanisms hinder the development of VISTA inhibitors with precise actions and prevent the identification of biomarkers related to VISTA biology. In this study, we identify leucine-rich repeats and immunoglobulin like domains 1 (LRIG1) as an inhibitory receptor that engages VISTA and controls antitumor immunity by impairing the expansion, survival, and effector function of tumor-specific CD8+ cytotoxic T cells.
RESULTS
VISTA engages LRIG1 on activated T cells in tumors
To identify VISTA-binding receptors at neutral pH, we performed a selective proteomic labeling proximity ligation assay using tyramide (SPPLAT) in activated wild type (WT) versus VISTA knockout (KO) murine splenic T cells (20). After mass spectrometry proteomic analysis, we identified LRIG1, a type-I transmembrane protein with 1092 amino acids as a binding partner of VISTA (fig. S1, A and B) (21, 22). The binding between VISTA and LRIG1 was confirmed in human embryonic kidney (HEK) 293 cells coexpressing VISTA and LRIG1 by using SPPLAT (fig. S1C) and by using an antibody-based co-immunoprecipitation (Co-IP) assay (fig. S1D). The interaction between endogenous VISTA and LRIG1 in murine splenic T cells was validated by the SPPLAT assay (Fig. 1A).
Fig. 1. The interactions of LRIG1 and VISTA and the expression of LRIG1 on activated T cells.
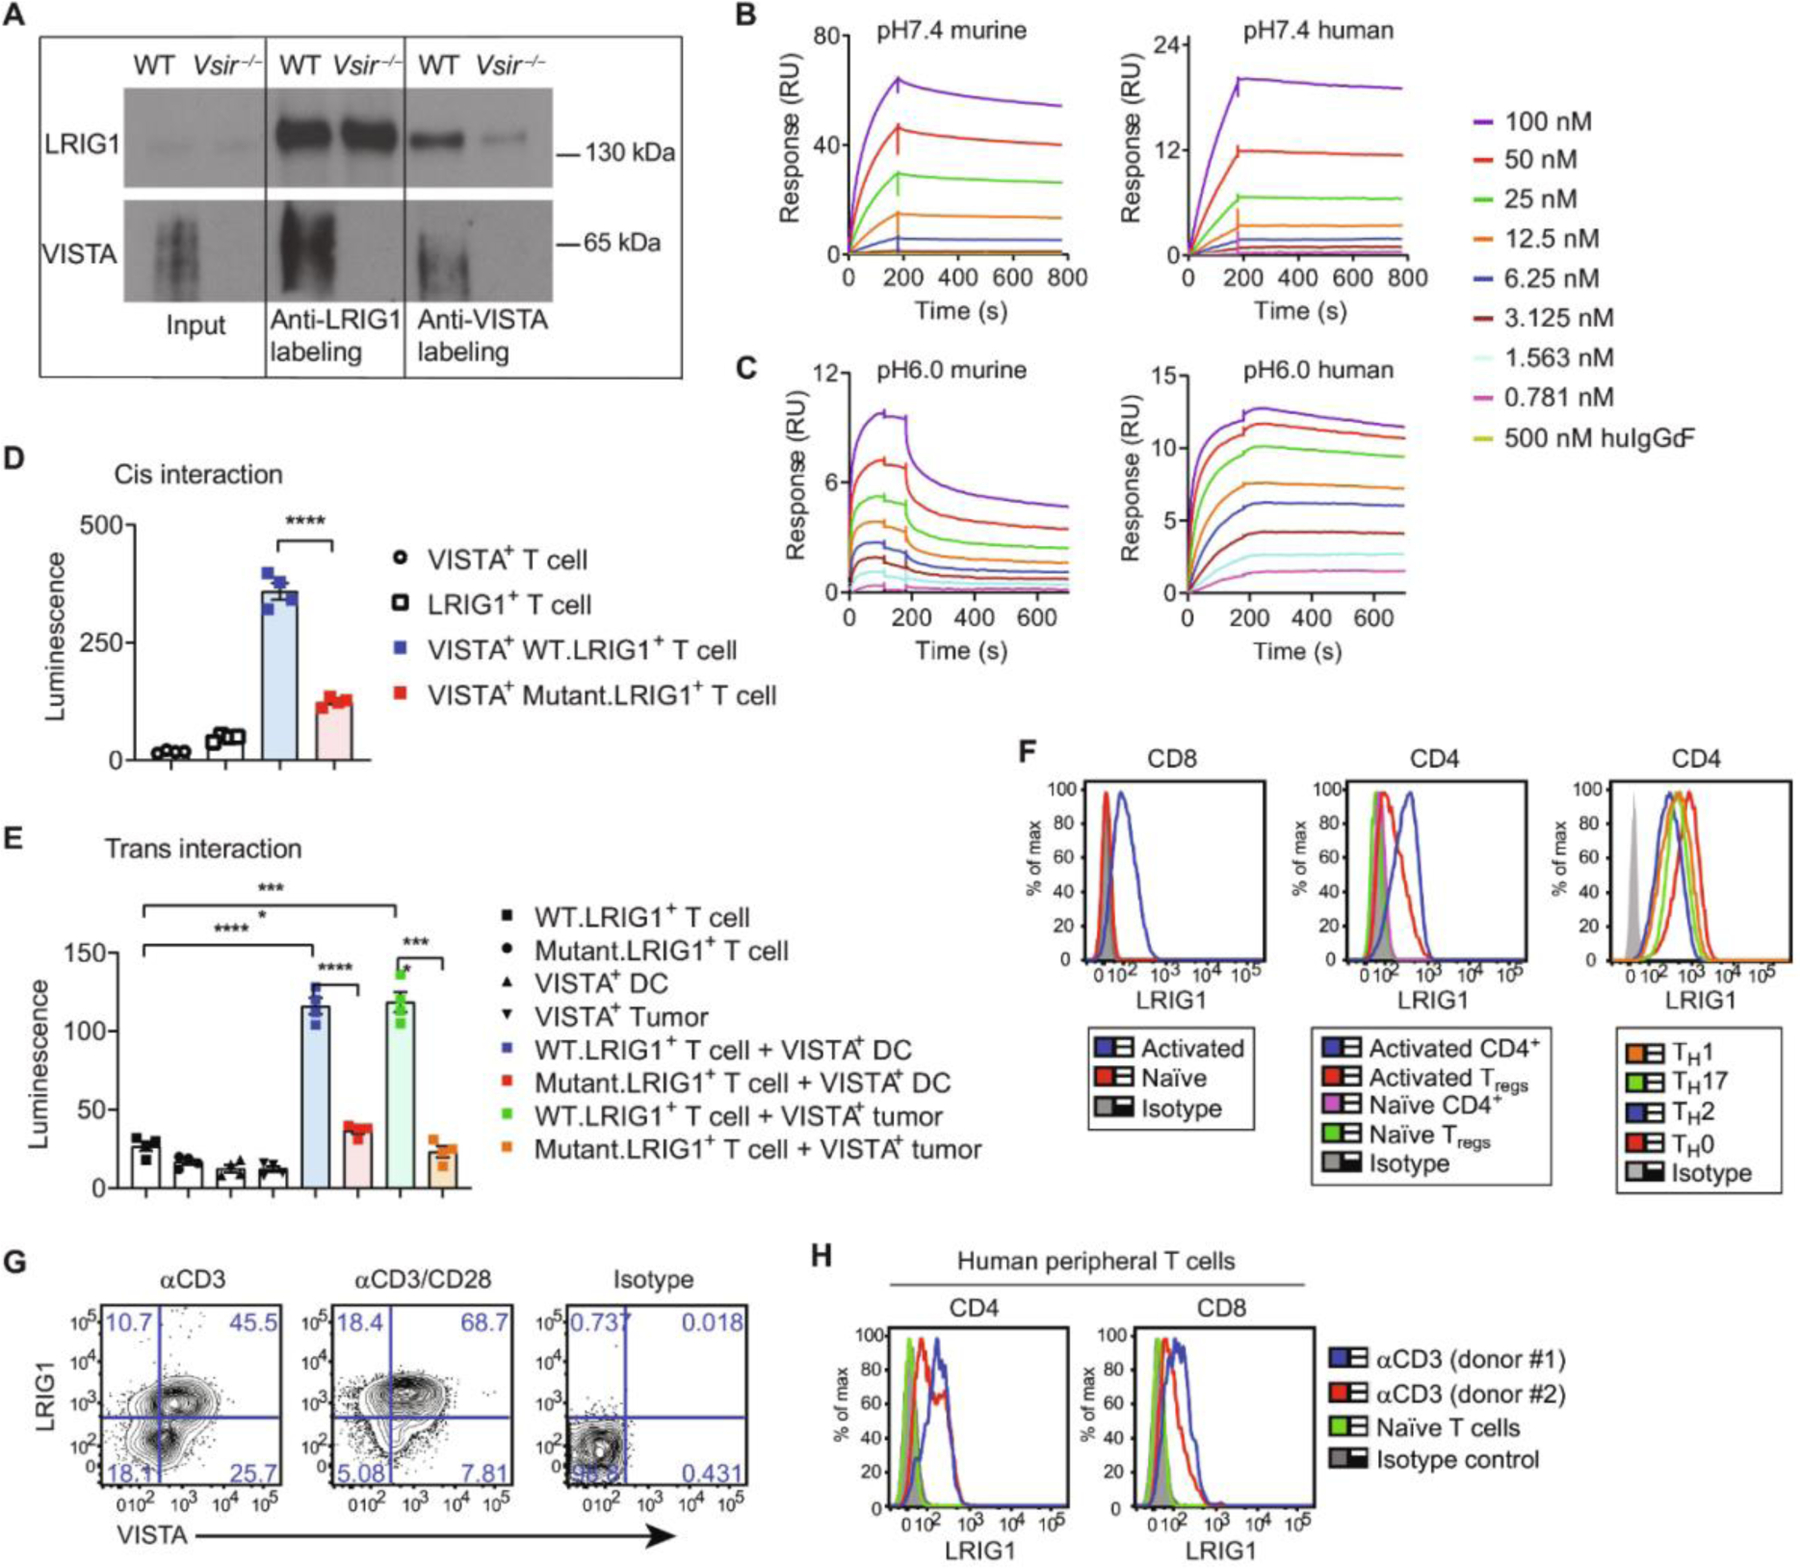
(A) Western blots of immunoprecipitated biotin-labeled proteins from WT and Vsir−/− splenic T cells pre-activated with anti-CD3/CD28 antibodies and analyzed by SPPLAT. (B and C) SPR sensorgrams show the binding of VISTA.ECD or IgG-Fc control protein to LRIG1.ECD at neutral pH 7.4 (B) and acidic pH 6.0 (C). (D) Detection of VISTA/LRIG1 cis interactions in CD8 OVA-expressing T cells by bioluminescence emission. Quantification of luminescence intensity is shown. n = 4. Representative from two independent experiments is shown. (E) Detection of trans interactions between VISTA+ DCs or tumor cells and LRIG1+ T cells. n = 4. Representative of two independent experiments is shown. (F) LRIG1 expression on murine T cells. Splenic T cells were activated with anti-CD3 for 24 hours or cultured under TH0, TH1, TH17, or TH2 skewing conditions for 96 hours before analysis. (G) LRIG1 and VISTA expression on splenic CD8+ T cells that were stimulated with anti-CD3 alone or together with anti-CD28. (H) LRIG1 expression on unstimulated and anti-CD3–activated human peripheral CD4+ and CD8+ T cells from healthy donors. Results are shown as means ± SEM. All experiments were repeated at least two or three times, and the representative results are shown. Unpaired t test was used for (D) and (E). *P < 0.05, ***P < 0.001, and ****P < 0.0001.
The extracellular domain (ECD) of LRIG1 contains 15 repeats of the leucine-rich domains and three Ig-like domains. To determine whether the ECDs of VISTA and LRIG1 are sufficient to mediate their interactions, we performed surface plasmon resonance (SPR) assays using recombinant murine or human ECD proteins of VISTA and LRIG1. Binding sensorgrams showed dose-dependent binding of soluble VISTA.ECD protein to LRIG1.ECD immobilized on the chip at neutral pH 7.4 (Fig. 1B) and acidic pH 6.0 (Fig. 1C) conditions. The binding affinity (KD) was estimated to be 1.20 nM (pH 7.4) and 3.44 nM (pH 6.0) between murine ECD proteins and 1.86 nM (pH 7.4) and 0.23 nM (pH 6.0) between human ECD pairs. These results indicate that VISTA engages LRIG1 via ECD binding.
To validate the direct interaction between VISTA and LRIG1 on the cell surface, we used a luciferase-based binding assay. VISTA may engage LRIG1 either in cis (i.e., when coexpressed in the same cells) or in trans (i.e., when VISTA on APCs engages LRIG1 on T cells). To measure the cis interaction, each protein was tagged at the N terminus with a luciferase subunit (i.e., SmBiT.VISTA and LgBiT.LRIG1) and coexpressed in an ovalbumin (OVA)–specific CD8+ T cell line (CD8OVA) (23). VISTA/LRIG1 coexpression induced a specific luminescent signal compared with the background signal from single receptors (Fig. 1D). To discern the role of the LRIG1 ECD during the cis interaction, we expressed a mutant LRIG1 lacking the entire ECD (LgBiT.DeltaECD.LRIG1) and confirmed the surface expression by flow cytometry (fig. S2). Deleting the LRIG1 ECD significantly diminished the luminescence signal, affirming the involvement of LRIG1 ECD in the cis binding with VISTA (Fig. 1D). To validate that the cis interaction occurs in the tumor microenvironment (TME), we injected LRIG1+VISTA+ T cells into the B16.OVA melanoma tumors and visualized the cis interaction by IVIS bioluminescence imaging (fig. S3A). A positive luminescent signal was induced in T cells coexpressing LgBiT.LRIG1 and SmBiT.VISTA compared with control cells expressing LgBiT.LRIG1 alone. Next, to detect trans interactions, LgBiT.LRIG1+ CD8OVA T cells were mixed with a dendritic cell (DC) cell line (DC2.4) (24) or B16OVA tumor cells expressing SmBiT.VISTA. Luciferase activity was detected only when both VISTA- and LRIG1-expressing cells were present together (Fig. 1E). We noted that antigen recognition was not required for the trans interaction because DCs were not loaded with peptides. Deleting the LRIG1 ECD diminished the trans interaction (Fig. 1E). To measure trans interactions in vivo, LgBiT.LRIG1+ CD8OVA T cells were injected into the B16OVA tumor tissues. Luminescence was detected only in tumors expressing SmBiT.VISTA but not in VISTA-negative tumors (fig. S3B). Because VSIG3 is a known VISTA binder at neutral pH (19), we compared the cis binding of VISTA/VSIG3 versus VISTA/LRIG1 in HEK293 cells and found a similar magnitude of binding (fig. S3C). Together, these results indicate that both cis- and trans-VISTA could engage LRIG1 and that these interactions occur in vitro and within tumor tissues.
Expression of LRIG1 has been reported in stem cells of normal tissues and cancer cells (22, 25–27). LRIG1 expression in lymphocytes has not been investigated. We found that LRIG1 was undetectable on APCs (i.e., DCs and B cells), CD11b+ myeloid cells, and NK cells in naïve mice (fig. S4). In T cells, LRIG1 was not detected on naïve CD4+and CD8+ T cells or Foxp3+ CD4+ regulatory T cells (Tregs) but was induced after anti-CD3/CD28 stimulation (Fig. 1H). Similar expression levels were seen on in vitro generated T helper 0 (TH0), TH1, TH2, and TH17 CD4+ T helper subsets (Fig. 1H). VISTA and LRIG1 were coexpressed on in vitro activated CD8+ T cells, and the higher LRIG1 expression was driven by stronger T cell receptor (TCR) stimulation (Fig. 1I). In human peripheral T cells from healthy donors, LRIG1 expression was not detected at steady state but was induced after ex vivo activation (Fig. 1J). Thus, LRIG1 is highly expressed in both murine and human T cells after TCR activation.
Coexpression of LRIG1 and VISTA in T cells intrinsically inhibits TCR signaling
Having identified that LRIG1 expression is inducible upon T cell activation, we next sought to dissect its functional role. We first examined proximal TCR signaling in a murine T cell line D10.G4.1 stably expressing VISTA, LRIG1, or both proteins. VISTA or LRIG1 alone was functionally inert, but coexpression of both inhibited the phosphorylation of proximal signaling molecules, including linker for activation of T cells (LAT), phospholipase C–γ (PLC-γ), SLP76, AKTS473, and extracellular signal–regulated kinase 1/2 (ERK1/2) (Fig. 2A). Because LRIG1’s cytoplasmic domain is known to transmit intracellular signaling and modulate receptor tyrosine kinase signaling and bone morphogenic protein (BMP) signaling in stem cells and cancer cells (22, 25–28), we expressed a truncated LRIG1 mutant protein lacking its cytoplasmic domain (fig. S5) and examined its suppressive function. We found that the mutant LRIG1 failed to suppress TCR signaling when coexpressed with VISTA (Fig. 2B). Thus, the cytoplasmic domain of LRIG1 is required for its inhibitory function when engaging VISTA.
Fig. 2. Coexpression of LRIG1 and VISTA in T cells intrinsically inhibits multiple TCR signaling pathways.
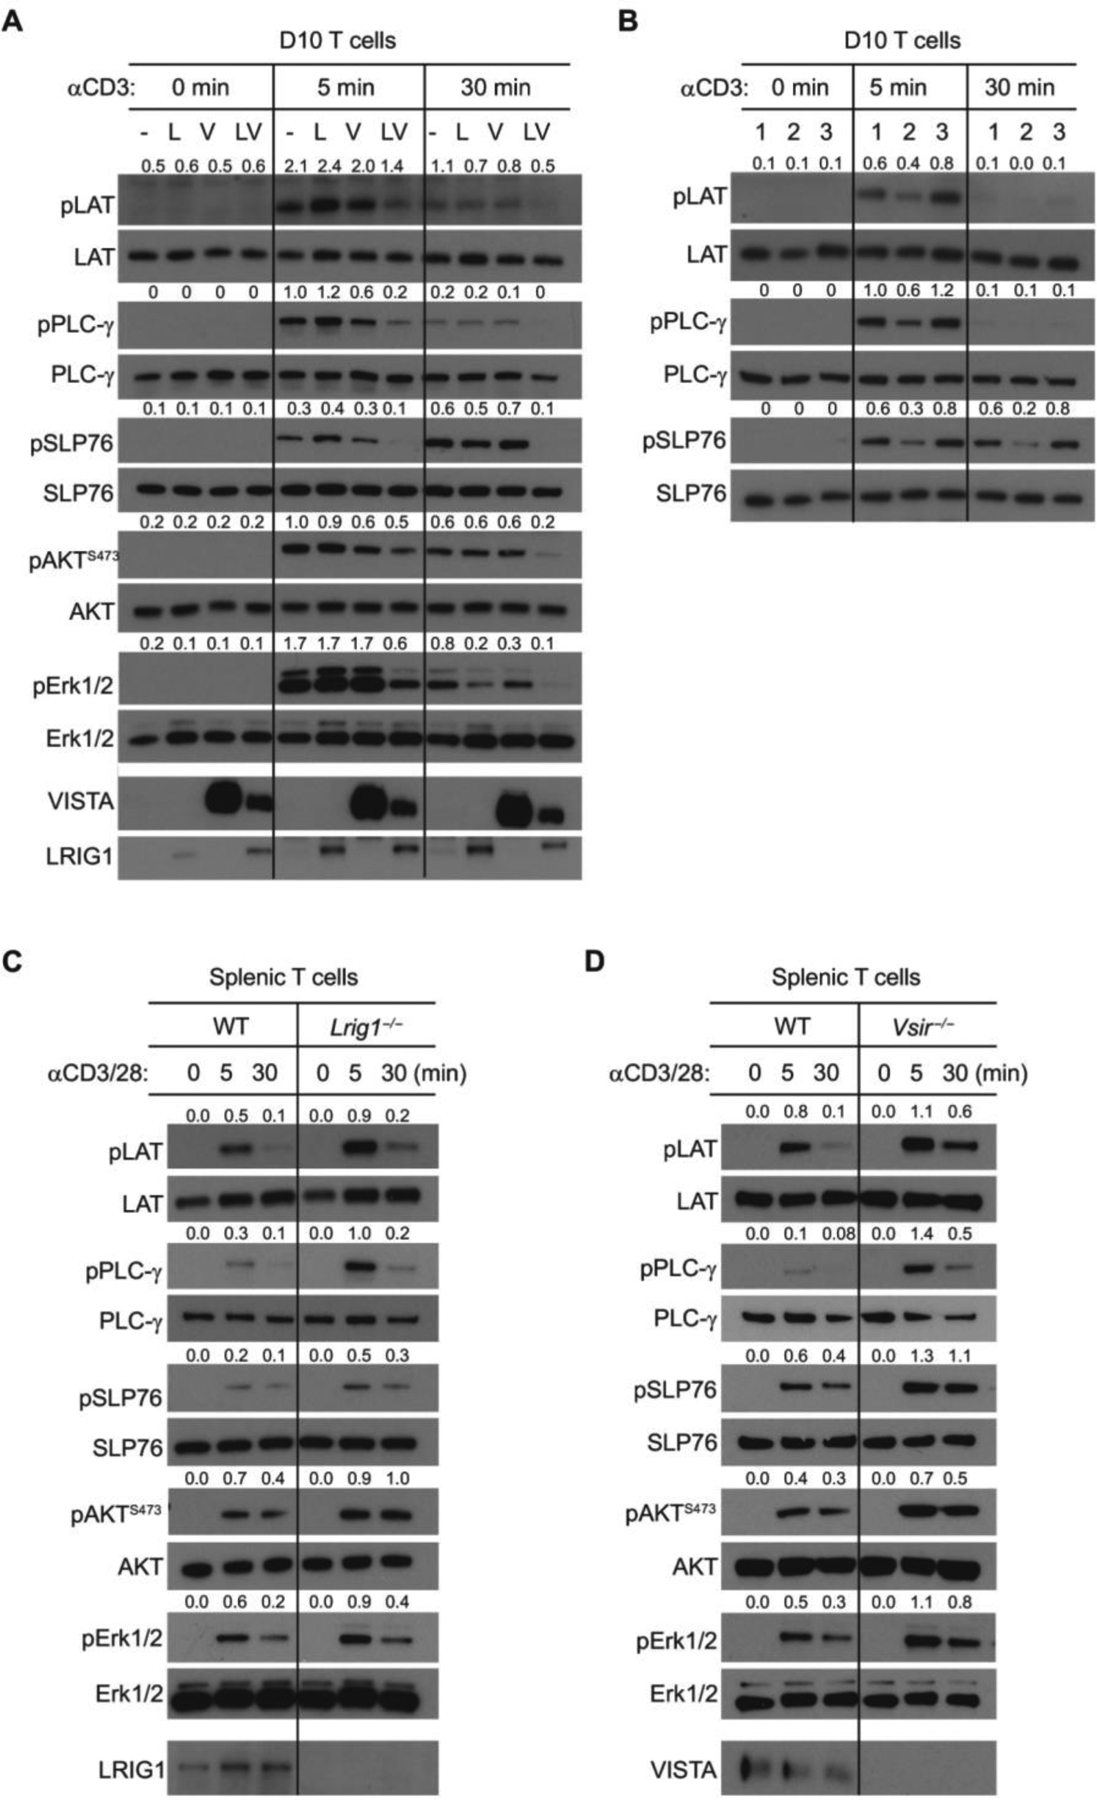
(A) D10 cells expressing LRIG1 (L), VISTA (V), both (VL), or control vector (−) were stimulated with anti-CD3 for 0, 5, and 30 min. Phosphorylation of LAT, PLC-γ, SLP76, AKT473, and Erk1/2 in cell lysates was examined by Western blotting. The ratios of phosphorylated versus total protein levels were quantified and are shown. (B) D10 cells expressing WT LRIG1 alone (lane 1), WT LRIG1 with VISTA (lane 2), or the cytoplasmic domain truncated LRIG1 together with VISTA (lane 3) were stimulated with anti-CD3 and examined as in (A). (C and D) To examine the TCR signaling in splenic CD8+ T cells, WT (Lrig1fl/fl), Lrig1−/− CD8+ T cells (C), or Vsir−/− CD8+ T cells (D) were stimulated with anti-CD3 and anti-CD28 for the indicated time. Total cell lysates were examined by Western blotting. All experiments were repeated at least three times, and the representative results are shown.
Next, we investigated the role of LRIG1 in controlling the responses of primary T cells. To specifically delete LRIG1 in T cells, we generated mice carrying floxed Lrig1 alleles (Lrig1fl/fl) and crossed them with CD4Cre mice. Lrig1fl/flCD4 Cre (Lrig1−/−) mice were born with normal frequency, size, maturation, and fertility. The cellularity of thymocytes and splenocytes was similar in naïve Lrig1−/− mice and WT littermates at 7 to 8 weeks of age (fig. S6, A and B). A moderate reduction of CD4+ T cells was seen in the thymus and spleen, whereas numbers of CD8+ T cells and Tregs were unaltered (fig. S6, C to E). Lrig1−/− splenic T cells did not accumulate CD44hi CD62Llo effector memory-like subsets, indicating normal peripheral T cell tolerance. We also crossed Lrig1fl/flCD4Cre mice with OT1 TCR transgenic mice, permitting us to examine the responses of the same TCR after LRIG1 deletion. We stimulated naïve WT and Lrig1−/− OT1 CD8+ T cells mice by plate-immobilized anti-CD3/CD28 antibodies. LRIG1-deficient CD8+ T cells exhibited augmented TCR signaling compared with WT T cells, as evidenced by elevated phosphorylation of LAT, PLC-γ, SLP76, AKTS473, and ERK1/2 (Fig. 2C). We also examined the TCR signaling in VISTA KO (Vsir−/−) CD8+ T cells and showed that VISTA deletion in T cells augmented proximal and distal TCR signaling that mirrored the phenotype of Lrig1−/− T cells (Fig. 2D). Thus, these results support the hypothesis that the VISTA/LRIG1 cis complex inhibits TCR signaling.
LRIG1 inhibits T cell proliferation, survival, and effector function by engaging VISTA
The broad effects of LRIG1 on TCR signaling prompted us to examine its impact on T cell expansion and effector functions. Naïve WT and Lrig1−/− OT1 CD8+ T cells were stimulated with plate-bound anti-CD3/CD28 antibodies and examined after 96 hours. Lrig1−/− T cells had greater expansion (Fig. 3A), higher cytokine production (Fig. 3B), and decreased cell death (Fig. 3C), and this was correlated with higher expression of anti-apoptotic proteins such as Bcl-xL and X-linked inhibitor of apoptosis protein (XIAP) (Fig. 3D). In addition to TCR crosslinking, we tested antigen-specific responses by coculturing OT1 cells with splenic DCs and OVA peptides. Hyper-expansion and cytokine production occurred in Lrig1−/− OT1 cells after DC and peptide stimulation (Fig. 3E). Lrig1−/− T cells expressed significantly higher levels of CD28 (Fig. 3F), which is known to promote superior cell expansion and survival through its costimulatory signaling (29). These results support the hypothesis that LRIG1 functions as an inhibitory receptor that impairs the proliferation, survival, and effector function of T cells.
Fig. 3. LRIG1 impairs T cell expansion, survival, and cytokine production and is required for the T cell inhibitory effects of VISTA.
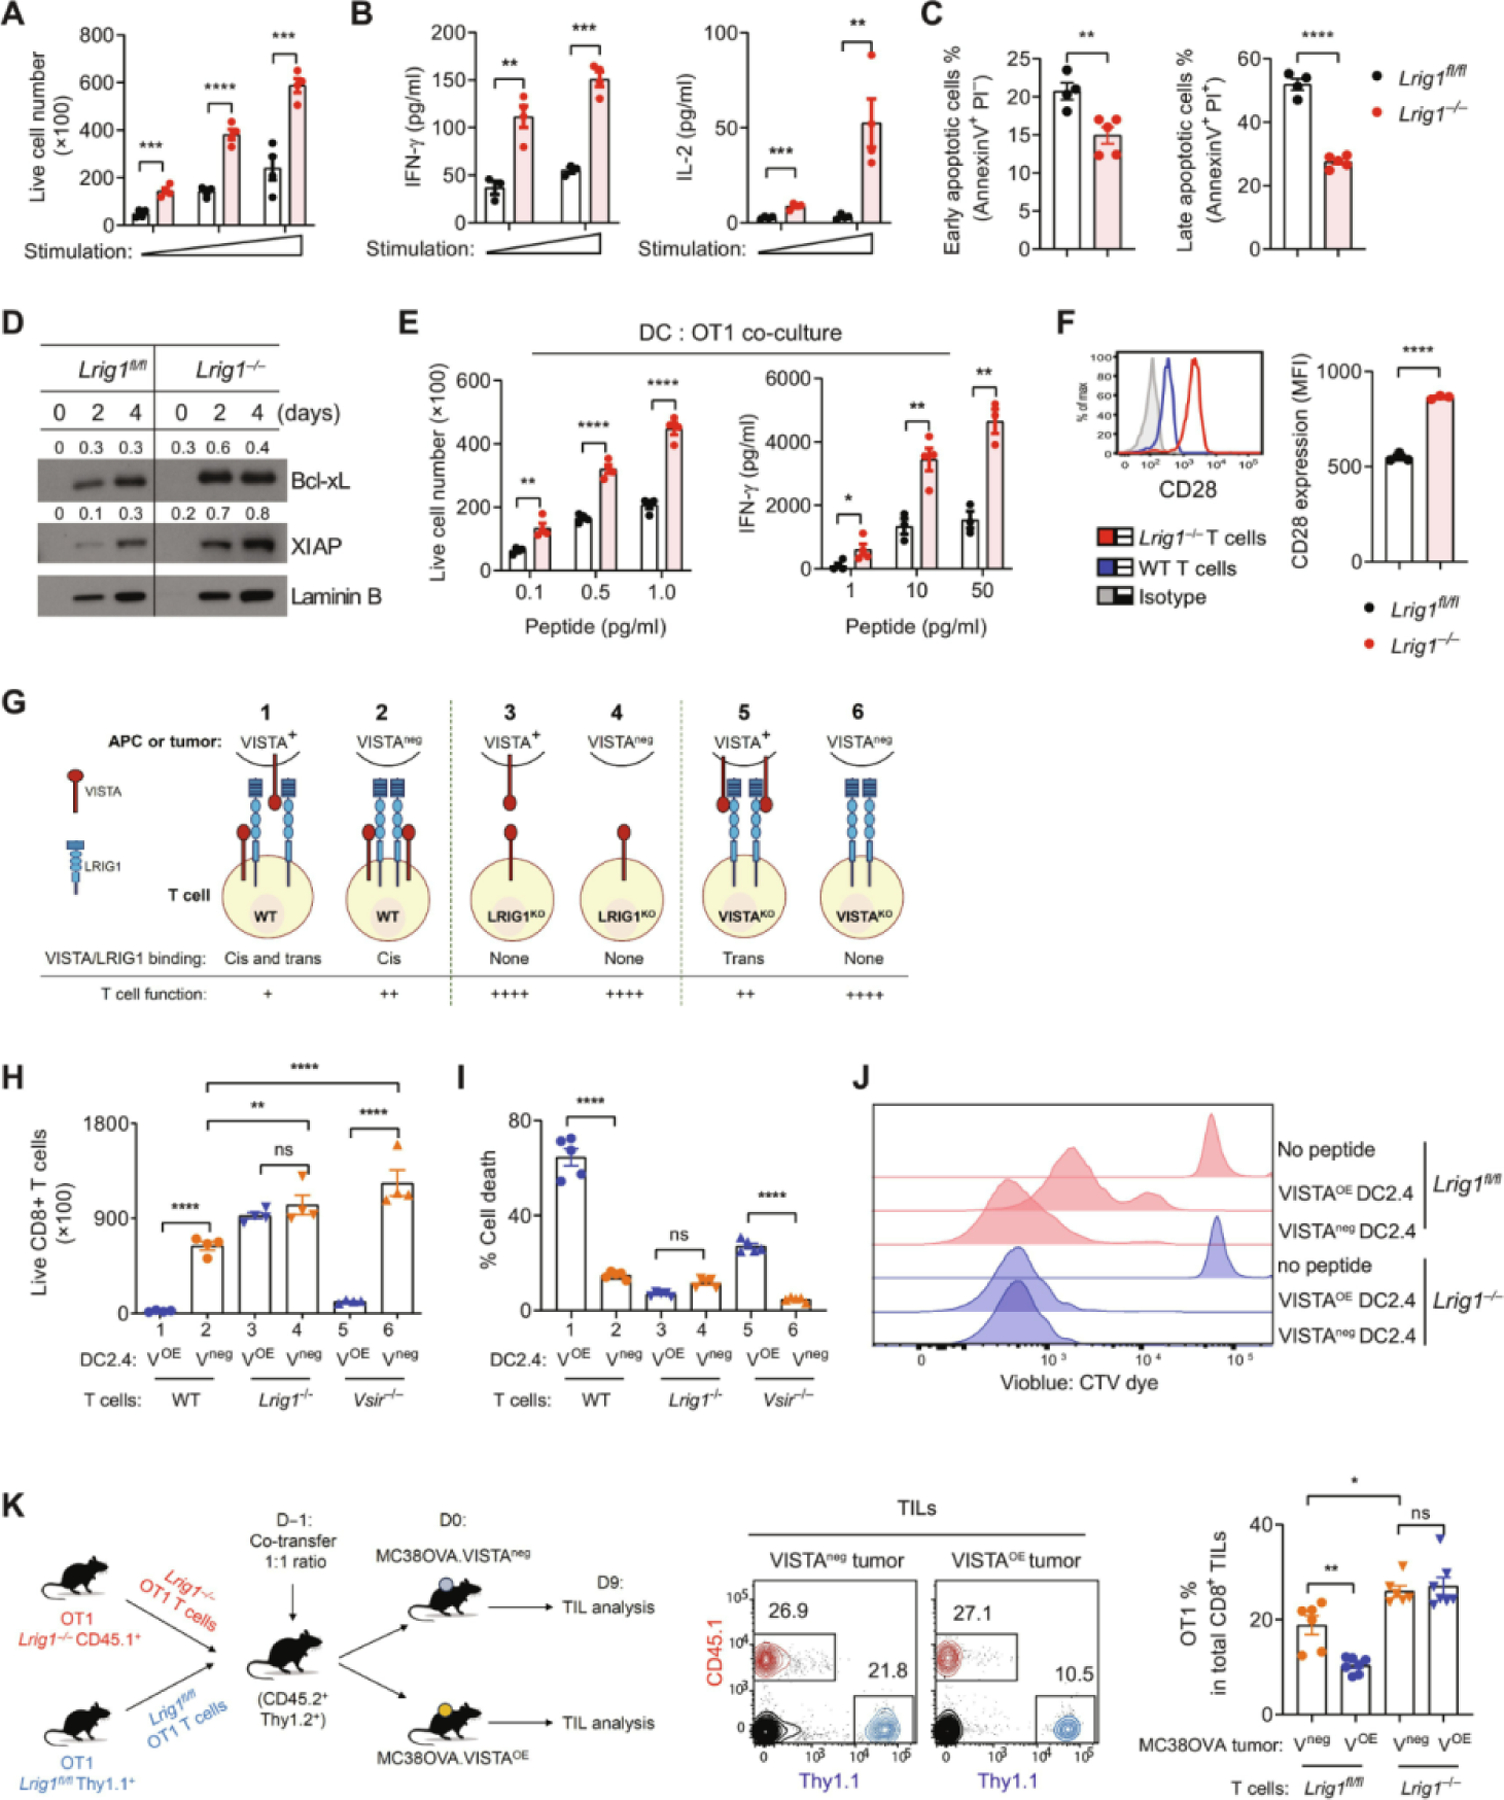
(A to D) WT and Lrig1−/− OT1 splenic T cells were stimulated with varying amounts of plate-bound anti-CD3/CD28 antibodies. (A) OT1 T cell numbers were enumerated after 96 hours. n = 4. (B) Secreted cytokines [(IFN-γ and interleukin-2 (IL-2)] at 48 hours were examined by ELISA. n = 4. (C) Apoptosis in OT1 T cells was examined by annexin V and PI staining. n = 5. (D) Expression of Bcl-xL and XIAP was examined by Western blotting and quantified using ratios over laminin B. (E) WT and Lrig1−/− OT1 T cells were stimulated with splenic DCs and OVA257–264 peptides. OT1 cell expansion and IFN-γ production after 96 hours were examined. n = 4. (F) WT and Lrig1−/− OT1 splenocytes were stimulated with OVA257–264 peptides for 48 hours. CD28 expression was examined, and the mean fluorescence intensity (MFI) was quantified. n = 3. (G) Graphic illustration describes the trans and cis interaction between VISTA and LRIG1. For simplicity, WT T cells were shown as expressing both VISTA and LRIG1. In TILs, the expression of VISTA and LRIG1 may be heterogeneous, and the trans or cis interactions may not occur simultaneously on the same T cells. (H) WT, Lrig1−/−, and Vsir−/− OT1 T cells were cocultured with VISTA-expressing (VOE) or parental (Vneg) DC2.4 cells and peptides. OT1 T cell numbers were enumerated after 96 hours. n = 4. (I) Cell death in OT1 T cells was examined by staining with a viability dye at 96 hours as in (H). n = 5. (J) WT and Lrig1−/− OT1 T cells were labeled with a CellTrace Violet dye and stimulated with DC2.4 cells and peptides as indicated. Cell division was analyzed after 72 hours. (K) Congenically marked WT (Thy1.1+) and Lrig1−/− (CD45.1+) OT1 T cells were cotransferred at a 1:1 ratio (1000 cells each) into naïve mice (CD45.2+ Thy1.2+). Mice were inoculated with either MC38OVA control tumor (Vneg) or VISTA-expressing (VOE) tumor cells (500,000) the next day. Tumor-infiltrating OT1 cells were analyzed by flow cytometry on day 9 and are shown as the percentage of host CD8+ TILs. n = 6 or 7. The cartoon describes the experimental design. Representative from at least two independent experiments is shown for all panels. Unpaired t test was used for (A) to (F). One-way ANOVA was used for (H), (I), and (K). *P < 0.05, **P < 0.01, ***P < 0.001, and ****P < 0.0001. ns, not significant.
Previous studies in preclinical models and human cancer tissues have shown that VISTA is highly expressed within the TME, either on tumor-associated myeloid APCs or aberrantly expressed on tumor cells (12–14, 30–32). The abundance of VISTA in tumor tissues indicates the potential role of trans-VISTA in driving T cell dysfunction. We postulate that within the TME, the combined effects of cis-VISTA on T cells and trans-VISTA from myeloid APCs or tumor cells maximally impair T cell function by engaging LRIG1 (Fig. 3G, condition 1). Lacking either trans-VISTA (condition 2) or cis-VISTA (condition 5) partially elevates T cell responses. LRIG1 deficiency on T cells would abolish both cis- and trans-VISTA function (conditions 3 and 4) and resemble complete VISTA deletion (condition 6), where T cells may exhibit the most heightened responses (Fig. 3G). To discern the effects of the trans-VISTA versus cis-VISTA, we used DC2.4 cells that lack the endogenous VISTA and generated a VISTA-overexpressing isogenic cell line (VOE). WT versus Lrig1−/− OT1 T cells were cocultured with VOE versus control (Vneg) DC2.4 cells (Fig. 3H) and OVA peptides for 96 hours. We found that the expansion of WT OT1 cells stimulated with VOE DCs was significantly reduced compared with cells stimulated with Vneg DCs (Fig. 3H, sample 1 versus sample 2), which reflected the inhibitory effect of trans-VISTA. Lrig1−/− T cells were not sensitive to trans-VISTA–mediated suppression (Fig. 3H, sample 3 versus sample 4), affirming that LRIG1 is the receptor mediating the effects of trans-VISTA. In the absence of trans-VISTA, Lrig1−/− T cells demonstrated better expansion than WT T cells (Fig. 3H, sample 4 versus sample 2), which reflected the effects of T cell–intrinsic VISTA/LRIG1 cis interactions. Given that VISTA KO T cells expressed normal levels of LRIG1 as in WT T cells (fig. S7), we determined whether VISTA KO T cells remained sensitive to trans-VISTA. We found that the expansion of VISTA KO T cells was potently inhibited by trans-VISTA on DCs (Fig. 3H, sample 5 versus sample 6). In the absence of trans-VISTA, VISTA KO T cells exhibited a hyperproliferative response similar to the Lrig1−/− cells (Fig. 3H, sample 6 versus sample 2).
Cell accumulation can occur as a result of cell expansion and survival. To dissect these aspects, we examined cell death in OT1 cells after 96 hours of culture. Trans-VISTA induced substantial cell death in WT OT1 cells (Fig. 3I, sample 1 versus sample 2). Lrig1−/− OT1 T cells were resistant to trans-VISTA–induced apoptosis (Fig. 3I, samples 3 versus sample 4). VISTA KO OT1 T cells were partially sensitive to trans-VISTA–induced cell death (Fig. 3I, samples 5 versus sample 6). In addition to cell death, we examined the proliferative responses of OT1 cells by monitoring dye dilution (Fig. 3J). We found that the proliferation of WT OT1 T cells was impaired by trans-VISTA from DCs, whereas Lrig1−/− OT1 T cells were resistant. Together, these results substantiate the role of LRIG1 in controlling T cell proliferation and survival by engaging VISTA in cis and trans.
Because other VISTA-binding partners such as PSGL-1 may be abundant within tumor tissues, it is important to determine whether VISTA suppresses T cells in an LRIG1-dependent manner within the TME. To address this, we examined the impact of trans-VISTA from tumor cells by generating isogenic MC38OVA tumor cell lines that overexpress VISTA (VOE) versus control cells (Vneg). Congenically marked WT and Lrig1−/− OT1 T cells were mixed at a 1:1 ratio and adoptively transferred into mice bearing MC38OVA Vneg or VOE tumors. The accumulation of OT1 cells in tumor tissues was enumerated on day 9 after transfer (Fig. 3K). WT (Lrig1fl/fl) OT1 T cells were significantly diminished in VOE tumors when compared with Vneg tumors. In contrast, Lrig1−/− OT1 T cells accumulated similarly within Vneg and VOE tumors, affirming their resistance toward trans-VISTA–mediated suppression. Together, these results indicate that LRIG1 is a T cell inhibitory receptor that mediates the suppressive effects of VISTA in vivo.
LRIG1 is induced on activated tumor-specific CD8+ T cells and impairs their expansion and survival
The effects of LRIG1 in controlling T cell expansion prompted us to examine the additional phenotypes of tumor-reactive T cells. The expression of LRIG1 and VISTA on adoptively transferred OT1 T cells was detected in the tumor-draining lymph node (TDLN) as early as 48 hours after tumor inoculation and gradually reduced (Fig. 4A and fig. S8A). LRIG1+ OT1 T cells within tumor tissues were detected as early as 72 hours after tumor inoculation and sustained for several days. In addition to T cells, we examined the expression of VISTA and LRIG1 on tumor-infiltrating myeloid cells. We observed that VISTA was abundantly expressed on DCs and CD11b+ myeloid cells, but LRIG1 was absent (fig. S8B).
Fig. 4. LRIG1 expression is induced early on tumor-specific T cells and impairs T cell persistence by inhibiting cell expansion.
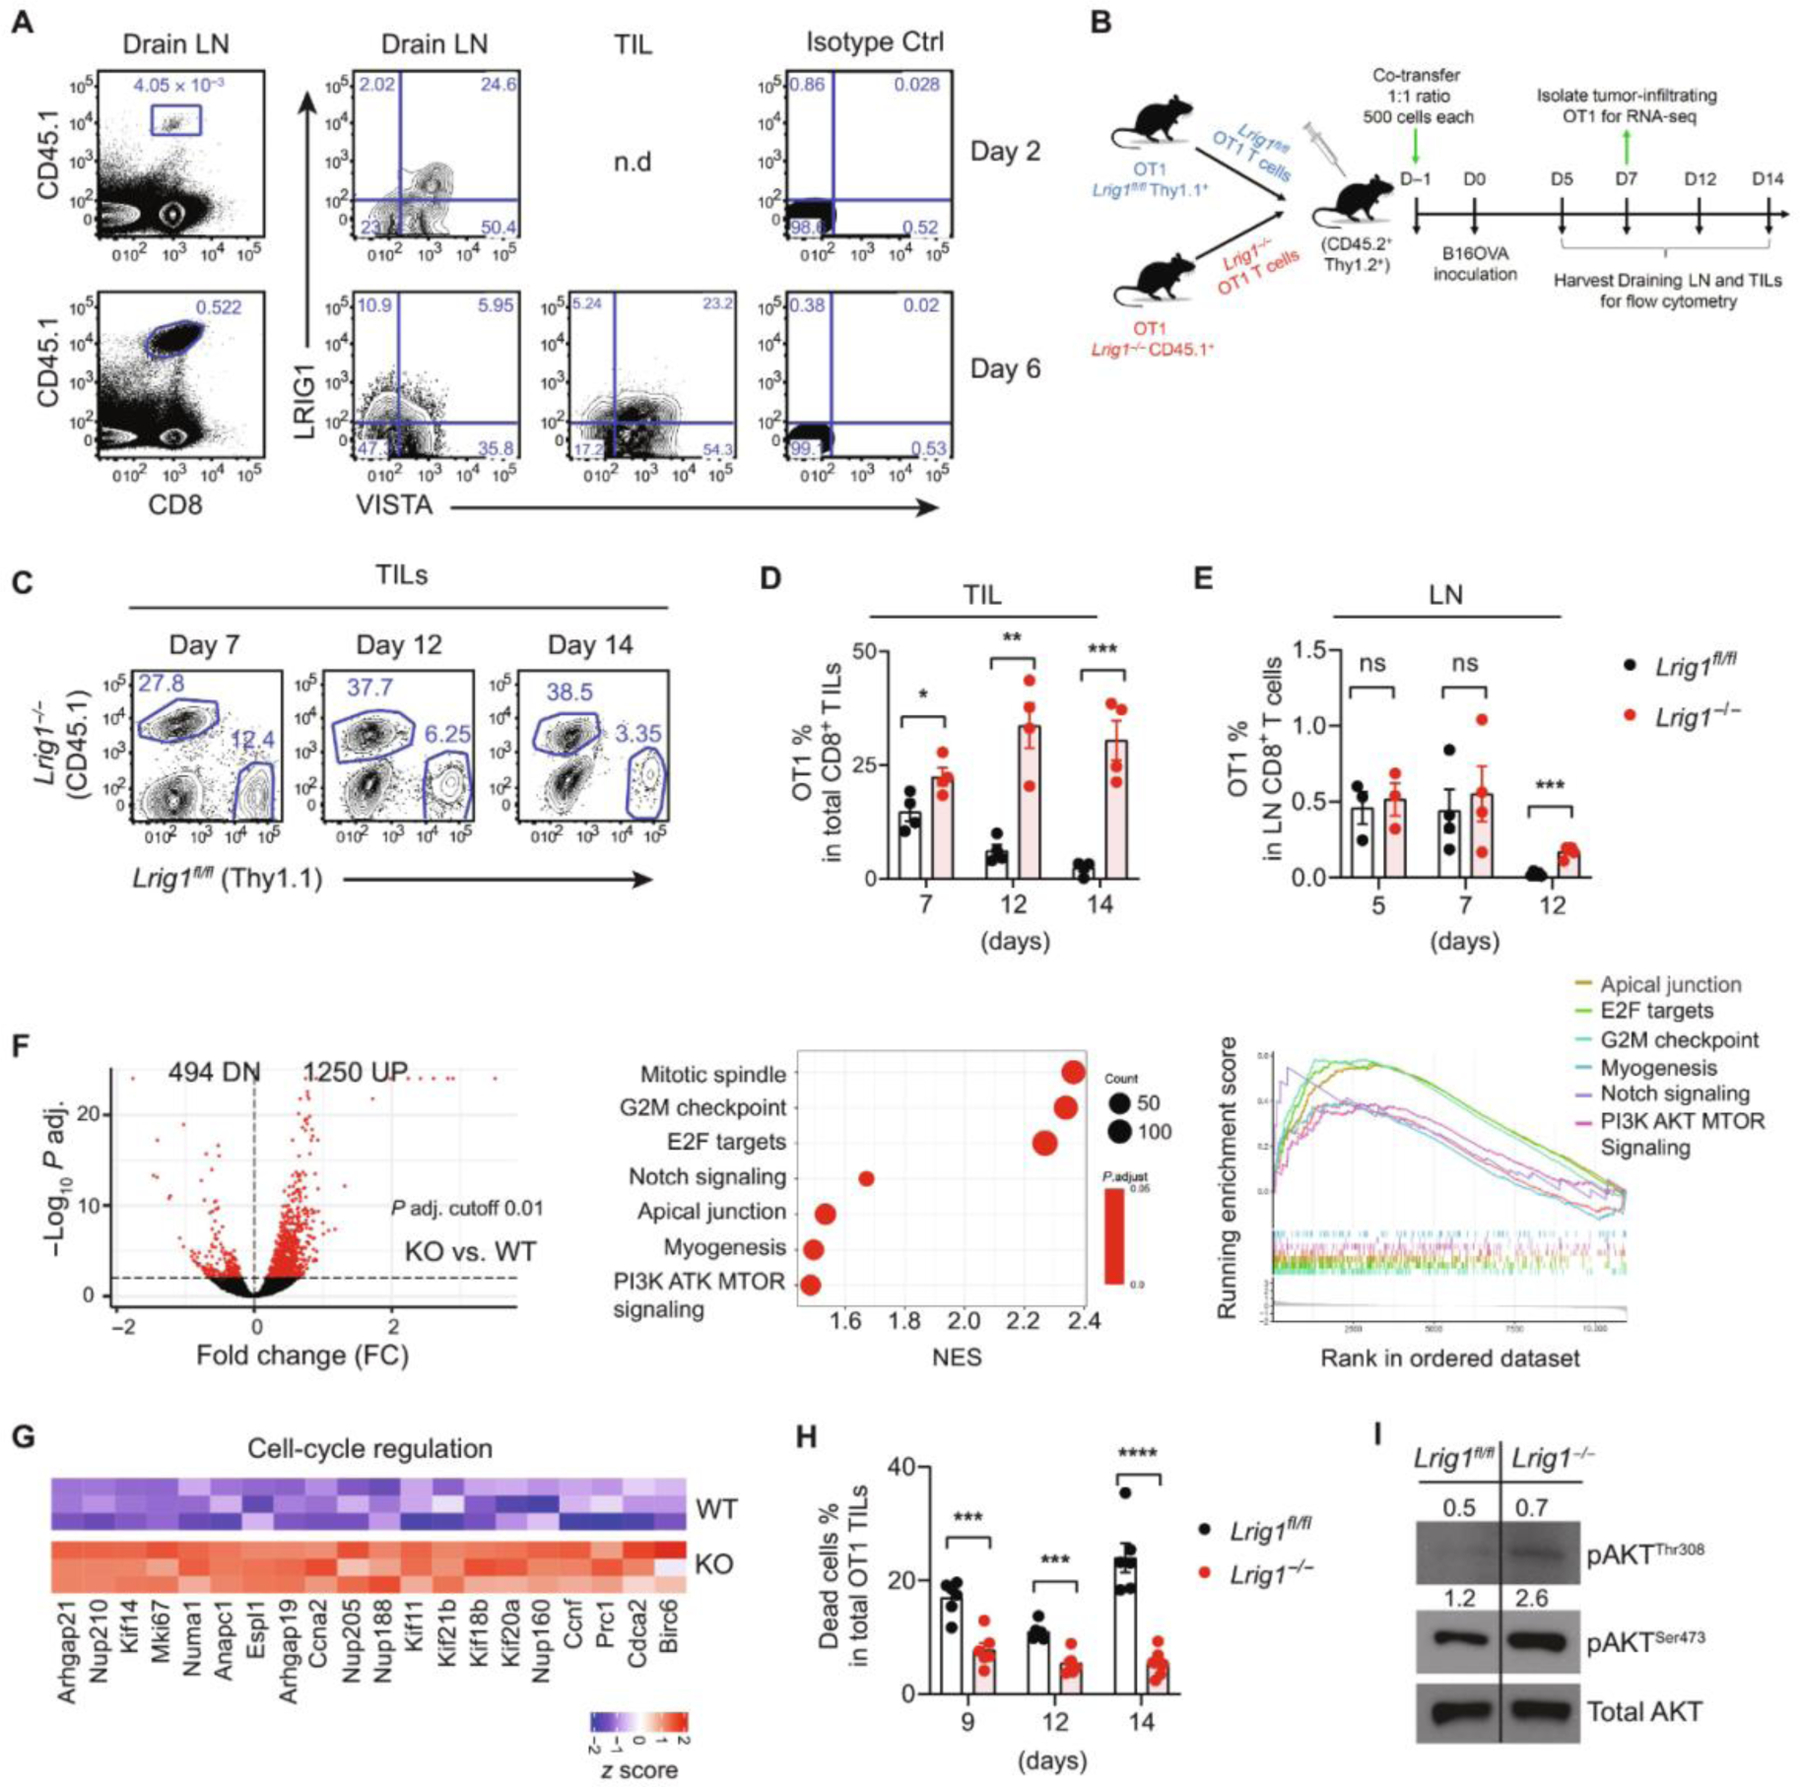
(A) Congenically marked WT OT1 cells were transferred into mice bearing B16OVA tumors. Tumor tissues and TDLNs were harvested on day 2 and day 6. The expression of LRIG1 and VISTA on OT1 T cells was examined by flow cytometry. n.d indicates “not detected.” Representative from two independent experiments is shown. (B) Co-adoptive transfer experimental design: Congenically marked WT (Thy1.1) and Lrig1−/− (CD45.1) OT1 T cells were co-transferred at a 1:1 ratio (500 cells each) into mice (CD45.2). B16OVA tumor cells were inoculated the next day. Tumor tissues and TDLNs were analyzed at indicated time points. (C) Representative flow cytometry plots show the identification of WT versus Lrig1−/− OT1 cells. (D and E) Percentages of OT1 cells among CD8+ T cells in tumor tissues and tumor-draining lymph node (LN) are shown. Representative from two independent experiments is shown. (F) Gene expression analysis of WT and Lrig1−/− OT1 TILs isolated on day 7. Shown are the volcano plot of differentially expressed genes (P value cut-off of 0.01), the enrichment scores of up-regulated pathways, and a graphic view of GSEA leading edge analysis. (G) Genes involved in cell cycle regulation were up-regulated in Lrig1−/− OT1 T cells. (H) Cell death, measured as percentage of cells stained positive by the viability dye, was reduced in Lrig1−/− OT1 TILs on day 7. Representative of two independent experiments is shown. (I) Levels of phosphorylated AKT473 and AKT308 in OT1 TILs on day 7. Unpaired t test was used for (D), (E), and (H). *P < 0.05, **P < 0.01, ***P < 0.001, and ****P < 0.0001. NES, normalized enrichment score.
Next, to monitor the expansion kinetics of WT and Lrig1−/− T cells, congenically marked WT (Thy1.1) and Lrig1−/− (CD45.1) OT1 T cells were cotransferred at a 1:1 ratio into naïve CD45.2 mice followed by B16.OVA tumor inoculation (Fig. 4B). We observed an increase in the ratio of Lrig1−/− OT1 cells to WT cells within TDLN and tumor tissues as time progressed. By day 14, Lrig1−/− OT1 T cells accumulated with at least 10-fold higher abundance than WT OT1 T cells within the tumor tissues (Fig. 4, C to E).
To understand the mechanisms that promoted the expansion and accumulation of Lrig1−/− T cells, we examined the gene expression of OT1 T cells that were sorted out of tumor tissues on day 7. Gene set enrichment analysis (GSEA) revealed multiple up-regulated pathways in Lrig1−/− T cells, including G2M checkpoint, mitotic spindle, E2F targets, notch signaling, apical junction, myogenesis, and PI3K/AKT MTOR signaling (Fig. 4F and data file S1). Genes involved in cell cycle regulation [e.g., kinesin family genes, nucleoporins (Nup), Numa1, Espl1, Anapc1, Mki67, and Ccnf] were significantly up-regulated (Fig. 4G), which was consistent with the superior expansion of Lrig1−/− T cells (Figs. 3 and 4D). We further validated the elevated expression of several genes, including ccnf, E2f2, Mapk3, Prc1, Rptor, and Ki67 (fig. S9). These gene expression signatures collectively support the hypothesis that LRIG1 controls the activation, proliferation, and survival of tumor-specific T cells.
The superior persistence and survival of Lrig1−/− OT1 T cells may allude to an augmented CD28 signaling. CD28-mediated costimulation plays a critical role in activating the phosphatidylinositol 3-kinase (PI3K)–AKT–mammalian target of rapamycin (mTOR) pathway and promoting T cell metabolism, proliferation, and survival (29). Consistent with this notion, higher CD28 expression was seen in Lrig1−/− T cells (Fig. 3F). Lrig1−/− OT1 TILs purified from tumor tissues showed less cell death than WT OT1 cells (Fig. 4H). Corroborating the better survival, LRIG1 KO OT1 cells expressed higher levels of phosphorylated AKT (Ser473 and Thr308), which was likely the result of CD28-mediated costimulation (Fig. 4I). Together, these results indicate that LRIG1 impairs the expansion and survival of tumor-specific cytotoxic T lymphocytes (CTLs) partly by down-regulating CD28-mediated costimulation.
T cell–specific LRIG1 deficiency improves antitumor T cell responses by augmenting the expansion, persistence, and effector function of tumor-specific CD8+ T cells
After identifying superior expansion and survival of Lrig1−/− T cells, we next investigated the role of LRIG1 in regulating antitumor immunity. We have previously shown that VISTA blockade augmented antitumor T cell responses and transiently delayed the growth of B16OVA tumors (16). Similarly, B16OVA tumors grew slower in Lrig1−/− mice (Lrig1fl/fl CD4 Cre) than in WT littermates (Fig. 5A). The delayed tumor growth was associated with reduced cell death (Fig. 5B), increased expansion (Fig. 5C), and improved effector function (Fig. 5D) of Lrig1−/− CD8+ TILs. Lrig1−/− CD8+ TILs also expressed more CD28 (Fig. 5E), which may have contributed to their superior performances.
Fig. 5. T cell–specific deletion of LRIG1 boosts antitumor T cell responses and long-term tumor control in combination with therapeutic vaccine treatment.
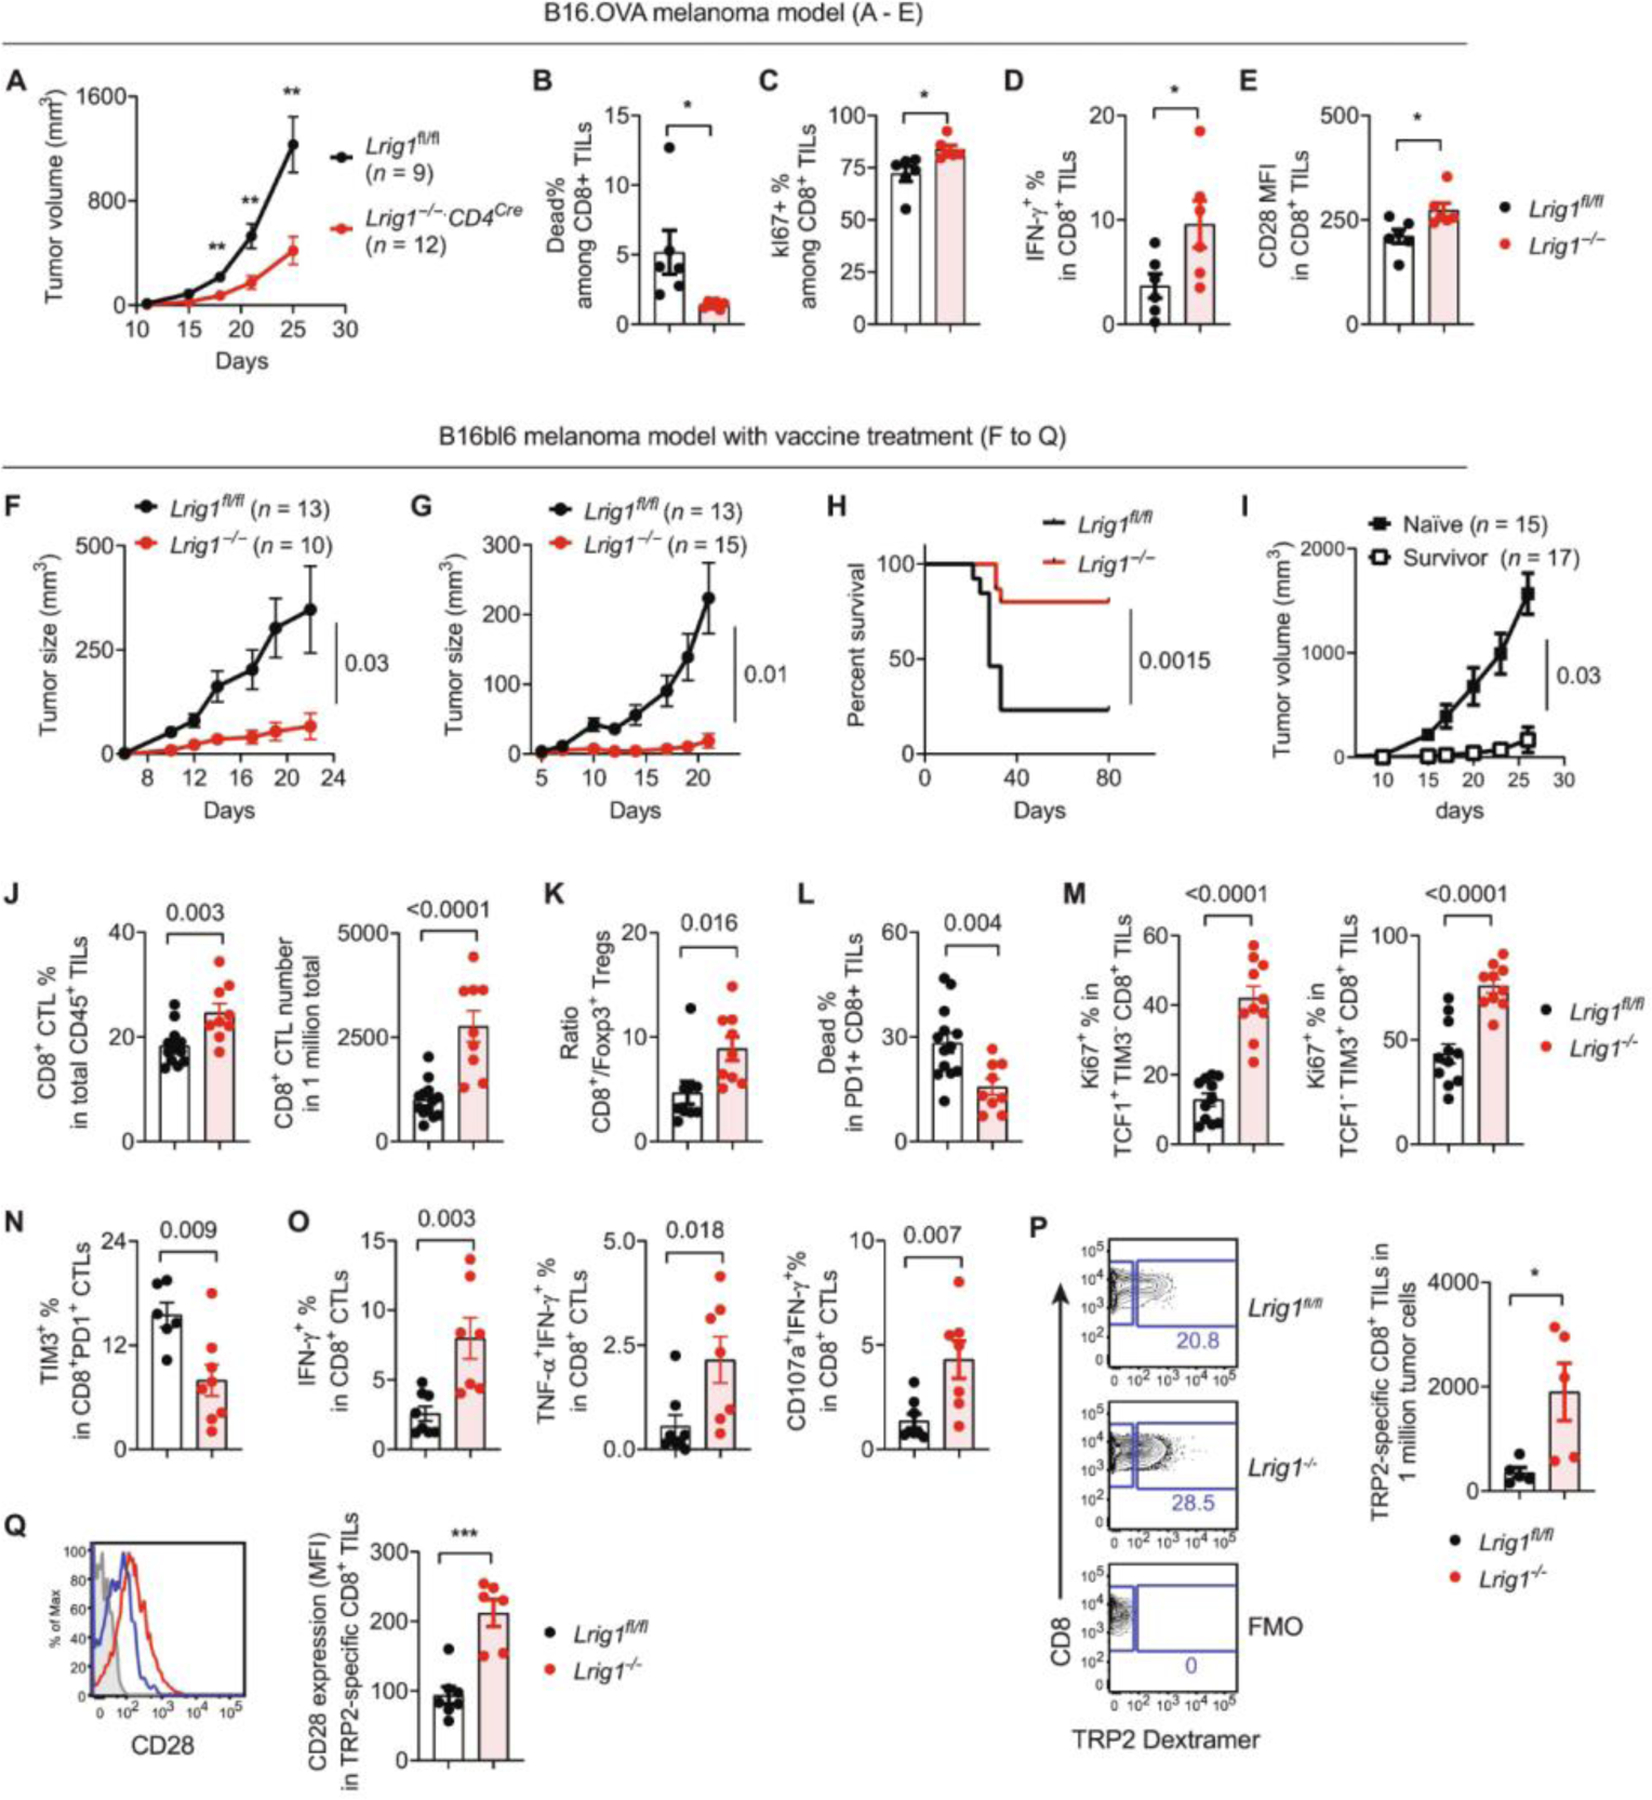
(A to E) Antitumor T cell responses in the B16OVA model: Lrig1−/− mice and WT littermates (Lrig1fl/fl) were inoculated with B16OVA tumor cells (100,000). Tumor growth was monitored by a caliper. Tumor tissues from separate cohorts of mice were examined by flow cytometry. (A) Tumor growth curve. n = 9 (Lrig1fl/fl) and 12 (Lrig1−/−). (B) Viability of CD8+ TILs. n = 6. (C) Ki67 expression. n = 6. (D) IFN-γ expression in CD8+ TILs. n = 6. (E) MFI of CD28 expression on CD8+ TILs. n = 6. (F to I) Tumor growth in the B16bl6 melanoma model. Lrig1−/− mice and WT littermates (Lrig1fl/fl) were inoculated with B16bl6 melanoma cells. On day +3, mice were treated with peptide vaccine (F) or vaccine together with anti–CTLA-4 antibodies (I). Tumor growth curves (F and G) and tumor-free survival after combined therapy (H) were shown. (I) Survived Lrig1−/− mice were rechallenged with B16bl6 tumor cells and monitored for secondary tumor growth. Naïve Lrig1−/− mice were analyzed as parallel control. n = 15 (naïve) and 17 (surviving mice). (J to Q) Antitumor T cell responses. Tumor tissues were harvested on day 18 after vaccine treatment, and CD8+ CTLs were examined by flow cytometry. (J) Percentages of CD8+ CTLs among CD45+ immune infiltrates and the numbers of CD8+ CTLs normalized to total tumor cells. n = 13 (Lrig1fl/fl) and n = 9 (Lrig1−/−). (K) Ratio of CD8+ CTLs to Foxp3+ Tregs. n = 9 (Lrig1fl/fl) and n = 9 (Lrig1−/−). (L) Cell death in PD-1 +CD8+ CTLs. n = 13 (Lrig1fl/fl) and n = 9 (Lrig1−/−). (M) Ki67 expression in progenitor/memory-like (TCF1+ TIM3−) and exhausted (TCF1− TIM3+) CTLs. n = 11 (Lrig1fl/fl) and n = 10 (Lrig1−/−). (N) Proportion of TIM3+ exhausted CTLs among PD1+CD8+ TILs. n = 6 (Lrig1fl/fl) and n = 8 (Lrig1−/−). (O) Expression of IFN-γ, TNF-α, and CD107a in CD8+ TILs after ex vivo stimulation with TRP2 peptides. n = 8 (Lrig1fl/fl) and n =7 (Lrig1−/−). (P) Enumeration of tumor-specific CD8+ CTLs that were identified by TRP2/MHC dextramer staining, compared with fluorescence minus one (FMO) control. n = 5 (Lrig1fl/fl) and n = 5 (Lrig1−/−). (Q) CD28 expression on TRP2-specific CD8+ CTLs. n = 7 (Lrig1fl/fl) and n = 6 (Lrig1−/−). All experiments were repeated at least two times. Unpaired t test was used for (A) to (E) and (J) to (Q). Mann-Whitney test was used for (F) and (G). Log-rank test was used for (H). *P < 0.05, **P < 0.01, and ***P < 0.001.
Despite the augmented antitumor T cell responses, Lrig1−/− mice did not completely reject tumors. We reasoned that the endogenous T cell responses may be boosted by a TLR agonistic peptide vaccine, which improved tumor control in VISTA KO mice (13). Supporting this hypothesis, TLR/peptide vaccine treatment resulted in more effective tumor inhibition in Lrig1−/− mice (Fig. 5F). A combined treatment with peptide vaccine and anti–CTLA-4 blocking antibody further boosted tumor-free survival in ~80% of Lrig1−/− mice, whereas most WT mice succumbed to tumor outgrowth (Fig. 5, G and H). Mice that rejected primary tumors were resistant to secondary tumor challenge (13 of 17 remained tumor free), indicating the presence of tumor-specific memory responses (Fig. 5I). In addition to B16bl6 melanoma, tumor regression was observed in the MC38 colon cancer model in Lrig1−/− mice after treatment with a TLR/peptide vaccine (fig. S10, A and B). Most of the tumor-free mice were protected (7 of 11) from a secondary challenge (fig. S10C).
We postulated that the survival benefit in Lrig1−/− mice reflected the persistence of vaccine-boosted antitumor T cell responses. To understand the molecular characteristics of persistent CTLs, we examined the gene expression of WT and Lrig1−/− CD8+ TILs isolated on day 18 after vaccine treatment (fig. S11, A to C, and data file S2). GSEA analysis revealed molecular pathways that were enriched in Lrig1−/− CTLs, including E2F targets, G2M checkpoint, mitotic spindle, MYC targets, unfolded protein response, and MTORC1 signaling. This gene expression signature indicates a sustained proliferative response of Lrig1−/− T cells within the TME.
Next, we performed flow cytometry analysis to validate the superior proliferation and function of Lrig1−/− T cells. Lrig1−/− TILs showed an enrichment of CD8+ T cells among CD45+ immune infiltrates (Fig. 5J) and an elevated ratio of CD8+/Foxp3+ Tregs (Fig. 5K). Lrig1−/− CD8+ T cells were more viable (Fig. 5L) and hyperproliferative (indicated by higher Ki67 expression) in both exhausted (TCF1− TIM3+) and progenitor/stem-like (TCF1+ TIM3−) subsets (Fig. 5M). Lrig1−/− CD8+ T cells expressed less TIM3 (Fig. 5N) but higher levels of interferon-γ (IFN-γ), tumor necrosis factor–α (TNF-α), and de-granulation marker CD107a (Fig. 5O), indicating less exhaustion and improved effector function. Using a tyrosinase related protein-2 (TRP2)–specific dextramer, we detected a significantly higher abundance of tumor-specific Lrig1−/− CD8+ TILs compared with WT TILs (Fig. 5P). Furthermore, TRP2-specific Lrig1−/− CTLs expressed more CD28, as shown by the percentage and expression intensity (Fig. 5Q). These results collectively provide strong evidence that LRIG1 impairs the expansion, survival, and effector function of tumor-specific CD8+ CTLs.
LRIG1 promotes the quiescence of tumor-specific CD8+ T cells and reduces the abundance of the TCF1+ PD-1+ progenitor-like CTLs
Studies have shown that the relative abundance of TCF1-expressing progenitor-like subsets among tumor-specific CTLs may dictate the longevity of the antitumor responses and responses to current immunotherapies (33). To dissect the heterogeneity of TILs, we isolated CD3+ WT and Lrig1−/− TILs and performed single-cell transcriptomic profiling. After quality control, we identified 7338 WT and 4140 LRIG1 KO TILs (table S1). Unsupervised clustering gave rise to 17 clusters (11,247 cells), with gene markers indicating their identity as CD4+Foxp3+ Tregs (C2), CD4+ T helper cells (C4), and CD8+ CTLs (C0, C1, C3, C5, C8, C9, C10, C12, C13, and C15) (fig. S12, A to F). Next, we removed CD4+ T cells and Tregs and reclustered all CD8+CTLs (2333 WT and 1457 Lrig1−/− CD8+ T cells) into 12 subsets (Fig. 6A and fig. S12, G to I). Cluster identities were defined on the basis of markers associated with T cell activation and functional states. Multiple clusters (C1, C2, C0, C8, C9, and C10) expressed Tcf7, a gene associated with T cell stemness (7, 34). Both C1 and C2 displayed naïve/memory-like gene signatures (e.g., Tcf7, Il7r, Sell, Ccr7, Klf2, Lef1, S1pr1, and Slamf6) (Fig. 6B and fig. S12, G to I). C1 lacked expression of activation and effector function genes (e.g., Cd69, Pdcd1, Klrc1, Klrk1, klrg1, Ifng, and Gzmb) and inhibitory receptors (e.g., Hacvr2, Lag3, and Tigit), thus resembling quiescent “naïve-like” cells as described in a previous study (4). C2 expressed memory-related genes as in C1 but up-regulated activation and effector function genes (e.g., Klrk1, Cd69, Pdcd1, Klrc1) and gained Tox expression, thus resembling the progenitor exhausted cells (Tpex) described in cancers and chronic viral infections (5, 7, 34, 35). Compared with C2, C0 expressed lower levels of Tcf7 and Cd69 and lost several naïve/memory-related genes (e.g., Sell, Ccr7, and Lef1), thus resembling an effector-like Tpex subset (Tpex-2) (35). Compared with C0/C1/C2, C9 expressed a higher level of Tox, activation marker Klrc1, and co-inhibitory receptors (Pdcd1 and Lag3), as well as higher Lrig1 expression. Thus, C9 resembled a distinct type of Tpex cells that appeared to be highly activated. C8 and C10 showed similarity to tissue-resident memory cells that expressed Itgae and Cd69 (36). C10 expressed gamma delta (γδ) TCRs and is distinct from TCRαβ T cells.
Fig. 6. Loss of LRIG1 reduces the quiescence of tumor-specific CD8+ CTLs and increases the abundance of progenitor/memory-like subsets.
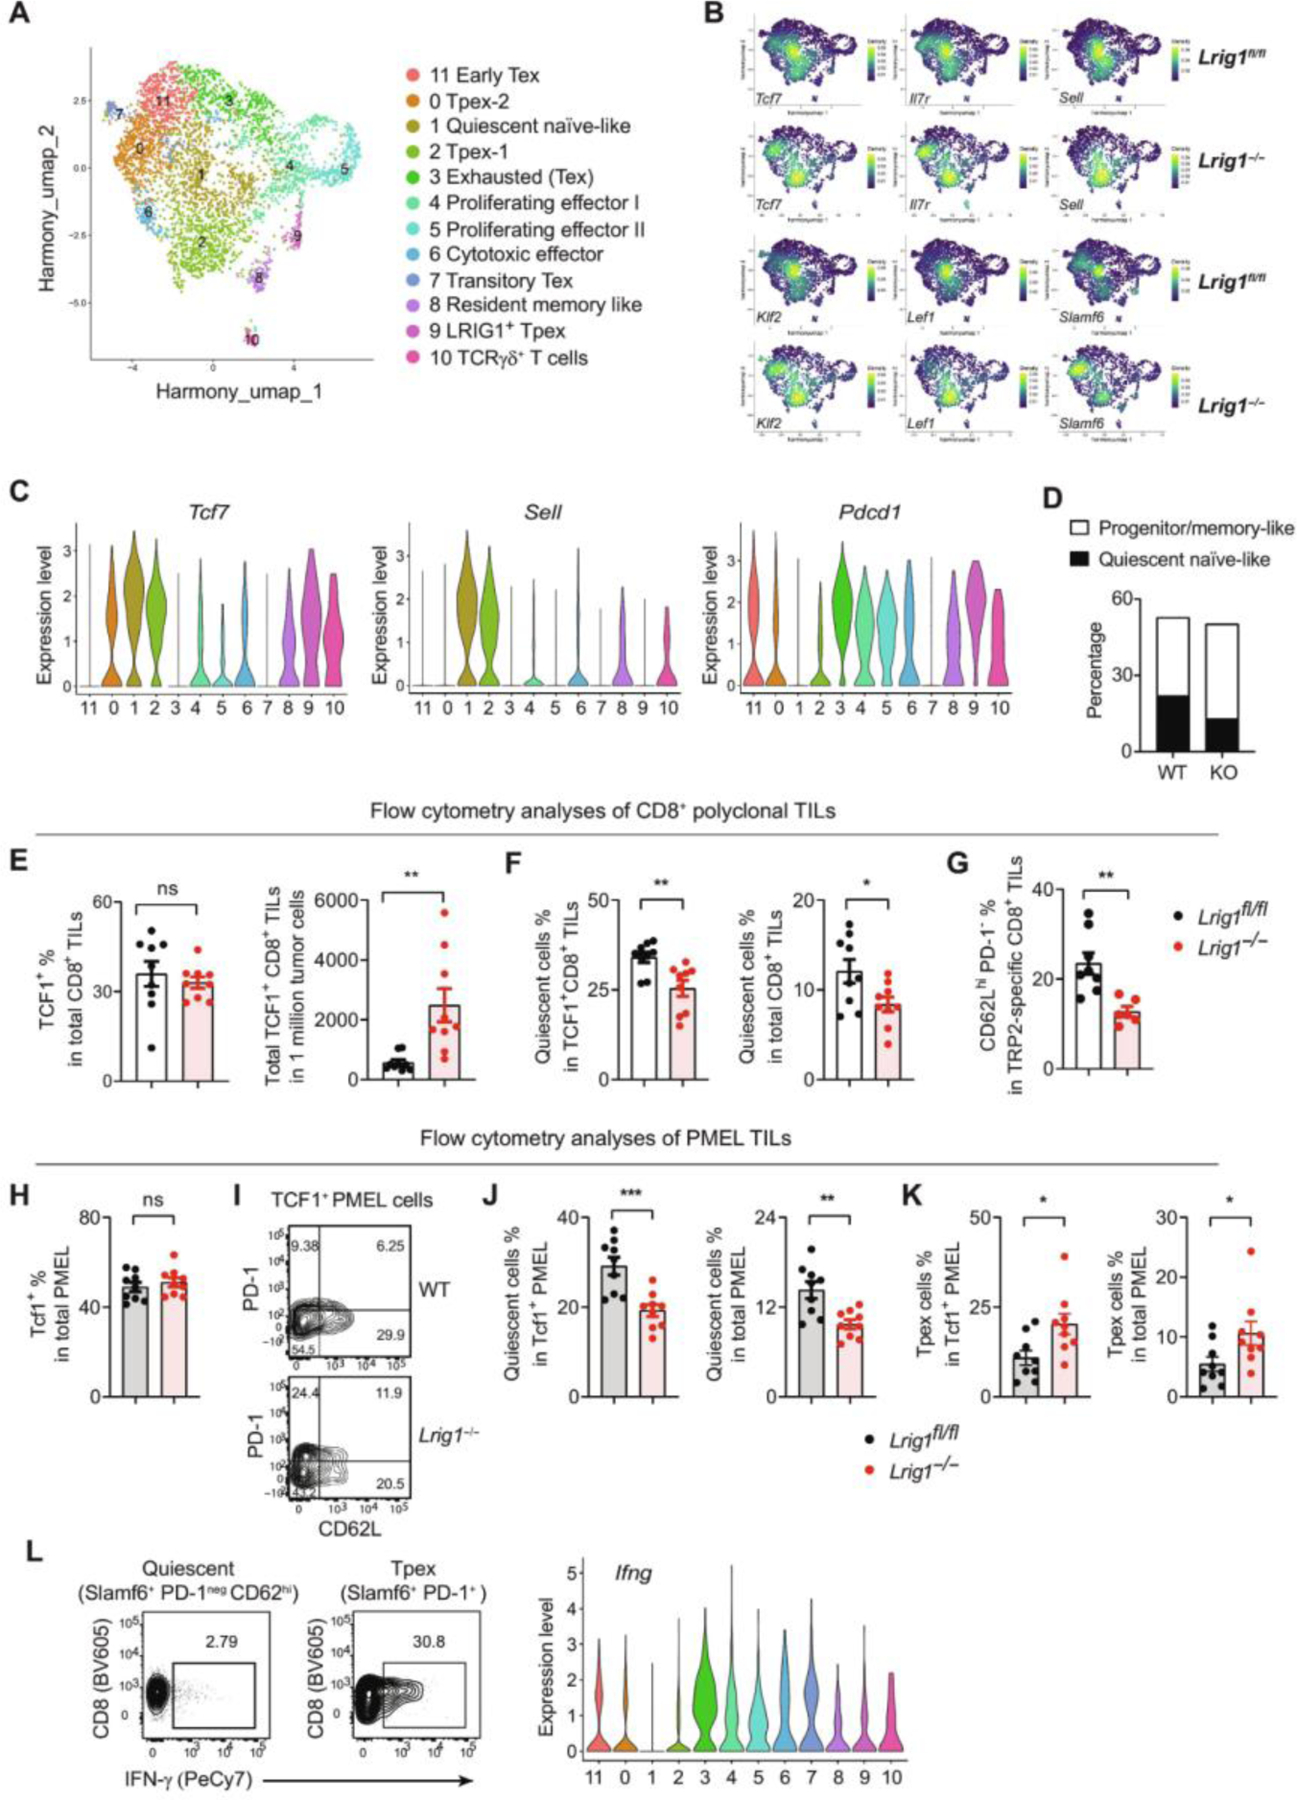
CD3+ TILs were sorted from tumor tissues (pooled from 10 mice for each genotype) on day 18 after vaccine treatment and analyzed by scRNA-seq. (A) Uniform Manifold Approximation and Projection (UMAP) clusters of CD8+ TILs. (B) Expression of marker genes enriched in naïve-like and progenitor/memory-like T cells is illustrated in UMAP space. (C) Expression of genes Tcf7, Sell, and Pdcd1 distinguishes the quiescent C1 cluster from progenitor/memory-like clusters (i.e., C0, C2, C8, and C9). (D) Percentages of quiescent naïve-like C1 cluster versus progenitor/memory-like cells (combined clusters C0/C2/C8/C9) among total CD8+ TILs. (E to G) Flow cytometry analyses to quantify the subsets of CD8+ TILs. Shown are the percentages and numbers of TCF1+CD8+ TILs (n = 9) (E), percentages of quiescent (TCF1+ CD62Lhi PD-1−) cells among TCF1+ CD8+ TILs or total CD8+ TILs (n = 10 and 9) (F), and percentages of quiescent cells (CD62Lhi PD-1−) among TRP2/MHC dextramer-specific CTLs (n = 8 and 6) (G). (H to K) Studies of adoptively transferred PMEL T cells. Pre-activated WT (Thy1.1+ Thy1.2−) and Lrig1−/− (Thy1.1+ Thy1.2+) PMEL T cells were mixed at a 1:1 ratio (200,000 each) and adoptively transferred into mice (Thy1.1−Thy1.2+) bearing established B16bl6 tumors. Tumor tissues were harvested on day 7 after transfer and examined by flow cytometry. (H) Total TCF1 expression. n = 9. (I) Representative plots show the quiescent (TCF1+ CD62Lhi PD-1neg) and Tpex (TCF1+ PD-1+) subsets among TCF1+ PMEL cells. Percentages of quiescent and Tpex subsets were shown in (J) and (K), respectively. n = 9. (L) Polyclonal quiescent and Tpex subsets of CD8+ TILs were sorted from B16bl6 tumor tissues and restimulated ex vivo by anti-CD3/CD28 for 16 hours. IFN-γ expression was examined by flow cytometry. The Ifng gene expression from CD8+ TILs is shown as a comparison. All experiments were repeated at least two times. Unpaired t test used for (E) to (H) and (J) and (K). *P < 0.05, **P < 0.01, and ***P < 0.001.
The remaining CTL clusters lost Tcf7 expression, indicating their terminally differentiated states. C3 (exhausted cells, Tex) expressed higher levels of Tox and Nr4a2, effector function genes (e.g., Ifng, Gzmb, and Prf1), and co-inhibitory receptors (Pdcd1, Lag3, Havcr2, and Ctla4) (37). C11 (early Tex) showed an intermediate exhaustion state (early Tex) and expressed high levels of Tox and effector function genes (e.g., Ifng, Tnfa, and Gzmb) but low levels of Lag3 and no Havcr2. C4 and C5 are proliferative cytotoxic effectors expressing Mki67 and effector genes (Gzmb, Prf1, and Ifng). C6 are cytotoxic effector cells that displayed cytotoxicity genes (Gzmb and Prf1) and IFN-stimulated genes (e.g., Isg15 and Ifit1/3) but lacked exhaustion genes (Pdcd1, Havcr2, and Tox). C7 (transitory Tex) did not express any naïve/memory-related genes but expressed activation genes (e.g., Cd69, Klrg1, and Cx3cr1) that align with the “transitory Tex” phenotype as described previously (38).
By quantifying the proportion of each cluster within the CD8+ CTLs, we found that in comparison with WT CTLs, Lrig1−/− CTLs displayed a significant reduction of the C1 subset (from 22% in WT to 13% in KO), which resembled quiescent naïve-like cells with the gene expression profile of Tcf7+ Il7r+ Klf2+ Ccr7+ Sell+ Pdcd1neg (Fig. 6, B to D and fig. S12I). To validate this finding, we performed flow cytometry analysis to enumerate the quiescent (TCF1+ CD62Lhi PD-1neg) CD8+ CTLs (fig. S13A; gating strategy). Although the TCF1 expression was not altered, the abundance of TCF1+ Lrig1−/− CD8+ TILs was significantly higher than the WT counterparts, affirming the role of LRIG1 in suppressing T cell expansion (Fig. 6E). Consistent with the single-cell RNA sequencing (scRNA-seq) results, the percentage of quiescent CTLs was significantly reduced, both within the TCF1+ subsets or among total Lrig1−/− CD8+ TILs (Fig. 6F). We also examined tumor-specific T cells by using TRP2/major histocompatibility complex dextramer staining and confirmed that Lrig1−/− TRP2-specific CTLs contained a reduced proportion of quiescent cells (CD62Lhi PD-1neg) compared with those in WT cells (Fig. 6G).
Because quiescent T cells resemble naïve T cells, we wondered whether the quiescent cells originated from activated tumor-specific T cells rather than from circulating naïve T cells. To address this, we examined the differentiation of melanocyte protein PMEL transgenic CD8+ T cells that recognize a melanoma-associated antigen, gp100 (39). Congenically marked WT (Thy1.1+ Thy1.2−) and Lrig1−/− (Thy1.1+ Thy1.2+) PMEL T cells were pre-activated ex vivo for 48 hours, cotransferred at a 1:1 ratio into hosts (Thy1.1− Thy1.2+) bearing established B16 melanoma, and examined on day +7 after transfer (Fig. 6, H to K). Similar to polyclonal CD8+ TILs, LRIG1 deficiency did not alter the total expression of TCF1 (Fig. 6H) but significantly reduced the quiescent proportion (TCF1+ CD62Lhi PD-1neg) within the TCF1+ subset and among total CD8+ TILs (Fig. 6, I and J). The reduction of quiescence was accompanied by a reciprocal increase of Tpex cells (TCF1+ PD-1+/low) (Fig. 6K).
TCF1+ PD-1+ Tpex cells are capable of self-renewal and differentiating into effector cells (3, 5, 33). It is unclear whether quiescent CTLs may gain effector function upon restimulation; therefore, we next sorted via fluorescence-activated cell sorting quiescent CD8+ TILs (SLAMF6+ CD62Lhi PD-1neg) and Tpex subsets (SLAMF6+ PD-1+) (fig. S13B; sorting strategy) and examined their responses after ex vivo stimulation. Tpex cells showed robust expression of IFN-γ, whereas quiescent CTLs remained nonresponsive (Fig. 6L). The expression pattern of IFN-γ protein also mirrored the Ifng gene expression in the quiescent C1 and Tpex (C0, C2, C8, and C9) subsets. Together, these results substantiate the role of LRIG1 in promoting the quiescence of CD8+ T cells, thereby limiting the abundance of progenitor/memory-like cells that can differentiate into functional effectors.
It has been reported that LRIG1 is expressed in Foxp3+ CD4+ Tregs and modulates the suppressive function of Tregs in autoimmune disease models (40). To substantiate the direct role of LRIG1 in regulating tumor-specific CD8+ T cells, we generated and examined CD8+ T cell–specific Lrig1−/− mice (Lrig1fl/fl E8iCre) (fig. S14). B16OVA tumor growth was delayed in Lrig1fl/fl E8iCre mice (fig. S14A). This tumor control was associated with an expansion of tumor-specific CD8+ TILs (fig. S14B), a reduced abundance of quiescent CTLs (fig. S14C), and augmented effector function as evidenced by higher IFN-γ production (fig. S14D). These results have solidified the role of LRIG1 in directly controlling the antitumor responses of CD8+ T cells.
LRIG1 is expressed in activated human CD8+ TILs and correlated with resistance to cancer immunotherapies
We next explored LRIG1 expression in human cancers. In melanoma tissues, LRIG1 expression was low in unstimulated CD8+ TILs but was up-regulated upon TCR stimulation, particularly on TCF1+PD-1+ Tpex cells and TCF1−PD-1+–exhausted CTLs (Fig. 7A), indicating that LRIG1 may regulate their expansion and survival. In contrast, VISTA was abundantly expressed on CD8+ TILs both at steady state and after stimulation. Expression of LRIG1 and VISTA was also detected on activated TILs from endometrial tumors and lung cancer tissues (Fig. 7B). Next, we examined a public scRNA-seq dataset of tumor-associated lymphocytes from melanoma patients treated with ICIs (6). Multiple CD8+ TIL subsets were identified on the basis of the authors’ original definitions, including “Cytotoxicity_ lymphocytes,” “Exhausted_CD8,” “Exhausted_Heatshock (HS)_CD8,” “Lymphocytes,” “Lymphocytes_exhausted,” and “Memory_T cells” (Fig. 7B). We noted that the Lymphocytes subset up-regulated the expression of naïve/memory genes (e.g., IL7R, CCR7, TCF-7, etc.) and anti-proliferative genes (e.g., BTG1, TSPYL2, CDKN1A, etc.) while reducing the expression of inhibitory receptors and effector function genes such as GZMB and PRF1 (fig. S15A). GSEA analysis confirmed that when compared with other CTLs, the Lymphocytes subset exhibited a quiescent gene signature and significantly down-regulated genes regulating metabolism, proliferation, and cellular responses to inflammatory cytokines, thus resembling quiescent TILs seen in our murine models (fig. S15, B and C). Next, we enumerated LRIG1+ cells within each CTL subset (Fig. 7C). In responder patients, LRIG1 gene expression was enriched in “Exhausted_ Lymphocytes.” In contrast, in nonresponder patients, LRIG1 gene expression was more widely distributed to all subsets. Comparing the percentages of LRIG1+ cells within each CD8+ T cell subset, we noted that in post-ICI tissues, several CTL subsets (i.e., lymphocytes, “memory_T cells,” and “exhausted_HS_CD8”) contained more LRIG1-expressing cells in nonresponders than responders (Fig. 7C). Accordingly, a significantly higher proportion of CD8+ TILs expressed LRIG1 in nonresponders than responders post-ICI therapy (Fig. 7D). Distinct from LRIG1, higher TCF7 expression was associated with clinical responders in pre-ICI specimens but not in post-ICI tissues. VISTA (Vsir) or TOX expression was not prognostic. These results collectively support the conclusion that LRIG1 is a T cell–inhibitory receptor and that elevated LRIG1 expression in CD8+ T cells is associated with resistance to ICI therapies.
Fig. 7. Expression of LRIG1 in human melanoma tumor infiltrating CD8+ T cells is associated with resistance to immunotherapy.
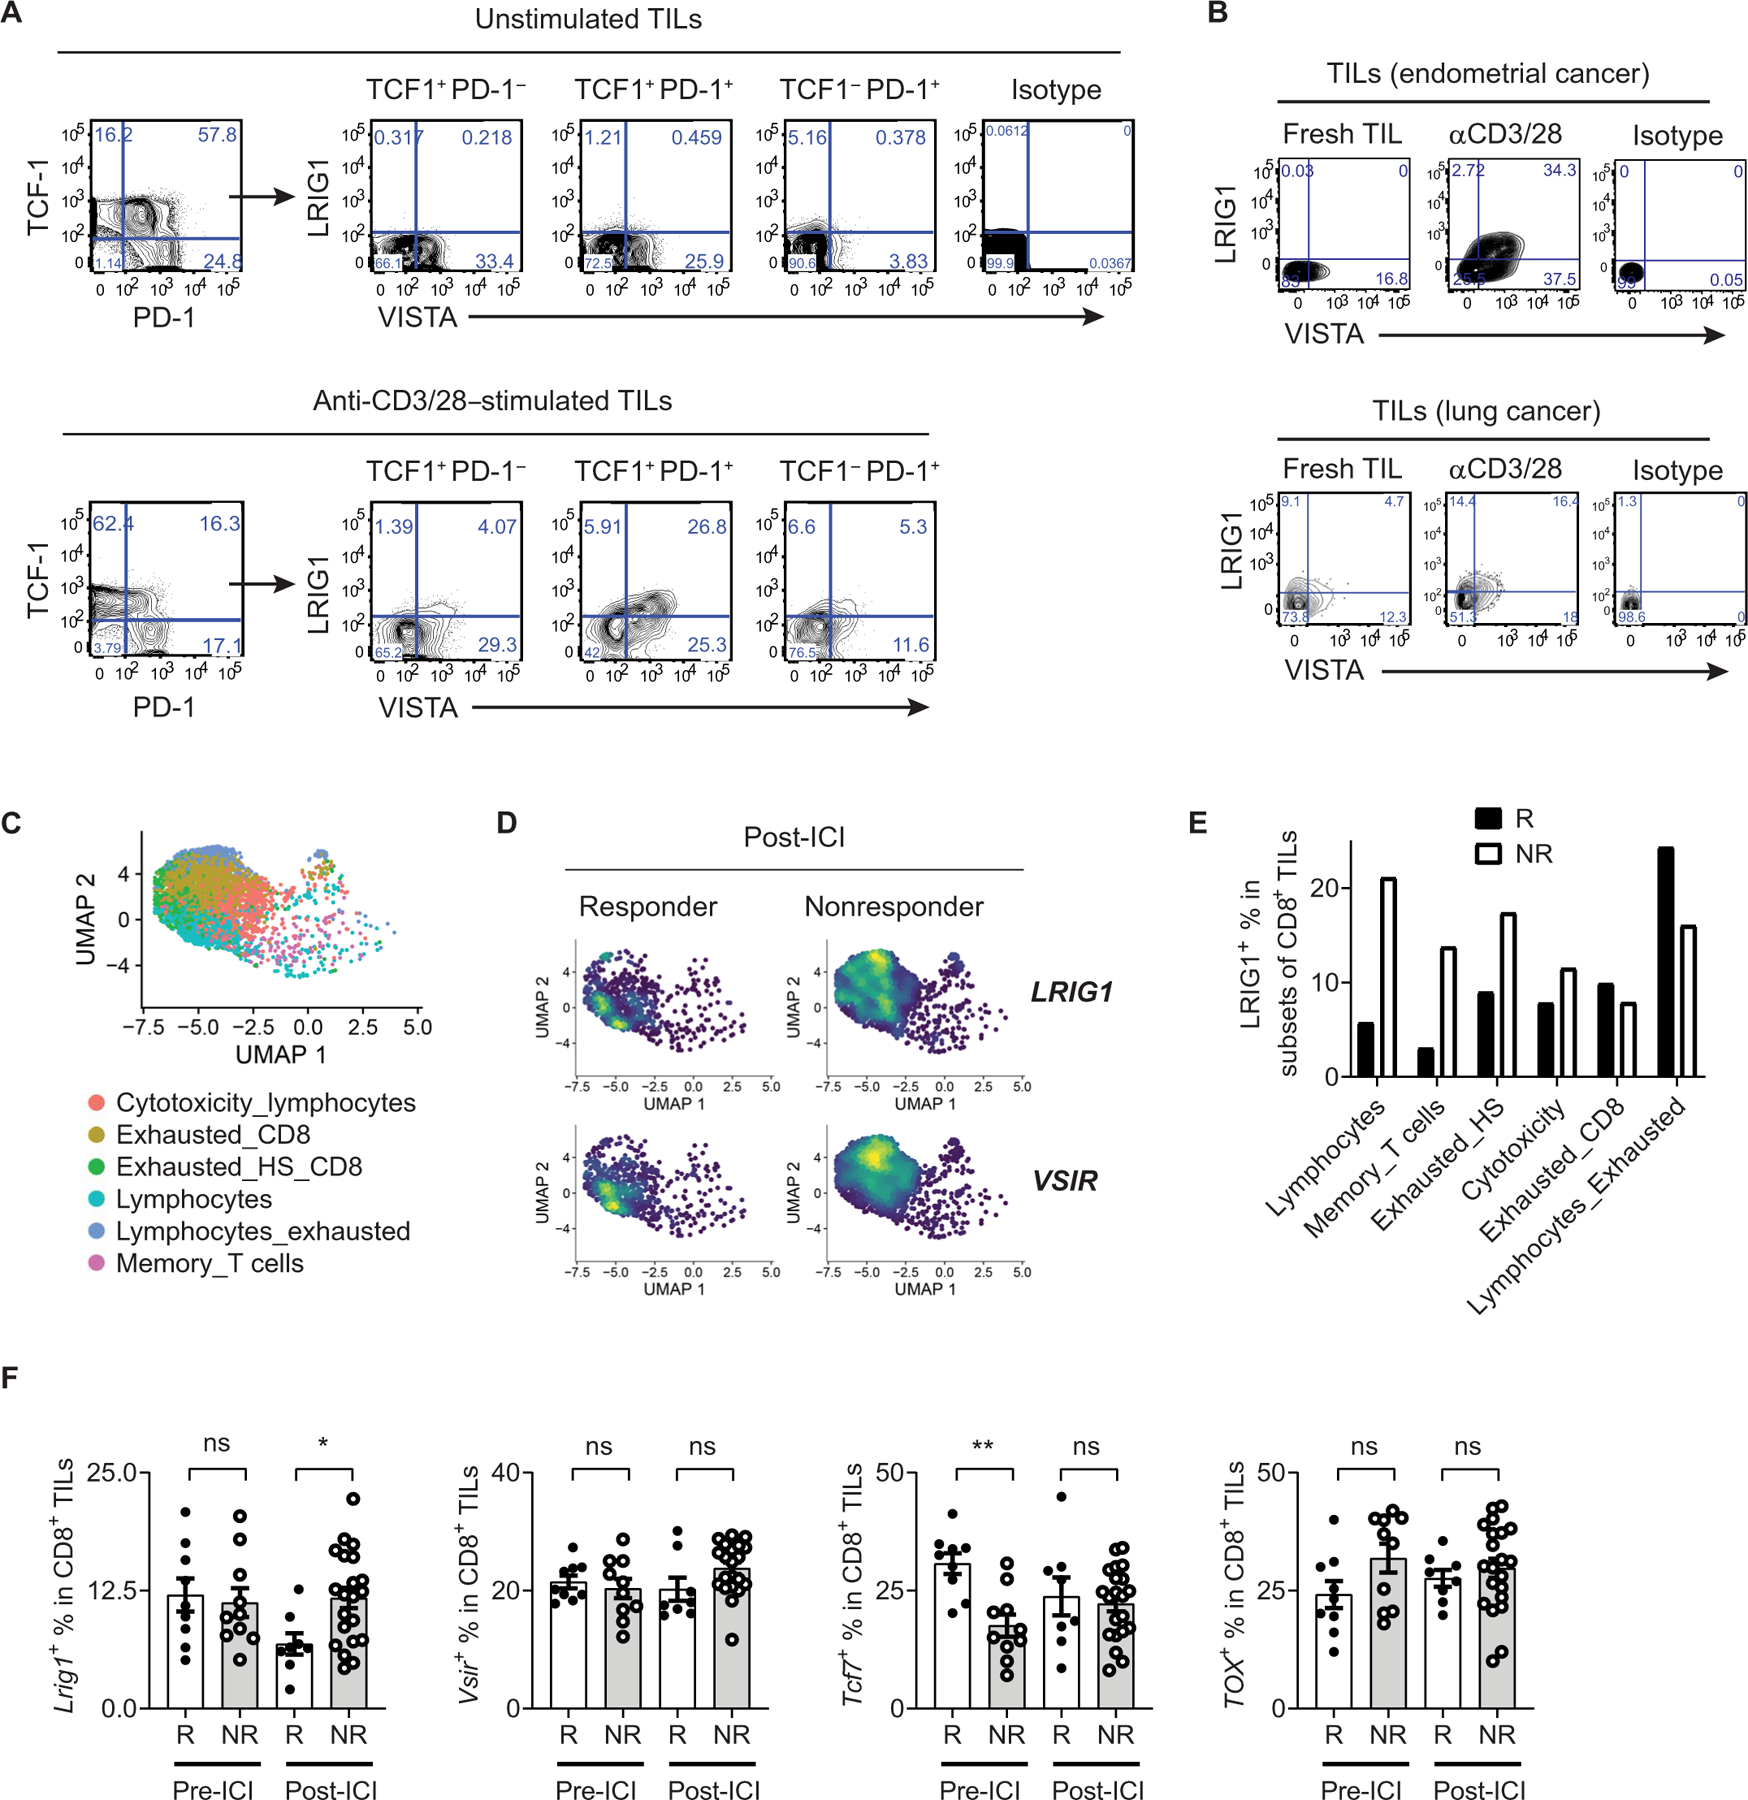
(A) LRIG1 and VISTA expression in human melanoma infiltrating CD8+ TILs. Single-cell suspensions from melanoma tissues were stimulated with anti-CD3 and CD28 antibodies for 24 hours. LRIG1 and VISTA expression on subsets of CD8+ TILs was analyzed by flow cytometry and shown. (B) LRIG1 and VISTA expression on TILs from human endometrial cancer and lung cancer specimens following stimulation with anti-CD3/CD28. (C to F) Analysis of a scRNA-seq dataset from studies by Sade-Feldman et al. (6). CD8+ TILs were clustered, visualized with UMAP, and shown in (C). Clusters were named according to the original author’s definition. Expression of LRIG1 and VSIR genes were visualized and shown in (D). Percentages of LRIG1+ cells in each CTL cluster in post-ICI tissues were shown in (E). Percentages of CD8+ TILs that express LRIG1, TCF1, VSIR (VISTA), and TOX genes were enumerated in pre-ICI and post-ICI biopsies and shown in (F). Games-Howell’s multiple comparison statistical analysis test was used. *P < 0.05 and **P < 0.01. R, responder; NR, nonresponder.
DISCUSSION
Despite a decade of research, how VISTA suppresses T cell activation remains incompletely understood. Several studies using recombinant VISTA protein or VISTA-expressing APCs have suggested that VISTA acts as an inhibitory ligand that engages an inhibitory receptor on T cells at neutral pH (9, 11, 12, 15, 41). Here, we identified and characterized a T cell co-inhibitory receptor LRIG1 that interacts with VISTA, an established immune checkpoint protein. Unlike PSGL-1, which is an acidic pH-specific VISTA binder, LRIG1 binds VISTA at both neutral and acidic pH. The interaction of VISTA and LRIG1 could occur within the same cell (cis interaction) or from different cells (trans interaction). Both forms of interaction are detectable within the TME.
A study by Flies et al. (15) has suggested that VISTA may function as an inhibitory receptor. However, given the lack of signaling adaptors, it remains unclear how VISTA functions. Our current study demonstrates that VISTA exerts both T cell–intrinsic and extrinsic effects by engaging LRIG1, either in cis (in T cells) or in trans (i.e., VISTA-expressing APCs or tumor cells). VISTA-deficient T cells expressed normal levels of LRIG1 and remained sensitive to the suppressive effects of trans-VISTA, whereas LRIG1 KO T cells were largely resistant, thereby supporting the role of VISTA as a “trans” ligand for LRIG1.
LRIG1 belongs to a family of three homologous proteins: LRIG1, LRIG2, and LRIG3. In mice, LRIG1 expression is detected in multipotent epidermal, intestinal, and neural stem cells and is known to play a role in maintaining stem cell quiescence (22, 25–27, 42). In cancer cells, LRIG1 interacts with several receptor tyrosine kinases (i.e., ErbB family and MET) and promotes their lysosomal degradation (43–45). LRIG1 also promotes BMP signaling and adipogenesis in mouse embryonic fibroblasts (46). Global LRIG1 deletion in mice resulted in psoriasiform epidermal hyperplasia (47). Another study has shown that LRIG1 promotes the function of Foxp3+ regulatory T cells in autoimmune colitis and lupus nephritis disease models (40). However, before the present work, the role of LRIG1 in regulating the function of CD8+ T cells and antitumor immunity had not been investigated.
This study reports that LRIG1 exerts a broad impact on TCR signaling and T cell activation: LRIG1 deficiency affected multiple proximal and distal TCR signaling pathways, resulting in augmented CD28-mediated costimulation, hyperproliferative responses, improved survival, reduced exhaustion, and better effector function of CD8+ T cells within the TME. Consequently, mice with T cell– specific LRIG1 deletion developed superior antitumor T cell responses and reached long-term survival after therapeutic vaccine treatment. The phenotypes in LRIG1-deficient tumor-infiltrating T cells mirrored those of VISTA-deficient T cells in VISTA KO mice and after treatment with VISTA-blocking antibodies (10, 16). These results provide a mechanistic underpinning for the T cell–inhibitory function of VISTA and indicate that LRIG1 is an immune checkpoint receptor (ICR) that critically controls antitumor immunity.
Tumor-specific T cells develop exhausted phenotypes, which are associated with therapeutic resistance to cancer immunotherapies (48, 49). Previous studies have identified a subset of progenitor-like Tpex cells that express markers SLAMF6+ TCF1+ PD-1+ and differentiate into exhausted T cells through a multistep process (35). Our single-cell transcriptome analysis identified SLAMF6+ TCF1+ PD-1+ Tpex cells, which consisted of multiple subpopulations such as the CD62Lhi central memory–like cells, CD62Llow progenitor-like cells, and LAG3+ Tpex that exhibited high LRIG1 expression. LRIG1 deletion increased the abundance of the TCF1+ PD-1+ Tpex cells, which may contribute to a superior antitumor T cell response.
In addition to expanding Tpex cells, LRIG1 deficiency reduced the quiescent subset of CTLs with a naïve-like phenotype. By monitoring the trajectory of adoptively transferred PMEL CD8+ T cells, we observed that quiescent CTLs originated from pre-activated tumor-reactive T cells rather than from circulating naïve T cells. In this context, the role of VISTA in regulating T cell quiescence has been implicated. For example, T cell–intrinsic VISTA expression was shown to maintain the quiescence of naïve CD4+ T cells (50). A second study reported that treatment of VISTA-blocking antibodies reduced the expression of several quiescence genes in CD8+ TILs (51). However, how VISTA regulates the quiescence of tumor-specific CD8+ T cells was not elucidated. Because VISTA controls myeloid cell differentiation, global VISTA blockade by antibodies may induce proinflammatory myeloid cell activation and indirectly affect the phenotypes of TILs (13, 52). In light of this study, we propose that VISTA engages its receptor LRIG1, which exerts inhibitory signaling and drives the quiescence of tumor-reactive CTLs, while reciprocally reducing the abundance of Tpex cells. Because quiescent CTLs have a naïve-like phenotype and do not express inhibitory receptors such as PD-1 and CTLA-4, existing ICI therapies could not directly target these cells. They may also be mistakenly considered as nonspecific bystander cells. We have ascertained that the quiescent tumor-specific CTLs originated from activated LRIG1+ precursors. These results warrant future studies to therapeutically target LRIG1, which may reduce T cell quiescence, improve CTL function, and improve antitumor immunity.
This study has some limitations. The molecular mechanisms by which LRIG1 transmits inhibitory signals remain to be determined. Future studies are needed to dissect the roles of intracellular subdomains of LRIG1 and identify signaling intermediates. The mechanisms by which LRIG1 promotes T cell quiescence also warrant further investigation. LRIG1-deficient T cells showed elevated CD28 expression and augmented AKT activation. CD28-dependent activation of the PI3K/AKT/mTOR axis has a well-documented role in driving T cell exit from quiescence and clonal expansion (29, 53–55). Future studies need to elucidate the molecular connections between LRIG1 and CD28-mediated costimulatory signaling.
The identification of LRIG1 as a VISTA-interacting co-inhibitory receptor in T cells may lead to the development of new cancer therapeutics. ICIs have become breakthrough cancer therapies, but the overall response rate remained suboptimal (1). VISTA is considered a nonredundant immune checkpoint protein, and VISTA expression in human cancer tissues is associated with resistance to immunotherapy or poor overall survival (32, 56–61). Our findings demonstrate that LRIG1 is a new ICR that engages ligand VISTA and impairs antitumor T cell responses. LRIG1 expression is detected on TILs from several human cancers and is correlated with resistance to ICI therapies in human melanoma. Therefore, selectively blocking the VISTA/LRIG1 axis may be an effective immunotherapeutic approach for the treatment of cancer.
MATERIALS AND METHODS
Study design
This study aimed to identify binding partners of the immune checkpoint VISTA and describes the identification and characterization of LRIG1, a binding partner and VISTA co-inhibitory receptor in T cells. We demonstrated the binding of VISTA and LRIG1 by using complementary biochemical assays. We interrogated the function of LRIG1 by examining the phenotypes of LRIG1 KO T cells in vitro and in tumor-bearing mice. We characterized the molecular signaling, cellular expansion and survival, effector function, and transcriptomic profiles of LRIG1-deficient tumor-reactive CD8+ T cells. We investigated the prognostic role of LRIG1 in human cancers by mining the public gene expression database. Preclinical experiments used sex- and age-matched mutant mice and WT littermates at 7 to 8 weeks of age and without investigator blinding. Both male and female mice were studied. Five to 10 mice per group were analyzed on the basis of power analysis using previous studies in similar animal models. All data points reflect the biological replicates. All experiments were repeated at least two or three times.
Mice
C57BL/6N (H-2b, CD45.1) and congenic C57BL/6N (H-2b, CD45.2) mice were purchased from Charles River Laboratories. Vsir−/− mice were obtained from Mutant Mouse Regional Resource Centers (www.mmrrc.org; stock no. 031656-UCD) (10, 11). Conditionally targeted Lrig1 mutant mice on a C57BL/6N background (KO-first Tm1a allele) were obtained from European Mouse Mutant Archive (EMID 05375; strain name: B6Brd;B6N-Tyrc-Brd Lrig1tm1a(EUCOMM)Wtsi/WtsiCnbc). Lrig1fl/fl mice were generated by crossing with an FLPe deleter strain (JAX strain 019100). OT-1 (JAX strain 003831) and Cd4-Cre (JAX strain 022071) mice were from the Jackson Laboratory. All experiments were performed using mice aged 6 to 8 weeks. Both female and male mice were examined in independent repeat experiments and showed similar results. When comparing between WT versus Vsir−/− or Lrig1−/− mice, age- and gender-matched littermate controls were used. For adoptive transfer experiments, age- and sex-matched donor and recipient mice were used. Animals were maintained in a specific pathogen–free facility at the Lerner Research Institute (LRI), Cleveland Clinic Foundation, Cleveland, OH. All animal protocols were approved by the Institutional Animal Care and Use Committee of LRI at Cleveland Clinic Foundation.
SPR assay
VISTA.Fc recombinant proteins were purchased from Sino Biological, Wayne, PA. LRIG1.ECD.His recombinant proteins were purchased from R&D Systems (human) and Sino Biological (mouse). Human immunoglobulin G1 (IgG1)–Fc (C103S) recombinant protein was purchased from Sino Biological (catalog no. 10702-HNAH). All SPR measurements were performed using a Biacore S200 instrument (Cytiva) at 25°C. LRIG1.ECD.His protein was covalently immobilized on a Series S sensor chip CM5 (Cytiva) using standard amine-coupling chemistry. The sensor chip surface was activated with 1-ethyl-3-(3-dimethylaminopropyl)carbodiimide and N-hydroxysuccinimide according to the manufacturer’s protocol. LRIG1.ECD.His protein was diluted in 10 mM acetate (pH 4.5) and injected onto the activated surface to create an interaction surface. Any remaining unmodified activated surface was deactivated by injecting 1 M ethanolamine (pH 8.5; Cytiva). The blank control surface was similarly processed but without any protein injection. Both control and active surfaces were primed with running buffer [10 mM Hepes (pH 7.4), 0.15 M NaCl, 0.05% (v/v) P20 (HBS-P +, Cytiva), and 5 μM ZnCl2]. To quantify protein interaction, twofold serial dilutions of VISTA.Fc in running buffer were injected to flow over the chip surfaces for 180 s at a flow rate of 30 μl/min and allowed to dissociate for 600 s. The sensor chip surfaces were regenerated at the end of each interaction cycle by injecting 1 M ethanolamine (pH 8.5) at the same flow rate for 30 s. The kinetic parameters—including on-rate (Kon), off-rate (Koff), and equilibrium dissociation constant (KD)—were determined by global fitting of control-corrected SPR data to the 1:1 binding model using Biacore S200 BIAevaluation software (Cytiva).
Luciferase-based protein binding assay
NanoLuc luciferase-based protein binding assay was performed on the basis of the manufacturer’s protocol (Promega Inc., Madison, WI). Briefly, VISTA and LRIG1 were fused at their N terminus with subunits of luciferase SmBiT and LgBiT, respectively. To measure the cis interactions of transiently coexpressed proteins, HEK293T cells were cotransfected with plasmids expressing SmBiT.VISTA and LgBiT.LRIG1, LgBiT.VSIG3, or LgBiT alone as a negative control. At 24 hours after transfection, the Nano-Glo Live Cell Assay System was used to measure luminescence produced from the functional luciferase following the manufacturer’s instructions.
To measure the cis interaction between VISTA and LRIG1, SmBiT. VISTA and LgBiT.LRIG1 proteins were coexpressed in CD8OVA T cells by retroviral transduction. Cells were plated with a seeding density of 50,000 cells per well in 100 μl of RPMI medium in a black 96-well plate (Greiner-Bio-One, Frickenhausen, Germany). After 24 hours of incubation to allow adherence, cells were washed once with phosphate-buffered saline (PBS). The nano-luciferase substrate hydrofurimazine (HFz) (GlpBio Inc., Montclair, CA) was added at a final concentration of 10 μM in 100 μl of RPMI. After 10 min, bioluminescence was measured in a luminometer (PerkinElmer, Waltham, MA, USA) for 10 s with a 10-s delay. To measure the trans interaction between VISTA and LRIG1, DC2.4 cells or B16OVA tumor cells expressing SmBiT.VISTA (1,000,000) were mixed with CD8OVA T cells expressing LgBiT.LRIG1 (500,000) and incubated at 37°C in a 5% CO2 incubator for 4 hours. Cells were then washed with PBS and incubated with the luciferase substrate HFz for 10 min before being analyzed in the luminometer. To detect the cis protein interaction within tumor tissues, T cells expressing LgBiT.LRIG1 alone or together with smBiT.VISTA (500,000) were resuspended in PBS buffer containing substrate HFz [50 mM in 50 μl of 1x Hanks’ balanced salt solution (HBSS)] and injected into the B16bl6 tumor tissues (8 to 10 mm in diameter). Mice were imaged after 5 min at 37°C using an IVIS Spectrum (PerkinElmer) with open filter binning at medium and a 3-min exposure time. To detect the trans protein interaction within tumor tissues, T cells expressing LgBiT. LRIG1 were resuspended in PBS containing the substrate HFz (50 mM in 50 μl of 1x HBSS) and injected into the B16OVA.smBiT. VISTA tumor tissues (8 to 10 mm in diameter). Mice were imaged by IVIS after 5 min.
Examination of TCR signaling
D10 cell lines stably expressing VISTA, LRIG1, or both receptors, or empty vector control, were rested in RPMI media supplemented with 1% fetal bovine serum (FBS), 2 mM l-glutamine, and 50 μM 2-mercaptoethanol for 16 hours. Cells were then stimulated with biotinylated anti-CD3 antibody (5 μg/ml; clone 2C11) followed by streptavidin (1 μg/ml) cross-linking. At indicated time points, cells were harvested and lysed in radioimmunoprecipitation assay buffer [50 mM tris (pH 7.4), 150 mM NaCl, 1.0% NP-40, 0.5% deoxycholic acid, 0.1% SDS, 1 mM EDTA, 1 mM EGTA, 5 mM sodium pyro-phosphate, 50 mM NaF, and 10 mM β-glycerophosphate] supplemented with protease and phosphatase inhibitors. Phosphorylated and total levels of LAT, PLC-γ, SLP76, AKT, and ERK1/2 were examined by Western blotting. Antibodies used for Western blotting were summarized in table S2. Protein bands were quantified using ImageJ. To examine the TCR signaling in primary T cells, CD8+ splenic T cells were isolated using the CD8a+ Microbeads kit (Miltenyi Biotec, Gaithersburg, MD). Purity was confirmed as >95%. Purified T cells were prestimulated with plate-bound anti-CD3 (1 μg/ml) and anti-CD28 (1 μg/ml) for 16 hours, followed by resting for 5 hours, then restimulated with plate-bound anti-CD3 (0.5 μg/ml) and anti-CD28 (0.25 μg/ml) for the indicated time points. Total cell lysates were generated and examined by Western blotting.
In vitro activation and analyses of murine T cells
Naïve WT (Lrig1fl/fl) and Lrig1−/− OT1 T cells were isolated from splenocytes using a CD8α+ Microbeads kit (Miltenyi Biotec, Gaithersburg, MD) and stimulated with varying concentrations of plate-bound anti-CD3/CD28, at low (0.5/0.25 μg/ml), intermediate (1/0.25 μg/ml), and high (2/0.5 μg/ml) concentrations. Cells were cultured in RPMI-1640 supplemented with 10% FBS, sodium pyruvate, 0.1% b-ME, and antibiotics. Viable cells were counted after 96 hours of culture using flow cytometry. Cell death was quantified using an annexin V apoptosis detection kit with propidium iodide (catalog no. 640932) from BioLegend. For antigen-specific stimulation, WT (Lrig1fl/fl), Lrig1−/−, or Vsir−/− OT T cells were cocultured with either splenic DCs purified using a DC isolation kit from Miltenyi or with DC2.4 cells (parent or cells overexpressing VISTA). Ovalbumin peptides (257 to 264) were added at 200 pg/ml concentration. To measure cytokine production, culture supernatants were harvested at 48 hours and examined by enzyme-linked immunosorbent assay (ELISA). To examine the expression of anti-apoptotic proteins, total cell lysates were prepared after 96 hours of culture and examined by Western blotting.
Murine tumor models, vaccine treatments, and examination of TILs
B16bl6 (30,000) melanoma cells or MC38 colon cancer cells (100,000) were inoculated intradermally in the flanks of mice of 7 to 9 weeks of age. Similar numbers of female and male mice were examined in multiple independent experiments. The peptide vaccine mixture contains CpG (ODN1826, 30 μg), R848 (50 μg), and peptides. For the B16bl6 model, melanocyte antigen peptide TRP1 (106 to 130; 10 μg) and a mutated TRP2 peptide, DeltaV-TRP2 (180 to 188; 50 μg), were used (13). For the MC38 model, neo-epitopes from Rpl18 and Adpgk proteins were used (32). The vaccine mixture was injected subcutaneously on day +3 and day +10 after tumor inoculation. In some experiments, mice were also treated with anti-CTLA4 antibody (clone 9H10, Bio X Cell, Lebanon, NH) at 100 μg per mouse by subcutaneous injection on day 4 and day 8. Tumor size was measured with a caliper every 2 to 3 days. Tumor-free mice that survived for 80 days were rechallenged with the same tumor cells at a dose of 10,000 to 25,000 cells and at a distant site away from the initial tumor site.
For analyzing TILs, tumor tissues were harvested at indicated time points. Single-cell suspensions were obtained after digestion with a cocktail of Liberase TL (150 μg/ml) and deoxyribonuclease I (120 μg/ml) (Sigma-Aldrich, St. Louis, MO) for 20 min at 37°C followed by passing cells through 70-mm strainers. To detect intracellular cytokines, TILs were stimulated in RPMI medium containing TRP1/TRP2 peptides (10 μg/ml) in the presence of monensin or brefeldin A (BioLegend, San Diego, CA) for 6 to 15 hours before antibody staining. LIVE/DEAD staining was done using fixable near-infrared or aqua dead cell staining kits (Thermo Fisher Scientific). Antibodies used for flow cytometry are summarized in table S2. Cells were analyzed on BD LSRFortessa cell analyzer (BD Biosciences, San Jose, CA) or MACSQuant cytometer (Miltenyi Biotec, Gaithersburg, MD). Data were analyzed with FlowJo software (Tree Star, San Carlos, CA).
For studies of OT1 CD8+ T cells in vivo, naïve Thy1.1 WT (Lrig1fl/fl) and Ly5.1 Lrig1−/− OT1 CD8+ T cells were purified from splenocytes using a T cell negative selection kit (MojoSort Mouse CD8 T Cell Isolation Kit, BioLegend, San Diego, CA), mixed at a 1:1 ratio (validated by flow cytometry), and adoptively transferred (500 cells for each genotype) into syngeneic C57BL/6 mice. At 24 hours after transfer, mice were inoculated with B16.OVA tumor cells (4 × 10⁶) split into four injection sites. Tumor tissues and TDLNs were harvested on indicated days and examined by flow cytometry. For PMEL CD8+ T cells, splenocytes from naïve PMEL mice were stimulated with anti-CD3 (1 μg/ml) and anti-CD28 (1 μg/ml) for 48 hours. An aliquot of cells was examined by flow cytometry to confirm activation on the basis of up-regulated CD44 and PD-1 expression. Cells were washed with PBS and adoptively transferred into mice bearing established B16l6 melanoma (~5 mm in diameter). Tumor tissues were harvested on day 7 after transfer and examined by flow cytometry.
Graphs and statistical analysis
All graphs and statistical analysis were generated using Prism 7 (GraphPad Software Inc., San Diego, CA). Statistical significance for comparing two groups was determined by unpaired two-tailed t test or Mann-Whitney U test. One-way analysis of variance (ANOVA) was used for comparing three or more groups. Survival differences of tumor-bearing mice were assessed using Kaplan-Meier curves and analyzed by log-rank testing. A P value less than 0.05 is considered statistically significant. *P < 0.05, **P < 0.025, ***P < 0.005, and ****P < 0.0001.
Supplementary Material
Acknowledgments:
We are grateful to R. Fairchild and A. Valujskikh for comments. We thank S. Stone for the technical and administrative support. This study was supported by the Imaging Core, the Flow Cytometry Core, the Molecular Biotechnology Core, and the Small Animal Imaging Core at the Lerner Research Institute. The timsTof Pro2 mass spectrometer was purchased via an NIH shared instrument grant S10 OD030398. We thank S. Bandyopadhyay for assisting with SPR analyses. We thank the Wellcome Trust Sanger Institute Mouse Genetics Project (Sanger MGP) and its funders for providing the mutant mouse line (Lrig1 tm1a(EUCOMM)Wtsi) (62-65), as well as the European Mouse Mutant Archive (https://infrafrontier.eu/emma/) partner CNB-CSIC, from which the mouse line was received.
Funding:
Research was supported by NIH grants R01CA164225 (to L.L.W.), R01CA223804 (to L.L.W.), R21CA258618 (to L.L.W.), RSG-18-045-01-LIB from the American Cancer Society (to L.L.W.), ME210229 from Department of Defense CDMRP (to L.L.W.), Melanoma Research Alliance pilot award (to L.L.W.), Cancer Research Institute CLIP award (to L.L.W.), F31CA257276 (to C.G.), and a Case Comprehensive Cancer Center Genomics Pilot Grant (to S.A.).
Footnotes
Supplementary Materials
The PDF file includes:
Other Supplementary Material for this manuscript includes the following:
Data files S1 to S4
MDAR Reproducibility Checklist
Competing interests: L.L.W. is an inventor on patent applications (10035857, 9631018, 9217035, 8501915, and 8231872) submitted by Dartmouth College. All other authors declare that they have no competing interests.
Data and materials availability:
scRNA-seq and bulk RNA-seq data have been deposited to the National Center for Biotechnology Information Gene Expression Omnibus (GEO) under the accession numbers GSE245840, GSE245841, and GSE245842. The mass spectrometry data have been deposited to the ProteomeXchange Consortium via the PRIDE partner repository with the dataset identifier PXD050084 and 10.6019/PXD050084 (66). All chemicals, antibodies, and mice strains are listed as either commercially available or available under a material transfer agreement by contacting L.L.W. All analysis of bulk and scRNA-seq data is described in Materials and Methods and is standard to the field. Additional code for data analysis is available upon request to the corresponding author. All other data needed to support the conclusions of the paper are present in the paper or the Supplementary Materials. Underlying tabulated data for all figures can be found in data file S4.
REFERENCES AND NOTES
- 1.Wei SC, Duffy CR, Allison JP, Fundamental mechanisms of immune checkpoint blockade therapy. Cancer Discov. 8, 1069–1086 (2018). [DOI] [PubMed] [Google Scholar]
- 2.Utzschneider DT, Charmoy M, Chennupati V, Pousse L, Ferreira DP, Calderon-Copete S, Danilo M, Alfei F, Hofmann M, Wieland D, Pradervand S, Thimme R, Zehn D, Held W, T cell factor 1-expressing memory-like CD8+ T cells sustain the immune response to chronic viral infections. Immunity 45, 415–427 (2016). [DOI] [PubMed] [Google Scholar]
- 3.Im SJ, Hashimoto M, Gerner MY, Lee J, Kissick HT, Burger MC, Shan Q, Hale JS, Lee J, Nasti TH, Sharpe AH, Freeman GJ, Germain RN, Nakaya HI, Xue HH, Ahmed R, Defining CD8+ T cells that provide the proliferative burst after PD-1 therapy. Nature 537, 417–421 (2016). [DOI] [PMC free article] [PubMed] [Google Scholar]
- 4.Kurtulus S, Madi A, Escobar G, Klapholz M, Nyman J, Christian E, Pawlak M, Dionne D, Xia J, Rozenblatt-Rosen O, Kuchroo VK, Regev A, Anderson AC, Checkpoint blockade immunotherapy induces dynamic changes in PD-1−CD8+ tumor-infiltrating T cells. Immunity 50, 181–194.e6 (2019). [DOI] [PMC free article] [PubMed] [Google Scholar]
- 5.Miller BC, Sen DR, Al Abosy R, Bi K, Virkud YV, LaFleur MW, Yates KB, Lako A, Felt K, Naik GS, Manos M, Gjini E, Kuchroo JR, Ishizuka JJ, Collier JL, Griffin GK, Maleri S, Comstock DE, Weiss SA, Brown FD, Panda A, Zimmer MD, Manguso RT, Hodi FS, Rodig SJ, Sharpe AH, Haining WN, Subsets of exhausted CD8+ T cells differentially mediate tumor control and respond to checkpoint blockade. Nat. Immunol 20, 326–336 (2019). [DOI] [PMC free article] [PubMed] [Google Scholar]
- 6.Sade-Feldman M, Yizhak K, Bjorgaard SL, Ray JP, de Boer CG, Jenkins RW, Lieb DJ, Chen JH, Frederick DT, Barzily-Rokni M, Freeman SS, Reuben A, Hoover PJ, Villani AC, Ivanova E, Portell A, Lizotte PH, Aref AR, Eliane JP, Hammond MR, Vitzthum H, Blackmon SM, Li B, Gopalakrishnan V, Reddy SM, Cooper ZA, Paweletz CP, Barbie DA, Stemmer-Rachamimov A, Flaherty KT, Wargo JA, Boland GM, Sullivan RJ, Getz G, Hacohen N, Defining T cell states associated with response to checkpoint immunotherapy in melanoma. Cell 176, 404 (2019). [DOI] [PMC free article] [PubMed] [Google Scholar]
- 7.Siddiqui I, Schaeuble K, Chennupati V, Fuertes Marraco SA, Calderon-Copete S, Pais Ferreira D, Carmona SJ, Scarpellino L, Gfeller D, Pradervand S, Luther SA, Speiser DE, Held W, Intratumoral Tcf1+PD-1+CD8+ T Cells with stem-like properties promote tumor control in response to vaccination and checkpoint blockade immunotherapy. Immunity 50, 195–211.e10 (2019). [DOI] [PubMed] [Google Scholar]
- 8.Chen Z, Ji Z, Ngiow SF, Manne S, Cai Z, Huang AC, Johnson J, Staupe RP, Bengsch B, Xu C, Yu S, Kurachi M, Herati RS, Vella LA, Baxter AE, Wu JE, Khan O, Beltra JC, Giles JR, Stelekati E, McLane LM, Lau CW, Yang X, Berger SL, Vahedi G, Ji H, Wherry EJ, TCF-1-centered transcriptional network drives an effector versus exhausted CD8 T cell-fate decision. Immunity 51, 840–855.e5 (2019). [DOI] [PMC free article] [PubMed] [Google Scholar]
- 9.Wang L, Rubinstein R, Lines JL, Wasiuk A, Ahonen C, Guo Y, Lu LF, Gondek D, Wang Y, Fava RA, Fiser A, Almo S, Noelle RJ, VISTA, a novel mouse Ig superfamily ligand that negatively regulates T cell responses. J. Exp. Med 208, 577–592 (2011). [DOI] [PMC free article] [PubMed] [Google Scholar]
- 10.Wang L, Le Mercier I, Putra J, Chen W, Liu J, Schenk AD, Nowak EC, Suriawinata AA, Li J, Noelle RJ, Disruption of the immune-checkpoint VISTA gene imparts a proinflammatory phenotype with predisposition to the development of autoimmunity. Proc. Natl. Acad. Sci. U.S.A 111, 14846–14851 (2014). [DOI] [PMC free article] [PubMed] [Google Scholar]
- 11.Liu J, Yuan Y, Chen W, Putra J, Suriawinata AA, Schenk AD, Miller HE, Guleria I, Barth RJ, Huang YH, Wang L, Immune-checkpoint proteins VISTA and PD-1 nonredundantly regulate murine T-cell responses. Proc. Natl. Acad. Sci. U.S.A 112, 6682–6687 (2015). [DOI] [PMC free article] [PubMed] [Google Scholar]
- 12.Xu W, Hieu T, Malarkannan S, Wang L, The structure, expression, and multifaceted role of immune-checkpoint protein VISTA as a critical regulator of anti-tumor immunity, autoimmunity, and inflammation. Cell. Mol. Immunol 15, 438–446 (2018). [DOI] [PMC free article] [PubMed] [Google Scholar]
- 13.Xu W, Dong J, Zheng Y, Zhou J, Yuan Y, Ta HM, Miller HE, Olson M, Rajasekaran K, Ernstoff MS, Wang D, Malarkannan S, Wang L, Immune-checkpoint protein VISTA regulates antitumor immunity by controlling myeloid cell-mediated inflammation and immunosuppression. Cancer Immunol. Res 7, 1497–1510 (2019). [DOI] [PMC free article] [PubMed] [Google Scholar]
- 14.Roy D, Gilmour C, Patnaik S, Wang LL, Combinatorial blockade for cancer immunotherapy: Targeting emerging immune checkpoint receptors. Front. Immunol 14, 1264327 (2023). [DOI] [PMC free article] [PubMed] [Google Scholar]
- 15.Flies DB, Han X, Higuchi T, Zheng L, Sun J, Ye JJ, Chen L, Coinhibitory receptor PD-1H preferentially suppresses CD4+ T cell-mediated immunity. J. Clin. Invest 124, 1966–1975 (2014). [DOI] [PMC free article] [PubMed] [Google Scholar]
- 16.Le Mercier I, Chen W, Lines JL, Day M, Li J, Sergent P, Noelle RJ, Wang L, VISTA regulates the development of protective antitumor immunity. Cancer Res. 74, 1933–1944 (2014). [DOI] [PMC free article] [PubMed] [Google Scholar]
- 17.Johnston RJ, Su LJ, Pinckney J, Critton D, Boyer E, Krishnakumar A, Corbett M, Rankin AL, Dibella R, Campbell L, Martin GH, Lemar H, Cayton T, Huang RY, Deng X, Nayeem A, Chen H, Ergel B, Rizzo JM, Yamniuk AP, Dutta S, Ngo J, Shorts AO, Ramakrishnan R, Kozhich A, Holloway J, Fang H, Wang YK, Yang Z, Thiam K, Rakestraw G, Rajpal A, Sheppard P, Quigley M, Bahjat KS, Korman AJ, VISTA is an acidic pH-selective ligand for PSGL-1. Nature 574, 565–570 (2019). [DOI] [PubMed] [Google Scholar]
- 18.Prodeus A, Abdul-Wahid A, Sparkes A, Fischer NW, Cydzik M, Chiang N, Alwash M, Ferzoco A, Vacaresse N, Julius M, Gorczysnki RM, Gariepy J, VISTA.COMP—An engineered checkpoint receptor agonist that potently suppresses T cell-mediated immune responses. Insight 2, e94308 (2017). [DOI] [PMC free article] [PubMed] [Google Scholar]
- 19.Wang J, Wu G, Manick B, Hernandez V, Renelt M, Erickson C, Guan J, Singh R, Rollins S, Solorz A, Bi M, Li J, Grabowski D, Dirkx J, Tracy C, Stuart T, Ellinghuysen C, Desmond D, Foster C, Kalabokis V, VSIG-3 as a ligand of VISTA inhibits human T-cell function. Immunology 156, 74–85 (2019). [DOI] [PMC free article] [PubMed] [Google Scholar]
- 20.Rees JS, Li XW, Perrett S, Lilley KS, Jackson AP, Selective proteomic proximity labeling assay using tyramide (SPPLAT): A quantitative method for the proteomic analysis of localized membrane-bound protein clusters. Curr. Protoc. Protein Sci 88, 19.2. 1–19.27.18 (2015). [DOI] [PubMed] [Google Scholar]
- 21.Nilsson J, Starefeldt A, Henriksson R, Hedman H, LRIG1 protein in human cells and tissues. Cell Tissue Res. 312, 65–71 (2003). [DOI] [PubMed] [Google Scholar]
- 22.Wang Y, Poulin EJ, Coffey RJ, LRIG1 is a triple threat: ERBB negative regulator, intestinal stem cell marker and tumour suppressor. Br. J. Cancer 108, 1765–1770 (2013). [DOI] [PMC free article] [PubMed] [Google Scholar]
- 23.Potter NS, Harding CV, Neutrophils process exogenous bacteria via an alternate class I MHC processing pathway for presentation of peptides to T lymphocytes. J. Immunol 167, 2538–2546 (2001). [DOI] [PubMed] [Google Scholar]
- 24.Shen Z, Reznikoff G, Dranoff G, Rock KL, Cloned dendritic cells can present exogenous antigens on both MHC class I and class II molecules. J. Immunol 158, 2723–2730 (1997). [PubMed] [Google Scholar]
- 25.Jensen KB, Watt FM, Single-cell expression profiling of human epidermal stem and transit-amplifying cells: Lrig1 is a regulator of stem cell quiescence. Proc. Natl. Acad. Sci. U.S.A 103, 11958–11963 (2006). [DOI] [PMC free article] [PubMed] [Google Scholar]
- 26.Wong VW, Stange DE, Page ME, Buczacki S, Wabik A, Itami S, van de Wetering M, Poulsom R, Wright NA, Trotter MW, Watt FM, Winton DJ, Clevers H, Jensen KB, Lrig1 controls intestinal stem-cell homeostasis by negative regulation of ErbB signalling. Nat. Cell Biol 14, 401–408 (2012). [DOI] [PMC free article] [PubMed] [Google Scholar]
- 27.Marques-Torrejon MA, Williams CAC, Southgate B, Alfazema N, Clements MP, Garcia-Diaz C, Blin C, Arranz-Emparan N, Fraser J, Gammoh N, Parrinello S, Pollard SM, LRIG1 is a gatekeeper to exit from quiescence in adult neural stem cells. Nat. Commun 12, 2594 (2021). [DOI] [PMC free article] [PubMed] [Google Scholar]
- 28.Faraz M, Herdenberg C, Holmlund C, Henriksson R, Hedman H, A protein interaction network centered on leucine-rich repeats and immunoglobulin-like domains 1 (LRIG1) regulates growth factor receptors. J. Biol. Chem 293, 3421–3435 (2018). [DOI] [PMC free article] [PubMed] [Google Scholar]
- 29.Esensten JH, Helou YA, Chopra G, Weiss A, Bluestone JA, CD28 costimulation: From mechanism to therapy. Immunity 44, 973–988 (2016). [DOI] [PMC free article] [PubMed] [Google Scholar]
- 30.Boger C, Behrens HM, Kruger S, Rocken C, The novel negative checkpoint regulator VISTA is expressed in gastric carcinoma and associated with PD-L1/PD-1: A future perspective for a combined gastric cancer therapy? Onco Targets Ther 6, e1293215 (2017). [DOI] [PMC free article] [PubMed] [Google Scholar]
- 31.Muller S, Victoria Lai W, Adusumilli PS, Desmeules P, Frosina D, Jungbluth A, Ni A, Eguchi T, Travis WD, Ladanyi M, Zauderer MG, Sauter JL, V-domain Ig-containing suppressor of T-cell activation (VISTA), a potentially targetable immune checkpoint molecule, is highly expressed in epithelioid malignant pleural mesothelioma. Mod. Pathol 33, 303–311 (2020). [DOI] [PMC free article] [PubMed] [Google Scholar]
- 32.Dufva O, Polonen P, Bruck O, Keranen MAI, Klievink J, Mehtonen J, Huuhtanen J, Kumar A, Malani D, Siitonen S, Kankainen M, Ghimire B, Lahtela J, Mattila P, Vaha-Koskela M, Wennerberg K, Granberg K, Leivonen SK, Meriranta L, Heckman C, Leppa S, Nykter M, Lohi O, Heinaniemi M, Mustjoki S, Immunogenomic landscape of hematological malignancies. Cancer Cell 38, 424–428 (2020). [DOI] [PubMed] [Google Scholar]
- 33.Gebhardt T, Park SL, Parish IA, Stem-like exhausted and memory CD8+ T cells in cancer. Nat. Rev. Cancer 23, 780–798 (2023). [DOI] [PubMed] [Google Scholar]
- 34.Wu T, Ji Y, Moseman EA, Xu HC, Manglani M, Kirby M, Anderson SM, Handon R, Kenyon E, Elkahloun A, Wu W, Lang PA, Gattinoni L, McGavern DB, Schwartzberg PL, The TCF1-Bcl6 axis counteracts type I interferon to repress exhaustion and maintain T cell stemness. Sci. Immunol 1, eaai8593 (2016). [DOI] [PMC free article] [PubMed] [Google Scholar]
- 35.Beltra JC, Manne S, Abdel-Hakeem MS, Kurachi M, Giles JR, Chen Z, Casella V, Ngiow SF, Khan O, Huang YJ, Yan P, Nzingha K, Xu W, Amaravadi RK, Xu X, Karakousis GC, Mitchell TC, Schuchter LM, Huang AC, Wherry EJ, Developmental relationships of four exhausted CD8+ T cell subsets reveals underlying transcriptional and epigenetic landscape control mechanisms. Immunity 52, 825–841.e8 (2020). [DOI] [PMC free article] [PubMed] [Google Scholar]
- 36.Masopust D, Soerens AG, Tissue-resident t cells and other resident leukocytes. Annu. Rev. Immunol 37, 521–546 (2019). [DOI] [PMC free article] [PubMed] [Google Scholar]
- 37.McLane LM, Abdel-Hakeem MS, Wherry EJ, CD8 resident T cells and other resident leukocytes. Annu. Rev. Immunol 37, 457–495 (2019). [DOI] [PubMed] [Google Scholar]
- 38.Hudson WH, Gensheimer J, Hashimoto M, Wieland A, Valanparambil RM, Li P, Lin JX, Konieczny BT, Im SJ, Freeman GJ, Leonard WJ, Kissick HT, Ahmed R, Proliferating transitory t cells with an effector-like transcriptional signature emerge from PD-1+ stem-like CD8+ T cells during chronic infection. Immunity 51, 1043–1058.e4 (2019). [DOI] [PMC free article] [PubMed] [Google Scholar]
- 39.Overwijk WW, Tsung A, Irvine KR, Parkhurst MR, Goletz TJ, Tsung K, Carroll MW, Liu C, Moss B, Rosenberg SA, Restifo NP, gp100/pmel 17 is a murine tumor rejection antigen: Induction of “self”-reactive, tumoricidal T cells using high-affinity, altered peptide ligand. J. Exp. Med 188, 277–286 (1998). [DOI] [PMC free article] [PubMed] [Google Scholar]
- 40.Moon JS, Ho CC, Park JH, Park K, Shin BY, Lee SH, Sequeira I, Mun CH, Shin JS, Kim JH, Kim BS, Noh JW, Lee ES, Son JY, Kim Y, Lee Y, Cho H, So S, Park J, Choi E, Oh JW, Lee SW, Morio T, Watt FM, Seong RH, Lee SK, Lrig1-expression confers suppressive function to CD4+ cells and is essential for averting autoimmunity via the Smad2/3/Foxp3 axis. Nat. Commun 14, 5382 (2023). [DOI] [PMC free article] [PubMed] [Google Scholar]
- 41.Slater BT, Han X, Chen L, Xiong Y, Structural insight into T cell coinhibition by PD-1H (VISTA). Proc. Natl. Acad. Sci. U.S.A 117, 1648–1657 (2020). [DOI] [PMC free article] [PubMed] [Google Scholar]
- 42.Jensen KB, Collins CA, Nascimento E, Tan DW, Frye M, Itami S, Watt FM, Lrig1 expression defines a distinct multipotent stem cell population in mammalian epidermis. Cell Stem Cell 4, 427–439 (2009). [DOI] [PMC free article] [PubMed] [Google Scholar]
- 43.Gur G, Rubin C, Katz M, Amit I, Citri A, Nilsson J, Amariglio N, Henriksson R, Rechavi G, Hedman H, Wides R, Yarden Y, LRIG1 restricts growth factor signaling by enhancing receptor ubiquitylation and degradation. EMBO J. 23, 3270–3281 (2004). [DOI] [PMC free article] [PubMed] [Google Scholar]
- 44.Shattuck DL, Miller JK, Laederich M, Funes M, Petersen H, Carraway KL III, Sweeney C, LRIG1 is a novel negative regulator of the Met receptor and opposes Met and Her2 synergy. Mol. Cell. Biol 27, 1934–1946 (2007). [DOI] [PMC free article] [PubMed] [Google Scholar]
- 45.Simion C, Cedano-Prieto ME, Sweeney C, The LRIG family: Enigmatic regulators of growth factor receptor signaling. Endocr. Relat. Cancer 21, R431–R443 (2014). [DOI] [PMC free article] [PubMed] [Google Scholar]
- 46.Herdenberg C, Mutie PM, Billing O, Abdullah A, Strawbridge RJ, Dahlman I, Tuck S, Holmlund C, Arner P, Henriksson R, Franks PW, Hedman H, LRIG proteins regulate lipid metabolism via BMP signaling and affect the risk of type 2 diabetes. Commun. Biol 4, 90 (2021). [DOI] [PMC free article] [PubMed] [Google Scholar]
- 47.Suzuki Y, Miura H, Tanemura A, Kobayashi K, Kondoh G, Sano S, Ozawa K, Inui S, Nakata A, Takagi T, Tohyama M, Yoshikawa K, Itami S, Targeted disruption of LIG-1 gene results in psoriasiform epidermal hyperplasia1. FEBS Lett. 521, 67–71 (2002). [DOI] [PubMed] [Google Scholar]
- 48.van der Leun AM, Thommen DS, Schumacher TN, CD8+ T cell states in human cancer: Insights from single-cell analysis. Nat. Rev. Cancer 20, 218–232 (2020). [DOI] [PMC free article] [PubMed] [Google Scholar]
- 49.Chow A, Perica K, Klebanoff CA, Wolchok JD, Clinical implications of T cell exhaustion for cancer immunotherapy. Nat. Rev. Clin. Oncol 19, 775–790 (2022). [DOI] [PMC free article] [PubMed] [Google Scholar]
- 50.ElTanbouly MA, Zhao Y, Nowak E, Li J, Schaafsma E, Le Mercier I, Ceeraz S, Lines JL, Peng C, Carriere C, Huang X, Day M, Koehn B, Lee SW, Silva Morales M, Hogquist KA, Jameson SC, Mueller D, Rothstein J, Blazar BR, Cheng C, Noelle RJ, VISTA is a checkpoint regulator for naïve T cell quiescence and peripheral tolerance. Science 367, eaay0524 (2020). [DOI] [PMC free article] [PubMed] [Google Scholar]
- 51.Schaafsma E, Croteau W, ElTanbouly M, Nowak EC, Smits NC, Deng J, Sarde A, Webber CA, Rabadi D, Cheng C, Noelle R, Lines JL, VISTA targeting of T-cell quiescence and myeloid suppression overcomes adaptive resistance. Cancer Immunol. Res 11, 38–55 (2023). [DOI] [PMC free article] [PubMed] [Google Scholar]
- 52.Zhang K, Zakeri A, Alban T, Dong J, Ta HM, Zalavadia AH, Branicky A, Zhao H, Juric I, Husich H, Parthasarathy PB, Rupani A, Drazba JA, Chakraborty AA, Ching-Cheng Huang S, Chan T, Avril S, Wang LL, VISTA promotes the metabolism and differentiation of myeloid-derived suppressor cells by STAT3 and polyamine-dependent mechanisms. Cell Rep. 43, 113661 (2024). [DOI] [PMC free article] [PubMed] [Google Scholar]
- 53.Tzachanis D, Lafuente EM, Li L, Boussiotis VA, Intrinsic and extrinsic regulation of T lymphocyte quiescence. Leuk. Lymphoma 45, 1959–1967 (2004). [DOI] [PubMed] [Google Scholar]
- 54.Chapman NM, Chi H, Hallmarks of T-cell exit from quiescence. Cancer Immunol. Res 6, 502–508 (2018). [DOI] [PubMed] [Google Scholar]
- 55.Kalia V, Penny LA, Yuzefpolskiy Y, Baumann FM, Sarkar S, Quiescence of memory CD8+ T cells is mediated by regulatory t cells through inhibitory receptor CTLA-4. Immunity 42, 1116–1129 (2015). [DOI] [PubMed] [Google Scholar]
- 56.Gao J, Ward JF, Pettaway CA, Shi LZ, Subudhi SK, Vence LM, Zhao H, Chen J, Chen H, Efstathiou E, Troncoso P, Allison JP, Logothetis CJ, Wistuba II, Sepulveda MA, Sun J, Wargo J, Blando J, Sharma P, VISTA is an inhibitory immune checkpoint that is increased after ipilimumab therapy in patients with prostate cancer. Nat. Med 23, 551–555 (2017). [DOI] [PMC free article] [PubMed] [Google Scholar]
- 57.He HX, Gao Y, Fu JC, Zhou QH, Wang XX, Bai B, Li PF, Huang C, Rong QX, Ping LQ, He YX, Mao JY, Chen X, Huang HQ, VISTA and PD-L1 synergistically predict poor prognosis in patients with extranodal natural killer/T-cell lymphoma. Onco. Targets Ther 10, 1907059 (2021). [DOI] [PMC free article] [PubMed] [Google Scholar]
- 58.Seo WI, Lee CH, Jung SJ, Lee DS, Park HY, Jeong DH, Kim W, Chung JI, Choi I, Expression of VISTA on tumor-infiltrating immune cells correlated with short intravesical recurrence in non-muscle-invasive bladder cancer. Cancer Immunol. Immunother 70, 3113–3122 (2021). [DOI] [PMC free article] [PubMed] [Google Scholar]
- 59.Kuklinski LF, Yan S, Li Z, Fisher JL, Cheng C, Noelle RJ, Angeles CV, Turk MJ, Ernstoff MS, VISTA expression on tumor-infiltrating inflammatory cells in primary cutaneous melanoma correlates with poor disease-specific survival. Cancer Immunol. Immunother 67, 1113–1121 (2018). [DOI] [PMC free article] [PubMed] [Google Scholar]
- 60.Xie X, Zhang J, Shi Z, Liu W, Hu X, Qie C, Chen W, Wang Y, Wang L, Jiang J, Liu J, The expression pattern and clinical significance of the immune checkpoint regulator VISTA in human breast cancer. Front. Immunol 11, 563044 (2020). [DOI] [PMC free article] [PubMed] [Google Scholar]
- 61.Choi JW, Kim YJ, Yun KA, Won CH, Lee MW, Choi JH, Chang SE, Lee WJ, The prognostic significance of VISTA and CD33-positive myeloid cells in cutaneous melanoma and their relationship with PD-1 expression. Sci. Rep 10, 14372 (2020). [DOI] [PMC free article] [PubMed] [Google Scholar]
- 62.Pettitt SJ, Liang Q, Rairdan XY, Moran JL, Prosser HM, Beier DR, Lloyd KC, Bradley A, Skarnes WC, Agouti C57BL/6N embryonic stem cells for mouse genetic resources. Nat. Methods 6, 493–495 (2009). [DOI] [PMC free article] [PubMed] [Google Scholar]
- 63.Bradley A, Anastassiadis K, Ayadi A, Battey JF, Bell C, Birling MC, Bottomley J, Brown SD, Burger A, Bult CJ, Bushell W, Collins FS, Desaintes C, Doe B, Economides A, Eppig JT, Finnell RH, Fletcher C, Fray M, Frendewey D, Friedel RH, Grosveld FG, Hansen J, Herault Y, Hicks G, Horlein A, Houghton R, de Angelis MH, Huylebroeck D, Iyer V, de Jong PJ, Kadin JA, Kaloff C, Kennedy K, Koutsourakis M, Lloyd KC, Marschall S, Mason J, McKerlie C, McLeod MP, von Melchner H, Moore M, Mujica AO, Nagy A, Nefedov M, Nutter LM, Pavlovic G, Peterson JL, Pollock J, Ramirez-Solis R, Rancourt DE, Raspa M, Remacle JE, Ringwald M, Rosen B, Rosenthal N, Rossant J, Noppinger PR, Ryder E, Schick JZ, Schnutgen F, Schofield P, Seisenberger C, Selloum M, Simpson EM, Skarnes WC, Smedley D, Stanford WL, Stewart AF, Stone K, Swan K, Tadepally H, Teboul L, Tocchini-Valentini GP, Valenzuela D, West AP, Yamamura K, Yoshinaga Y, Wurst W, The mammalian gene function resource: The International Knockout Mouse Consortium. Mamm. Genome 23, 580–586 (2012). [DOI] [PMC free article] [PubMed] [Google Scholar]
- 64.White JK, Gerdin AK, Karp NA, Ryder E, Buljan M, Bussell JN, Salisbury J, Clare S, Ingham NJ, Podrini C, Houghton R, Estabel J, Bottomley JR, Melvin DG, Sunter D, Adams NC; Sanger Institute Mouse Genetics Project, Tannahill D, Logan DW, Macarthur DG, Flint J, Mahajan VB, Tsang SH, Smyth I, Watt FM, Skarnes WC, Dougan G, Adams DJ, Ramirez-Solis R, Bradley A, Steel KP, Genome-wide generation and systematic phenotyping of knockout mice reveals new roles for many genes. Cell 154, 452–464 (2013). [DOI] [PMC free article] [PubMed] [Google Scholar]
- 65.Skarnes WC, Rosen B, West AP, Koutsourakis M, Bushell W, Iyer V, Mujica AO, Thomas M, Harrow J, Cox T, Jackson D, Severin J, Biggs P, Fu J, Nefedov M, de Jong PJ, Stewart AF, Bradley A, A conditional knockout resource for the genome-wide study of mouse gene function. Nature 474, 337–342 (2011). [DOI] [PMC free article] [PubMed] [Google Scholar]
- 66.Deutsch EW, Bandeira N, Perez-Riverol Y, Sharma V, Carver JJ, Mendoza L, Kundu DJ, Wang S, Bandla C, Kamatchinathan S, Hewapathirana S, Pullman BS, Wertz J, Sun Z, Kawano S, Okuda S, Watanabe Y, MacLean B, MacCoss MJ, Zhu Y, Ishihama Y, Vizcaino JA, The ProteomeXchange consortium at 10 years: 2023 update. Nucleic Acids Res. 51, D1539–D1548 (2023). [DOI] [PMC free article] [PubMed] [Google Scholar]
Associated Data
This section collects any data citations, data availability statements, or supplementary materials included in this article.
Supplementary Materials
Data Availability Statement
scRNA-seq and bulk RNA-seq data have been deposited to the National Center for Biotechnology Information Gene Expression Omnibus (GEO) under the accession numbers GSE245840, GSE245841, and GSE245842. The mass spectrometry data have been deposited to the ProteomeXchange Consortium via the PRIDE partner repository with the dataset identifier PXD050084 and 10.6019/PXD050084 (66). All chemicals, antibodies, and mice strains are listed as either commercially available or available under a material transfer agreement by contacting L.L.W. All analysis of bulk and scRNA-seq data is described in Materials and Methods and is standard to the field. Additional code for data analysis is available upon request to the corresponding author. All other data needed to support the conclusions of the paper are present in the paper or the Supplementary Materials. Underlying tabulated data for all figures can be found in data file S4.