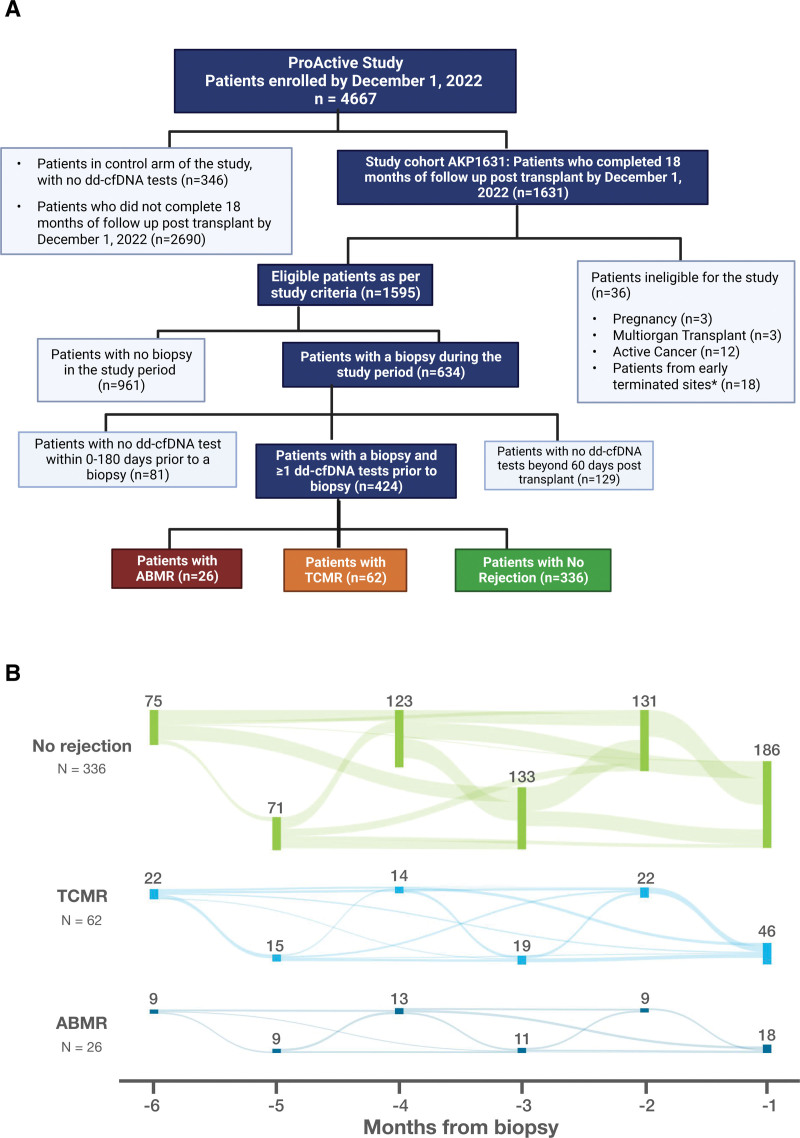
FIGURE 1.
Analysis cohort patient flow diagrams. A, Overview and patient flow of the ProActive study and analysis cohorts (n = 424). B, Visit months are annotated on the x-axis, and each node, corresponding to the month, represents the number of patients in each category with a visit in that stipulated period. The weighted networks connecting different nodes represent the flow of patients visits from 6 to 1 mo before the index biopsy. ABMR, antibody-mediated rejection; dd-cfDNA, donor-derived cell-free DNA; TCMR, T cell–mediated rejection.

