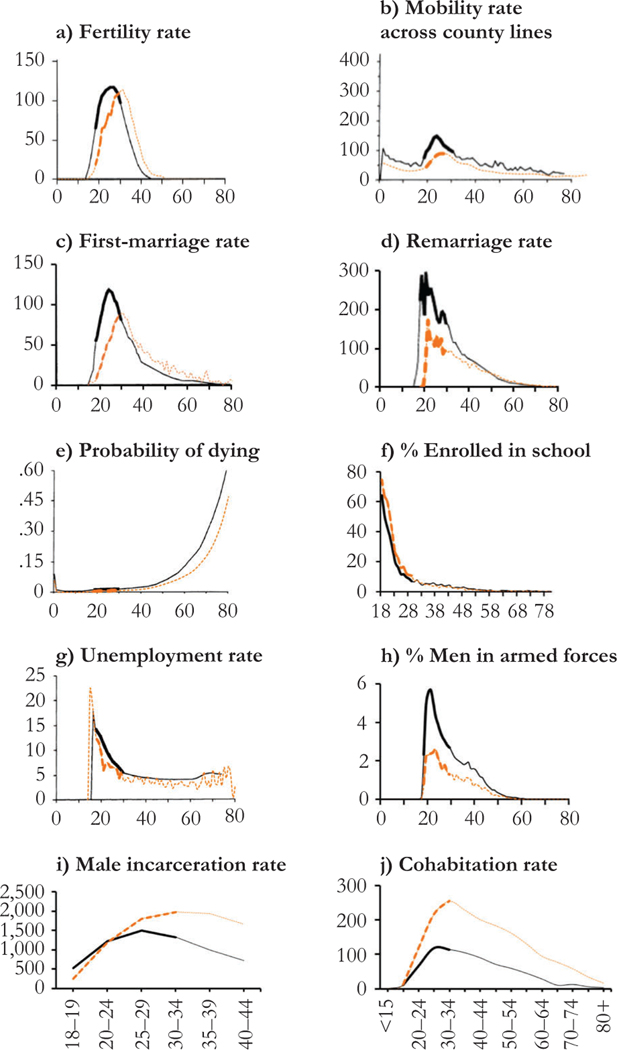
Fig. 1.
Age-specific rates and percentages for Baby Boomers and Millennials in young adulthood. The solid line represents the Baby Boomer cohort in young adulthood, and the dashed line represents the Millennial cohort in young adulthood. Sources: Panel a: 1989, National Center for Health Statistics (NCHS); 2016, ACS one-year estimates fertility rates per 1,000 women. Panel b: 1989, U.S. Census Bureau; 2013, U.S. Census Bureau, CPS. Panel c: 1990, NCHS; 2016, ACS one-year estimate first marriage rates per 1,000 never-married women. Panel d: 1990, NCHS; 2016, ACS one-year estimate remarriage rates per 1,000 previously married women. Panel e: 1990, NCHS; 2011, Centers for Disease Control/NCHS National Vital Statistics System. Panel f: IPUMS-CPS, University of Minnesota. Panel g: 1989, March CPS; 2017, IPUMS-CPS, University of Minnesota. Panel h: 1990 Decennial Census 1990; 2016 ACS one-year estimates. Panel i: 1997 Bureau of Justice Statistics (BJS); 2016 BJS national prison statistics rates per 100,000 U.S. residents. Panel j: 1995 and 2017, IPUMS-CPS, University of Minnesota currently cohabiting rates per 1,000 not currently living with a spouse.

