

Abstract
As a first step in preparing for the return of samples from the Moon by the Artemis Program, NASA initiated the Apollo Next Generation Sample Analysis Program (ANGSA). ANGSA was designed to function as a low-cost sample return mission and involved the curation and analysis of samples previously returned by the Apollo 17 mission that remained unopened or stored under unique conditions for 50 years. These samples include the lower portion of a double drive tube previously sealed on the lunar surface, the upper portion of that drive tube that had remained unopened, and a variety of Apollo 17 samples that had remained stored at −27 °C for approximately 50 years. ANGSA constitutes the first preliminary examination phase of a lunar “sample return mission” in over 50 years. It also mimics that same phase of an Artemis surface exploration mission, its design included placing samples within the context of local and regional geology through new orbital observations collected since Apollo and additional new “boots-on-the-ground” observations, data synthesis, and interpretations provided by Apollo 17 astronaut Harrison Schmitt. ANGSA used new curation techniques to prepare, document, and allocate these new lunar samples, developed new tools to open and extract gases from their containers, and applied new analytical instrumentation previously unavailable during the Apollo Program to reveal new information about these samples. Most of the 90 scientists, engineers, and curators involved in this mission were not alive during the Apollo Program, and it had been 30 years since the last Apollo core sample was processed in the Apollo curation facility at NASA JSC. There are many firsts associated with ANGSA that have direct relevance to Artemis. ANGSA is the first to open a core sample previously sealed on the surface of the Moon, the first to extract and analyze lunar gases collected in situ, the first to examine a core that penetrated a lunar landslide deposit, and the first to process pristine Apollo samples in a glovebox at −20 °C. All the ANGSA activities have helped to prepare the Artemis generation for what is to come. The timing of this program, the composition of the team, and the preservation of unopened Apollo samples facilitated this generational handoff from Apollo to Artemis that sets up Artemis and the lunar sample science community for additional successes.
Keywords: Moon, Artemis program, Apollo program, Apollo 17, New lunar samples, Volatiles, Regolith, Landslide
Introduction
The six Apollo missions to the surface of the Moon between 1969 and 1972 returned 376 kg of lunar rocks and regolith (lunar soil). Analysis of these samples and the numerous experiments, observations, and sample documentation procedures carried out during Apollo missions provided fundamental insights into the origin and history of the Moon, Earth, and Sun, the formation and evolution of the Earth-Moon system, and how planets and solar systems evolve and stabilize. This knowledge is relevant not only to understanding our Solar System but also to exoplanets in other solar systems. Numerous subsequent robotic orbital, flyby, and landed observations of the Moon that started in the 1990s and continue to the present day (e.g., Clementine, Lunar Prospector, Kaguya, Chandrayaan missions, Lunar Reconnaissance Orbiter, LCROSS, Grail, LADEE, Chang’e program) have provided new geologic context for these samples and opened the door to a new understanding of the Moon (e.g., polar volatiles, lunar volatile cycle, tectonics and surface evolution, resource distribution and concentrations, crustal thickness, duration of volcanism, silicic volcanism, potential lunar cataclysm, orbital dynamics of the outer Solar System) and solar evolution. Future robotic and human sample return missions to the Moon will test new post-Apollo concepts developed for the Moon and will target sites that are most suitable for the investigation of these ideas. Acronyms used in text and figures are listed in Table 1.
Table 1.
Acronyms used in the text, in approximate order of appearance. These mostly comprise institutions, analytical methods, sample containers, and missions
| ANGSA | Apollo Next Generation Sample Analysis |
| LCROSS | Lunar Crater Observation and Sensing Satellite |
| GRAIL | Gravity Recovery and Interior Laboratory |
| LADEE | Lunar Atmosphere and Dust Environment Explorer |
| CSVC | Core Sample Vacuum Container |
| SESC | Special Environmental Sample Container |
| CSSD | Contact Soil Sampling Device |
| ESA | European Space Agency |
| NASA | National Aeronautics and Space Administration |
| JSC | Johnson Space Center |
| SSERVI | Solar System Exploration Virtual Institute |
| LM | Lunar Module |
| XCT | X-ray Computed Tomography |
| GASC | Gas Analysis Sampling Container |
| LESC | Lunar Environment Sample Container |
| MSSC | Magnetic Shield Sample Container |
| LRO | Lunar Reconnaissance Orbiter |
| SMART-1 | Small Missions for Advanced Research in Technology |
| LROC | Lunar Reconnaissance Orbiter Camera |
| NAC | Narrow Angle Camera |
| LRV | Lunar Roving Vehicle |
| Mini-RF | Miniature Radio Frequency |
| M3 | Moon Mineralogy Mapper |
| AO | Announcement of Opportunity |
| CAAAS | Consortium for the Advanced Analysis of Apollo Samples |
| MVE | Moderately Volatile Elements |
| PI | Principal Investigator |
| GCR | Galactic Cosmic Rays |
| SCR | Solar Cosmic Rays |
| UV | Ultraviolet (radiation) |
| SCARAB | Spectroscopy Consortium Addressing Redox Acquired by Beads |
| XAS | X-ray Absorption Spectroscopy |
| ATR | Attenuated Total Reflection |
| STEM | Scanning Transmission Electron Microscopy |
| EELS | Electron Energy Loss Spectroscopy |
| EDS | Energy-Dispersive Spectroscopy |
| TL | Thermoluminescence |
| XES | X-ray Emission Spectroscopy |
| TEM | Transmission Electron Microscope or Microscopy |
| PSG | Project Science Group |
| PE | Preliminary Examination |
| UTCT | University of Texas High-Resolution X-ray Computed Tomography facility |
| UVVIS | Ultraviolet and Visible light |
| FTIR | Fourier Transform Infrared |
| ALSRC | Apollo Lunar Sample Return Container |
| UHV | Ultra-High Vacuum |
| PTFE | Polytetrafluoroethylene |
| OVC | Outer Vacuum Container |
| ESTEC | European Space Research and Technology Centre |
| COTS | Commercial-Off-The-Shelf |
| XPS | X-ray Photon Spectrometer or Photoelectron Spectroscopy |
| RGA | Residual Gas Analysis or Analyzer |
| GEM | Gas Extraction Manifold |
| GAEA | Gas Extraction and Analysis system |
| SEM | Secondary Electron Microscope or Scanning Electron Microscope |
| MOC | Molecular Organic Contamination |
| IPA | Isopropyl Alcohol |
| ISO | International Organization for Standardization |
| EIL | Experimental Impact Laboratory |
| HEPA | High Efficiency Particulate Air filter |
| SIMS | Secondary Ion Mass Spectrometry |
| NEXAFS | Near Edge X-ray Absorption Fine Structure |
| PEEM | Photoemission electron microscopy |
| AES | Auger Electron Spectroscopy |
| VTV | Vacuum Transfer Vessel |
| TOF-SIMS | Time of Flight Secondary Ion Mass Spectrometry |
| OSIRIS-REx | Origins, Spectral Interpretation, Resource Identification, and Security – Regolith Explorer |
| NEG | Non-Evaporable Getter |
| CF | ConFlat |
| EBSD | Electron Backscatter Diffraction |
| EPMA | Electron Probe Microanalysis |
| BSE | Backscattered electron |
| WUSTL | Washington University in St. Louis |
| WDS | Wavelength Dispersive Spectroscopy |
| CL | Cathodoluminescence |
| PSL | Pristine Sample Laboratory |
| RSL | Returned Sample Laboratory |
| RPL | Returned Processing Laboratory |
| CSI-UNM | Center for Stable Isotopes, University of New Mexico |
| SRS RGA | Stanford Research Systems Residual Gas Analyzer |
| GSFC | Goddard Space Flight Center |
| EDX | Energy-Dispersive X-ray Spectroscopy |
| IMFP | Inelastic Mean Free Path |
| SSRL | Stanford Synchrotron Radiation Lightsource |
| SLAC | Stanford Linear Accelerator |
| FIB | Focused Ion Beam |
| PET | Preliminary Examination Team |
| LPI | Lunar and Planetary Institute |
| NCE | No-Cost Extension |
| LOP | Laboratory Operating Procedure (within NASA curation) |
| LSAPT | Lunar Sample Analysis Planning Team |
| PSL | Pristine Sample Laboratory (Apollo curation lab) |
| RSL | Return Sample Laboratory (Apollo curation lab) |
| RPL | Return Processing Laboratory (Apollo curation lab) |
| CAPTEM | Curation and Analysis Planning Team for Extraterrestrial Materials |
| AARB | Astromaterials Allocation Review Board |
| CAS | Chemical Abstracts Service |
| QEMSCAN | Quantitative Evaluation of Materials by Scanning Electron Microscopy |
| UND | University of Notre Dame |
| UNM | University of New Mexico |
| FMR | Ferromagnetic Resonance |
| VNIR | Visible-Near Infrared |
| XRD | X-ray Diffraction |
| PMT | Photomultiplier Tube |
The Apollo Program was a historic and evolutionary first step to explore a planetary surface by humans. It involved incredible engineering and managerial innovations that evolved over a short period of time in response to access, exploration, technology, and science needs as well as geopolitical pressures. In addition to representative and documented rock and regolith samples that were collected by the 12 astronauts who explored the surface, some special samples were collected, preserved, or processed in unique containers or environments (e.g., Core Sample Vacuum Container (CSVC), Special Environmental Sample Containers (SESC), Contact Soil Sampling Device (CSSD), cold curated samples, nitrogen and helium glovebox processing and storage) to answer specific exploration and science questions. As a result of the foresight of NASA and its early advisors, several of these special samples were intentionally left unopened or unexamined by extant analytical approaches.
As anticipated, after 50 years of analysis and study, sophistication for handling, examining, and analyzing samples and for synthesis of data has greatly increased. The purpose of the Apollo Next Generation Sample Analysis (ANGSA) initiative was to examine a subset of these special samples using a combination of new and traditional curation and sample analysis technologies. These are essentially new samples whose mass is greater than or equivalent to those of previously collected on missions other than Apollo (Chang’e 5 (1.7 kg); Luna 16, 20, 24 (total of 0.326 kg)) and proposed sample return missions (e.g., MoonRise, Isochron (1-2 kg)). In this way, ANGSA was purposely designed to mimic a new sample return mission with an interactive science team, sample processing, preliminary examination using new tools, analyses utilizing new and improved technologies, and integration of recent mission observations (e.g., Lofgren 2009; Shearer 2008; Shearer et al. 2015, 2019, 2020). The science team included Apollo 17 astronaut and field geologist Harrison Schmitt, science team members from previous orbital missions (Chandrayaan-1, Lunar Reconnaissance Orbiter), sample scientists (from universities, NASA centers, national centers, science institutions), engineers (NASA, ESA, universities), JSC curation staff, and education and public outreach staff (universities, LPI and SSERVI). The ANGSA initiative links the first generation of lunar explorers and scientists (Apollo) with current and future lunar explorers and researchers (Artemis Program).
The ANGSA initiative accomplishes some of the science proposed both for the Apollo program in general and for specific missions. The primary goal of the Apollo 17 mission was to collect and document as diverse a suite of samples as possible and to study the context of these samples relative to observed lunar surface geology. This overarching goal was achieved. Several more specific and targeted science goals, however, were begun on the lunar surface (Baldwin 1972; Garrett 1972; Schmitt 1973) but were not taken to their logical conclusions. These goals included: (a) collect a single core tube sample from greater than 1 km from Lunar Module (LM) and seal it in a CSVC. In 1972, prior to Apollo 17, the goal was to collect relatively deep (72 cm), vacuum-sealed sample from the Moon, potentially capable of providing volatile, isotopically, and biologically pristine samples for gas analysis and for chemical and microphysical analyses; (b) sample indigenous lunar gas that may have been released from the Lee-Lincoln scarp and trapped within the light mantle deposit; and (c) collect a core sample from the light mantle deposit to understand the dynamics and triggers of a lunar “regolith landslide”. Double drive tube samples 73001 (lower portion of the double drive tube that was vacuum sealed in a CSVC) and 73002 (upper portion of the core that remained sealed in its drive tube) were collected at Station 3. These are several of the samples that were the focus of ANGSA.
The ANGSA initiative was timely. It was joined with the 50th anniversary of the last Apollo lunar landing mission and was one of NASA’s first steps directed toward putting humans on the Moon as part of the Artemis program. As such, it accomplished many firsts in lunar exploration: (a) the first opening of a CSVC; (b) the first examination of a core penetrating a landslide deposit; (c) completion of the first experiment to sample endogenous gases released from the Moon’s interior (Lee-Lincoln scarp); (d) the first Apollo core opened in a generation (since the early 1990s); (e) the first core examined by integrating new technologies with proven Apollo approaches; and (f) the first examination of Apollo samples cold curated for almost 50 years. As a “modern” sample return mission, ANGSA tested new approaches for carrying out preliminary examination of lunar samples (e.g., employing micro-X-ray Computed Tomography (XCT); multi-spectral imaging), training lunar curation staff for future sample return missions from the Moon, developing new tools for extracting and storing lunar gases, executing NASA’s first-ever cold astromaterials processing, educating a new generation of lunar sample scientists, considering new lunar science concepts, and providing an interactive link between Apollo and Artemis scientists, engineers, and astronauts.
Here we highlight many aspects of the ANGSA initiative as a “new” sample return mission that inform future lunar exploration through the Artemis program: the special samples, the science and exploration goals, preliminary examination-curation-analysis approach, tools, integration of sample measurements with orbital and field observations, and team preparation and organization.
Description of Samples
Numerous “special samples” were collected during the Apollo Program to preserve their unique and fragile characteristics. The purpose of placing samples in sealed containers was to protect characteristics that could be modified by interactions with the spacecraft cabin’s atmosphere or the Earth’s environment and curation procedures. One obvious case that illustrates this point is sample 66095 (“rusty rock”). The extent to which 66095 has reacted with the Earth’s environment has long been debated (e.g., Taylor et al. 2001). There are a variety of special samples (Table 2) in the Apollo collection: samples collected so that they could be re-orientated to their in situ and/or formational positions, samples that provided vertical cores including those placed within special containers and/or collected, curated, or processed in unique manners (e.g., Contact Soil Sampling Device (CSSD); frozen, processed and stored in He rather than N2).
Table 2.
Special samples collected during the Apollo Program

Special sample containers included: (a) Gas Analysis Sampling Container (GASC); (b) Core Sample Vacuum Container (CSVC) (Fig. 1); (c) Special Environmental Sample Container (SESC); (d) Lunar Environment Sample Container (LESC); and (e) Magnetic Shield Sample Container (MSSC). The GASC, LESC, SESC and CSVC were all sealed in a similar manner using a knife-edge cap and an indium (90%) and silver (10%) seal. Avoiding dust contamination of such seals was a major objective of the astronauts. Prior to ANGSA, unopened samples included two CSVCs (69001 and 73001) and a SESC (15014). For the CSVC from both Apollo 16 and 17 sites, drive tube cores were immediately placed in vacuum containers on the lunar surface. Upon receipt at the Lunar Receiving Lab, each CSVC was placed in an additional vacuum container. The samples were stored in the Pristine Sample Vault. Combined, these three unopened samples contain 1.7 kg of pristine, unstudied lunar material.
Fig. 1.

(a) Unopened Vacuum Sealed Apollo Samples: 3 of 9 “special samples” remain sealed: SESC 15014 (333 g), CSVC 69001 (558 g), and CSVC 73001 (809 g). The diagram illustrates relative sizes of GASC, SESC, and CSVC. Also illustrated is the sealing mechanism for the containers. (b) Unopened Unsealed Drive Tubes: 2 unopened, unsealed drive tubes: 73002 (430 g) and 70012 (485 g). The diagram illustrates drive tube in the lunar surface and a capped drive tube. (c)Frozen Apollo Samples include 6 subsamples of A17 drill core 70001,5-70006,5, 9 subsamples of permanently shadowed soils 72320 and 76240, soil 70180, and vesicular high-Ti basalt 71036. Images illustrate the shadowed soil, basalt, and deep drill core
One of the SESCs was opened, processed, and stored in He rather than N2. The latter is typically the atmosphere in which all other lunar samples are stored and processed. Sample 15012 was collected at the Apennine front from the bottom of a small trench at Station 6 during the Apollo 15 mission and placed in an SESC. It was opened in A.L. Burlingame’s lab at the University of California-Berkeley in a He atmosphere (Burlingame et al. 1971; Simoneit et al. 1972). There was minimal processing of the 312 g sample. Following processing and allocation, the sample was, and continues to be, stored in helium. Although this sample was an initial target for the ANGSA call for proposals, it was eventually not included as an ANGSA objective because those samples were not needed to conduct the scientific tasks in the funded ANGSA proposals and the expected difficulty of curating this sample in a timely and cost-effective manner.
The frozen samples consisted of a variety of subsamples collected during the Apollo 17 mission (December 1972) and placed in a freezer in January 1973. They remained sealed in stainless steel containers at a temperature of −27 °C, although a few storm-induced power outages may have allowed this temperature to rise, temporarily. The frozen samples were processed in a pristine glovebox within a freezer at −20 °C as part of the ANGSA initiative. The samples include six subsamples of the Apollo 17 deep drill core (70001,3 – 70006,5), nine subsamples of continuously or significantly shadowed soils (72320, 76240), soil (70180), and a vesicular high-Ti basalt (71036). Sample locations within the Taurus-Littrow valley are shown in Fig. 2.
Fig. 2.

LROC image of the Taurus Littrow Valley illustrating the location of double drive tube 73001-73002 at Station 3 on the light mantle deposit at the base of the South Massif (white star) and sampling locations of the frozen samples analyzed in the ANGSA initiative (while data points). For scale within the valley floor, the distance from Station 3 to Station 4 is 2 km; the distance from the LM (triangle) to Station 4 is 4 km
A significant focus of the ANGSA initiative was on the 73001/73002 double drive tube and the frozen samples. Sample locations within the Taurus Littrow Valley are shown in Fig. 2. The double drive tube was collected at Station 3, and it penetrated to a depth of approximately 70 cm into the light mantle deposit at the base of the South Massif. The light mantle deposit was interpreted to represent the youngest of the landslide deposits originating from the South Massif. Sample 73001, which contains approximately 809 g of regolith, is the bottom segment of the double drive tube, from below 22 cm in the curated drive tube; however, the upper tube, 73002, was compacted from 35 cm on the Moon as well as during extrusion from the tube, so the in situ depth of the top of 73001 was ∼35 cm. Core 73001 was “frozen” (∼250 K, −23 °C) at the time it was collected and sealed in the CSVC (Keihm and Langseth 1973). Although not in a CSVC, the upper core (73002) had not been examined, except for X-ray imaging soon after its return, and had remained unopened until the ANGSA initiative began in 2019. Sample 73002 has a lower mass than 73001, at 430 g. In its compacted state, it is shorter than 73001, and it appears that some material from the top or bottom of the 73002 core was lost during collection on the lunar surface. The 73002 portion of the double drive tube was exposed to more in situ diurnal temperature variations than 73001 (Keihm and Langseth 1973).
The total mass of “pristine” lunar samples available to the ANGSA initiative exceeds the mass returned by all the robotic Soviet Luna missions and is roughly equal to the mass returned by the Chang’e 5 mission. In addition, all the samples were collected, stored, and processed in methods very unlike those used for Luna or Chang’e 5 missions (Shearer et al. 2015, 2019).
Apollo 17 Field Context for the ANGSA Samples
The ANGSA initiative was organized as a “low-cost sample return mission” and as such, added team members who could contribute both orbital and field observations and documentation imagery into this “sample return mission”. Integration of these types of observations places samples within a local and regional geologic context, provides ground truth to orbital-field observations, and makes all these data sets much more scientifically valuable. This will be the approach taken during Project Artemis in the years to come. In Sect. 3.1, this paper illustrates the value of more recent orbital data to the ANGSA initiative. Section 3.2 shows the value of “boots-on-the-ground” observations from an observational perspective of 50 years after the original Apollo 17 mission. The latter perspective is from Apollo 17 astronaut and ANGSA team member Harrison Schmitt. A video of “Boots-on-the ground” activities during Apollo 17 at Station 3 are presented in an online Supplemental component to this manuscript. Transcripts of these activities are presented in Cernan (1972).
Taurus Littrow Valley and Station 3 from Orbital Missions
Unavailable prior to the Apollo 17 mission is the current wealth of geological, mineralogical, and geochemical data delivered by numerous remote instruments (e.g., Clementine’s Cameras, Lunar Prospector’s Gamma Ray Spectrometer, Lunar Reconnaissance Orbiter (LRO) Cameras (LROC/NAC), LRO Diviner, LRO Cosmic Ray Telescope for the Effects of Radiation, LRO-Mini-RF, Kaguya Spectral Profiler, Kaguya Multiband Imager, Chandrayaan-1 Moon Mineralogy Mapper) on orbital missions to the Moon (e.g., Lunar Reconnaissance Orbiter, Selene, SMART 1, GRAIL, LADEE, Chandrayaan missions, Chang’e missions). ANGSA investigation had the benefit of images and data from all these post-Apollo robotic missions.
Taurus Littrow Valley Light Mantle Deposit
The light mantle deposit at the base of the South Massif in the Taurus-Littrow Valley has a mantling or draping relationship to the underlying lunar terrain (Fig. 2). The mantling deposits at the base of the South Massif represents multiple landslide events (Magnarini et al. 2021; Schmitt et al. 2017; Muehlberger and Wolfe 1973; Lucchitta 1977; Shearer et al. 2022). The integration of Station 3 core sample (73001/2) with additional surface samples (Station 2 and 3), orbital observations, and “boots-on-the-ground” geological studies (Schmitt et al. 2017; Shearer et al. 2022; Sun et al. 2022a,b) provides a richer understanding of this and other lunar waste masting deposits (e.g., Senthil Kumar et al. 2013; Xiao et al. 2013; Scaioni et al. 2018; Boyce et al. 2020), evolution of the regolith since their emplacement (Sun et al. 2022a,b), and the nature of their source materials (Moriarty et al. 2022).
Remote Sensing Data:
The enormous volume of data collected by the Lunar Reconnaissance Orbiter and other contemporary missions enables unparalleled insights into the Moon’s surface. Relevant to the interpretation of the regolith history of Station 3 (Fig. 3) are datasets that reveal variations in regolith properties, particularly in maturation and fragment distribution with depth. Multiple datasets and what they reveal about the light mantle deposit are presented in Fig. 3. A “flyby” video of the TLV and Station 3 that was reconstructed from LRO data is presented in the online Supplemental component to this manuscript.
Fig. 3.

Multiple perspective views of the South Massif and light mantle deposits at the Apollo 17 landing region. Data is from Lunar QuickMap. (a) LROC NAC low incidence angle images with the locations of LRV-2 (green dot, 72140) and LRV-3 (blue dot, 72150) sample sites and Station 3. (b) Kaguya Spectral Profiler Optical Maturity parameter. Light gray is low maturity and dark gray represents more mature regolith. (c) LRO Diviner-derived h-parameter. The h-parameter provides insights into the density variations in the upper few cm of the regolith. The similarity between the Station 3 regolith and the regolith of the valley floor indicates a similar degree of regolith density. (d) LRO Diviner-derived rock abundance. The rockiest surfaces associated with the light mantle are limited to steep surfaces at the South Massif and outside the deposit in the central cluster (light blue). This strongly suggests that within the upper 10 cm of the regolith at Station 3, the rock population (rocks >50 cm in diameter) is comparable to the rest of the valley floor (dark blue)
Lunar Reconnaissance Orbiter Camera - Narrow Angle Camera:
Images from the LROC NAC, specifically those taken with low solar incidence angles, reveal albedo variations that highlight differences in composition and exposure history (Robinson et al. 2010). In Fig. 3a, a perspective view of the South Massif and light mantle deposit reveals the higher albedo in the “young” light mantle (the surface setting for Station 3) and relatively lower albedo in the “old” light mantle (Schmitt et al. 2017), and the setting for Lunar Roving Vehicle (LRV) 2 sample 72140 as well as the regolith in core 73001. Streaks of high albedo material are visible on the South Massif, some of which correspond to compositional differences noted by Moriarty et al. (2022).
Kaguya Optical Maturity Parameter:
Mapping of variations in optical maturity (Lemelin et al. 2016; Lucey et al. 2000) is useful in identifying variations in exposure history particularly across geologic units of similar composition (Fig. 3b). This index of regolith maturation and exposure history is calculated by coupling spectral reflectance with an optimized origin and is one of several measures of regolith maturity (e.g., Lucey et al. 2000).
Diviner h-Parameter:
The Diviner instrument on LRO provides critical insight into the thermophysical properties of the regolith. The “h-parameter” provides insight into density variations in the upper few centimeters (Hayne et al. 2017). The light mantle deposits do not present as having variations relative to the valley floor, beyond small areas that have thicker low-density surfaces (units in blue in Fig. 3c). This implies that the upper centimeters of regolith at Station 3 have matured similarly to the valley floor. Crew observations reported that large rock fragments and boulders appeared to be only associated with the rims of large impact craters that did not penetrate the landslide deposits, confirming this Diviner.
Diviner Rock Abundance:
Perhaps not surprisingly, the rockiest surfaces (Bandfield et al. 2011) associated with the light mantle are limited to steep surfaces at the South Massif and outside the deposit in the central cluster (Station 1). This strongly suggests that within the upper 10 cm of the regolith, the rock population (rocks > 50 cm in diameter) is comparable to the rest of the valley floor (Fig. 3d).
Given the diversity of remote sensing datasets available for the Moon, we have an opportunity not only to revisit Apollo sites and our understanding of samples (particularly the “pristine” Apollo samples) to better interpret their geologic context, but also to use that understanding to prepare for Artemis samples and their context. For example, the Apollo 17 Station 3 setting with its light mantle deposit is potentially comparable to portions of the lunar south pole and the possible presence of distal ejecta from Tycho (Denevi and Robinson 2020). Certainly, geologic relationships between multiple, overlapping ejecta deposits of craters (Fortezzo et al. 2020) or mass wasting events near the south pole present a complex environment for the lunar community to untangle. The interpretation of the Apollo 17 Station 3 core and its geologic context not only prepares us for such complex geologic relationships, but also points to the critical need for core samples from the south pole and elsewhere on the Moon.
Characterization of Feldspathic and Noritic Material in the South Massif
Integrated remote sensing observations of the valley-facing slope of the South Massif (including the light-mantled landslide deposit) are presented in Fig. 4. They include imagery and derive mineralogical/compositional products from LROC and Kaguya Multiband Imager (Robinson et al. 2010; Sato et al. 2017; Lemelin et al. 2019; Petro et al. 2020, 2022).
Fig. 4.

An overview of recent compositional remote sensing data available for the South Massif, sourced from the Lunar Reconnaissance Orbiter Camera and Kaguya Multiband Imager via the LRO Quickmap (Moriarty et al. 2022)
From these maps, it appears that the South Massif hosts two distinct lithologies: (1) a primary feldspathic lithology, probably felspathic impact melt-breccias, based on Apollo 17 samples and (2) a localized noritic deposit as suggested by M3 data that is similar to noritic materials sensed and sampled (78235) in the Sculptured Hills. The massif and landslide are broadly low in FeO, clinopyroxene, olivine (<10 wt%) and TiO2 (<2 wt%) but have the highest uranium and thorium contents in the Apollo 17 sample suite (Silver 1974). The light mantle deposit and most of the massif are high in plagioclase (>∼80 wt%) and low in orthopyroxene (<10 wt%). However, a localized deposit draping the central ridge and valley-facing slope exhibits elevated orthopyroxene abundance (∼30 wt%) and lower plagioclase abundance (∼60 wt%). This localized deposit remains low in FeO and clinopyroxene, suggesting that it is a noritic lithology dominated by Mg-rich low-Ca pyroxenes (orthopyroxene or Fe-poor pigeonite) and plagioclase.
These two materials are associated with distinct albedo differences (Figs. 4). Areas with elevated orthopyroxene abundance are associated with lower-albedo surface units, and several boulder fields are observed within this material. In contrast, areas with low orthopyroxene abundance are associated with higher-albedo surface materials.
Table 3 summarizes the apparent compositional properties of the two identified lithologies. It should be cautioned that these optically-derived compositional values are only approximations and are subject to errors arising from observational artifacts. For example, the Kaguya MI orthopyroxene abundance map in Fig. 4 clearly exhibits track-to-track differences in derived orthopyroxene abundance, and it has been previously noted that the olivine abundance parameter is sensitive to the presence of volcanic glass (Moriarty and Petro 2020). Nevertheless, these products are useful tools for identifying and characterizing compositional diversity across the lunar surface, providing essential context for sample analysis. Conversely, collected samples provide important ground truth and improve our ability to analyze and interpret remote sensing data.
Table 3.
Compositional end-members associated with the face of the South Massif
| Compositional property | Feldspathic unit | Noritic unit |
|---|---|---|
| FeO (wt%) | <10% | <10% |
| Plagioclase (wt%) | ∼80% | ∼60% |
| Olivine (wt%) | <10% | <10% |
| Clinopyroxene (wt%) | <10% | <10% |
| Orthopyroxene (wt%) | <10% | ∼30% |
| TiO2 (wt%) | <2% | <2% |
Geological Context of Drive Tube Sample 73001/2
Introduction
Early studies of the Taurus-Littrow Valley summarized by Wolfe et al. (1981) identified a prominent, plume-like surface deposit projecting a maximum of about 5 km from the base of the 2.2 km high South Massif on to the valley floor (Figs. 2, 5). This deposit was objectively named the “light mantle;” however, high-sun images obtained by the Lunar Reconnaissance Orbiter Camera (LROC) as well as re-examination of Apollo 17 orbital images made it clear that the unit is made up of two distinct deposits, one partially covered by the other. The two deposits are referred to here as the “young” light mantle” and “old” light mantle,” respectively. Additional work by R. A. Wells (personal communication) has identified at least two other mass-wasting deposits from the South Massif slopes, lying to the northwest of the area explored by Apollo 17 and there is indirect evidence of at least two more ancient such deposits.
Fig. 5.

Young and old light mantle deposits (YLM and OLM, respectively) that extend northeast from the base of South Massif. (a) high-sun LROC image (M185684128). (b) high-sun LROC image with main light mantle features identified (M185684128), (c) high-sun LROC image with northwest and southeast boundaries of the young light mantle identified (M185684128), (d) non-penetrating craters used to estimate the thickness of the young light mantle (>3 m) and the combined thickness of the two light mantles (6-10 m), and (e) penetrating craters in a finger of old light mantle indicating a thickness of 3-6 m (M185684128)
In discussing the origin of the Taurus-Littrow light mantle deposit, Schmitt et al. (2017) stated: “In preparation for the geological exploration of the light mantle unit, the senior author speculated that this feature might have been the result of a fluidized avalanche of South Massif regolith. The perpendicular orientation of the unit relative to the northeast-facing slope of the South Massif and its feathered distal ends suggested such an origin. Prior to the Apollo 17 mission, this possibility was discussed with UCLA Professor of Geophysics Ronald Shreve, an early researcher on fluidization of rock debris avalanches (Shreve 1968). After some discussion, it was concluded that, in order for the material of the light mantle to travel up to 5 km, gases from some source probably fluidized an avalanche of regolith previously developed on the slope of the South Massif.”
The combined area of the two avalanche deposits covers ∼20 km2 with a thickness of >6 m as indicated by the apparent depth of non-penetrating, post-deposition impact craters (Pike 1974, depth/diameter =∼0.2) (Fig. 5a-d), giving an estimated combined volume of at least 0.12 km3. The southeast portion of the young light mantle, however, overlies the old light mantle and their combined thickness may be 12 m or more. Dark-floored, barely penetrating impact craters in the visible portion of a finger of the old light mantle (Fig. 5e) indicate that it is 3-6 m thick. Since the last of these avalanches took place, new regolith has been formed both on the surfaces of the resulting deposits and on the slope of the South Massif.
Schmitt et al. (2017) placed the age of the avalanche that formed the young light mantle between 110 and 70 Myr based on a review of the cosmic ray exposure ages of boulders younger than the avalanche and crater frequency analyses reported by Van der Bogert et al. (2012). As discussed further below, it may be possible to refine the ages of both the young and old light mantle, as well as understand the avalanche origin and dynamics, through a synthesis of in situ observations and photographs, cosmic ray exposure ages, IS/FeO maturity indices (Morris 1978), uranium plus thorium contents (Silver 1974; Meyer 2012), insights gained from an on-going synthesis of deep drill core regolith ejecta zones (70001/9), and on-going maturity analyses related to studies of the Station 3 drive tube core.
Geology of the Young and Old Light Mantles
Observations, samples, and photographs obtained at two of the Apollo 17 exploration Stations, numbers 2 and 3, and observations and sampling during LRV traverses to and from those stations, provide insights into the geology of the young and old light mantles, including the dynamics and aging of lunar avalanche deposits. The deposits consist of regolith that previously had accumulated on the slope of the South Massif. This source regolith originally included both commutated melt-breccia, similar to rock fragments in rake sample 72500; noritic rock fragments; and, before any avalanche activity pre-mare lithoclastic ash like that present in rake sample regolith 76501 from the North Massif (Schmitt 2016).
Field observation, orbital datasets, and sample data allow detailed characterization of the geology of the young light mantle and, by extension, that of the partially buried old light mantle (after Schmitt et al. 2017). These characteristics are as follows:
With three exceptions (the ∼110 m diameter Shorty Crater, its nearby ∼50 m diameter sister crater, and the ∼80 m diameter Nansen rim crater), impact craters do not penetrate the northwestern portion of the young light mantle (Fig. 5d). LROC images of 15 m diameter, non-penetrating impact craters in that area set a minimum limit of ∼3 m on the thickness of the deposit, based on Pike’s ∼0.2 depth-to-diameter ratio for small lunar craters (Pike 1974).
Similarly, 30-50 m diameter, non-penetrating impact craters on the southeastern portion of the combined young and old light mantle (Fig. 5d) set a minimum limit of 6 m on the combined thickness of two deposits.
High-sun images (Fig. 5 a.b) indicate that an area of post-avalanche regolith developed on the slope has an old, relatively low albedo, with relatively higher albedo post-avalanche regolith on either side. This juxtaposition suggests that some now low albedo, post-old light mantle avalanche regolith remains exposed on the slope.
Schmitt’s field observations (Schmitt 1972, 2014) and post-mission examination of Station 2 rake sample 72500 and Station 3 rock samples (Wolfe et al. 1981; Meyer 2012) indicate that the rock constituents of the light mantles are complex impact breccias similar to, but more diverse than, the three boulders (722xx, 723xx, 724xx) sampled on the slope of the South Massif.
The upper 5 cm of the young light mantle (72700) consist of very fine-grained regolith particles, with a paucity of rocks > 1 cm in size. As expected, agglutinates (>40%) are abundant and dark mantle regolith fragments (including orange and black volcanic beads) are scarce (<5%). Rake sample 72700 from the upper 5 cm of the light mantle contains about five times fewer rock fragments > 1 cm than rake sample 72500 from the nearby slope of the South Massif (Wolfe et al. 1981).
The bright return from the light mantle to the 12.6 cm Mini-RF S1 radar (Raney et al. 2011) suggests that the young light mantle is slightly indurated and fractured below the ∼5 cm of post-avalanche regolith. It also is possible that the frequency of larger rocks increases in the upper meter or so of the young light mantle in contrast to their general absence at its surface. Regolith clod sample 73131 from the wall of a ∼1 m diameter fresh impact crater might reflect this flow induration; however, it is more likely that 73131 is a sample of impact induration. The brighter return from Mini-RF is not evident from the old light mantle.
Observations and photographs obtained during Apollo 17 LRV traverses across the young light mantle and at Station 3, as well as high resolution LROC imagery, show that rocks and boulders in the light mantle are only abundant at the rims of the larger, but non-penetrating impact craters. This suggests that such rocks and boulders are concentrated at depth, as would be expected in a fluidized, flowing medium.
Schmitt et al. (2017) discussed the surface topography of the young light mantle as follows: “LROC images (Fig. 5d) show that parallel, ridge and swale longitudinal lineations on the surface of the light mantle extend perpendicular to the northeast base of the South Massif, with the same bearing as its distal plumes. These lineations exhibit a crest-to-crest wavelength of 100-200 m…” There is “…a lineation pattern of much shorter wavelength (20-50 m) on the interior southwest-facing slope of the Nansen moat at the base of the South Massif.” Magnarini et al. (2021) used the spacing of these longitudinal lineations (“ridges”) to estimate the thickness of the light mantle deposits. Near the base of the South Massif, that estimate is a factor of ∼2 greater than the minimum indicated by impact craters. Further away, ∼0.7 km from the base of the massif, that estimate is a factor of ∼6 greater. These discrepancies indicate that our understanding of the relationship between light mantle lineations and thicknesses is incomplete.
Schmitt et al. (2017) also noted that LROC NAC images (e.g., NAC M192753724) show “a few shallow, graben-like depressions cross the lineations at oblique angles within about a kilometer of the base of the South Massif. These grabens may have developed, after some induration, by extensional stress late in the flow and settling history of the avalanche.”
No significant differences are reported in volatile contents between the light mantle and its South Massif source area regolith. Saturation in the sampled surface regolith, however, may have been reached for solar wind volatiles. Schmitt et al. (2017) apparently misread sample numbers in Petrowski et al. (1974) relative to a difference in sulfur content in rake samples 72500 and 72700. Little difference in sulfur content exists.
Items 5-9 above support the hypothesis that the light mantle was formed from fluidized regolith in which mass-to-surface area ratio variations caused fine particles to be concentrated near the top of the avalanche and large fragments to be more abundant at depth. Schmitt et al. (2017) also suggested “compaction by settling during the late stages of fluid (gas) escape upwards (see Shreve 1968; Valverde and Castellanos 2006)” to explain the observed induration. The 12.6 cm radar returns are sensitive to 1-1.5 m depth (Raney 2007; Nozette et al. 2010; Raney et al. 2011) so induration may extend at least to that depth. On the other hand, decimeter-sized rock fragments would also increase in frequency with depth in a fluidized medium (Schmitt et al. 2017).
Light Mantle Avalanche Dynamics
Two sources of fluidization of lunar avalanches have been proposed. Carrier et al. (1973) reported the release of solar wind hydrogen during geotechnical agitation of lunar regolith. In his comparison of the solar wind volatile content of sample 10084 with regolith breccias returned by Apollo 17, Schmitt (2006) concluded that agitation between sampling and analysis might have released ∼40% of the in situ solar wind volatiles. On the other hand, Melosh (1979) and Collins and Melosh (2003) suggested that acoustic fluidization may occur as a consequence of high-frequency pressure variations generated as the regolith pile collapsed and began to flow. Scott (1987) proposed a “pseudo-fluidized condition” in which the dynamic motion of regolith particles at the base of a lunar avalanche creates a fluidized layer that supports the avalanche. All three of these mechanisms may be active; however, the presence of several hundred parts per million of solar wind hydrogen, helium, carbon, and nitrogen (Heiken et al. 1992) in samples such as 72501 and 72701, even after post-sampling agitation losses, suggest that solar wind volatile fluidization probably is a major contributing factor.
The standard variable used to characterize debris and pyroclastic flows is the H/L net efficiency (Iverson 1997). The young light mantle avalanche meets the definition of a “long run-out landslide” offered by Magnarini et al. (2021) with a H/L ratio of >1.7 (ratio of landslide height to length). For the young light mantle, H/L is ∼0.22 (∼2.2 km maximum height-H / 10.0 km maximum run-out length-L) (Magnarini et al. 2021). This is about 20× less than comparable volumes of water-rich, poorly sorted, terrestrial pyroclastic debris flows (Iverson 1997). The 1/6 Earth’s gravity on the Moon also probably contributes to this difference. As stated by Schmitt et al. (2017), “This comparison suggests that the physics of volatile fluidization of the light mantle avalanche was not comparable to water fluidization of terrestrial debris flows of similar masses, possibly due to a rapid loss of solar wind volatiles to vacuum or to more transient acoustical or pseudo-fluidization processes noted above. The highly irregular surfaces of most of the particles within the avalanche also may increase the internal frictional losses of kinetic energy relative to terrestrial pyroclastic flows.”
Deposition Age of the Young Light Mantle
It has been proposed by (Arvidson et al. 1976; Drozd et al. 1977; Lucchitta 1977; Denevi and Robinson 2020) that the light mantle deposit was the result of the impact of ejecta from Tycho Crater ∼2350 km (QuickMap) to the southwest. This hypothesis is based on the presence of an ejecta ray that traces back to that crater and crosses the valley of Taurus-Littrow as well as the assumption that impact craters in the Crater Cluster present several kilometers east of the old and young light mantles are Tycho secondary craters. These suggestions and conclusions predated the identification of several other large mass-wasting events from the slopes of the South Massif of different relative ages, a fact that would make it unlikely, but not impossible that Tycho ejecta was the trigger for the young light mantle avalanche. Further, recent work on the relative and absolute ages of 400-800 m diameter craters that make up the Crater Cluster, and their regolith ejecta sampled by the deep drill core, indicate that the Cluster is comprised of at least five different impact events, including four elliptical, apparently simultaneous impacts of that may be from a cometary aggregate. The existence of the Lee-Lincoln thrust fault in the same part of the valley as the light mantles provides a more likely alternative for triggering repeated mass-wasting events.
The young relative age of both light mantles is shown by their superposition on the basaltic, dark mantle regolith surface and the presence of less than ∼10 cm of new regolith development since young light mantle deposition (Schmitt 1972). The dynamics of the young light mantle avalanche were such that boulders previously accumulated at the base of the South Massif’s slope appear to have been carried away and incorporated in the avalanche deposit. Although the uphill tracks of the boulders now resting near the base of the slope of the South Massif at Station 2 have disappeared due to macro- and micro-meter cratering and related down-slope mass-wasting, it seems highly likely that the current boulders arrived after the young light mantle avalanche.
Of the three boulders sampled at Station 2, Boulder 1 appears to be the first to have rolled into place. Unlike the other two boulders sampled, the lower portion of Boulder 1 is embedded in the slope regolith (Fig. 6), and direct observation and study of Hasselblad and LROC photographic images show that any uphill track that would lead to its source has completely disappeared. Several cosmic ray exposure ages have been reported on the samples taken from Boulder 1 (Leich et al. 1975; Arvidson et al. 1976; Drozd et al. 1977) with the oldest being Leich et al’s Kr exposure age of 52.5 ± 1.4 Myr for sample 72275. This sample was from the top of Boulder 1 (Schmitt 1972) and was the sample most exposed to full cosmic ray flux. It is possible that Boulder 1 came to rest soon after the young light mantle avalanche occurred and, indeed, may have been dislodged as the crest of the avalanche moved downward.
Fig. 6.
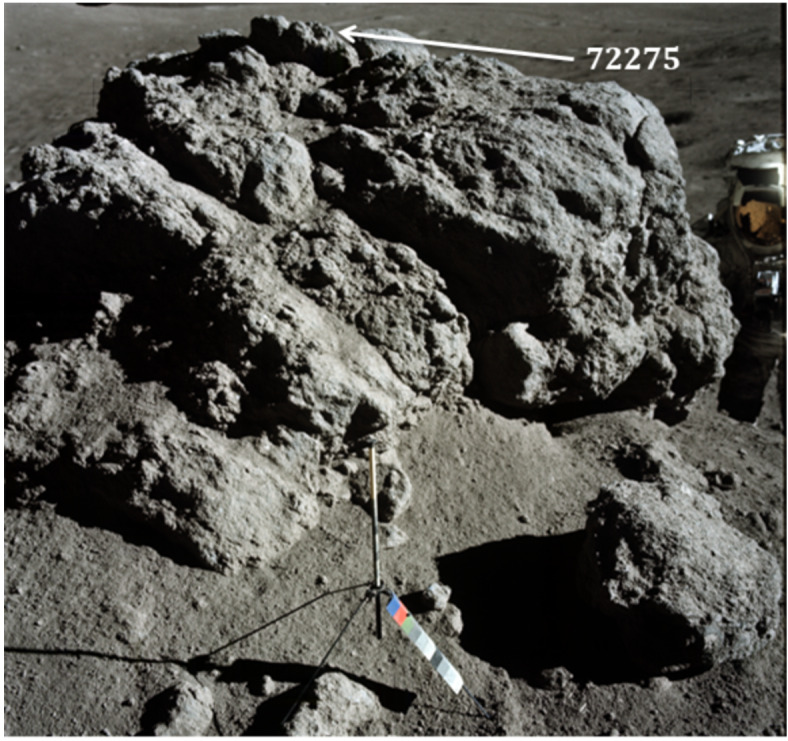
Northwest looking view of South Massif Boulder 1 at Station 2 showing the location of sample 72275 and the embedded nature of the lower portion of the boulder in post-young light mantle avalanche regolith present on the slope of the massif. (NASA Photo AS17-137-20900)
It is possible to test whether 52 Myr is close to the age of young light mantle. The dynamics of a fluidized regolith avalanche deposition can be expected to result in complete turbulent mixing of various parameters, including the Is/FeO measure of maturity (Morris 1978, element concentrations (Silver 1974; Meyer 2012), and general petrographic characteristics (e.g., Heiken et al. 1992). Thus, at the instant of deposition, the light mantle reached a uniform state of maturation after which additional solar wind proton radiation and uranium and thorium alpha particle radiation effects on Is/FeO would be a function of deposition age (Schmitt 2022).
Estimates of the proton-only and alpha-only Is/FeO / Myr have been made by consideration of the relative maturation of sunlit and shadowed regolith reset ∼20 Mya ago (Crozaz et al. 1974; Turner and Cadogan 1974; Cadogan and Turner 1976) by the impact of the large Boulder at Station 6. The effect of maturation related to solar proton radiation appears to decline linearly from ∼0.625 Is/FeO units per Myr to zero after about 50 Mya due to the isolation of Fe2+ from proton reduction by continuously developing glassy rinds (patinas) on regolith particles as previously noted by Taylor et al. (2001) The Station 6 analysis give the near-term alpha-only Is/FeO / Mya as 0.134 per ppm U+Th. Specifically, the change in Is/FeO after avalanche deposition is shown by the difference of 40 between its value between skim sample 74121 (88) and 73141 (48) taken from ∼15 cm below the surface young light mantle surface, (Schmitt 1972).
The best fit with the 52 Mya cosmic ray exposure age of Leich, et al. comes from the data and estimates for LRV 6 skim sample 74121. Although the reported U+Th content for 74121 is only 3.2 (Meyer 2012), if U+Th for 73121 of 3.45 ppm is assumed as representative of the young light mantle, the calculated exposure age 52 Mya, close to the Liech et al. value of 52 ± 1.4 Mya. The assumption of U+Th = 3.45 ppm for 74121 is supported by Silver’s 1974 analysis for 73221, also a skim sample, and Neuman et al. (2022) and Morris et al. (2022) for core 73001/2.
Age of the Old Light Mantle Avalanche
In the recent broad analysis activities related to drive tube core 73001/2 by the ANGSA team, there has been significant debate over 1) whether the core actually penetrated the old light mantle and 2) whether core material was lost from the top or from the bottom of upper core 73002.
The primary reason co-author Schmitt concludes that core 73001/2 penetrated through a thin cover of young light mantle into old light mantle is the consistent value of Is/FeO = ∼14 below about 8.5 cm in compacted upper core, 73002. Otherwise, for this lower regolith to be young light mantle, trench sample 73141 would indicate the unexposed portion of core 73001/2 should equal 48, the value found below the visually obvious gardened and space weathered surface ∼10 cm of the young light mantle (trench sample 73121). (The trench from which 73121 and 73141 were obtained is in a broad, young light mantle area that appears to be representative of the upper portion of that deposit (Schmitt 1972).
Field observations and LROC images (Fig. 6a and b) and high-sun LRO images showing albedo differences indicate that the top of 73002 clearly is young light mantle material. An Is/FeO value of ∼70 at the top of that zone, on its face, appears incompatible with young light mantle surface samples 74121 and 73121 (Is/FeO = 88 and 78, respectively. A few centimeters of the upper core, however, appears to have been lost during sampling and with it was lost the more mature portion of the surface regolith originally at the site of the core. Projection of the trend in Is/FeO to ∼88 in the upper 3.5 cm suggests that about the same amount was lost, matching Cernan’s estimated of an “inch and a half.” In addition, the very loose top portion of regolith in upper core 73002 would be more likely to be lost during handling than the naturally, tightly compacted bottom portion.
LROC and Apollo orbital images of the young light mantle and old light mantle show the currently exposed old light mantle surfaces have a lower albedo (lower reflectance) than the young light mantle, recording longer exposure to space weather effects. In contrast, below the remaining 3.5 cm of young light mantle regolith in the upper core 73002, reflectance increases to a value 1.5 times greater at 8.5 cm than that for young light mantle. This contrast continues throughout the remainder of upper core 73002, as well as in all lower core 73001. Given their comparable U+Th contents (i.e., alpha-only maturation rate is the same), this increase in reflectance of material below the young light mantle shows that the old light mantle’s exposure to the proton and gardening environment at the surface was significantly less than that of the young light mantle. This fact is referred to as the “surface exposure constraint,” subsequently.
The surface exposure constraint also is evident, inversely, in the core’s Is/FeO data. Below 3.5 cm, the value of Is/FeO decreases by a factor of ∼4.3 from 60 to a roughly constant value of 14 ± 5 from 8.5 to 43 cm. From 43 cm to the end of the core at 53.5 cm, Is/FeO is variable at 16 ± 5.
A determination of the pre-burial exposure age of the old light mantle, based on Is/FeO data, requires knowledge of the Is/FeO / Mya for both solar proton and alpha particle maturation. Due to the surface exposure constraint, the proton-only Is/FeO / Mya will be greater than that estimated above for the young light mantle (0.283 for a mean age of 26 Mya) by an initially unknown amount. On the other hand, it may be possible to make a good estimate of the total Is/FeO of the exposed old light mantle prior to its burial by the young light mantle by consideration of the mixing trends in zones between 3.5 and 8.5 cm. An estimate of Is/FeO for the old light mantle as compared against the Is/FeO of the young light mantle over 52 Mya can give a rough estimate of the exposure age of the old light mantle. In turn, that age estimate gives a rough estimate of the proton-only Is/FeO / Mya. First, however, we must be sure that the U+Th content of the two light mantles essentially is the same, as they are likely to be, so that the alpha-only Is/FeO / Mya for the two mantles is a constant.
Neuman et al. (2022) and Morris et al. (2022) report that the U+Th content in 73001/2 overall has a mean of ∼3.5 ppm (3.11-4.38 ppm), increasing to a mean of 3.8 ppm (3.5-4.1 ppm) between 44 and 53.5 cm. The mean value of 3.5 is essentially the same as surface trench sample 73121 (3.45 ppm) from the young light mantle. It also is close to that of 3.447 ppm reported by Silver (1974) for young light mantle trench surface skim sample 73221 (reported by Silver as nonexistent 73321), having been obtained about 20 m away from the site of core 73002. The alpha-only Is/FeO / Mya for old light mantle, therefore, approximately equals that of the young light mantle, that is, ∼0.462 (0.134 × 3.45 ppm). Relative to the apparent 52 Mya exposure age of the young light mantle, this U+Th value means that the alpha-only Is/FeO for old light mantle also must be less than the ∼25 calculated for the surface sample 74121 to meet the surface exposure constraint.
If an estimate of the total Is/FeO for the old light mantle can be made, an estimate of the proton-only value can be obtained with knowledge that the alpha-only Is/FeO / Mya = ∼0.462 and total Is/FeO is between 21 and 31. Work is ongoing to make such an estimate within the surface exposure constraint. It currently appears that the pre-burial exposure age of the old light mantle is 35 ± 5 Mya.
Scientific Investigations Approved for ANGSA
Introduction
The NASA ANGSA Program was announced on February 14, 2018, with proposals due on August 21, 2018. The final AO identifying the scope and requirements of the program may be found at https://nspires.nasaprs.com/external/viewrepositorydocument/cmdocumentid=626203/solicitationId=%7B93410FB8-BE83-5F26-2960-216730BB3CA%7DviewSolicitationDocument=1/C.24%20Apollo-NG%20Amend%2012.pdf. Nine teams were selected by NASA through peer review, and teams were notified on March 1, 2019. These teams and science themes are listed below.
Research Teams
CAAAS, Consortium for the Advanced Analysis of Apollo Samples (Charles Shearer, PI, and the Following Institutions: University of New Mexico, Washington University St Louis, Open University, European Space Agency, Lawrence Livermore National Laboratory, University of Manchester, University College London, NASA Johnson Space Center, University of Hawaii, University of Notre Dame, NASA Goddard Space Flight Center, Harrison Schmitt, Purdue University, University of Virginia)
Utilizing these unique unopened, and sealed samples, the CAAAS consortium proposed to (a) investigate lunar volatile reservoirs and volatile cycles on the Moon that included weakly-bound volatiles on mineral surfaces, volatile coatings on mineral grains, and volcanic glasses, structurally bound volatiles in mineral and glasses, bulk regolith volatiles (moderately volatile elements (MVE), traditional and non-traditional stable isotopes of volatile elements), and the head gases preserved in the CSVC; (b) discover new lunar lithologies to reconstruct the magmatic-volatile-thermal-impact history of the Moon; (c) determine the stratigraphy and chronology of a lunar avalanche deposits to refine our understanding of lunar surface processes; (d) examine the contribution of meteoritic components to the formation and evolution of the lunar regolith and near-surface volatile reservoirs; (e) provide an integrated and overarching evaluation of the collection and preservation of volatile-rich samples for future exploration; (f) place samples within context of Apollo 17 geology and recent orbital data; and (g) carry out the preliminary examination of 73001-73002 by integrating new curation tools with proven, post-Apollo curation techniques.
Historical Studies of Lunar Surface Materials Based on Measurements of Cosmic-Ray Produced Radionuclides (Kees C Welten, PI, and the Following Institutions: University of California Berkley, Purdue University)
This group was funded to measure a detailed depth profile of cosmogenic radionuclides (10Be, 26Al, 36Cl, 41Ca) in the unopened 73001-73002 double drive tube. Measurement of multiple cosmogenic radionuclides with half-lives ranging from 0.1 to 1.36 Myr and different production mechanisms, by galactic cosmic rays (GCR) and solar cosmic rays (SCR) provides an excellent framework to address lunar surface processes on a timescale of 0.1 to 10 Myr. These measurements not only provide information on the history of the lunar surface core on a million-year timescale, but also on possible man-made disturbances of the core that may have occurred during sample collection, transport and/or curation.
Analysis of Volatile Organic Compounds in Specially Curated Lunar Samples: Insights into Amino Acid Formation and Curation Effects (Jamie Elsila Cook, PI, NASA Goddard Space Flight Center)
This group was funded to analyze the abundance and identifications of amino acids and potential precursors (amines, aldehydes, ketones, carboxylic acids, and cyanides) and compare their distributions with lunar environmental conditions such as depth and illumination. The team analyzed 12 samples made available through the ANGSA program: six samples taken from throughout the double drive tube (three from the top, unsealed half and three from the bottom, sealed half) and six surface samples (three frozen, three curated at room temperature). The potential effect of sealed and frozen curation on the preservation of these compounds is being evaluated.
Moon United (Barbara Cohen, PI; Natalie Curran, Science-PI; and the Following Institutions: NASA Goddard Space Flight Center, Carnegie Earth and Planets Laboratory, Smithsonian Institution)
This group is conducting noble-gas cosmic-ray exposure dating on a subset of samples from the vacuum-sealed and frozen lunar samples. Because exposure dating depends on understanding the nature of the sample, the team proposed to collect high-quality mineralogy and petrology data on the samples. These data are being used to understand the surface exposure history, gardening rate, and potential for volatile formation and retention in the samples. Surface interaction with the solar wind and cosmic rays influences the measurement of multiple characteristics that are of importance to the community. Examples include organic load analysis, where organic materials degrade and change with exposure to UV, indigenous volatile analysis, for which the solar-wind and cosmogenic contributions must be known and corrected for, and regolith layering and gardening, where successive generations of impact ejecta mix the surface components to varying depths. Cosmic-ray exposure ages will also be of great use when interpreting the history of the shadowed soils and determining their volatile content as a function of exposure time at the lunar surface.
A Multifaceted Approach to Investigating the Magmatic and Post-Magmatic History of Volatiles in Basalts from the Rim of Steno Crate (Jessica J. Barnes, PI and Includes the Following Institutions: University of Arizona, University of Colorado Boulder, University of California Riverside, University of Minnesota, NASA Johnson Space Center)
This group is focusing on a suite of samples collected from the rim of Steno Crater at station 1A on the Apollo 17 mission. The release of sample 71036 presents a unique opportunity to study volatiles in a basalt near the top of a lava flow, that has been frozen and specially preserved since its return. By also studying a set of samples (71035, 71055, and 71037) collected from the same boulder as 71036, they are comparing the results obtained on samples with different curation histories. This exceptional suite of basalt samples also offers a chance to unravel the history of volatile loss on the Moon, from the onset of mineral crystallization through vesicle formation, sampling, and subsequent curation. Detailed studies of (1) the major, minor, and volatile element chemistry (including H isotopes) of H-bearing minerals and melt inclusions in four Apollo 17 basalts, (2) 2D and 3D mineralogies and textures, (3) the speciation of sulfur in S-bearing minerals, and (4) the crystallization ages and exposure histories of the basalts are in progress.
Spectroscopy Consortium Addressing Redox Acquired by Beads (SCARAB) (M. Darby Dyar, PI and Includes the Following Institutions: Mount Holyoke College, Planetary Science Institute, University of Tennessee, University of Chicago, Argonne National Laboratory, University of Massachusetts Amherst)
The Spectroscopy Consortium Addressing Redox Acquired by Beads (SCARAB) is dedicated to measuring oxidation state and H gradients in pristine and previously studied lunar volcanic glass beads using X-ray absorption spectroscopy (XAS). We are quantifying and mapping spatial distributions of Fe, Ti, Cr, V, and Eu valence states and quantifying intrinsic oxygen fugacity (fO2) at those scales. The redox results are correlated with attenuated total reflection (ATR) H maps on the same beads. Results constrain chemical changes that may have taken place during curation and may reveal pre-, post-, and contemporaneous eruptive processes taking place in the lunar interior and during eruptions.
Understanding the Role of Solar Wind Irradiation in Lunar Space Weathering Through Analysis of Nanoscale Features in Permanently Shadowed Soils Using Scanning Transmission Electron Microscopy (Katherine Burgess, PI, United States Naval Research Laboratory)
A major outstanding question of space weathering on the Moon is how solar wind irradiation and micrometeoroid bombardment interact to create the physical and chemical changes characteristic of space weathered materials and whether both processes are necessary for formation of “typical” features, such as nanophase metallic iron inclusions. The new samples made available as part of the ANGSA Program, specifically the “frozen,” fully or partially shaded soil samples 72320 and 76240, allow these fundamental open questions about lunar space weathering to be addressed. The frozen samples provide an exciting opportunity to study the relationship between volatiles and other space weathering features in-situ.
These newly available samples allow two main objectives to be addressed. The first is to gain better understanding of how and when hydrogen or helium, the main components of the solar wind, are trapped in vesicles and how cold-storage has affected the ability to measure these volatiles. Cold storage has likely slowed the loss, if any, of volatiles from vesicles, and thus these samples can help elucidate the mechanisms of vesicle formation based on whether hydrogen or helium is still present and can help link vesicle formation to other space weathering processes. Additionally, comparative analysis of permanently shadowed, partially shaded, and fully exposed soil samples are being studied to better understand how solar wind affects space weathering features. This could, in turn, help to better understand the mechanisms of vesicle formation or other features associated with space weathering. This work could have implications for understanding the importance of long-term cold storage of planetary samples, as well as for interpreting albedo anomalies associated with reduction of Fe2+ by solar wind, such as lunar swirls.
Aberrations-corrected scanning transmission electron microscopy (STEM) with electron energy loss spectroscopy (EELS) and energy dispersive X-ray spectroscopy (EDS) are being used to analyze portions of individual soil grains from soil samples 72320 and 76240 as well as soils collected close by but beyond the shadows of boulders #2 and #4, respectively. STEM-EELS will analyze volatiles trapped in defects and vesicles in the frozen samples and the results compared to measurements of portions of each soil sample that was not frozen, as well as to the samples that were not shaded.
Thermoluminescence Studies on Frozen Apollo 17 Samples: Temperature Estimates of Shaded and Illuminated Lunar Surfaces (Alexander Sehlke, PI, NASA Ames Research Center/Bay Area Environmental Research Institute)
Thermoluminescence (TL) measurements offer unique insights into the thermal and radiation history of planetary surfaces, such as the Moon’s regolith. Previous TL measurements on Apollo samples provided initial estimates of temperature and radiation conditions but were limited due to assumptions in TL kinetic parameters. With the Apollo 17 samples stored for almost 50 years at room temperature and in a freezer, this project aims to refine TL kinetics, enabling more accurate temperature and radiation history estimates of the Moon. TL parameters in lunar samples are being quantified and refined by analyzing natural and induced TL glow curves. An improved understanding of lunar surface temperature distribution and histories is crucial for assessing volatile storage and retention, thereby supporting future in-situ resource utilization, science, and exploration efforts during the Artemis missions.
Investigation of Lunar Regolith Chemistry by X-ray Absorption and Emission Spectroscopy, and Electron Energy Loss Spectroscopy (PI Jeffrey Gillis-Davis and Includes the Following Institutions: Washington University St. Louis, University of Hawaii)
This group is examining the chemical speciation of major elements using X-ray absorption (XAS) and emission (XES) spectroscopy of bulk soils. To complement XAS and XES analyses, electron energy loss spectroscopy (EELS) is being conducted on individual particles using a transmission electron microscope (TEM). EELS similarly provides oxidation state and electronic structure but over far smaller sample volumes and with far better spatial resolution than XAS.
Oxygen K-edge (∼543 eV) and iron L3,2-edge (∼707 eV, 720 eV) XAS spectra are being collected using synchrotron radiation. The shallow penetration depth of the soft X-rays and the total electron yield detection mode provide surface sensitivity to the top ∼5 nm, where space weathering effects are most prominent. In particular, Fe L3,2-edge XAS yields insights about the Fe redox environment of both the specially and typically curated samples. O K-edge XAS is sensitive to hybridization with neighboring transition metal ions, such as Fe, confirming Fe oxidation state changes detected at the Fe L3,2-edge; simultaneously, in such soil-type of specimens, most of the O signal is associated with silica and silicates. XES probes the outermost occupied levels, such as the protonation state of bound species (i.e., X-OH, X-O). By comparison, EELS provides information about oxidation state and electronic structure of Fe and O over far-smaller sample volumes than XAS. For example, EELS mapping illustrates the presence of nanophase metallic iron (Fe0) and Fe2+ in the surrounding glassy matrix. Later in this paper (§6.4.4), synergistic insights into regolith maturity and curation style at different scales from these two analytical techniques (TEM and synchrotron) are discussed.
Team Structure and Rules of the Road
The nine teams that were selected to study the ANGSA samples were combined into a single science team tasked with working together in a manner analogous to the ground element of a sample return mission. This structure essentially constituted an Apollo-participating scientist activity decades after the samples were returned. The nine ANGSA teams included over fifty scientific participants, with some proposal teams having as few as two investigators. Each of the nine selected proposals had its own principal investigator (PI) and/or science principal investigator (Science-PI) and associated co-investigators (Co-Is) and/or collaborators. Additionally, curatorial personnel from the Astromaterials Acquisition and Curation Office at NASA JSC had significant involvement in the project. Meeting the scientific goals of the project required coordinated interaction among all these participants (e.g., data sharing, interactive and interdisciplinary data analysis and interpretation, joint publications). The overall goal of combining the teams into a single science team was to encourage opportunities for interdisciplinary results and discoveries and to maximize the impact of the results of the project. While encouraging these interactions, we also aimed to encourage individual creativity and initiative and find ways to allow all members of the project to benefit from the scientific successes of ANGSA.
To achieve these goals and to ensure that the creation of a single team would be done fairly, we developed an ANGSA Rules of the Road document to specify the principles and ground rules that underpin the project’s approach to managing the integrated scientific investigations of ANGSA. ANGSA leadership was organized under the Project Science Group (PSG), which consisted of all the original PIs and Science PIs from the nine selected proposals, to ensure that each team had a voice within ANGSA leadership. The PSG was co-chaired by the ANGSA project Co-leads (Charles Shearer and Francis McCubbin), the NASA Lunar Curator (Ryan Zeigler), and ANGSA program scientists from NASA Headquarters (Jeff Grossman and Sarah Noble). All Team members were listed under the Team roster at the start of ANGSA, and additional scientists were added to the PSG with the concurrence of the PSG co-chairs. The primary function of the PSG was to advise the project on optimization of science return and on resolution of issues involving science activities. For any PSG meeting or discussion, a PSG member sent an alternate in their place.
Each PI-led investigation comprised the PI and or Science-PI, Co-Is, and collaborators, and these groups were responsible for organizing themselves to optimize their activities. In the Rules of the Road document, however, the science team embraced a larger group than an individual PI-led group. This combination of teams recognized that achievement of the overall goals of ANGSA required integration of a wide range of geological, chemical, and physical observations and that the best chance of achieving these objectives would come from a single, interacting team rather than isolated entities. The Rules of the Road document defined the members of the ANGSA Science Team to include the PIs/Science-PIs, and Co-Is of each PI-led investigation; the ANGSA project co-leads; and the lunar curation personnel at NASA JSC. Collaborators were also a critical element to the ANGSA Science Team and, in many cases, were deeply involved in the scientific work of the project, but most ANGSA Science Team collaborators were specifically associated by name with a PSG member. The PSG member with whom the collaborator was associated was responsible for ensuring the collaborator’s understanding and accepting of these Rules of the Road.
One of the main components of the Rules of the Road document included guidelines for data sharing. Data archiving for the ANGSA project was governed by the individual data management plans within each of the funded ANGSA proposals. Within the ANGSA project as a rule, any ANGSA data or data products (including calibration data or contamination knowledge data) were made available to any ANGSA team member or collaborator. To engage the public, the ANGSA Science Team occasionally released subsets of new, particularly interesting, data or data products from each of the science investigations. Data not previously released to the public by NASA or the ANGSA Science Team and/or inferences or interpretations based on such data could only be released by science team members based on specific approval by the PSG or through a PSG-approved-process for release approval. PSG members had the primary responsibility for representing and coordinating their teams regarding such data releases. These approvals applied to web sites maintained by team members, collaborators, and their institutions, as well as any release of information to the internet (e.g., blogs). All images/videos generated from within the curation labs were made viewable by the public as rapidly as possible on a World Wide Web site hosted by JSC. The release of these images to the web was not delayed intentionally for any reason and did not require review or approval by the PSG. Other data were not released outside the science team until archived or until included as outreach products by the project. Interviews of ANGSA Science Team members by the news media were coordinated with home institutions. Each science team was permitted to release data from its own investigation to the press and discuss interpretations through their home institution’s media relations office, provided the releases and discussions were approved by the PSG.
The last important component of the ANGSA Rules of the Road document included guidelines on publications. Peer-reviewed publications of the results of the ANGSA science investigations are the primary means of reporting these results and their interpretations to the scientific community. Such publications constitute the primary basis for the professional recognition that scientists associated with the project will earn from their participation with ANGSA. Thus, clear guidelines for the preparation of journal articles and other professional communications were necessary, both to ensure effective communication of the results of the project and to ensure fair distribution of credit for these results and their interpretation. Given the large number of scientific participants, the integrated nature of most of the anticipated results (i.e., most publications involve team members and collaborators associated with multiple PI-led investigations), and the importance that most scientists attach to obtaining recognition for their work, the coordination and implementation of the publication plan was the responsibility of the PSG to ensure balance and coordination of the team and collaborators. Authorship for all publications was open to all team members and collaborators, according to the following conditions (1) any team member who asks to be an author of any paper and who makes a substantive contribution to that paper (i.e., to the writing and/or to the research reported in the paper) shall be an author; and (2) any collaborator who is invited by a team member to be an author on a paper and who makes a substantive contribution to that paper (i.e., to the writing and/or to the research reported in the paper) shall be an author. Final decisions on authorship, both the inclusion or exclusion of people from the author list and the order of authors, were made by the PSG as part of its coordination of the entire publication process. Care was taken to balance the issues discussed above. Given that the ANGSA effort was a large, integrated, team activity and many people ultimately made minor contributions to papers that did not constitute a substantive contribution to the work, the last author on all ANGSA manuscripts and abstracts was “The ANGSA Science Team”. This practice provided acknowledgment that this is a team effort and everyone on The ANGSA Science Team contributed in some way to each publication.
New Tools and Facilities for Processing, Preliminary Examination (PE), and Analysis
Many new processes, tools, and techniques were developed during ANGSA to assist with preliminary examination, sample processing. sample allocation, and some of the early science investigations. Here, we describe the development of those tools, techniques and processes to help future planning efforts for sample return missions. This section will focus on methodology, and the actual scientific results derived from these tools, techniques, and processes are meant to be presented in other publications.
Micro-X-ray Computed Tomography (XCT)
Introduction
The use of X-ray computed tomography (XCT) has proved invaluable both before and during the processing and preliminary examination of ANGSA samples 73001 and 73002. Whole-core scans of drive tubes 73001 and 73002 provide not only a permanent 3D profile of intact lunar soil, but they also informed sample processors of potential pitfalls (i.e., void spaces, fractures, and large/angular fragments) during extrusion and dissection and provided context for removed lithic clasts. Scans of the 73001 CSVC before and after gas extraction and prior to opening are: (1) useful for assessing the effectiveness and extent of the CSVC piercing tool; (2) critical for identifying hidden complications with the inner drive tube; (3) assessing core shortening during extrusion, and (4) used by Artemis tool engineers to examine the intact indium knife-edge sealing mechanism. Extracted particles > 4 mm are individually bagged and XCT scanned for classification and characterization without destructive chipping, sectioning, or dust removal.
73001 CSVC Top and Bottom Scans
Before piercing and gas extraction of the 73001 CSVC, an XCT scan of the bottom portion was collected to confirm the location and integrity of the Teflon cap attached to the inner Al drive tube and to measure the space between the bottom tip of the CSVC and Teflon cap (Fig. 7). This scan was collected at the Astromaterials X-ray Computed Tomography Laboratory at Johnson Space Center equipped with a Nikon XTH 320 system using the 225 kV multi-metal reflection target source at 215 kV, 179 mA, and a 38.49 m/voxel edge resolution. An identical scan was collected after the CSVC was pierced to examine the effectiveness of the piercing tool and determine if the Teflon cap, which holds in the lunar soil during the removal of the Al drive tube from the CSVC, was damaged during piercing. An additional engineering scan of the CSVC sealing mechanism at the top of the core was collected during this time. This final scan proved to be very important because it revealed that the inner Al drive tube had been overfilled, which prevented the device in the drive tube that immobilizes the regolith (the keeper) from being seated properly (Fig. 7). The sealing mechanism of the CSVC, which was the only thing holding the keeper, and thereby the lunar soil, in place, was intended to be removed before whole-core scanning at the University of Texas High-Resolution X-ray Computed Tomography (UTCT) Facility. However, with this new knowledge, the CSVC seal was kept intact for whole-core scanning. Zeigler et al. (2022a,b) provides a more detailed description of the 73001 CSVC top and bottom scans. These initial scans of the top and bottom of the CSVC played an integral part in the successful piercing, gas extraction, and whole-core scanning of 73001.
Fig. 7.

(a) XCT grayscale slice showing the top portion of 73001 still within the CSVC. The “keeper” (yellow box) is not properly seated in the inner Al drive tube and is only being held in place by the CSVC sealing mechanism. (b and c) XCT grayscale slice showing the bottom portion of 73001 still within the CSVC before (b) and after (c) piercing and gas extraction. Notice that the Teflon cap was not broken during piercing but was deformed, which shifted some of the overlying lunar soil. (d) Whole-core XCT grayscale slice of 73002 collected at UTCT. The “keeper” is properly seated in the narrower inner diameter of the Al drive tube. (e) Whole-core XCT grayscale slice of 73001 collected at UTCT
73001 and 73002 Whole-Core Scanning
Prior to opening and processing, Apollo drive tubes 73001 and 73002 were transported to the UTCT Facility for high-resolution scanning. Core 73002 was scanned in October 2019 (Zeigler et al. 2021) and 73001 in March 2022 (Zeigler et al. 2022b) under similar scanning conditions. Whole-core high-resolution scans at 12.9 m/voxel edge were achieved thanks to the unique instrumentation and data processing capabilities at UTCT (Fig. 7). They are equipped with a custom-designed instrument from North Star Imaging (NSI) and a 2048 × 2048 Perkin Elmer detector that can be moved a half-pixel vertically and horizontally to effectively double the detector size to 4096 × 4096 and reduce the reconstructed voxel size by a factor of two. The entire lengths of the cores were scanned as a series of overlapping volumes that were digitally stitched to create a continuous dataset for each one. Technical challenges were encountered, especially for 73001, that required significant specialized processing of the raw and reconstructed data. A detailed description of the instrumentation, data acquisition, and data processing for cores 73001 and 73002 is found in Ketcham et al. (2022). Examples of core XCT videos are presented in the online Supplemental component to this manuscript.
Individual Particle Scanning
After opening drive tubes 73001 and 73002, the samples were carefully extruded and then meticulously dissected. Any particle > 4 mm was weighed, imaged, and individually bagged with three layers of Teflon within a N2-purged glovebox (Gross et al. 2021). Each individually bagged particle was removed from the cabinet and XCT scanned at the Astromaterials X-ray Computed Tomography Lab using the 180 kV nano-focus transmission target source. Scanning conditions were optimized for the size and shape of each sample, but most were scanned at 90 kV and 3.0 W with voxel sizes ranging from 2.8 m to 20.6 m. To mount most samples for scanning, the triple bagging was wrapped around the sample into a cylinder and placed in a 1-cm diameter plastic straw. Great care was taken to not pop any of the Teflon bags. This sample mounting method proved to be successful except for the occasional sample movement during scanning caused by rebound from the relatively stiff bagging. In total, 132 particles were scanned from 73002 (Zeigler et al. 2022a) and 220 particles from 73001 (Zeigler et al. 2022b). These scans clearly show the lithology of each particle while keeping the particle in pristine condition (Fig. 8). Non-destructive identification of particle lithology using XCT is a powerful tool that yields information that is otherwise unobtainable through visible inspection because of the fine-grained dust coating on all particle exteriors. Examples of lithic fragment XCT videos are presented in the online Supplemental component to this manuscript.
Fig. 8.

Representative XCT slices of the different lithologies in 73002. All scale bars are 1 mm. (a) agglutinate; (b) regolith breccia; (c) impact melt; (d) ilmenite-lath impact melt breccia (vesicular); (e) very-low-titanium basalt; (f) poikilitic ilmenite impact melt breccia (granulitic texture); (g) high-Ti basalt; (h) high-Ti basalt
Non-contact Spectral and Spectral Imaging Measurements
Global spectral remote sensing data sensitive to lunar mineralogy, FeO, TiO2, and optical maturity are widely available, so spectral imaging and point spectroscopic measurements of 73001 and 73002 were obtained as part of the ANGSA Preliminary Examination process to enable direct linkages to the optical properties of the core samples to global data sets, as was done in the Apollo era (Pieters et al. 1980). The core cabinet glass is borosilicate, so spectral measurements using equipment external to the glovebox are limited to visible and near-infrared (0.4-2.5 m) wavelengths. This includes the wavelength region of many remote sensing data but does exclude thermal IR and UV measurements. Using existing components, a multispectral imager was built to measure the core using windows at 0.415 m, 0.57 m, 0.75 m, 0.9 m, 0.95 m, and 0.99 m. These wavelengths cover the characteristic one-micron absorption feature of lunar typical iron-bearing minerals like olivine and pyroxene, as well as overlap with Clementine UVVIS camera, the Lunar Reconnaissance Orbiter Camera Wide Angle Camera, and the KAGUYA Multiband Imager spectrometer. The imaging system contains an Orion StarShoot G3 deep space monochrome imaging camera, with a Newport Corp. six-position motorized filter wheel, six narrow band interference filters from Edmund Optics, and a halogen light source (Sun et al. 2021). The cores were scanned at a spatial resolution of 60 m. The camera and filter wheel were seated on a rack with height adjustments to allow the lens to be focused to the height change of the core during the dissection process. Lightweight components were used to avoid any damage to the glovebox.
The imaging system was placed on the glove box glass. Image frames of the whole core were acquired by pushing the imager forward along the core. To ensure a full image mosaic, at least 50% overlap was made between successive image frames. This process required the core lab to be darkened for the three hours needed to scan the cores (Fig. 9a).
Fig. 9.

(a) Collecting multi-spectral data on 73002 from outside the nitrogen glove box. Once the camera was cleaned, it was placed on the top surface of the glove box to collect images. (b) Multispectral images collected of the 73001 core that illustrate the reddening of the more mature portion of the core (Sun et al. 2022a,b). The Is/FeO values are from Morris et al. (2022). (c) Lucey et al. (2022) carried out an experiment following the end of dissection of 73001 by placing a Fourier Transform Infrared (FTIR) spectrometer into the nitrogen glove box and measuring water in the core
Multispectral imaging is a quick and convenient tool for preliminary examination of the degree of space weathering of the soils, compositional information (i.e., FeO, TiO2); this information can provide important guidance for sample dissection, allocation, and distributions. Detailed results can be found in Sun et al. (2021) and Sun et al. (2022a,b) (Fig. 9b). This technique is non-destructive and free of contamination of the pristine extra-terrestrial samples because it involves measurements that occur outside the glovebox.
In the future applications of this methodology, to expand the information yield of proximity remote sensing measurements in the preliminary examination of extra-terrestrial samples, we recommend:
1) Adding the capability to place cores and sample close to cabinet glass to enable higher resolution measurements. Our measurements were limited to tens of microns per pixel because the cores were situated about 20 cm away from the top of the glovebox. If the core were moved near the top of the glass wall, the core could be measured at a much higher spatial resolution, allowing spectra of independent regolith grains to be inspected.
2) Including standoff Raman spectroscopy and fluorescence to provide additional and independent measurements of mineralogy and detect concentrations of organic and fluorescent minerals.
3) Providing an infrared and UV transparent window to enable use of broader wavelength range spectroscopies. The spectral wavelengths from the current study are limited to only 0.4-2.5 m by the borosilicate glass wall of the pristine glovebox. If an infrared and UV transparent window could be mounted on the top of the glove box, camera could be applied in the preliminary examination of the core. This would allow more information on the mineralogy and volatile content (H2O/OH) of the samples to be obtained. This was partially achieved by Lucey et al. (2022) by inserting a Fourier Transform Infrared (FTIR) spectrometer into the nitrogen glove box after the dissection of 73001 (Fig. 9c). Multiple measurements from different cameras can also validate the results of each other.
CSVC Piercing Tool
Introduction
During the Apollo program, tools were developed to open samples and extract gases from the small, sealed containers used on the lunar surface. These opening tools focused upon the Gas Analysis Sampling Container (GASC; volume of 70cc), Special Environmental Sample Containers (SESC; volume of 300cc), Lunar Environment Sample Container (LESC; volume of 300cc), and the Apollo Lunar Sample Return Container (ALSRC) (Allton 1989). Images of the gas manifold and the Apollo Gas Team are illustrated in Fig. 10. A strategy for the analysis of gas from the CSVC (approximately 585cc) that was used during Apollo 16 and 17 was not developed because gas analyses were far more difficult at that time. Thus, it was the responsibility of the ANGSA science team to develop the modern versions of the necessary tools. Here we discuss first the piercing tool and then the gas extraction methodology. To extract the gaseous volatiles that may be present in CSVC 73001, the creation of a bespoke piercing tool was undertaken by the European Space Agency (ESA) as a contribution to the ANGSA program. The activity described here involves the design, build, and verification of the piercing tool, including preliminary experiments to evaluate the feasibility of the piercing approach, the design itself, the principle and results of the verification testing, and an initial overview of the product performance. As well as developing the capability to extract gas and enable novel analytical science, an important goal is to also collate the lessons learned from the development and operation of the piercing tool system and its interaction with the CSVC. Such lessons can help inform sampling, curation, and sample processing hardware for a new generation of exploration sample return missions, for the Artemis program.
Fig. 10.

(a) The F201 gas lab at Johnson Space Center in 1969. (b) Randy Wilkin conducting a gas sampling simulation through “operating” the valves of a gas manifold on top the F201. This manifold contained two RGA (residual gas analyzers – mass spectrometers), whose electronics were upstairs. A flexible probe connected to this went into the F201 and was used to probe the Apollo 11 Apollo Lunar Sample Return Container (ALSRC). The F201 also had a “port” whereby a small sample was sent to the chemistry lab on floor below for the gas reaction experiment, also run by the Gas Lab. (c) Gas Analysis Lab crew. Images provided by Judy Allton and additional comments were made by Don Bogard (middle of image c)
The starting point for developing a piercing tool to facilitate the extraction of the headgas from CSVC 73001 is inspired by a piercing operation previously conducted on Apollo 12 sample 12024 (Allton 1989). Additional details on the heritage and inspiration for the ANGSA piercing tool are provided in the supplementary information.
Design Drivers and Requirements
A new bespoke piercing tool was required to interface CSVC 73001 with a purpose built ultra-high vacuum (UHV) gas extraction and collection manifold, the latter of which was designed and built by Washington University St Louis (Sect. 6.4). The main objective was to extract any constituent head gas from CSVC 73001 in a controlled and contaminant-free way. The first stage for the piercing tool design was to investigate if the GASC piercing tool approach from the Apollo 12 sample 12024 could be scaled-up and applied to the much larger CSVC and its constituent components. Furthermore, strict science and curation requirements were identified that also had to be satisfied by the design. These requirements were derived from extensive consultation with the ANGSA science team, including the Apollo sample curation team. These design-driving requirements and associated challenges are summarized here.
Sample Preservation:
The piercing tool shall always guarantee the integrity of the gas and solid sample contained within the CSVC. Specifically, the piercing head shall not disturb or shed material into the soil sample. The CSVC and the sample shall be exposed only to dry nitrogen or Ultra-High Vacuum (UHV) environments and be constructed of curation-approved materials. The design shall avoid ‘trap sites’ that could potentially induce isotopic fractionation.
Piercing Performance:
The piercing tool shall be able to produce an opening large enough (>5 mm2) to allow free passage of gas from the CSVC without risking inducing isotopic fractionation.
Precision Piercing:
The tool shall pierce the stainless-steel base of the CSVC but not pierce the PTFE cap of the drive tube within that is retaining the regolith. Inspection of an Apollo 16 flight spare drive tube and PTFE cap suggested that the cap contains small (∼1 to 2 mm diameter) perforations through which the gas can still pass.
Manual Operation:
The system shall allow the piercing operation to be controlled manually and allow it to be paused, resumed, and retracted at any time.
UHV
: The piercing tool shall be capable of attaining and operating under UHV pressures (ca. ×10−9 mbar) and across a pressure gradient anywhere between UHV and 1 atmosphere. Noting that the current pressure of the CSVC is unknown and cannot be assumed to be the same as at the time of closure.
Cleanliness
: The piercing tool shall satisfy the material requirements of the Apollo sample curation facility (LOP 54) and have sufficient surface finish/polish and cleanliness to limit contamination, potential trap sites for gases and to maintain UHV pressures.
Handling:
The piercing tool shall be of dimensions and mass suitable for operator handling and assembling in the confines of a nitrogen glovebox when integrating CSVC 73001.
Developing the Design
To ensure the piercing principle used for the GASC could be transposed and scaled for the CSVC, a preliminary study was conducted. Direct inspection of the CSVC was not possible due to the curation constraints of the stainless-steel outer vacuum container (OVC). The assessment was made using the original manufacturing drawings and photographs of the CSVC/drive tube assembly (NASA JSC 1971; Allton 1989). It was determined that, depending on the behavior and positioning of the spider, the PTFE cap of the constituent drive tube could be in direct contact with the base wall of the CSVC that is to be pierced, or there may be a gap of up to 3.3 mm between the two surfaces. The design, therefore, had to account for this possible range. Furthermore, some external dimensions such as the CSVC assembly total length, including the cap, could only be estimated, requiring flexibility to be incorporated into the piercing tool design while still delivering precision piercing.
Piercing Tip and Required Force:
To derive the piercing force required and to assess piercing feasibility and optimal piercing tip geometry, trials were conducted using a vertical press setup (Fig. 11) at ESA ESTEC. Stainless-steel and PTFE sheets, replicating the CSVC base and the drive tube cap respectively, were pierced with a variety of H900 heat-treated 17-4 PH stainless-steel tips. The required force when piercing stainless steel sheets was measured for a variety of tip shapes and tip diameters (Fig. 11). With the lowest piercing force of ∼900 N, a 3.175 mm diameter 45° slanted tip was selected as the best tip geometry. Additional tests with this tip showed that piercing of stainless steel and PTFE sheets occurs at a deformation of ∼3 and 6 mm respectively. Furthermore, repeated piercing of stainless-steel showed an increase of 11% in the required force after six iterations, due to blunting effects of the tip. Overall, it was concluded that piercing of the CSVC with such a stainless-steel tip was feasible within the piercing force capability of manually operated feedthrough mechanisms available as COTS items.
Fig. 11.

Vertical press configuration for deriving the required piercing force and piercing tip geometry
A potential concern of the 45° slanted tip was identified. It imparts radial forces on the feedthrough during the vertical press experiments, estimated in the 10-20 N range by indirect measurements. Although this falls within the 100 N rating of the feedthrough during the free-standing vertical press experiments, it was decided to not assume direct translation in the context of the complete piercing tool system with delicate joints. Therefore, a 60° pyramidal tip geometry that produces negligible radial loads, albeit at the cost of an increase in the required piercing force, was considered as a backup. Final tip selection and calibration were informed and conducted during the verification of the manufactured tool (see Supplementary Information).
Complete Piercing Tool System:
Utilizing the heritage and literature review and informed by the initial vertical press experiments, a design for the piercing tool was proposed. An iterative approach was used to incrementally refine both the design and the operating procedure of the system, in continued consultation with the ANGSA science team, including the Apollo sample curation team. During the advanced stages, a functional prototype of the system using a combination of machined, and 3D printed parts was built to verify the operating principle of the tool and identify where any design modifications may be required. The final design of the implemented system (Fig. 12, 13) is described here.
Fig. 12.

CAD view of complete piercing tool design. The design was manufactured and executed at ESA ESTEC including production of bespoke machined components integrated with COTS items
Fig. 13.

Assembly and operation of the executed piercing tool design starting with insertion of a mock-CSVC. (a) CSVC inserted into sample holder. (b) Sample holder with CSVC slide into the piercing tool. (c) preload spring is inserted into piercing tool to add tension to sample holder and cap. (d) Sample cap with piercing mechanism placed onto piercing tool and bolted into place. (e)Piercing mechanism manipulated to piercing bottom wall of the CSVC. Video of piercing tool assembly and operation shown in Supplement
The main body of the device is a vacuum chamber sized to contain the CSVC. The chamber is fitted with an angled vacuum valve to isolate the system, and a bellows-based feedthrough to transmit the piercing motion (Fig. 12 and 13d). A ring-shaped end stop is welded on the inside of the vacuum chamber, against which the lid of the CSVC can rest. This allows accurate positioning in the axial direction and a secure transfer of force between the CSVC and the vacuum chamber. The CSVC itself is surrounded by a cage-like radial holder (Fig. 12, 13a,b), which is a welded assembly of two perforated tube sections and two holder rings. The holder centers the CSVC within the chamber and forms a protective shell around it during operations, while still allowing sufficient gas circulation. The ring holding the bottom end of the CSVC also acts as an end stop for the piercing tip. This sets a fixed minimum distance between the piercing head and the CSVC bottom surface, regardless of the CSVC actual length, allowing a calibrated maximal piercing depth. A preload spring ensures proper axial positioning of the holder-CSVC-end stop stack (Fig. 12 and 13c).
The piercing head is a hardened (via heat treatment) stainless-steel component with a 3.18 mm diameter piercing tip, ended with a sharp 45° point, constrained from the preliminary tests, and further optimized during the piercing tool verification stage (Sect. 6.3.4). Such optimization and tool design ensures that the tip length is calibrated to provide a 4.9 mm maximal piercing depth once in contact with the CSVC holder (i.e., within the maximum deflection distance experimentally determined for the PTFE cap). The piercing head is mounted on a linear vacuum feedthrough that is integrated into a flanged seal end of the vacuum chamber (Fig. 12, 13d). This allows the axial piercing motion to be transmitted from manual operation on the outside of the tool to the internal vacuum chamber with virtually no atmosphere leakage. All interior, vacuum-sensitive surfaces are electropolished (Ra, ∼0.8 to 1.6 m). Dry lubricants were used for interfacing screws.
The vacuum chamber is positioned in a custom actuation system frame and securely clamped in place. A slider is connected to the feedthrough and can be accurately positioned using a screw. The motion can be controlled manually using a torque wrench on the screw, and it can be paused, resumed, or reversed at any time (Fig. 12, 13e). Two lateral rods guide the slider, ensuring that the motion is purely axial and that no torque or lateral force is applied to the feedthrough. Assembly steps starting with introducing the CSVC through to operation with a torque wrench of the fully assembled system is shown in Fig. 13.
Piercing Tool Verification
A series of verification tests and assessments were conducted on the final manufactured piercing tool in accordance with a set of parameterized verification control indicators that had been derived from the science and curation requirements. The verification tests were conducted in two stages.
The first stage of mechanical testing under ambient conditions was conducted at the Materials and Electric Components Laboratory at ESA ESTEC with the aim to a) test the performance and calibrate the optimal piercing tip length of the primary (45° asymmetrical) and backup (60° pyramidal) piercing head tip design dimensions, b) calibrate and demonstrate repeatable and effective piercing of analogue CSVC stainless steel bases in producing a clean ample sized hole (i.e., ≥5 mm2), c) repeatedly demonstrate that the chance of piecing the PTFE cap of the sample drive tube within the CSVC is minimized by the piercing tool design, and d) assess for any shedding or detachment of materials during the piercing.
The second stage of testing (informed by the first stage) was then conducted under vacuum conditions to a) test the piercing tool system, joints, and seals for atmospheric leaks before, during and after the piercing operation, b) demonstrate mechanical operability and repeatable and efficient performance of the piercing tool under the expected conditions of the actual piercing event, and c) generally refine the piercing tool assembly and operational protocols, including constraining user parameters and recording key feedback indicators during operation.
Two vacuum condition scenarios were used for the second stage of verification testing, regarding the currently unknown pressure within CSVC 73001. In scenario one tests, UHV conditions were equilibrated between the inside of the mock CSVC/drive tube assembly and the piercing tool vacuum chamber housing (i.e., a scenario where the CSVC has not leaked or has experienced minimal leaking). For the scenario two piercing tool verification tests, residual atmosphere was attempted to be retained within the mock CSVC/drive tube assembly to simulate a pressure gradient between the CSVC/drive tube assembly and the UHV conditions of the piercing tool vacuum chamber housing (i.e., a situation where the CSVC has experienced significant leaking).
The detailed results of the verification testing components and methods, the verification phase outcomes, and the details on how the piercing tool was cleaned are in the Supplementary information.
Piercing Tool Performance
X-ray Computed Tomography (XCT) analysis was conducted at JSC of the base of the real CSVC after it was extracted from the OVC during the actual gas extraction event. The rendered XCT images showed that the most challenging scenario of the PTFE cap of the constituent sample drive tube was in direct contact with the CSVC base. The piercing tool design and verification phase of the tool had accounted for this scenario.
The CSVC was then integrated into the piercing tool within a dry nitrogen cabinet, where the cleaned and baked tool had been installed at JSC after being transported from Europe. It was noted that the actual CSVC diameter was at the smaller end of the machine tolerance, compared with the upper tolerance used for the mock CSVC utilized during the tool verification phase. The radial holder and spring element of the piercing tool chamber were successfully able to account for this difference. Once the CSVC and constituent sample were securely sealed within the piercing tool, the sample-piercing tool system was removed from the glovebox and interfaced with the gas extraction manifold in preparation of the CSVC piercing event (Fig. 14). Pressures and RGA spectra were monitored throughout the extraction process, as well as intermittent helium leak testing to monitor for any atmospheric leaks. The extraction event is otherwise described in Sect. 7.2.3.
Fig. 14.
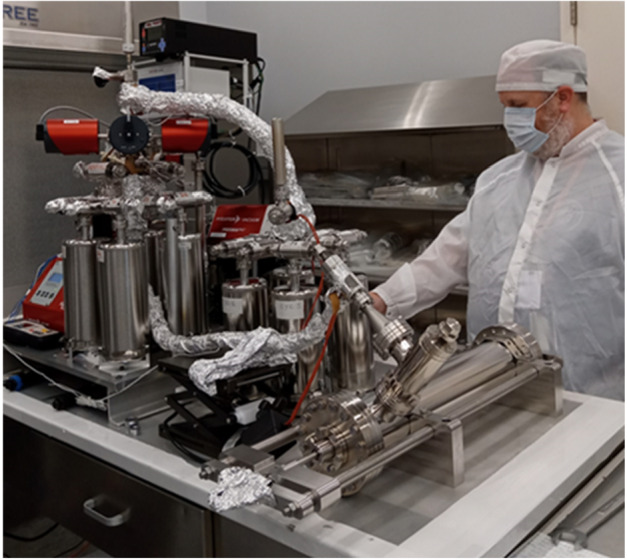
Piercing tool integrated with the gas extraction manifold
First observations of XCT and optical images of the pierced CSVC base (Fig. 7c and 15) indicate a high level of tool performance in terms of having cleanly operated under UHV conditions, not having pierced the PTFE cap, producing an adequate size of hole in the CSVC base, and having retained the piercing tab, thereby reducing potential contamination to the solid and gas sample. This meets many of the original requirements. The full performance of the piercing tool and CSVC is still to be fully assessed through materials analyses of the CSVC base and post-piercing investigation of the piercing tool mechanism and tip. Further cross-referencing with the scientific gas analysis results will also provide additional information and lessons learned on overall performance.
Fig. 15.

Pierced base of CSVC 73001
A videos of the piercing tool operation and more specific information concerning testing and performance of the piercing tool are presented in the online Supplemental component to this manuscript.
GEM (Gas Extraction Manifold)
One of the primary science goals for Apollo 17 was to target samples that may have trapped gases released from the Lee-Lincoln fault (Bland et al. 1972). The specially curated sample 73001, sealed under vacuum in a Core Sample Vacuum Container (CSVC), which samples down to approximately 70 cm below the surface, presented a prime opportunity to investigate for such gases (Keihm and Langseth 1973; Allton 1989).
Sample 73001 is the deep portion (>22 cm depth below the surface) of a double drive tube core of the lunar regolith that was collected in an aluminum drive tube, secured with Teflon caps and sealed in a stainless steel core sample vacuum container (CSVC) by means of a stainless steel knife edge acting on an indium alloy sealing surface on the CSVC lid (Allton 1989) at low temperature (potentially ∼250 K; Keihm and Langseth 1973) on the lunar surface upon collection. Upon return to Earth, the CSVC was placed into an N2-purged curation glovebox. Visual inspection within the glove box indicated that the CSVC appeared to have been sealed properly. The CSVC was placed into a larger, more robust stainless steel Outer Vacuum Container (OVC), and the OVC was then pumped down to ∼5 × 10⁻² torr (Butler 1973a,b) and sealed off by means of a bellow valve. Sample 73001 has remained in a N2-purged curation glove box from the time it was sealed until its current use within the ANGSA program.
The core sample comprises both a solid component (including regolith and clasts) and the head space gas. The sealed core sample presents two important opportunities to study lunar volatiles. First, the regolith may have retained loosely-bound or cold-trapped volatiles that would have been lost from other Apollo samples upon return or during curation; these will form the head space gas in a sealed core at room temperature. Second, if the core has remained sealed, then the solid portion of 73001 was protected from contamination from spacecraft cabin gases and Earth’s atmosphere and represents the most pristine lunar samples for analysis of volatiles, including H, C, N, and noble gases.
The pressure and composition of the gas in the OVC must be characterized to determine the fidelity of the secondary container seal to atmosphere and the indium alloy seal on the CSVC over nearly 50 years’ time, and to thus better interpret the nature of the CVSC head space gas. There are three potential cases. (a) In the ideal case, the secondary container pressure would be still near ∼5 × 10⁻² torr, and no leaks across either seal would be suspected; (b) the pressure is greater than ∼5 × 10⁻² torr, in which case cabinet gas has likely leaked into the secondary container and may also have leaked across the indium seal into the CSVC; and (c) the pressure is lower than ∼5 × 10⁻² torr, indicating that the indium seal leaked and the secondary container gas may have leaked into or equilibrated with the CSVC head space gas over the decades; in this scenario, the secondary container seal to the outside likely held its seal. In cases (b) and (c), the solid component of 73001 may not have been fully protected from terrestrial atmospheric contamination in transit to curation, so characterizing the composition of the head space gas to understand the nature of the contaminant is critical. In case (a), the head space gas may contain pristine lunar volatiles and the solid samples were likely well-protected.
To enable extraction, preliminary characterization, storage, and distribution of the 73001 OVC gas and CSVC head gas, a piercing tool (Sect. 6.3; Schild et al. 2021) was coupled with a custom-built gas extraction manifold (GEM).
Design and Construction of the GEM
The GEM was designed and constructed in parallel with the JAXA GAEA (GAs Extraction and Analyses system) built for distribution and storage of gas accumulated in the Hayabusa2 sample container (Miura et al. 2022). Similar to the GAEA, the GEM consists of high vacuum pumping station, quadrupole mass-analyzer, gas distribution manifold and a series of gas sample bottles to store head gas. However, GEM is more portable, compatible with the clean room environment and does not contain components that could affect the gas composition. All vacuum parts are machined without using cooling fluids except for pure acetone and DI-water. Only Cu-OF is used in vacuum seals, and no elastomers are used. A compact desktop arrangement was designed and built to keep a small internal volume and low blanks.
Sample Bottles
: Eight 2 L internally electropolished stainless steel (SS304) cylinders were used as sample tanks (four cylinders are shown in Fig. 16; the apparatus was expanded to eight after initial design stage). Each cylinder is fitted with two bakeable all-metal ultra-high vacuum (UHV) angle valves (AMV series, NorCal). The double valve assembly forms a “pipette” for drawing aliquots from filled tanks for distribution to laboratories for analysis. Bottles and associated volumes were baked and pumped to achieve UHV pressures (10−9 torr) prior to transfer to Johnson Space Center.
Fig. 16.

(a) CAD diagram illustrating pumping station and quadrupole mass spectrometer. The pumping station includes a turbo pump with integrated rough pump (red and black at left), ion pump (blue), and ion gauge. The quadrupole mass spectrometer (maroon at right) can be isolated from the pumping components. Bellows attach the green and yellow flanges to their respective valves on the tank assembly. (b) CAD diagram illustrating tank assembly with valves to quadrupole volume (yellow), pumping station (green), and piercing tool (cyan valve at front. (c and d) Gas extraction manifold assembled
Pumps and Vacuum System
: To achieve ulta-high vacuum, the assembly was first evacuated by means of a turbomolecular pump (HiCube 80 Eco from Pfeiffer Vacuum Inc) equipped with integrated backing pump, then with an ion pump (Titan 25S, Gamma Vacuum) (Fig. 16, 17). An all-range gauge (Pfeifer MPT 200) was used to monitor pressure in the pumping line. The manifold pressure was measured by three high precision capacitance manometers (CMR371, 373, 375, Pfeiffer Vacuum) with overlapping ranges (from 1000 hPa to 0.1 hPa. Stainless-steel vacuum hardware with high conductance (all outer diameters > 3/4”, seamless internally electropolished SS304 pipes with 0.065” wall thickness) was used to ensure gases were not fractionated during extraction or distribution of the core head space gas. Vacuum lines were baked at 250 °C along with the sample tanks.
Fig. 17.

ANGSA gas extraction manifold in operation. (a) Design and construction team at WUStL. (b and c) Gas extraction manifold in operation at the JSC. (d) Juliane Gross and Olga Pravdivtseva attaching the outer vacuum container (OVC) to the gas extraction manifold
Quadrupole Mass Spectrometer:
The GEM is equipped with a 100 amu quadrupole residual gas analyzer (PrismaPro, Pfeiffer Vacuum). This mass spectrometer was used to monitor system blanks, and to provide a preliminary characterization of residual OVC and CSVC gas after storage bottles were sealed. The analyzer operates in dynamic mode; it is constantly connected to the pumping system via a variable conductance valve, while the analyzed gas is admitted through the capillary inlet line (36” long 0.005”ID, SS316). This arrangement facilitates the analysis of mass spectra in a wide range of pressures.
GEM System Cleaning
The GEM, with an initial set of four sample bottles was assembled, baked, and tested at Washington University, then transferred to Johnson Space Center. There, the system was evacuated, baked, and tested again in concert with the piercing tool (Sect. 6.3) using the GEM quadrupole mass-analyzer as a helium leak detector. Four additional sample bottles for secondary gas extraction were prepared using the same UHV cleaning protocol as the first four bottles. Once the bottles were leak-tested, they were sealed off and the GEM was attached to the OVC bellow valve. After high vacuum pressures were reached, OVC gas extraction was performed.
ANGSA Cold Sample Processing: Facility Design and Operations
Facility Design and Hardware Description
The ANGSA Cold Sample Processing Facility was designed to facilitate the science goals of the ANGSA Program while minimizing potential hazards to curation personnel. The Facility was designed for ANGSA but provided invaluable experience for the design and build of future facilities for cold curation (Mitchell et al. 2020). The design of this facility maximized the use of existing facilities and equipment at the Johnson Space Center (JSC) while meeting the cleanliness and temperature requirements of the Apollo samples. This section describes the overall facility design and layout, major equipment and hardware used, and general principles regarding freezer operations including safety and sample transfer.
The Cold Sample Processing Facility consists of a −20 °C walk-in freezer (Fig. 18) located in the JSC Experimental Impact Laboratory (EIL). An anteroom was added to the front of the walk-in freezer to facilitate clean gowning and sample transfer. Outside of the anteroom, a space is provided for sample processors to don and remove cold gear. Curation-grade nitrogen gas (GN2) was plumbed into the freezer through penetrations in the freezer front wall. The nitrogen-purged sample processing glovebox was configured for sample ingress, processing, and egress inside the freezer.
Fig. 18.

(a) The Anteroom of the Cold Sample Processing Facility freezer entry door shown. (b) Freezer interior, with retrofitted Apollo glovebox on the right
The −20 °C walk-in freezer was installed in the 1990s and was originally used to prepare cold samples for planetary impact experiments. The freezer is located on a second-floor mezzanine in the EIL and has an internal area of 1.9 × 2.8 m with an internal height of 2.2 m. Initial reconfiguration of the freezer for Apollo sample processing included repairs by JSC technicians to the freezer insulation, door, and pressure-equalization vent to mitigate condensation in and around the freezer. A pass-through was installed at the front of the freezer to allow GN2 to flow into and out of the sample processing glovebox and its antechamber. The freezer door was modified to have a window through which sample processing could be observed. A cold-tolerant oxygen monitor was installed inside the freezer (PureAire Monitoring Systems) with a connection to an audible alarm in the event of significant oxygen displacement/nitrogen buildup in the freezer internal volume. A smoke detection system and manual push-button alarm were also installed in the freezer for safety purposes. Freezer power, including power for the lights and safety equipment, was controlled by an on-off switch on the freezer exterior. Stainless-steel, O2-cleaned gas lines were installed between the facility GN2 system and the pass-through inlet lines, allowing curation-grade gas to be provided to the glovebox continuously during processing operations. A three-way valve was installed to allow alternate sources of gas (K-bottles) to be used as needed before the facility modifications were complete. Despite the extremely low water content in curation-grade GN2, a desiccator (Pall Corp Gaskleen Purifier) was included to mitigate ice formation in the inlet GN2 line. The outlet GN2 was vented to the building exterior through stainless-steel, O2-cleaned gas lines via a preexisting wall penetration in the EIL.
An Apollo-original, stainless-steel wire-saw glovebox was used for ANGSA cold sample processing due to its known materials compatibility and ability to fit through the walk-in freezer’s front door. As with the freezer, the glovebox required extensive modification prior to use. The glovebox’s top-facing window was replaced to allow processors a clear view of the samples during processing operations and to facilitate vertical photography/video. Due to significant warping and subsequent gas leakage, the glovebox’s antechamber door was also replaced. The Viton seals used to mitigate gas leakage from room-temperature Apollo gloveboxes are not cold-compatible; they become brittle and leak significantly at −20 °C. The wire-saw glovebox’s Viton seals were therefore replaced with cold-compatible Teflon gasket tape (Gore Expanded PTFE). Additionally, the Apollo-original Deutsch connector on the back wall of the glovebox was rewired to ensure an adequate and safe power supply to the sample weigh scale.
Because the glovebox had previously been on display outside of the Apollo Curation Facility, it required deep cleaning, a process that had not been necessary or implemented for several decades. The deep cleaning was conducted in the Astromaterials Curation Pre-Cleaning Facility and included an initial degreasing process using 3% hydrogen peroxide, isopropyl alcohol, and nitric acid. The degreasing was followed with an isopropanol spray and particle count using ultrapure water to ensure particulate cleanliness. The glovebox was then wiped with 7.5% hydrogen peroxide and allowed to dry completely. Finally, the glovebox was rinsed thoroughly with ultrapure water and leak-checked to ensure the integrity of the glovebox seals (Amick et al. 2021). These leak checks included a pressure-versus-time test and/or an oxygen monitor to ensure that the Teflon gaskets provided a sufficient seal for processing operations. Similar to Viton, the neoprene gloves used for room-temperature Apollo sample processing become highly brittle at −20 °C and could not be used; Hypalon gloves were also evaluated and found to be too brittle for use at −20 °C. Polyurethane gloves (Piercan USA, Inc. Polyurethane Dry Box Glove), recommended by Herd et al. (2016), were used because of their ability to remain pliable in the cold. Due to the extreme scarcity of commercially sold polyurethane gloves, they were installed at the very end of the glovebox retrofit and cleaning process to minimize the risk of damage throughout the retrofit and installation process.
After cleaning, the glovebox was purged with GN2 and wrapped in one layer of clean Nylon (inner) and two layers of polyethylene (outer layers) prior to transport to the freezer. The inlet and outlet glovebox gas lines were wrapped separately to provide flexibility for configuration and connection to the facility gas lines inside the freezer. The glovebox was lifted to the EIL mezzanine by JSC rigger personnel using lifting straps and a crane (Fig. 19). The glovebox was installed with the antechamber pointing towards the front of the freezer (Fig. 18b), and with enough clearance to open and close the antechamber door. Multiple check valves with Teflon seals were included in the glovebox and antechamber outlet gas lines to provide relief in the event of an overpressure inside the glovebox.
Fig. 19.

Glovebox being lifted to the EIL mezzanine; sample processing freezer is visible on the mezzanine level at the upper left
A custom gowning room/anteroom (CleanAir Solutions, Inc.) was installed at the entrance to the walk-in freezer. The anteroom footprint is 2.0 × 2.0 m and its height wis 2.4 m, providing sufficient clearance to fully and securely encompass the freezer door. The anteroom incorporates an HEPA filtration system to minimize particulate contamination in its internal volume. Particulate contamination is also minimized using sticky mats at the entrance to the anteroom, along with clean-room booties and bouffants. Prior to sample processing, silicon wafers (Balazs) were deployed inside the anteroom and freezer for verification that facility particulate requirements were met. Furthermore, Al-foil witness plates were deployed inside the glovebox and allocated with samples to the sample PI’s. Fresh clean room garments are housed on a shelf inside the anteroom, along with cleanroom gloves, a heat-sealer, the oxygen monitor inventory, and other miscellaneous clean processing items (e.g., scissors, Teflon bags, etc.) as shown in Fig. 18a. A small stool is also provided to aid in donning and doffing clean garments. External to the anteroom, a space is provided for donning and doffing cold processing gear. Coveralls, parkas, and gloves rated for −29 °C (Refrigiwear Insulated Softshell Bib Overalls and Parkas) are provided for Apollo curation staff. Staff members use their own underlayers, footwear and hats.
The Apollo-17 weigh scale (Sartorius) was used to measure sample weights during processing and subsampling. To ensure accurate measurements of sample weights during processing, the scale was calibrated at −20 °C using wall power and a cleaned −20 °C storage freezer. The scale was cold-soaked for two hours prior to calibration. Stainless-steel Apollo facility calibration weights were used. Based on the calibration results, the scale was deemed ready for cold processing operations.
Efficacy of Vacuum Transfer for the Preservation of Grain Surface Composition and Chemistry
Introduction
Transport and storage in vacuum are critical for the preservation of lunar sample surfaces. At atmospheric pressure (760 Torr), the number density of atoms impacting a surface is ∼1019 atoms cm−2. Even with the excellent O2 and H2O filtration (∼1 ppm) within the JSC N2-purged curation cabinets and in standard sample transfer containers, 1013 O2 cm−3 remains to impact the sample surface. This implies that a monolayer of oxidation can form on the surfaces of returned materials in ∼2 ms assuming an average sticking coefficient of 0.5 (Dorfeld et al. 1976; Winkler et al. 1983). The presence of atmospheric O2/H2O can change grain rim surface characteristics, oxidizing submicron Fe0, nFe0, and metal sulfides. H2O may additionally deplete volatiles in the near-surface layer of solar-wind impacted materials and lunar glass (Malkovsky et al. 2020; Dukes and Baragiola 2011; Fearn et al. 2006; Dukes et al. 1999; Lanford et al. 1979).
On the other hand, in an ultrahigh vacuum (UHV) pressure of 10−10 Torr, where residual H2O, CO2, CO, and H2 desorbing from the walls of the vacuum vessel comprise the background gas, an oxidation monolayer takes >24 hours to develop. Even at high-vacuum, with pressures near 10−7 Torr, it is predominantly these desorbing gases that deposit on a sample surface. Water vapor dominates these species in both high vacuum (HV) and UHV, typically making up ∼80% of background molecules, with a reduced reactivity to iron of ∼25-50% relative to O2 (Maschhoff and Armstrong 1991; Roberts and Wood 1977). Passivation by H2O under vacuum appears to limit the oxidation layer thickness, creating an oxide/hydroxide layer 5 to 20 Å thick on the surface of most materials due to the dissociation of adsorbed H2O (Maschhoff and Armstrong 1991; Roberts and Wood 1977).
To best preserve the indigenous state of the outermost ∼15 nm of a returned lunar grain—the layer most effected by space weathering processes such as solar wind ion irradiation or meteoritic impact vapor redeposition (Cantando et al. 2008; Chaves et al. 2023)—it is important that samples for surface analysis (e.g., SIMS, XPS, NEXAFS, XAS, PEEM, AES) are transported under vacuum if at all possible. While UHV pressures are optimal, even HV reduces oxidation and hydration much more effectively than inert N2. Thus, we redesigned a commercial HV transfer vessel to minimize O2 and H2O exposure during transport from JSC to the University of Virginia (UVa) to maintain the lunar grain surface composition as close to pristine as possible prior to XPS analysis.
VTV Design and Operation
The PHI Model 04-111 Vacuum Transfer Vessel (VTV) is a standard commercial device for conveyance of oxygen sensitive samples between surface analytical systems (e.g., TOF-SIMS to XPS or AES) or from under an inert gas hood directly to an analysis chamber (Fig. 20a) (Vogel et al. 2015; Physical Electronics Inc. 2023). This device couples to the introduction chamber on a Versaprobe III XPS, precluding sample exposure to atmosphere, and can be adapted to other UHV chambers or analytical instruments. The VTV can retain an “inert” environment (e.g., N2 or Ar) or reach a base pressure < 10−7 Torr with an active pumping system (Fig. 20b).
Fig. 20.

(a) A vacuum transfer vessel (VTV) was designed to transport lunar grains with minimal interaction with Earth’s atmosphere. This vessel couples directly to a PHI Versaprobe III XPS microprobe but can be modified to mount on other instrumentation or vacuum chambers. (b) Samples, mounted on special 25 mm platens, are loaded into the VTV chamber under the lunar N2-hood, before removal from the pristine lunar vault. A coupling flange is added to the bottom of the VTV to facilitate pumping. The ion pump is then roughed through V3, and the inert gas is pumped away through V1 with the VTV sample chamber open until high vacuum can be maintained exclusively with the Ion/NEG pump
Due to COVID restrictions at the onset of the ANGSA sample analysis campaign, which prevented in-person sample collection from JSC, the VTV was not implemented for 73002 core sample transport. Instead, lunar materials were sent to UVa in Al sample vials, double-sealed in N2-purged Teflon bags. This methodology was continued for 73001 to provide consistent, comparative data through both sections of the drive tube. However, our expectation is that the VTV, developed for the ANGSA project, will be utilized for future transport of extraterrestrial materials returned by NASA’s OSIRIS-REx and Artemis missions.
The plan for transport via the VTV requires that the lunar grains are placed into small (∼100 m dia.) indentations on an XPS sample platen inside the N2 processing cabinet at JSC’s Lunar Pristine Sample Laboratory and then fixed in place with a stainless steel (SS 304) 50-m mesh. The platen is then drawn up into the body of the VTV and sealed inside prior to transferring the device to another location within the curation laboratory suite where pumping is allowed. The VTV sample compartment is sealed by means of a Viton O-ring (V1) that becomes compressed when the sample is fully drawn up into the VTV body (Fig. 20a). Moreover, a metal-seal shutoff valve (1.33” CF), V2, that complies with the JSC’s Lunar Sample Hood regulations, attached to the VTV pumping port, is required to fully seal the VTV prior to its removal from the hood and to facilitate subsequent pumping. A custom stainless steel (SS 304) adapter is also required to couple the VTV to a 2.75” ConFlat (CF) flange on a standard turbo-molecular dry-pumping system.
The standard VTV is primarily composed of stainless steel 304 and 316, materials appropriate for use in the JSC Lunar curation cabinets. However, several sub-components of the VTV design had to be modified by PHI for use in this capacity. The parts that were altered from the standard design include: the 1.33” CF Cu gasket, Loctite 243 thread locking adhesive, Rulon J seals, the aluminum 5056 translator knob, aluminum-bronze threaded rod, and two SS 303 screws. Materials changes are shown in Fig. 21, along with the eventual substitutions or solutions.
Fig. 21.
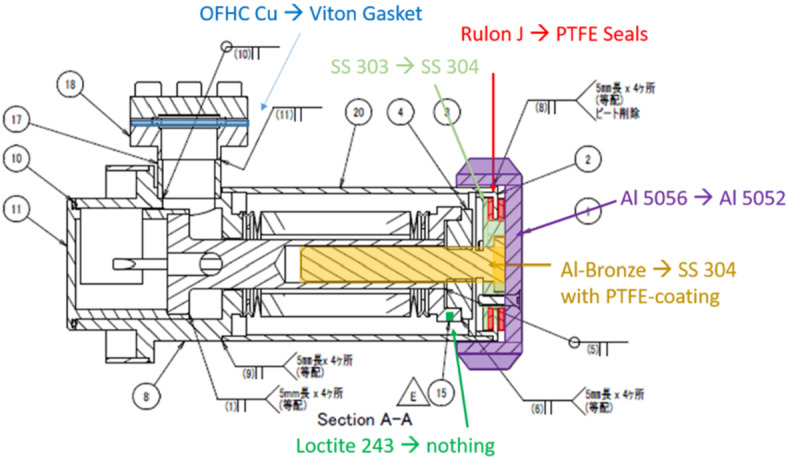
Schematic of the VTV with components that currently do not meet the JSC lunar cabinet materials requirements highlighted in color. Changing the Cu gasket to Viton was straightforward, as was Loctite elimination. Additional changes included the drive rod (changed from Al bronze to SS 304), the Rulon J sealing ring (changed to Teflon), machining the translator knob from Al 5052 (with reduced Mg) rather than Al 5056, and swapping out sulphur-containing SS 303 with SS 304
Once a sample is contained within the VTV, it may be removed from the N2 hood and connected to ancillary vacuum pumps. The pumping scheme (Fig. 20b) requires a turbo pumping station (e.g., HiCube ECO with diaphragm backing pump) or sorption pump and a small (2 L/s to 10 L/s) ion pump or combination ion/NEG pump (e.g., NexTorr HV200). While the metal-seal shutoff valve (V2) remains closed, the turbo pumping station is connected to the VTV ConFlat adapter at V1, and also to the ion/NEG pump at V2 by way of a CF tee with a second metal-seal valve, V3, and a bellows. The region between the turbo pump and the sealed VTV, as well as the ion/NEG pump volume, is then evacuated via the turbo pumping station/sorption pump until the pressure is sufficient to slowly lower the sample into the HV region, breaking the O-ring seal. The ion/NEG pump is started when the entire VTV chamber has been evacuated to ∼10−6 Torr. Once the HV pressure has stabilized, the sample is drawn up into the VTV body again to create an HV seal at V1, the roughing valve (V3) is closed, V2 remains open, and the ion/NEG pump and controller are switched to battery power by means of a custom switching circuit.
At this point, the VTV can be removed from the turbo pump station for transport. During conveyance, power may be supplied to the ion/NEG pump and controller via a regulated Li-ion battery pack (e.g., Aentron A24020M-PF) and the VTV internal pressure can be monitored on the controller display. In many cases, the NEG pump (without active ion pumping) can get standard background gases with no power required.
VTV Performance Test
Because both the 73001 and 73002 samples were ultimately sent to UVa in N2 rather than under vacuum, and because grain mounting for XPS analysis occurred in air, VTV performance tests at UVa necessitated the sputter-removal of surface oxide from several grain surfaces (73001,453 allocation) prior to sealing them in the VTV. The effect of atmospheric oxidation is best noted in the XPS Fe-2p photoelectron feature, where changes in oxidation state shift the orbital-electron binding energies and thereby the energies of the ejected, detected photoelectrons (Fig. 22).
Fig. 22.
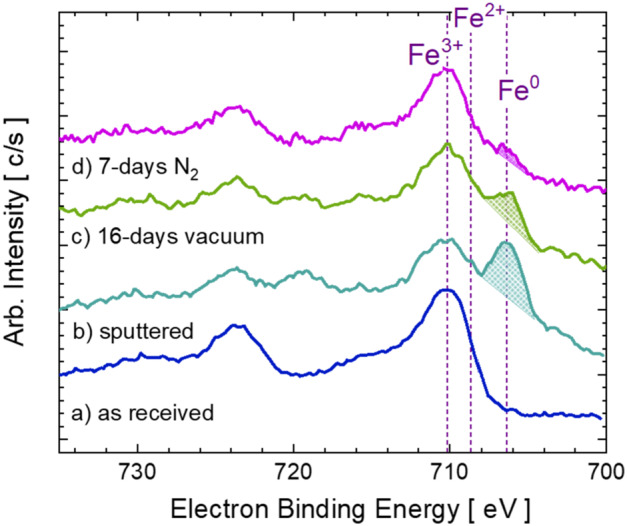
High-resolution XPS spectra were collected in the Fe-2p region to investigate the performance of the VTV. The maximum peak-envelope positions for ferric (Fe3+), ferrous (Fe2+) and elemental (Fe0) iron are denoted by the vertical dashed lines. Grain 1 (73001, 453) exhibited less than 1.5 at-% Fe0 after transport in N2 from JSC to UVa (a). Sputtering with 3 keV Ar+ is used to remove the surface oxide, revealing ∼40 at-% Fe0 in addition to ferrous/ferric oxides (b). Multi-day storage in high vacuum (c) retains elemental Fe more successfully than storage in N2 (d)
Lunar grains (73001, 453 allocation) shipped from NASA JSC under N2 were found to have rims containing exclusively ferric oxide (Fe3+), with <1.5% elemental (Fe0) iron or iron sulfide (Fig. 22a). Using in situ 3 keV Ar ions, incident at 60° from the sample platen normal, the lunar grains were sputter-cleaned utilizing Zalar-rotation to reduce shadowing for 6.2 minutes (∼30 nm), removing the surface oxide, and revealing >40% sub-surface Fe0 along with lesser contributions from both ferrous- and ferric-type oxides (Fig. 22b). The goal was to quantify the efficacy of the VTV by examining the concentration of unoxidized Fe0 within a lunar grain after storage under HV.
After XPS examination of pre- and post-sputtered grains, the sample platen with sputtered lunar material was transferred from the analysis chamber to the sample introduction chamber, where it was loaded into the VTV but not sealed. Once the 2 L/s ion pump independently maintained pressures of 10−6-10−7 Torr, the sample platen was drawn completely up into the VTV, sealing the vessel. Then, the VTV was removed from the XPS instrument. Grains were stored at ∼10−7 Torr for more than two weeks before being returned to the XPS for subsequent analysis. The Fe-2p region was a focus for comparison of oxidation state (Fig. 22c), identifying some changes in the Fe oxidation-chemistry after vacuum storage, including a preserved—albeit reduced concentration (∼24%) of— Fe0 in the grain rims along with a combination of Fe-oxides.
Thus, based on the concentration of Fe0, it is apparent that the VTV was indeed able to maintain a significantly improved concentration of elemental Fe after 16 days at ∼10−7 Torr. Only a fraction of the elemental Fe re-oxidized under high vacuum, preserving the surface chemistry much better than storage in an N2 environment, as evidenced by comparison with the ‘as received’ material. Reloading the same grains into the VTV filled with N2, rather than vacuum, further confirmed the efficacy of the technique (Fig. 22d).
It is therefore apparent that maintaining an extraterrestrial sample under vacuum—ideally UHV but even HV—better preserves its native surface state during storage and transport than does an N2 atmosphere. Thus, the developed VTV may be used in the near future to transport Bennu grains returned by NASA’s OSIRIS-REx mission to better retain the asteroid’s indigenous surface chemistry for XPS analysis (Bierhaus et al. 2018). Indeed, this transport system or similar methodologies should be useful to preserve new lunar samples, collected during the planned Artemis Program missions or by proposed Mars/cometary/asteroid sample return missions, for subsequent analysis by surface-sensitive characterization tools (Jolliff et al. 2020; Mitchell and Artemis Curation Lead 2021; Maltagliati 2023; Muirhead et al. 2020; Meyer et al. 2022; Glavin and the CAESAR Project Team 2018).
Thermoluminescence Studies to Determine the Temperature History of Shaded and Illuminated Surfaces
Introduction
As Durrani et al. (1977) pointed out, thermoluminescence (TL) properties of lunar samples provide a means of investigating thermal histories. It was shown that regolith from the shadow of a boulder had different TL properties from sunlit or partially shaded samples. It was also shown how these properties could be quantified, and it was possible to determine the temperature of the sample and duration it spent in the boulder’s shadow.
This possibility became especially useful with the discovery of water and its build-up in permanently shaded regions and widely distributed micro cold traps on the Moon (Schorghofer and Taylor 2007; Hayne et al. 2020). Water and other volatiles are essential resources for sustainable exploration on the Moon during NASA’s Artemis program and beyond.
However, a thorough knowledge of the TL properties of lunar samples is critical to developing a method for cold trap prospecting and unraveling thermal histories of shaded, partially shaded, and sunlit surfaces. Particularly important are the kinetic parameters governing the process, , known as trap depth and essentially activation energy, and , known variously as the pre-Arrhenius or “attempt to escape” factor, which is essentially a rate constant.
TL studies within the ANGSA consortium focus on pristine Apollo 17 samples placed in cold storage at −20 °C shortly after their return to Earth. Their cold storage was recommended by Durrani (1972) to avoid TL loss. With these samples in the freezer for nearly five decades, and a twin sample set stored at room temperature, NASA has effectively performed a fifty-year experiment that can be exploited.
Thus, ANGSA provides a unique opportunity to investigate the TL properties of lunar regolith and to determine the kinetic factors controlling the stability of thermoluminescence. Investigation of Apollo samples and a better understanding of the TL properties provide more robust temperature histories of lunar regolith samples using the TL technique on already returned samples and future returned samples during NASA’s Artemis program.
Principle of Thermoluminescence and Theoretical Framework
The amount of natural TL observed in a sample is the result of two competing processes: (1) the radiative filling of electron traps, and (2) the thermal drainage of these traps in the natural environment of the sample. TL data are obtained as plots of light intensity against heating temperature. A single “glow curve” typically consists of several overlapping peaks (Fig. 23), each of which can be described by an activation energy, , and Arrhenius (frequency) factor, .
Fig. 23.

Glow curve comparison for sample 76240 (permanently showed regolith at Station 6 Boulder 4) shown at (a) ambient room temperature and (b) contrasted with samples stored in the freezer. (c) Glow curve analysis of sample 76240 (permanently shadowed regolith at Station 6 Boulder 4) revealing five discrete peaks (dashed curves). (d) Exposure to ionizing radiation at room temperature (90Sr beta particles) reveals two additional peaks between 300-400 K. The composite glow curve is black, measured glow curve is in magenta
The mean life (t) of electrons in a material held at a temperature is given by
| 1 |
where is Boltzmann’s constant and is the environmental temperature. The frequency factor () can be obtained from and peak temperature () using:
| 2 |
where is the heating rate (7.5 °C/s) employed during the measurement. The equilibrium temperature for a natural TL peak (Teq, which Durrani et al. (1977) refers to as the “storage temperature”) is determined by equating build up in TL due to exposure to ionizing radiation and thermal decay. The resulting equation is:
| 3 |
where r is radiation dose rate, R1/2 is dose to half saturation, N/neq is the ratio of saturation dose to equilibrium dose. R1/2 and N/neq are determined by laboratory experiment, r is known to be about 10 rad/y (Zhang et al. 2020). As pointed out by Durrani, and determine most of the characteristics of the TL peak, its Teq and stability (and glow curve temperature). Dose rate, R1/2, and peak saturation level, N/neq, determine the intensity of the peak. Peaks in samples held above their Teq will have the TL drain faster than it builds-up, while peaks in samples below their Teq will build-up TL levels. This means that if a peak is present, it will not have been heated to its Teq in the time taken to acquire the TL signal.
Details on TL Measurements
This work focuses on regolith that had been in the shadow of Apollo Station 6 boulder 4, samples that were partially shaded, sunlit samples, and samples from six depths in the Apollo 17 deep drill core. In all cases, there are corresponding room temperature and freezer samples. Thermoluminescence measurements were made with a modified Daybreak Nuclear and Medical Inc. instrument (Sear et al. 2013). Modifications included the addition of a shutter, an aperture, heat, and color filters, and moving the heater nearer the PMT. The equipment and its associated vacuum/gas line were refurbished for this project. Samples were passed through a 250 mm sieve and 4 mg aliquots placed in a 5 mm diameter copper pan for measurement. Samples were heated from room temperature to 775 K in the instrument and the light emitted was recorded as a function of heating temperature. Heating was performed in a static nitrogen atmosphere at a rate of 7.5 K/second. Data were recorded digitally, and the glow curve (light against heating temperature) printed out as pdf and the data and metadata saved as an .csv text file. After removal of the natural TL by heating to 500 °C, sometimes referred to as “thermal cleaning”, the samples were irradiated for three minutes in a 140 mCi 90Sr cell while still in the copper pans. They were then allowed to “cool” for two minutes before being placed in the TL apparatus for measurement. This ensured that differential fading from sample to sample due to different cooling periods was not a problem. To monitor the stability of the equipment, lunar simulant LMS-1 (https://sciences.ucf.edu/class/simulant_lunarmare), provided by the University of Central Florida, was frequently run through the apparatus.
Summary of Findings
50-Year Experiment:
A comparison between the measurement of Durrani et al. (1977) and the ANGSA team in 2022 revealed an approximate 40% reduction in the low temperature TL peak (maximum at ∼475 K) in sample 76240 stored under nominal conditions (Fig. 29a). In striking contrast, when assessing the TL intensity of the sample 76240 preserved in a freezer at −20 °C for nearly five decades, the TL remained identical (Fig. 29b). The cold curation of lunar regolith samples obtained from cold and shaded areas preserved the TL signal (Sehlke and Sears 2022a,b). The results emphasize that lunar samples collected and returned to Earth for further analysis should remain in at the temperatures of their ambient environment to avoid losing scientific value pertaining to temperature-dependent properties, such as TL and volatile components for example.
Fig. 29.

Practice extrusion of double drive tube and preparing Apollo generation extrusion tools. (a, b, c) Practicing using extrusion tools using lunar simulant packed in drive tube in a table area equal to that of the curation nitrogen glovebox. (d) Practice glove box. (e,f,g,h) Extrusion and dissection tools that will be used for extrusion of 73002, 73001
Glow Curve Analysis:
Capitalizing on the advances in personal computer hardware and computational capabilities, a methodology for discerning distinct TL peaks and determining their kinetic parameters ( and ) through glow curve deconvolution has been developed (Sehlke and Sears 2023). This approach presents a swift substitute to the conventional arduous and time-intensive sequence of laboratory trials, resulting in savings of both sample materials and time. Moreover, comprehensive analysis of the glow curve reveals the existence of extra peaks that prove challenging to discern via experimental methods. For instance, our investigation of the glow curve from shaded sample 76240 resolves five distinct peaks (Fig. 23c), exceeding the number of peaks identified experimentally by Durrani et al. (1977). Samples exposed with ionizing radiation at room temperature (i.e., induced TL) reveal a total of seven discrete peaks (Fig. 23d).
Thus work to identify and characterize (measure E and s) the seven discrete peaks in the glow curve of lunar samples between room temperature and 775 K is being undertaken using the new approach; additional peaks will likely be found between 100 K and 300 K. Future work will enable the characterization of these low-temperature peaks to provide a rigorous scientific underpinning for the TL properties of polar samples likely to contain volatiles.
X-ray Absorption Spectroscopy and Monitoring Effects of Long-Term Curation
X-ray absorption spectroscopy (XAS) is a well-established characterization technique where a synchrotron is used to produce monochromatic incident x-ray photons, which are used to excite atoms core-level electrons to unoccupied states and probe the chemical state of major elements. Such information can provide valuable information about mineralogy, chemistry, and the age of the soil (Henderson et al. 2014; McCanta et al. 2019). XAS elemental analyses contribute not only to understanding the properties of lunar soil but also to how those properties may change over time due to sample handling and collection on the Moon, terrestrial environmental factors or human handling on Earth. As such, X-ray spectroscopic results can contribute to optimizing the storage conditions for advanced curation: e.g., assessing contamination and oxidation, and ensuring the long-term preservation of astromaterial samples (McCubbin et al. 2019).
Here, XAS was applied to explore the potential effects of long-term curation on normally curated Apollo soil samples (i.e., at room temperature in dry gaseous N2). To conduct this investigation, we compared XAS spectra of ANGSA samples from the double drive tube 73002/1 with previously opened Apollo 17 drill cores. All samples were stored, opened, and processed under the standard curation dry nitrogen environment for the 50 years after their return, with the exception of the 73001 sample that was sealed in a CSVC container and under a much lower partial pressure of N2 during its 50-year residence in curation. Although the upper portion of the double-drive tube 73002 had not been processed prior to ANGSA, the sample was not sealed inside the drive tube, so it was exposed to the curation grade N2 throughout its lifetime in curation. Consequently, 73002 has had nearly the same curation exposure to N2 as the other samples that had been stored and or processed in the pristine Apollo curation lab over the lifetime of the collection. XAS spectra were acquired from regolith samples 73001,493; 73002,238; and 73002,418 collected from passes 1 and 2 of 73002/1 by JSC curation. These results were compared with XAS spectra of samples of three drill core sections (i.e., 70003,553; 70004,591; and 70006,522). These drill core and double-drive tube samples were stored and processed under dry, ultrapure nitrogen in the pristine portion of the Apollo curation facility.
Low-energy XAS in a total electron yield acquisition mode was collected because it is inherently surface-sensitive (i.e., upper few nm of the sample), making it ideal for studying space-weathering and surface alteration effects. Compositional effects related to space weathering are expected to be confined to the near-surface, <200 nm (Keller and McKay 1997), O K-edge (∼543 eV) and Fe L3,2-edge (707 eV, 720 eV). XAS spectra were collected using beamline 10-1 at the Stanford Synchrotron Lightsource (SSRL) at the SLAC National Accelerator Laboratory. Spectra were energy calibrated using standard reference samples of TiO2 (anatase) and Fe2O3 (hematite) for the O K-edge and Fe L3,2-edge, respectively. Calibration standards were powders purchased from Sigma-Aldrich, sieved to <1 mm, and stored under dry nitrogen until analysis. Typical for synchrotron analyses of powders, samples were mounted on low X-ray background carbon double-faced ultra-high vacuum compatible tape.
From Fe L3,2-edge XAS, it is possible to obtain insights about the Fe redox environment of the samples. In general, for Fe L3,2-edge XAS, two edge jumps are observed, L2 and L3, that are due to the spin-orbit coupling of the 2p level, with the spectral shape that is strongly influenced by the crystal field and ligand mixing effects. Thus, signatures of Fe3+, Fe2+, and Fe0 can be distinguished as they have distinct spectral features, including their energy shift, curve shape, and intensity (Wu et al. 1997). Fe3+ is commonly found in terrestrial iron oxides, such as hematite, and hydroxide structures, but Fe3+ is rarely found on the Moon except in submicroscopic form, as recently reported (Keller and McKay 1997; Thompson et al. 2016; Xian et al. 2023; Guo et al. 2022). In contrast, Fe2+ in mineral phases such as olivine, pyroxene, and plagioclase are abundant and widely distributed in lunar regolith. Iron nanoparticles (npFe0) have been reported in amorphous impact melt-bonded agglutinate grains and amorphous rims on minerals, using transmission electron microscopy (TEM) methods (e.g., Keller and McKay 1993, 1997; Thompson et al. 2016; Burgess and Stroud 2018). The presence of npFe0 is attributed to space weathering processes, such as solar wind implantation and micrometeorite impacts (Pieters et al. 2000; Hapke 2001).
XAS spectra from the Fe L3,2-edge in the drill core samples point to a higher oxidation state in comparison to the 73002/1 double-drive tube samples. Figure 24a shows the Fe L3,2-edge XAS spectrum for every lunar sample that we analyzed. The data reveal two clear peaks at L3 (2p3/2) that correspond to orbitals in the Fe 2 shell: t2g (∼707 eV) and eg (∼709 eV). Generally, Fe2+ has a higher t2g/eg ratio than Fe3+ because the t2g orbitals are lower in energy and more populated in Fe2+ (Miedema and De Groot 2013). Hence, the t2g/eg ratio in Fe L3-edge XAS spectra reflects the oxidation state and ligand coordination environment of iron in each sample. On this basis, Fe3+ is more prominent in the drill core samples, with oxidation progressing from 70006 to 70003. In contrast, the double-drive tube samples exhibit little to no Fe3+, as expected for lunar soil.
Fig. 24.
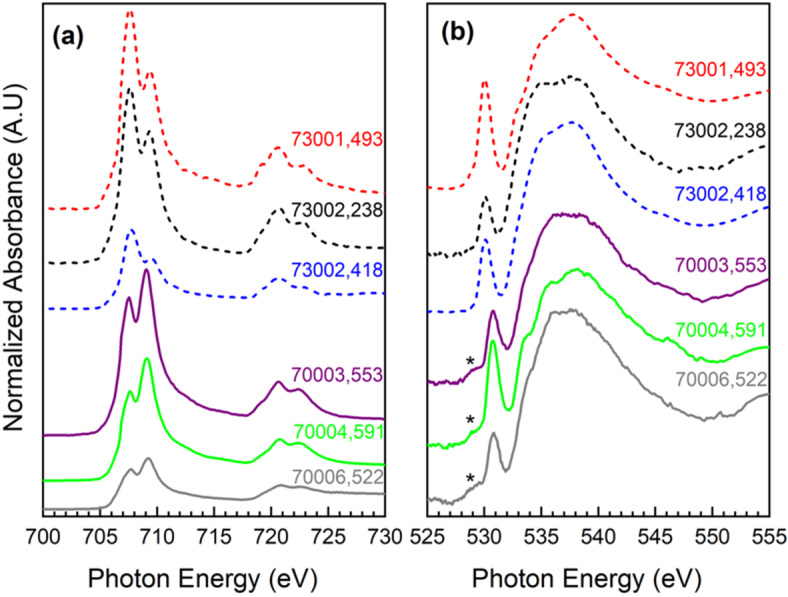
(a) From bottom to top, Fe L3,2-edge XAS of non-specially curated samples 70003,553, 70004,591 and 70006,522, followed by, in dashed lines, specially curated samples 73001,493, 73002,238 and 73002,418. The orbital transitions are located at ∼707 eV and eg orbital at ∼709 eV in both cases. Non-specially curated samples have / indicating Fe3+ as predominant specie while specially curated samples with / pointing to more reduced redox environment. (b) same as (a) but at O K-edge. Specially curated samples show a sharp peak (∼530 eV) without a visible crystal splitting typically found at Fe2+. Fe3+ split is detected for non-specially curated samples, (∼529 eV) is marked with ∗, and (∼531 eV)
Fully reduced iron metal, present as npFe0, is detected in the double-drive tube samples by TEM methods. Figure 25a shows an example of a darkfield image of npFe0 in glass on a grain from sample 73002,239 (pass 1). This grain was prepared as an electron-transparent thin section by standard methods (e.g., Ishii et al. 2010) in a Helios 660 dual beam focused ion beam (FIB) instrument (Thermo Fisher Scientific) at the University of Hawai‘i and analyzed using two Titan transmission electron microscopes at the Molecular Foundry at Lawrence Berkeley Laboratory. To protect against oxidation or hydration, samples were stored under dry nitrogen and mounted under dry Ar for FIB, and thin sections were transported in an Ar-purged and evacuated vacuum sample storage container (Rave Scientific) for TEM. Electron energy loss spectroscopy (EELS) in the TEM was performed in hyperspectral mapping mode using a monochromated electron beam at 300 kV and a Gatan Continuum GIF spectrometer providing 150 meV energy resolution. EELS spectra at locations corresponding to an iron nanoparticle and to glassy matrix are shown in Fig. 25b, and maps of the Fe0 and Fe2+ components (Fig. 25c-d) extracted from EELS demonstrate the correlation of the Fe0 oxidation state with the iron nanoparticles. Despite the demonstrated presence of npFe0 in the double-drive tube samples, Fe0 was not detected by XAS, either in the drill core samples or in the double-drive tube samples. The absence of a measurable Fe0 signal in XAS spectra is likely due to its much lower abundance relative to Fe2+ and/or Fe3+ in space-weathered grain surfaces and the significantly lower spatial resolution (∼mm2) of XAS relative to TEM.
Fig. 25.

Transmission electron microscopy showing presence of Fe metal in an electron transparent section of the near-surface region of an agglutinate grain in specially curated lunar soil sample 73002,239. (a) Annular dark field image of bright beads of nanoparticulate iron (npFe0) in glass. (A vesicle in the glass, the black hole on the right side of the image, has resulted in dark gray, thinner glass below it.) (b) Electron energy loss spectra (EELS) showing the presence of metallic iron (Fe0) in npFe0 at the location indicated by the red circle in (c) and of Fe2+ in the surrounding glass at the location indicated by the red circle in (d). (c & d) EELS maps of Fe0 and Fe2+ over the area indicated by the green box in (a)
Oxygen K-edge XAS provides insights into the distribution and speciation of O-containing components in lunar soil (e.g., minerals, glasses, and hydroxyl and peroxyl groups) that is complementary to the TEM observations and Fe L3,2-edge XAS, O K-edge XAS provides insights into the distribution and speciation of O-containing components in lunar soil (e.g., minerals, glasses, and hydroxyl and peroxyl groups). Figure 25b shows the electronic structure around O atoms for the same set of lunar sample groups. O K-edge XAS spectra are sensitive to changes in the local electronic structure and are important to explore due to the reactivity of O, the key to many chemical reactions (Frati et al. 2020). In particular, the O sharp first low-energy feature, commonly described as a pre-edge peak, changes systematically due to hybridization with neighboring transition metal ions. For example, the O pre-edge peak in iron oxides corresponds to electronic transitions from O 1s core to hybridized antibonding O(2p)-Fe(3d) states.
For the samples from the 73002/1 double drive tube, this first feature is located at around 530 eV. This peak position is related to the O 1s electron transition due to hybridized orbital states of transition metals and is consistent with the Fe L3,2-edge XAS spectra that reveal Fe2+ as the predominant Fe species in this sample set. On the other hand, the drill core samples show crystal field splitting (indicated with ∗ in Fig. 24b) that is correlated to an increase in the degree of hybridization in trivalent transition metals, because of the half-filled 3d band, like the spectral feature observed in 3d5 ground state Fe2O3 (De Groot et al. 1989; Wu et al. 1997). Thus, the splitting is generally interpreted as indicating a higher proportion of Fe3+, relative to 73001/2. Therefore, the O K-edge XAS spectra strongly suggests increased Fe oxidation in the drill core samples, relative to the double-drive tube samples. The increased Fe oxidation signal in both the O K-edge and Fe L3,2-edge XAS indicates an important difference between the samples. This difference could be related to intrinsic differences in the regolith between sampling sites, differences in how the samples were collected on the Moon (drill cores vs drive tubes) and transported back to Earth, differences in how the samples were curated and/or it could relate to the amount of sample processing/agitation the samples experienced in the pristine curation environment given that the drill core samples experienced more processing than the 73001/2 samples. Of these options, we suspect that the increased Fe oxidation signal in both the O K-edge and Fe L3,2-edge XAS for the drill core samples is likely attributed to their exposure to crew cabin air and Earth atmosphere prior to arriving at the pristine Apollo Curation Facility where they were placed and subsequently kept in dry gaseous N2. The 70001-70009 deep drill core samples came back to Earth in 3 pieces in a custom drill stem bag made of beta cloth, which meant the samples within the beta cloth bag were open to the elements until arriving at curation. In contrast, the 73001/2 samples came back in a sealed rock box with its vacuum intact, meaning the 73001/2 samples were never exposed to crew cabin air or Earth’s atmosphere during their transit to the pristine Apollo curation lab. The fact that the 73002 samples do not show oxidation despite their 50-year exposure to the curation-grade nitrogen means we can likely rule out long-term exposure to dry nitrogen as a cause for the oxidation observed in the drill core samples. These results indicate that curation grade nitrogen represents a reliable pristine atmosphere to maintain the scientific integrity of return samples over decadal timescales. Furthermore, these results illustrate the potentially lasting effects of lunar sample alteration for samples that see even short durations of exposure to an Earth-like atmosphere.
Chemical and Mineralogical Mapping (Scanning Electron Microscopy, Electron Probe Microanalysis) and Electron Backscatter Diffraction (EBSD)
Introduction
Scanning Electron Microscopy (SEM), Electron Probe Microanalysis (EPMA) and Electron Backscatter Diffraction (EBSD) were used in some aspects of the preliminary examination of ANGSA samples (73001, 73002, frozen). These are not unique tools for lunar sample analysis. However, because these types of fundamental analytical tools were used in distinctive ways or combined with unique observations during PE, they deserve mention in this manuscript.
Core
The 73001 and 73002 cores were documented with XCT and multispectral imaging prior to and during dissection. Following dissection, continuous thin sections were prepared of both cores. Both sets of cores were documented using optical microscopy. Plane polarized transmitted light images of 73002,6011 and 73002,6013 are shown in Fig. 26. During the Apollo Program, many continuous core thin sections were documented to this level. However, the ANGSA Team took this documentation to another level.
Fig. 26.

Two examples of core documentation from continuous thin sections (73002,6011,6013): Optical microscopy plane-polarized light images (upper two images) and corresponding QEMSCAN images that relay mineralogical, petrologic, and chemical information (lower two images) on these core (optical microscopy images from the Johnson Space Center, the SEM maps from the University of Manchester). The approach identifies lithologies that are likely from the South Massif (e.g., Mg-suite, Alkali-suite, impact melt breccias), the valley floor (e.g., mare basalts, volcanic glass beads) and products of regolith evolution (e.g., agglutinates)
QEMSCAN analyses were performed at The University of Manchester using an FEI QUANTA 650 field emission gun (FEG) scanning electron microscope (SEM), equipped with a single Bruker XFlash energy dispersive X-ray spectrometer (EDS). An accelerating voltage of 25 kV and a 10 nA beam current was used. All continuous thin sections were scanned in field image mode using a step size (i.e., pixel size) of 5 m. The QEMSCAN software uses a Species Identification Protocol (SIP) list to assign a mineral to each pixel based on the EDS spectra and BSE brightness collected at each individual point. A modified version of a SIP list, specifically tailored toward lunar samples, was used to analyze the samples. In addition to mineral phase maps, backscattered electron (BSE) and elemental maps were also exported from the QEMSCAN datasets (Fig. 26). High-resolution BSE images of clasts of interest, identified by the QEMSCAN analysis, were subsequently acquired using the same SEM as used to perform the QEMSCAN analysis. A Cameca SX100 electron microprobe (EPMA) was then used to measure major elements in points and line profiles across minerals within clasts of interest to help classification and identification of their sources (Bell et al. 2022).
A second set of continuous thin sections was analyzed using electron probe microanalysis (EPMA) with the JEOL JXA-8200 electron microprobe at WUSTL. For 73001 and 73002, backscattered-electron (BSE) images were collected using the JEOL guide-net mapping software, at 15 kV, 2 nA probe current, and 70× magnification. Maps were stitched using the ImageJ Fiji grid-collection stitching plug-in to produce a 20 K × 5 K BSE mosaic base image with ∼1.5 m/pixel resolution. For each slide, five EPMA stage maps were acquired using fixed wavelength-dispersive spectrometers (WDS). Each stage map was acquired at 1024 × 1024 resolution using a step size of 9.5 m with a fixed 10 m electron beam at 15 kV, 100 nA probe current, and a dwell time of 25 msec. Two passes were used to collect X-ray intensities for Mg, Al, Fe, Ca, and Ti in pass 1, and Na, Si, Mn, K, and Cr in pass 2. These mapping runs each required 18 hours per map and generated a total of 20 × 106 fully quantitative analyses on all four slides. The X-ray intensity maps were processed using Probe Software CalcImage and Probe for EPMA, by performing a full (z) correction at each pixel in the maps. This correction is of the form C = k × ZAF, where C is the element concentration, the k-ratio k = (P-B)smp/(P-B)std is the background corrected relative peak X-ray intensity (P-B) at each pixel in the map compared to the calibration standard, and ZAF is the compositionally dependent matrix correction for atomic number Z, X-ray absorption A, and characteristic fluorescence F in both the sample and standard. This full correction is more accurate than methods using uncorrected X-ray intensity measurements or algorithms of the form C = m ∗ I + B, where a linear relationship is presumed between concentration C and X-ray intensity I, and a fixed global background is assumed for all phases in the map (Ogliore 2021; Carpenter et al. 2022).
The continuous sections present a challenge to evaluate wide-area maps and to compare imaging and microanalysis data (Fig. 27). Thus, the Quantitative Microanalysis Explorer web tool was developed as an interface to the 73001-73002 data sets. This web tool performs zoomable map navigation and sequential comparison of BSE, X-ray, optical, and quantitative compositional data for a given field of view. The tool allows extraction of element, oxide, and cation formula data for discrete point, rectangular region, and irregular polygon regions as outlined by the mouse. Extracted quantitative analysis data are copied to the clipboard and can be pasted into spreadsheet programs for further evaluation (Carpenter et al. 2022; Minocha et al. 2022).
Fig. 27.

Back-scattered electron images of 73001 continuous core thin sections (bottom two rows of images) and expansion of 73001,7017 (upper two rows): transmitted light, plane polarized, Fe X-ray, Al X-ray, and X-ray RGB, with R = Al, G = Mg, and B = Fe. Quantitative data for major elements can be retrieved a: https://presolar.physics.wustl.edu/qtool/73001_6017. Note 0.5 cm wide high-Ti basalt clast on right
In summary, the double drive tube core data produced by the ANGSA Team are the most comprehensive of any Apollo core sample. Double drive tube 73001-73002 is documented with XCT video and images, multi-spectral images, and continuous chemical, mineralogical, and petrologic images produced by QEMSCAN and EPMA as recorded and documented in the QME-tool. With these tools, the data are placed within an interactive interface that allows extraction of chemical data for future investigators.
Lithic Clasts
All of the >4 mm size fraction of lithic clasts in 73001 and 73002 were imaged by XCT. Selected thick sections of these lithics were documented using the imaging methods used above in Sect. 6.9.2. In addition, lithic fragments from a selected number of lithics of various size fractions were also documented using a combination of SEM, EBSD, and cathodoluminescence (CL). Prior to analysis, the selected grain mounts and sections were given an additional polishing step using a water-free (ethylene glycol base)50 nm silica colloid dispersion to remove surface defects and produce an ultra-flat surface. The EBSD and CL analyses of the lithics were conducted using an Oxford Instruments Symmetry™ detector and a Gatan Monarc detector, respectively, mounted on a JEOL 7900F field emission SEM at NASA JSC. These analytical methods identified the structural state of phases (e.g., SiO2 polymorphs), minerals appropriate for chronology (e.g., apatite, baddeleyite, zircon) and their suitability for age dating (e.g., metamictization, shock overprinting), targets (e.g., apatite, sulfides, melt inclusions) for in situ volatile analyses (e.g., H2O, D/H, 37Cl/35Cl) by SIMS or LA-ICP-MS, and interfaces for future FIB extraction and TEM analyses (Fig. 28; Erickson et al. 2023).
Fig. 28.

Examples of rocklettes and small clasts analyzed by EBSD. Mineral phase maps are based on indexing of the electron backscatter diffraction patterns and highlight the petrologic textures of varying rock types recovered from the 73001/73002 double drive tube. Step sizes ranged from 1-0.2 m. The EBSD phase and microstructural analysis helps guide subsequent targeted SIMS (e.g., volatiles, U-Pb ages), LA-ICP-MS (e.g., trace elements) and TEM (structural interfaces) analyses
Curation and Processing of ANGSA Samples
Practice
Only two drive tubes were extruded and dissected during the Apollo Program (12028, 1970; 14230, 1971). There were 28 drive tubes processed between 1975 and 1988. Prior to the ANGSA initiative, the last Apollo drive tubes were extruded and dissected in 1991 (double drive tube 60013, 60014). Twenty-eight years following the last drive tube core extraction and dissection, only one person on the Johnson Space Center (JSC) curation staff had been trained to process core, and she never carried out processing of an actual core. Following the core processing in 1991, tools used in core processing were placed in long-term storage.
As a result of almost three decades of core processing inactivity, JSC staff needed to be trained and tools needed to be located, refurbished, cleaned, assembled, and tested prior to processing of the 73001-73002 double drive tube. Similarly, procedures for sample dissection had to be reviewed and modernized, including construction of a full-sized cabinet mock-up and extensive testing with lunar simulant samples. JSC curation staff practiced core extraction with a lunar simulant (mm-cm sized particles of SiO2 mixed with Al2O3 powder) using Apollo-generation tools. The simulant was placed within a drive-tube that resided on a table with a surface area approximately equal to the space within the nitrogen glove box that was to be used for ANGSA core processing (Fig. 29). Approximately two months were required for training before sample processors felt prepared to undertake processing of the Apollo 73001-73002 double drive tube.
Sample Processing
Introduction
Three types of Apollo samples were processed during ANGSA activities: The upper part of the double drive tube collected at Station 3 (73002), the lower part of the double drive tube collected at Station 3 and sealed on the lunar surface in a CSVC (73001), and a number of samples that were placed in a freezer within a month after their return in December 1972. These samples were processed in different manners, although the extrusion and dissection of 73001/73002 were meant to be as identical as possible. Sample 73002 was successfully opened and extruded in November 2019 and was fully dissected by the end of 2021. The long processing time was a product of three factors in order of increasing impact: the involvement of a rotating Preliminary Examination Team (PET), the first core dissection in almost three decades with a new curation staff, and the closure of the JSC curation facility because of the COVID-19 pandemic. Following the effect of the pandemic on NASA closure schedules, sample 73001 was successfully opened and extruded in March 2022 and fully dissected by the end of June 2022. For each core, only one processor dissected the core (C. Krysher for 73002; J. Gross for 73001). Other processors were available for taking notes, making observations, and photo-documenting materials. The ANGSA PE team was available through passes 1 and 2 of 73002, but this activity was abandoned due to COVID-19. The PE team consisted of 2-4 individual ANGSA scientists who spent 1 week in the curation lab during the dissection process.
Double Drive Tube 73002
Prior to opening 73002, the entire core was imaged using micro-X-ray Computed Tomography (XCT) at the University of Texas High-Resolution X-ray Computed Tomography Facility in Austin, Texas (Sect. 6.1). Extrusion and dissection were done in a nitrogen glove box in the Lunar Sample Laboratory Facility located in Building 31N at the Johnson Space Center in Houston (Fig. 30). The nitrogen cabinets are equipped with tools, containers, and other pieces of equipment that have been specially cleaned and packaged in hermetically sealed bags. The only materials that are allowed to touch the pristine Apollo samples are aluminum, stainless steel, and Teflon; all pristine Apollo samples are only exposed to curation grade gaseous N2 (McCubbin et al. 2019). All material that is used in the glove box is made from materials on the approved materials list as defined in LOP 54 (APPROVED MATERIALS AND ITEMS: LUNAR PSL, RSL, AND RPL). The JSC cleaning procedure JSC-03243 Rev E is used to clean tools prior to placing them in the glove box.
Fig. 30.

(a) Building 31N, the home of JSC lunar sample curation facility. (b) Apollo lunar sample clean lab. (c and d) Glove box within the Apollo lunar sample clean lab used for the extrusion, dissection, sieving, and documentation of 73001 and 73002. (e and f) tools in the glove box that were used for extrusion and dissection of tools. (g) Successful extrusion of double drive tube 73002. (h) Extruded core 73002 prior to derinding and dissection
Once the core was extruded from the double drive tube, the outer portion was derinded to ∼1 mm depth to remove possible contamination attributed to its contact with the drive tube barrel and to expose stratigraphy that was smeared during extrusion. Derind material was documented and stored for further examination and analysis. The core was then dissected in three passes in 0.5 cm intervals (Fig. 31 and 32a). Prior to and following each pass, the surface was photographed and imaged using a multi-spectral instrument (e.g., Sun et al. 2021). For passes 1 and 2, each 0.5 cm sample segment was sieved into two size fractions: >1 mm and <1 mm. Following sieving, the >1 mm size fraction was hand sieved into 1-2 mm, 2-4 mm and >4 mm size fractions and photographed (Fig. 32b). The >4 mm size fraction was first inserted into a Teflon bag and sealed, and that sealed bad was inserted into a second Teflon bag that was subsequently sealed (Fig. 11c). The sealed samples were removed from the N2-glove box and imaged with XCT (Fig. 11d,e). Pass 3 was not sieved. All samples were documented and placed within stainless steel containers for storage and future allocations. Following pass 3, the remaining material was impregnated with epoxy (Araldite GY 506 (CAS #25068-38-6) manufactured by Electron Microscopy Sciences for the resin and 99% (2-Aminoethyl)piperazine and 1% Piperazinoethylamine made by Sigma Aldrich (CAS #140-31-8) for the hardener), cured, and then sawed. Segments were made into two sets of continuous petrographic thin sections. Continuous thin sections were imaged with reflected and transmitted light microscopy. The continuous thin sections were further documented with SEM and electron microprobe imaging at the University of Manchester and Washington University St Louis. The <1 mm size fraction was allocated to ANGSA team members for major and trace element analysis, additional sieving, and mineralogy/petrology, and Is/FeO measurements. Additional details of core dissection are provided by Gross et al. (2022, 2024).
Fig. 31.

(a) Stitched whole core XCT scan of 73001. (b) Sketch of 73002 core with locations of each dissection pass
Fig. 32.

(a) Partially dissected core 73001. (b) >1 mm size fraction sieved from 0.5 cm portion of one of the sample passes from 73002. (c) >4 mm lithic fragment doubly sealed in Teflon container. (d and e) XCT images of >4 mm lithic fragments sieved from core
Double Drive Tube CSVC 73001
Unlike the 73002 drive tube, the 73001 drive tube was placed into a CSVC and sealed on the lunar surface by Apollo 17 astronauts soon after the drive tube was collected. Upon returning to Earth, the CSVC was placed within an outer vacuum container (Fig. 12a). A gas extraction manifold (GEM) and a CSVC piercing tool were designed and built to sample gas in the outer vacuum container and the CSVC. Descriptions of the GEM and the piercing tools are in Sects. 6.4 and 6.3, respectively.
The gas extraction steps occurred over several weeks and involved numerous JSC curation staff and ANGSA Team Members (Fig. 33). The outer vacuum container and contents (CSVC, capped drive tube, and core sample 73001) were transferred from the pristine vault in the Lunar Sample Lab and placed within the experimental facility adjacent to the GEM. The GEM was connected to the valve on the outer vacuum container (Fig. 33b). After that, a system blank was collected in one of the eight sample bottles, following the same procedure as all sample gas extractions (unless otherwise stated below): the pump-out isolation valve was closed, and both bottle valves were opened for 15 minutes to equilibrate with the gas manifold, and then both closed. Two separate gas extractions from the OVC were done: the initial OVC extraction was done with a background manifold pressure of 4 × 10⁻⁶ Torr, an equilibration time of 15 minutes and the gas was expanded into one 2 L bottle and one 50 mL bottle. The equilibration pressure observed on gas sample OVC1 was 27 Torr. The second OVC extraction was collected into one 2 L bottle with a background manifold pressure of 5 × 10⁻⁸ Torr. The gas for OVC2 was passed through a flexible bellow tube submerged in a water ice bath during extraction, and the equilibrated pressure on OVC2 was 7 Torr. An ice water bath was preferred over lower temperatures because lower temperatures would cause an undesirable condensation of heavy noble gases.
Fig. 33.

(a) Outer vacuum container that holds the CSVC 73001. (b) Gas extraction manifold extracting gas from the outer vacuum container. (c) Opening the outer vacuum container in the N-glove box to remove the CSVC after the first gas extraction. (d) CSVC prior to inserting it into the piercing tool. (e) Piercing tool containing the CSVC prior to piercing and gas extraction from CSVC. (f) CSVC following gas extraction and prior to drive tube removal. (g) Small container used to collect and store outer vacuum container and CSVC gas. The small container is connected to a mass spectrometer for PE of gas sampled from CSVC
Following the extraction of gas from the outer vacuum container, the OVC bellow valve was closed and the OVC was disconnected from the gas manifold. The vacuum container and the piercing tool were transferred into the core dissection nitrogen glove box. JSC cleaning procedure JSC-03243 Rev E was used prior to placing it in the glove box. The piercing tool was baked out for two hours at 110 °C. Within the nitrogen glovebox, the CSVC was removed from the vacuum container and inserted into the piercing tool (Fig. 17d, 33 c,d). The piercing tool and contents were double-bagged and sealed in Teflon prior to removal from the core dissection glove box. Once secured in sealed bags, the piercing tool and contents were removed from the core dissection nitrogen glove box and transferred to the curation experimental clean room. The piercing tool was then pumped down by the gas extraction manifold prior to piercing the CSVC to remove the N2 cabinet gas in the piercing tool. During the pump down of the piercing tool over the course of ∼48 hours, manifold pressure stagnated around ∼10−6 Torr, but dropped to ∼10−9 Torr when the valve to the piercing tool was closed. The RGA analysis of the gas being pumped out of the piercing tool appeared to be nearly pure N2 gas, as expected for pumping out of cabinet gas trapped in the piercing tool and showed no evidence for atmospheric contamination of the system. Helium was used to leak check the piercing tool and extraction manifold for any leakage from the exterior into the system, but none were evident. Thus, the relatively high vacuum system pressure was interpreted as a slow leak of CSVC gas out into the piercing tool.
The CSVC “leak gas” was accumulated within the piercing tool for ∼24 hours and then collected into one 2-liter bottle with a background manifold pressure of 10−9 Torr (CSVC Leak Gas 1). This process was repeated under almost identical conditions to collect an additional 2-liter bottle of gas as CSVC Leak Gas 2.
After the CSVC leak gases were collected, the piercing tool was pumped and isolated from the GEM. The piercing mechanism was successfully used to penetrate the bottom of the stainless steel CSVC (making a ∼2 mm hole), and a first gas extraction from the pierced CSVC was collected in two 2 L bottles and one 50 mL cylinder. A longer gas extraction (CSVC extraction 2) was performed with an equilibration time of 10.75 days (Fig. 33e). Finally, the gas manifold was used to pump down the CSVC/piercing tool to a pressure of 2 × 10⁻⁷ Torr. The piercing tool was then isolated for 6 days, and a final CSVC extraction 3 was collected into a single 1 L bottle. The GEM also contains an activated charcoal trap to zap cryogenically condensable gases remaining in GEM. However, it was not used in this project.
After the end of the final extraction, all valves were closed, and the piercing tool was disconnected from the GEM. The piercing tool and contents were placed within the core dissection nitrogen glove box after cleaning. The piercing tool was opened and the CSVC was removed (Fig. 33f), sealed in Teflon bags, and imaged by XCT. The XCT data of the CSVC and core tube within showed that the bottom Teflon cap was not pierced during gas extraction and, thus, the sample integrity remained guaranteed during piercing and subsequent gas extraction. Further, the XCT scan of the top of the core revealed that the drive tube was overfilled with lunar soil and the tool that keeps the soil constrained within the drive tube (i.e., the keeper) was not fully deployed. These preliminary data allowed us to implement the necessary steps to prevent loss of sample integrity, including any potential stratigraphy shifts during extrusion. Prior to extrusion, the 73001 core was imaged using micro-X-ray Computed Tomography (XCT) at the University of Texas High-Resolution X-ray Computed Tomography Facility in Austin Texas, just as was done for 73002. Following gas extraction from the outer vacuum container and CSVC and using the knowledge provided by the XCT imaging, the drive tube was taken out of the CSVC, and the core was extruded. The extrusion and dissection approaches are the same as those used for 73002 (Gross et al. 2022, 2024). The manifold containers were transferred to labs for PE analysis (Fig. 33g).
Cold Curated Samples
Sample processing was conducted in the following sequence. First, the sample processing team puts on cold-processing gear to enter the anteroom, donning booties and bouffants in the process. Second, they don their cleanroom garb on top of the cold gear and check the oxygen levels inside the freezer. Due to the potential for gaseous N2 buildup inside the freezer volume, the freezer door was opened multiple times prior to processing to ensure a safe working environment for processing staff. In parallel with these tasks, the designated samples and processing tools were triple-bagged in the Apollo Curation Facility. After both the processors and samples were ready, samples were placed in a cooler with −20 °C cold bricks and transported to the freezer anteroom (approximately 2-5 minutes). In the anteroom, the samples were removed from the cooler, wiped with a clean alcohol wipe, and the external Teflon bag was removed prior to bringing the samples into the freezer. Samples and sampling tools were placed in the antechamber, nitrogen-purged, and moved into the glovebox internal volume.
Freezer operations were always conducted with two people inside the freezer and one person in the anteroom. One person in the freezer would process the sample while the second person would review the processing procedure, document necessary information, and monitor the oxygen levels in the freezer using a hand-held monitor. The person outside the freezer would visibly monitor the freezer occupants to ensure their safety and to alert medical personnel in the event of an emergency. Additionally, a timer was used by the person outside the freezer to monitor the amount of time processors were inside. To minimize exposure to the cold and to facilitate the circulation of air inside the freezer, freezer occupants were limited to 15 minutes of cold operations at a time. After 15 minutes, they would either step outside for a short break or hand off processing operations to other personnel. Cold sample processing was performed in shifts, with personnel trading off activities on a predetermined schedule. After sample processing was complete, samples were placed in pre-made, empty, clean Teflon bags and sealed with Curation-developed, cold-tolerant bag clips. Samples were then removed from the glovebox/freezer and placed in a larger Teflon bag in the freezer anteroom. A high-temperature heat sealer was used to seal the external Teflon bag before immediately placing it in the sample cooler with the cold bricks used previously. Samples were then transported back to the Apollo Curation Laboratory, where they were returned to the −20 °C sample storage freezer. With this system in place, processing of all the ANGSA cold samples was completed within two weeks.
Preliminary Examination Methodology
Introduction
Preliminary Examination (PE) Steps for 73002 included: (1) Whole Core XCT imaging; (2) Extrusion, dissection, and documentation of regolith Materials; (3) XCT imaging of all the >4 mm individual particles. (4) SEM and reflected light microscopy imaging of a subset of the >4 mm size fraction. PE Steps for 73001 included: (1) Gas Extraction; (2) Whole Core and CSVC XCT imaging; (3) Extrusion, dissection, and documentation of regolith materials; (4) XCT imaging of all of the >4 mm individual particles. (5) SEM and reflected light microscopy imaging of a subset of the >4 mm size fraction.
73001 and 73002
A variety of PE data were produced for the regolith and containers from the 73001 and 73002 cores. XCT video and images were produced for both the unopened core and containers (double drive tube, CSVC). Photographs and multispectral imaging of the core were collected on the surface of most passes during dissection (Sun et al. 2022a,b; Gross et al. 2022, 2023). Grain size analysis data were produced during each dissection for each 0.5 cm horizon. This set of data provides the masses of each size fractions <1 mm, 1-2 mm, 2-4 mm and >4 mm. Continuous thin sections were produced from post-pass materials. These continuous thin sections were imaged with reflected and transmitted light microscopy at the Johnson Space Center. Two sets of continuous thin sections were sent to the University of Manchester and Washington University in St Louis for SEM and electron probe mapping of major and minor elements (Bell et al. 2022; Carpenter et al. 2022; Minocha et al. 2022). These maps are available in a variety of formats in the final PE documents on 73001 and 73002, QEMSCAN (University of Manchester) and Quantitative Microanalysis Explorer (Washington University St. Louis). Following pass 3 and prior to removing core 73001 from the nitrogen-purged glove box, a portable Fourier Transform Infrared (FTIR) spectrometer (Designs and Prototypes Model 102) covering the spectral range from 2-14 m was used inside the nitrogen-purged curation cabinet to collect unobstructed spectra along the core. The combination of illuminator and spectrometer produced usable spectra from 2-5.2 m to examine the water bands ca. 3 m (Lucey et al. 2022).
73001 Gas Sample
Once gas was extracted from the outer vacuum container (OVC) and the CSVC, the two sample sets were transferred to the Center for Stable Isotopes at the University of New Mexico (CSI-UNM) and Washington University in St Louis (WUSTL).
At CSI-UNM, gases extracted from the OVC and CSVC were analyzed for their major and minor gas composition using conventional gas source mass spectrometry. The gases were admitted sequentially into a ThermoFisher Delta V mass spectrometer. Three Faraday collectors were used for the scan, with resistors spanning a range of 3 × 10⁸ to 1 × 10. The highest resistance amplifiers most sensitive resistor was used for all masses except for nitrogen (mass 28 – N2 and mass 14 – ) which were saturated on both the high and intermediate sensitivity collectors. The relative nitrogen abundance was determined from the ratio of the amplifier resistance (3 × 10⁸/1 × 1012)multiplied by the voltage on the least sensitive amplifier. The voltage for each mass when no gas was admitted into the mass spectrometer were subtracted from the total counts for each mass to get a background-corrected count for each mass. No corrections were made for the ionization efficiency of the different gas species (Sharp et al. 2022).
The OVC and CSVC gas samples allotted to WUSTL were transferred into stainless-steel volumes constructed from standard ultrahigh vacuum (UHV) CF flange fittings and hardware. Two all-metal bakeable stainless-steel valves were fitted onto each volume to create a pipette volume, used to draw aliquots from the larger sample volumes for repeated analysis. Samples were shipped from Johnson Space Center to Washington University. Gas aliquots were first analyzed on a Stanford Research Systems Residual Gas Analyzer (SRS RGA) on a small UHV gas line. A portion of the CSVC gas was then transferred to an automated gas extraction, purification, and separation manifold for noble gas analysis. Reactive gases were removed by exposing a split of CSVC gas to two SAES NP10 getter pumps (one hot and one cold). Inert gases aside from helium were trapped on a Janis cryogenic trap fitted with a charcoal sorbent. He, Ne, Ar, and Xe were sequentially inlet to the mass spectrometer using the cryogenic trap to separate He, Ne, Ar, and Xe. Noble gas isotopes and abundances were determined using a Nu Noblesse HR 5F5M.
Lithic Fragments (>1 mm)
After the >1 mm size fraction was sieved from each 0.5 cm horizon in passes 1 and 2 from 73001 and 73002, each fragment was sized and documented (Fig. 32b). For the lithic fragments making up the greater than 4 mm size fraction, each was imaged using XCT and the XCT videos were placed on the ANGSA team web site hosted by the Lunar and Planetary Institute. Approximately 40 of these fragments were identified by the ANGSA team as high priority with important links to proposed science. These 40 samples were made into thick sections and imaged using reflected light microscopy. A subset of these thick sections was imaged using Backscattered Electron Imaging and chemically mapped for several major, minor, and trace elements. The minor and trace elements were mapped to identify accessory phases that could be used for chronology (e.g., zircons) and volatile element analysis (e.g., apatite).
PE Documents
The preliminary catalog for the double drive tube sample 73001 and 73002 can be accessed at https://curator.jsc.nasa.gov/lunar/angsa_attachments/aapreliminary%20catalog/preliminary_73001-73002_catalog.pdf (Gross et al. 2023). The overall PE documentation contains photographs of cores and >1 mm size fractions, XCT videos and images of core (prior to and following extrusion) and >4 mm size fraction.
Contamination Issues, Monitors, and Experiments
Water
Prior to delivery, contaminants in the nitrogen gas that is used in all the glove boxes in the JSC lunar sample curation facility were analyzed. During use in the facility, the nitrogen gas composition is monitored. Because water (and oxygen) in lab air slowly permeates the rubber gloves and enters the cabinets, nitrogen is kept flowing to prevent concentrations of these reactive gases from building up inside the cabinets. Automatic hourly testing of each cabinet assures that the water and oxygen concentrations are maintained at less than 20 molecules of oxygen and 50 molecules of water for every one million molecules of nitrogen (https://curator.jsc.nasa.gov/lunar/laboratory_tour.cfm). As an experiment for examining the absorption of water by lunar regolith during the dissection of core 73001, a portable Fourier Transform Infrared (FTIR) spectrometer (Designs and Prototypes Model 102) covering the spectral range from 2-14 m was used to collect spectra from inside the nitrogen purged curation cabinet. An Ion Optics parabolic reflector illuminator with a 900 K filament was used to illuminate the sample. The combination of illuminator and spectrometer produced usable spectra from 2-5.2 m. The spectrometer field of view on the core was 13 mm. A sandblasted aluminum surface was used inserted in the cabinet as a semi-diffuse reflectance standard (Lucey et al. 2022). Spectra were obtained of several spots on the core a few hours after introduction of the spectrometer into the pristine cabinet (Fig. 9c). No obvious water band was present in these spectra. These spectra were monitored with time and following venting of the cabinet to the lab atmosphere (Lucey et al. 2022). Three conclusions were reached from these observations: (1) there was not a “build-up” of water within the nitrogen glove box with time that reacted with the regolith, (2) the spectrometer did de-gas with time and therefore contributed to long term water contamination, and (3) lunar regolith acts as a “sponge” soaking up water once the glove box was vented. With regards to (2), care must be taken when introducing instruments into a glove box during sample processing.
Organics
Contamination control coupons of ashed aluminum foil (∼3 × 3 cm) that witnessed the processing environment were used to evaluate conditions in the nitrogen glove box. Samples and witness foils were shipped in separate cleaned stainless-steel containers from JSC to NASA Goddard Space Flight Center (GSFC); empty stainless-steel containers were also sent as additional contamination witness material. Witness foils and empty stainless-steel containers were analyzed for cyanides, amino acids, amines, carboxylic acids, aldehydes, and ketones along with regolith samples as described by Elsila et al. (2020, 2022, 2024). Those preliminary studies indicate that curation and handling of lunar samples allow the analysis of organics at current state-of-the-art capabilities.
Fluorine
Small-area X-ray photoelectron spectroscopy (XPS) was performed on intermediate-sized (50-350 m diameter) glassy and crystalline grains at varied intervals through the upper core (73002) to identify discontinuities in surface composition and chemistry with depth. While XPS has a moderate elemental sensitivity (∼0.05 at-%) similar to that of energy-dispersive electron microscopy (EDX) its real strengths are (1) surface sensitivity (<10 nm) and (2) the identification and quantification of chemical and oxidation states.
XPS spectra are generated when mono-energetic X-rays (Al-Kα1: 1486.6 eV) are absorbed by atomic orbital electrons associated with atoms within the sample; photoelectrons are subsequently ejected from near surface atoms and carry an energy signature specific to their parent atom and local bonding environment. XPS surface specificity is a result of the electron inelastic mean free path (IMFP; typically, 1-3 nm), which ensures that only near-surface photoelectrons are detected without energy loss. Examination of collected XPS spectra from 73002 and 73001 grains show the expected photoelectron signatures from Si, O, Al, Mg, Ca, Fe, Na, Ti, etc. in varied concentrations, but additionally identified fluorine in concentrations of 2-3 at-% on the surface of each grain (Fig. 34). Subsequent EDX analysis, with information depths of 1-3 um, does not indicate F-bearing minerals such as apatite or fluorite in the grain bulk. Indeed, XPS depth profiles show that the F-signatures are localized to the grain surface(s).
Fig. 34.

XPS Survey spectra identify and quantify atoms in the near surface (<10 nm) of individual intermediate-sized (50-300 um) lunar grains over multiple intervals. Fluorine at the 2-3 at a % level was noted in all spectra, regardless of depth, as a likely surface contaminant. Subsequent investigation suggests that vapor deposition during Teflon bag sealing during processing and packaging of lunar materials under the curation N2-hood deposits a thin layer of fluorine on the surface of all exposed materials
Investigation was done into the sample handling of the grains prior to XPS analysis, where grains were transferred in atmosphere to a clean glass slide for optical petrography under cross-polarized light, before mounting in clean 99.998% indium foil. All materials and tools were ultrasonically-cleaned in HPLC-grade (>99.9%) methanol and isopropyl prior to use.
Direct XPS analysis of the indium foil substrate showed no F, while the glass slide (borosilicate) contained 1.2% F, about half the concentration identified on the lunar grains. In future work, F-free borosilicate slides of the PYREX brand originated by Corning Inc. would be preferred. To test the transfer of F from the glass slide to the grains, a silicon standard with 100 nm oxide was used as a proxy for the lunar particles and mounted in the same manner. No transferred F was identified on the SiO2 surface, indicating that the grain-handling methodology was clean at the analysis site, and investigation then began into the JSC curation processing procedures.
As an approved material for the Lunar Pristine Sample Lab and Returned Processing Lab at JSC, Teflon (polytetrafluoroethylene:PTFE:(C2F4)n) is used ubiquitously during sample handling within the curation N2 gloveboxes as lunar sample requests are fulfilled. Teflon may be used for tools (e.g., tweezers), caps for the stainless-steel sample vials, and N2-filled bags used for clean shipping. Of these possibilities, the potential for F-contamination due to Teflon-bag heat-sealing under the JSC Curation Processing gloveboxes appears most likely. When heated to above 425 °C, Teflon volatilizes and fragments into predominately C2F4 monomers with minor amounts of C3F6, CO2, and CO in air and under vacuum (Madorsky et al. 1953; Baker and Kasprzak 1993).
To verify the deposition of F during heat sealing in a predominantly N2 environment, six Si witness plates were prepared at the analysis site, with XPS analysis prior to Teflon-sealing exposure confirming the absence of F; these samples were then sent to JSC Curation where varied exposures of the Si to the Teflon bag heat sealing procedure were performed. Exposures included: one bare Si-plate sealed individually into a Teflon bag without exposure to any other seals; three others after being exposed in the cabinet while 5, 10, or 20 seals were made; and two Si-plates first placed into a stainless-steel transport container with Teflon cap—without exposure to other sealing events—then sealed individually into a Teflon bag. Samples were subsequently returned to the University of Virginia for XPS analysis, where all six witness plates showed minor F-contamination on their surfaces (Fig. 35). Fluorine surface concentrations of 0.5 at-% (1-seal), 0.7 at-% (5-seals), 0.7 at-% (10-seals), and 0.8 at-% (20-seals) were measured on the smooth Si surface with direct bag-sealing exposure. Inserting the Si into the capped stainless-steel cups prior to heat-sealing of the Teflon bags significantly reduces—but does not eliminate—the C2F4-vapor exposure, resulting in <0.1 at-% F on the Si surface.
Fig. 35.
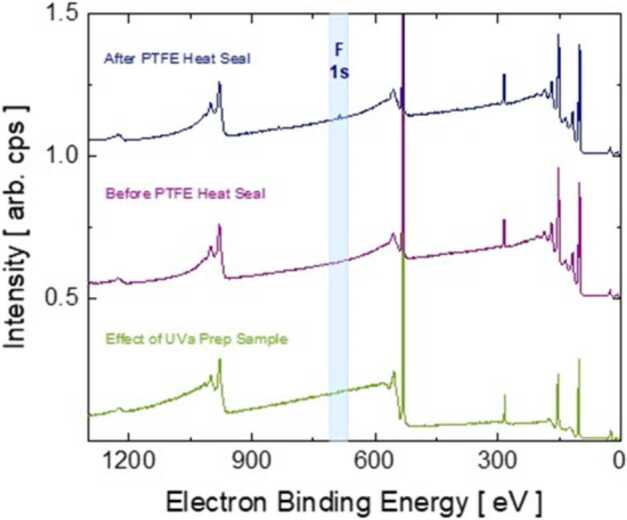
Heat-sealing of Teflon bags while under a N2-hood volatilizes PTFE material, depositing minor concentrations of fluorine across sample surfaces. XPS analysis of silicon-wafer witness plates show deposition concentrations of ∼1 at-% F on exposed Si surfaces, in comparison to samples with no exposure. Fluorine vapor deposition appears to saturate with one heat-seal event, as subsequent exposures increase F surface concentrations by only a fraction of an atomic percent. With their increased surface area, lunar grains are expected to acquire and retain more F-containing vapor than the flat Si witness plates
High energy-resolution, chemical analysis of the XPS spectra in the F-1s region allows bond identification and confirms PTFE origination of the deposited material. The F-1s photoelectron feature was deconvoluted into three peaks: (1) a dominant feature consistent with polyvinyl fluoride (−(CHF-CHF)n-) at an electron binding energy of 687.1 eV (Beamson and Briggs 1992); (2) a second feature consistent with F-Si-O at 687.9 eV (Antoun et al. 2022); and (3) a small peak (<10% of deposited-F) at 689.6 eV consistent with polymeric PTFE (Beamson and Briggs 1992). Interpretation of fluorinated hydrocarbons and C-CF/C-F in the F-1s feature was corroborated by features within the carbon (C-1s) region, with peaks at 286.8 eV and 288.0 eV binding energies (Clark et al. 1971, 1980). Thus, moving forward, for surface specific analysis of extraterrestrial materials, such as lunar grains or returned asteroid fragments, the practice of sealing samples in Teflon bags should be avoided to prevent inadvertent contamination of pristine specimens with C and F.
Sample Allocation
Introduction
NASA’s overarching philosophy with regards to sample allocation from missions was to preserve samples for future generations of scientists (e.g., Allen et al. 2011). This philosophy was incorporated into numerous mission announcement of opportunities requiring that curation and allocation plans must include a 25% limit available to the mission’s science team (e.g., https://newfrontiers.larc.nasa.gov/NF3/PDF_FILES/NF-3_Phase-A_Guidelines_v15.pdf). Given that ANGSA is organized like the ground element of a sample return mission, the 25% rule was applied to all sample allocations made to the ANGSA science team to conduct their proposed science. The 25% rule states that the science team cannot use more than 25% of any distinct sample type as part of their project science investigations. This rule comes from NASA curation best practices and is codified into NASA Procedural Requirements that are currently going through review. It applies to other sample-return missions like OSIRIS-REx and is intended to strike a balance between allowing a science team to accomplish all their funded work with the returned samples while also conserving sufficient samples for research to be conducted by non-team members within the broader scientific community now and in the future. Any sample requests made by the ANGSA Science Team were approved for allocation if they followed the 25% rule and that it could be demonstrated that the work to be done was part of the work funded in one of the nine ANGSA proposals.
Double Drive Tube
Prior to dissection and following extrusion, material from the derinding process was allocated for the analysis of organics and volatiles such as H and D/H. These types of analyses were considered to have the highest possible chance of being contaminated during dissection. Soon after the dissection of the double drive tubes, ANGSA team members requested and were allocated the <1 mm size fraction for bulk regolith analysis and for further processing such as sieving. Sample 73002 was allocated first and followed by 73001. In the case where numerous labs would be conducting analyses of a single sample split, the requesters devised a strategic flow chart (Fig. 36). Cosmogenic radionuclide sample processing and allocation were distinct in that core 73002 was processed in two ways: in 0.5 cm sections for the entire core, and (in the upper 1 cm of the core) in 0.2-0.3 cm sections to study the solar-cosmic-ray produced 26Al depth profile in detail.
Fig. 36.

Strategy diagram illustrating the distribution of a set of samples for the analysis of IS/FeO, chemistry, grain size analysis, and surface analysis from a single allocated sample split from 73002. Flow diagram created by ANGSA team member R. Morris
For all allocations, regolith was placed in a stainless-steel container and double sealed in Teflon bags. This allocation process occurred in the nitrogen glove box. The samples were express-mailed to the appropriate PI. In the case of H and D/H measurements, samples were stored and processed in a nitrogen glove box upon receipt.
CSVC Gas
After extraction, PE analyses were conducted at University of New Mexico and Washington University at St. Louis. Gas samples from both the OVC and the CSVC were allocated to these labs in stainless-steel containers with valves (Fig. 33g). After these PE analyses were accomplished, the September 2022 Astromaterials Newsletter released the Preliminary Catalog Information about the Gas Extraction from Sample 73001 and announced the availability of gas samples (https://ares.jsc.nasa.gov/astromaterials-newsletter/vol4-no2/apollo-sample-news.cfm). Gas samples will be allocated in containers like the container in Fig. 33g or other appropriate containers provided by PI. A long-term storage plan was not included in the ANGSA Science Curation Plan for the gas samples.
Frozen Samples
Several PIs required frozen samples to carry out their proposed science plans (e.g., preservation of volatiles, organics, natural thermoluminescence). As noted above, the requested frozen samples were removed from cold storage at JSC and processed at −20 °C in a pristine cold-processing glovebox. For the allocation of frozen samples for organic analyses, frozen samples were placed in cleaned stainless steel containers, sent overnight in cold shipping containers to ensure that they remained frozen throughout transit, and were placed in a −20 °C freezer upon arrival at the Goddard Space Flight Center (Elsila et al. 2022).
ANGSA Lessons Learned with Relevance to the Artemis Program
Introduction
There are numerous lessons learned from the ANGSA initiative that are directly relevant to future NASA missions to the lunar surface, including Artemis. This section discusses activities and actions that worked well and should be repeated in the future, possible improvements to ANGSA-like activities at a variety of levels, and suggestions for mission planning, curation, and analyses for future lunar sample return missions that are either robotic or human in nature. Lessons learned from ANGSA are evaluated for their application to Artemis as related to Team, Curation, Preliminary Examination, Sample Allocation, Enabling Science, and Activities during future pandemics or similar long-term disruptions to lab access.
Team
ANGSA Activity
ANGSA was designed to function as a low-cost sample return mission per original concepts identified by (Fig. 33g). Nine teams were selected through a review of individual proposals submitted to the NASA ANGSA program. The nine teams were combined and organized as a single multi-generational and international Science-Engineering Team with a well-defined leadership structure. The ANGSA team grew as dictated by scientific needs. There were over 90 scientists and engineers associated with the ANGSA team. This approach was important in that it (a) provided a multi-generation link between the Apollo generation and future generations, and (b) trained many members in mission planning and curation activities in preparation for Artemis.
Team teleconferences were held for various subsets of team members: (a) team PIs, (b) the complete ANGSA science, curation, and engineering team members, (c) various subcommittees (e.g., gas extraction, organics, stratigraphy, lithics), and (d) Individual funded teams. This helped to coordinate sample allocation and measurement activities and to exchange data and ideas. A team website was created and updated by C. Shearer and the LPI to maintain curation information, team products (manuscripts, abstracts), and team tools.
The team influenced ANGSA curation protocols and tool design during the first three-year funding cycle. This included the design of the CSVC gas extraction tools and protocols associated with gas extraction, preliminary examination protocols, and protocols tied to monitoring contamination issues.
The Lunar and Planetary Institute (LPI) provided office space, meeting space, technical support for ANGSA team activities (e.g., JSC badging) and for the ANGSA public and team communication website (https://www.lpi.usra.edu/ANGSA/). They also organized telecons for various team communications. The LPI was conveniently located adjacent to JSC and provided easy access to JSC curation. This space and technical assistance were not supported by the ANGSA initiative but were gratefully accepted.
Lessons Learned
There are many lessons learned from the ANGSA initiative regarding team design and activities that are directly relevant to the ANGSA Geology Science Team and Artemis Sample Analysis Teams.
Science team(s) should be organized early with two-step funding (e.g., initially funded at a lower level at least two years before the samples are opened) to support planning (e.g., sampling and curation tools, curation strategy and protocol). This would allow science funding and sample allocation to be better coordinated. Further, due to the short duration of funding (and exacerbated by COVID-related delays), there was limited time and funding available to follow-up on unexpected observations. Proposing to an established program for follow-up investigations will be required.
The sample analysis teams should have a diversity of disciplines, beyond petrology, mineralogy, chronology, and geochemistry. These additions should include remote sensing and spectroscopy, engineering, geomorphology, and mapping expertise. This integration of expertise will enable samples to be placed within a planetary, geological, and technological context. Further, engineers assisted the ANGSA team to develop new tools for sample curation and allocation.
The Sample Science Teams funded through Artemis should play an integral part in the curation-led activity of Preliminary Examination/sample catalog production while simultaneously executing the mission-driven science requirements of the mission. In the context of Artemis, this should clearly involve the Artemis Science Team and Geology Team but could involve members of the community that will eventually study the samples. Further, involving early career members (undergraduate, graduate, post-docs) in this process is critical for growing the lunar mission community.
After team selection, opportunities to participate on the Artemis Science teams should be solicited through a participating scientist program. Early selection of science team members would enable their involvement in the design of both the team website and PE documents. Interactive team science, data/sample sharing, and publications should be guided by a Rules of the Road document and coordinated by team meetings at various levels.
LPI support was critical to ANGSA success. Therefore, the use of the LPI or similar organization as part of the infrastructure to support lunar sample return activities is important. It is important to have this facility near JSC curation for access of team members to samples during PE, and sample selection.
Curation
ANGSA Activity
ANGSA was enabled by the overarching philosophy of preserving samples for future generations that were developed by NASA and the science community in the early 1970s. The ANGSA initiative followed a similar philosophy of preserving ANGSA samples for post-ANGSA sample activities. A sample Preliminary Examination Document was prepared during the life of the ANGSA program, but due to COVID issues, the longer-than-planned sample processing, and extensive tool design, final PE documents were not available to team members for most sample selections. However, these documents will be made available for future requests of ANGSA samples.
Multiple types of curation environments were used during the ANGSA initiative. These curation environments included the nitrogen glove boxes in building 31N at JSC and a temporary cold curation facility (−20 °C) that was designed, built, and ceased operation during the ANGSA program. A helium processing glove box was initially considered for the ANGSA program for processing Apollo 15 samples from a Special Environmental Container (SEC) that had previously been processed at the University of California at Berkley and stored in He since that time. However, those samples were not needed to conduct the scientific tasks in the funded ANGSA proposals. The team influenced ANGSA curation protocols and tool design during the three-year funding cycle. A variety of tools and instruments were used during curation that helped the development of a dissection strategy and enabled science. These included X-ray computed tomography (XCT) imaging of core and individual fragments and multispectral imaging of core. XCT data allowed examination of clasts during COVID shutdowns (i.e., enabling remote science).
An overarching philosophy taken for curation, sample preparation, and allocation was to do no harm to the samples that would affect current and future studies. However, this approach was difficult to follow in some cases. For example, XCT analyses that were carried out for the benefit of most science and curation activities could compromise a smaller set of analyses (e.g., thermal luminescence). On the other hand, processing samples to do no harm potentially complicated some important science (e.g., science that would have been gained through heating CSVC to 90 °C or ultrasonic vibration of CSVC to extract volatiles) because other important proposed measurements would have been compromised by these extraction methods.
The gas from the CSVC was extracted using tools designed and built by ANGSA team members from the University of New Mexico, Washington University St Louis, and the European Space Agency. The extraction system consisted of a gas extraction manifold system and a CSVC piercing tool. A baseline set of requirements, hardware, and sequence of events was demonstrated for a successful gas extraction procedure, which can inform a new generation of (volatile-rich) sample return missions, e.g., Artemis, Mars Sample Return. Further analyses and synthesis of the CSVC and piercing tool performance will also inform the development of easy-to-use containers with longer lasting and contaminant-free seals. The CSVC was not opened until year 3 of the ANGSA program. ANGSA was funded as a three-year program. In preparing to design and build tools for opening and sampling the CSVC, it was critical to have access to highly accurate schematics and physical duplicates of flight hardware (e.g., CSVC, SESC) that had been used by Apollo. A curation-storage plan for CSVC extracted gas was not considered. It was anticipated that all gases would be analyzed during ANGSA activities. Consequently, gas samples were made available to non-ANGSA scientists shortly after being made available to ANGSA team members.
Witness plates were used in the nitrogen glove box to evaluate contamination. This was particularly useful and successful in the evaluation of organic contamination. Follow-on studies evaluated the extent of F contamination of samples through the heat sealing of Teflon within the nitrogen glove box.
Lessons Learned for Sample Curation
It is both important and conscionable to continue to preserve and/or conserve samples for future generations of planetary scientists as analytical approaches and science questions will constantly evolve. ANGSA was carried out only because of this philosophy, which was established in the 1970s.
Early definition of mission goals will influence the curation facilities and protocols (organic contamination, cold curation requirements, glove box gases and gas quality). Further, the early definition of mission goals and selection of the sample science teams will influence tools designed, built, and used during curation (e.g., new tools for handling frozen or gas samples).
Early training and cross-training of curation staff are critical. This training needs to start at least two years prior to sample return and be closely linked to potential samples and mission science. Curation team staffing and curatorial processes should be streamlined well before sample return especially for “unique” sample types. New curation tools (e.g., XCT, multi-spectral imaging) are a benefit to curation strategy. There are several examples of this benefit to core dissection. XCT analysis identified the locations of many lithic fragments in the core. Multi-spectral analysis identified a diagonal change to core stratigraphy.
Witness plates should be used to identify and reduce contamination (e.g., organics, volatile elements).
During the dissection of the 73001 core, it was advantageous to have a single processor dissecting the core with several processors assisting in this activity. However, with multiple types of samples (core, frozen, gas, rocks) being returned, processing can be handled by multiple processors. This would reduce sample processing time.
Sealed samples should have a valve or valve port that eases volatile sampling on Earth during curation activities but does not hinder lunar surface operations by astronauts. Hardware should be tested prior to flight.
Although the piercing tool was successfully used during the CSVC 73001 gas extraction campaign, allowing the sample container to be breached without damaging the underlying sample, the lack of planning on the front end to open and extract the gas sample meant that considerable time, effort, and resources were needed during ANGSA to open the CSVC and extract the gas. The proposed design of the piercing tool fulfilled its main objectives, but certain trade-offs made during the development process were needed. Ensuring early definition of mission goals and importantly understanding the science and curation needs was shown to be critical for providing clear and informed driving requirements up front for efficient hardware development and verification. This is supported by also having accurate electronic and physical records of all the hardware components that are involved. Nonetheless, compromises in the design of the piercing tool and GEM systems had to be made to account for uncertainties surrounding the CSVC 73001 and its contents. The main unknowns were the overall CSVC length, its exact diameter, the exact thickness of the wall to be pierced, the pressure inside the container, the position of the PTFE cap, and the properties of the aged PTFE material. Variation in those parameters was accounted for by a flexible and resilient design (i.e., large chamber, increased clearances, spring loaded assembly) and validation tests across a variety of scenarios (i.e., different pressures, wall thicknesses, PTFE cap state). This came at the cost of increased validation and testing time and lower non-critical performances (e.g., longer evacuation time, less ergonomy). For the development of similar hardware in the future, those challenges can be mitigated by taking steps early in the development and manufacturing of sampling equipment. Based on the lessons learned from this work, the following suggestions in this regard are made.
Downward compatibility of future tools should be enhanced by design, and potential additional uses should be considered. This should be assessed early in the development process, in collaboration with science and curation teams. Possible improvements can include a high level of standardization and redundancy around system interfaces (i.e., mechanical, pneumatic, electronic), and the factoring in of additional requirements derived from curation needs.
For flight and curation hardware, advanced information on each individual part manufactured should be collected and curated. This should include elements such as exact dimensions and material properties. This will enable more efficient design and better integration of new tools with legacy hardware. By leveraging modern technologies such as 3D scanners, virtual twins containing all relevant information should be produced, to further help integration and design tasks.
Physical replicas of critical hardware should also be manufactured and curated to allow for validation tests with hardware in the loop to be conducted for similar operations in the future. This would also enable the ageing of materials and components (e.g., seals, PTFE cap) to be assessed; further research and recording of hardware degradation during flight and overtime is recommended. Ideally, replicas should be subjected to the same environmental conditions as the original counterparts during curation. For example, having access to the flight spare drive tube provided critical information on the presence of perforations through direct examination, which informed driving design requirements such as the need to avoid piercing the PTFE cap.
The gas sampling dilemma faced during the ANGSA opening of the CSVC 73001 could be avoided in the future by defining the science associated with each sealed sample container and designing not only the container, but also the sampling strategy, allocation, and longer-term preservation.
Dust is detrimental to the proper operation of seals and valves. All designs and testing should consider this factor.
Coordination/collaboration between the ANGSA gas extraction team and Artemis curation would be beneficial to ensure lessons learned from ANGSA are incorporated into Artemis curatorial procedures.
ANGSA cold sample processing was completed successfully, demonstrating the effectiveness of the Cold Sample Processing Facility’s design. However, a number of lessons were learned in the development and use of this facility that should be incorporated into future cold-curation facility designs to achieve more efficient development, build-up, checkout, and operations.
A dedicated cold curation facility should be used for future cold sample processing to avoid schedule, cleanliness, and logistical incompatibilities with non-curation projects.
New, dedicated cold curation equipment should be used to the greatest extent possible. While the presence of an existing walk-in freezer and glovebox were initially of great benefit, the resources and time needed to perform extensive repairs and retrofits/modifications resulted in significant delays to the facility build-up process.
An inventory of specialty hardware should be kept in stock to avoid long lead times for these uncommon items. Specialty/uncommon items include polyurethane glovebox gloves, Teflon gasket material, cold-adapted pressure gauges/check valves/etc., and cold-tolerant oxygen monitors.
Future cold curation facility designs should include adaptations for gas composition sampling and monitoring, larger spaces for gowning, extended curatorial gas lines inside the freezer to ensure gasses are as close to sample temperature as possible, and greater internal freezer volume for processing operations.
Safety considerations (oxygen monitoring, smoke detection, alarm systems, humidity mitigation to avoid ice buildup, and non-slip flooring) should be solicited and built into the facility design at the outset to avoid schedule delays for safety modifications.
Separate gloveboxes will be needed for samples from different planetary bodies, or for those curated using non-standard curatorial gases (i.e., helium or argon). Therefore, plumbing, and cross-contamination considerations should be factored into the design when planning future cold curation processing facilities.
Preliminary Examination
ANGSA Activity
ANGSA was designed to function as a low-cost sample return mission that included the science team to be involved in the Preliminary Examination (PE). The PE Team was organized as a multi-generational and international Science-Engineering Team with a well-defined leadership structure. During the Pass 1 PET activities, team members participated in PE for one week at a time. Each week PET members were trained during the first day of the PE and review of PE observations were made during the last day of the week.
PE activities were slower with PET members involvement, but such visits are important for training the next generation of scientists and engineers. PET activities (73002) were sharply curtailed from early 2020 through early 2021 due to COVID-19 protocols. Team influence on ANGSA Preliminary Examination protocols and tool design occurred later, during the three-year funding cycle of ANGSA. Tools constructed for PE and allocation during ANGSA activities are illustrated in Appendix 1.
The final PE document was not completed until the fifth year of ANGSA activity. The desire to have a PE document available to the ANGSA science team for requesting samples prior to the end of the three-year ANGSA grants was not met. This was mitigated by regular team meetings and discussions so that the team was collectively aware of what was in each of the drive tubes and what samples were available for request. For example, XCT imaging of >4 mm size fraction was available so that ANGSA team members could request thick sections of those >4 mm lithic fragments. In addition, the PE document is available for post-ANGSA sample requests as part of the sample catalog for 73001 and 73002.
Lessons Learned for Preliminary Examinations
For Artemis, a well-defined set of preliminary examination data should be produced in support of a sample catalog and, prior to the publication of the catalog, to support early sample allocations for mission-driven science investigations. These PE data being readily available to the science team and science community will increase scientific return and efficient use of samples. Some of the following questions need to be evaluated: How quickly and fully should this PE data be released to the broader science team? When should the sample catalog be released to the world?
The PE and dissection of core samples are time consuming. For ANGSA, the best-case scenario was the processing of core 73001 that took 2 months to dissect. The length of time did not include gas extraction or other pre-dissection tasks. Therefore, for Artemis III, the examination of collected core will far exceed the amount of time allocated to the science team to carry out the PE. Therefore, core-dissection should be considered an activity that occurs after the initial publication of a sample catalog and hence after the initial phase of PE for Artemis III. Alternatively, if core dissection is seen as a prerequisite to the initial release of a simple catalog, more time will likely be needed for PE than the typical 6 months granted to sample return missions.
Analytical facilities at the Johnson Space Center are important for PE being carried out by team scientists and curation. They should be integrated into missions and funded appropriately.
A variety of imaging (XCT, multi-spectral) are needed during PE of Artemis samples.
During ANGSA, there was substantial overlap between PE and sample science. The PE for Artemis must recognize this problem so that data collected in support of the sample catalog (PE) can be distinguished from data collected with the purpose of writing publications to fulfill mission science goals.
Some sample measurements may be time-sensitive and will need to be released early to the science community or utilize new technologies that prevent terrestrial effects (atmosphere, temperature). These measurements must be identified early and included in the Artemis PE plan.
Although the integration of the science team into preliminary examination activities increases the duration of this activity, it is scientifically additive. Perhaps having longer cycles for science team members to be involved in curation PE activities would increase the efficiency of PE and increase the science benefit.
Sample Allocation
ANGSA Activity
Samples allocation was started in year 2 of many team budgets. Sample allocation continued into the 5th year of ANGSA activity. The 5th year was supported by no-cost extensions (NCE) to teams.
Samples were made available to the funded ANGSA teams as early as possible in the core dissection process, with the first samples allocated in early 2020, and most samples after the labs reopened after closures due to COVID-19. Samples were made available to the rest of the science community in March 2023, after ANGSA teams started their work. The first samples allocated to the ANGSA Science Team were those associated with time-sensitive analyses, including samples for organics and bulk hydrogen isotopic analyses. Samples were allocated for preliminary examination and science purposes nearly simultaneously. Early dissection and allocation of samples for science were not always based on PE documentation. For example, the sharp, nearly horizontal contact between mature and immature horizons in 73002 was not recognized until multi-spectral imaging was completed (Sun et al. 2021; Fig. 9b).
During ANGSA, sample containers were designed and developed for the transport of sample materials from a clean curation environment to high-vacuum instruments without terrestrial contamination (Sect. 6.6).
There were several potential approaches for sampling and allocating potential gases from the CSVC. These included sampling at room temperature, warming the CSVC to 90 °C, and ultrasonic vibration of the core. The dilemma was that sampling by any of these approaches could affect other science to varying degrees. The selection was based on what approach affected the sample the least. However, important science was potentially lost with this choice.
Lessons Learned for Sample Allocation
New curation tools (e.g., X-ray computed tomography (XCT), multi-spectral imaging) will benefit allocation.
Particular sample measurements may be time sensitive and will need to be allocated early to the science community. These measurements will need to be defined in the earliest stages of Artemis.
An examination of potential containment vessels for terrestrial transportation should be made within the context of science goals. Time, funding, and input from the science team is required to accomplish this goal.
The gas sampling dilemma faced during ANGSA opening of the CSVC 73001 could have been resolved by defining the science associated with each sealed sample container and designing not only the container, but also the science, sampling strategy, allocation, and curation strategy.
Imaging data such as XCT will enable science to be done during sample processing. The data must be disseminated in a timely and equitable manner.
Prior to the production of a sample catalog, communication of early PE results between curation and the science team is crucial in order to support early allocations of sample for mission-driven science investigations in the earliest stages of sample processing. NASA needs to clearly define what information is needed to complete an initial sample catalog. This will inform how samples will be analyzed during PE and what/when opportunities will be available to the community in the years/decades to come. Allocation of samples needs to occur in a fair and transparent manner to both the Science team and the broader scientific community. Previous and contemporary community allocation committees such as LLSAPT, CAPTEM, and AARB had a record of fairness.
Enabling Science
ANGSA Activity
Linking orbital and surface observations placed ANGSA within a well-defined science context and added value to the sample suite. Because ANGSA program recipients were initially prohibited from applying to NASA for COVID-19 funding, graduate student and post-doctoral researcher pay ran out before the PE and science investigations could be completed. Many teams exhausted their budgets to support personnel for 6-8 months of inactivity due to the pandemic.
Several types of measurements that are late in the analytical campaign (e.g., chronology) are highly dependent upon detailed PE and earlier science measurements. Therefore, the delay in these earlier observations resulted in postponement of these types of measurements.
There is an aspect of discovery associated with the types of samples encountered in the core. For example, are the lithic fragments in the Station 3 core appropriate for chronology and associated science? In many cases, sample analysis flow charts were constructed by analysis teams. This approach enabled coordination among science team members and conserved samples (Fig. 36). However, flow charts for sample allocations and analysis were not constructed by all teams and among teams.
Lessons Learned for Enabling Science
Funding flexibility must be found in anticipation of other unforeseen national-international events to ensure completion of critical deliverables.
Local, regional, and planetary geologic context increases the scientific value of samples. Therefore, it is important to have science backroom teams for specific landing sites and missions to act as a resource to the astronauts as they select samples for return to Earth. Further, defining sample context measurements through payload/in-situ measurements would enable/enhance the science value of the returned samples. It is important to understand the duration and complexity of surface context measurements and their influence on surface activities.
Identification of pathways for accessing early documentation of samples would enable measurements later in the analytical campaign. For example, provide early XCT analyses of samples that are appropriate for certain types of measurements.
Sample science success for missions can be enabled through (a) defining science and appropriate samples prior to missions, and (b) realizing that not all samples may be appropriate to answer mission objectives but still may reveal important unanticipated results. For (a), it is important to have sample scientists engaged in mission planning. For (b), not all future science objectives can be anticipated before the constituents of the sample cache are known and therefore flexibility in team measurements and objectives is required. It would be valuable to add science members and analytical approaches through a participating scientist program to help determine what measurements are considered part of mission science and what investigations will be led outside the mission science team by members of the broader scientific community.
Coordination of sample allocation and analysis provides a more efficient use of samples and links team science activities. However, it must be recognized that not all samples are appropriate for coordinated team activities or that all science activities are linked.
It would be helpful to have a funding mechanism to make it easier for the exchange of students among participating analytical facilities. Cross-generational teams helped to transfer knowledge in all directions.
Activities During Future Pandemics or Other National/International Emergencies
ANGSA Activity
Science team engagement during a pandemic was maintained through remote, regular status meetings, which included discussion of data in hand (XCT data) and geologic context.
Due to institutional requirements or student-staff commitments, research funds were spent during the early stages of ANGSA prior to samples being released.
ANGSA activities were given high priority during the pandemic at JSC and NASA HQ. This enabled curation activities to continue and ANGSA sample science to be completed.
During the pandemic, science team access to JSC curation for sample selection or secondary processing (e.g., selecting volcanic glasses) was minimized and/or eliminated, leading to delays.
Lessons Learned for Future Pandemics or Other National/International Emergencies
It is impossible to prepare for the unknown, and it is unknown if Artemis samples will be returned during a pandemic or other events that will completely upend a plan. For Artemis, there will be some knowledge of the sample site, context, etc. Preliminary sample analysis can be augmented by an understanding of the geologic context of the sample sites.
It will be necessary to develop fallback plans for sample processing and allocation during future pandemics or other national/international emergencies.
Final Comments
The ANGSA was an international effort that involved over 90 scientists and engineers from the United States and Europe. This was a multigenerational research team that included members who participated in the Apollo program in the mid-20th century to current undergraduate students born in the 21st century. The ANGSA effort benefited and was solely enabled because of the foresight of NASA and its early advisors who established an overarching philosophy of preserving Apollo samples for future generations. Untouched Apollo samples are still available for additional research efforts. The timing of this program, the composition of the team, and the preservation of unopened Apollo samples facilitated this generational handoff from Apollo to Artemis that prepares Artemis and the lunar sample science community for success.
Supplemental and Complementary Information
Supplemental and complementary information is presented in DRYAD Data repository. These data https://datadryad.org/stash/share/ExUqAZp0I4sLQkzxyrTNdnk1PmqUOrT7Q6iJvZamJts (prepublication URL) include additional text, piercing tool video and procedures, videos of human activity at Station 3 during sample collection, flyby video constructed from LRO imaging, XCT videos of core and individual lithic fragments.
Funding
The Consortium for the Advanced Analysis of Apollo Samples (CAAAS) at the University of New Mexico (UNM) and associated institutions was funded by the Apollo Next Generation Sample Analysis (ANGSA) program, 80NSSC19K0958. Completion of the manuscript was funded by SSERVI grant to the CASA Moon team at the UNM (80NSSC23M0177), the UNM Grand Challenge, and the Institute of Meteoritics. WUStL (Gillis-Davis), SLAC (Sokaras), and the University of Hawaii (Ishii) were supported by NASA ANGSA grants 80NSSC20K1600, 80NSSC19M0134, and 80NSSC20K1599, respectively. In addition, the NASA SSERVI to the University of New Mexico was responsible for the final steps in the completion of this study as it pertains to the future exploration of the Moon, NNH18ZDA001N. Beamtime for soft X-ray absorption spectroscopy was provided by the Stanford Synchrotron Radiation Lightsource, a division of SLAC National Accelerator Laboratory, operated by Stanford University and supported by the U.S. Department of Energy, Office of Science, Office of Basic Energy Sciences under Contract No. DE-AC02-76SF00515. The authors thank Dr. Sang-Ju Lee and Dr. Dennis Nordlund for technical support at beamline 10-1 to guarantee success data acquisition. Transmission electron microscopy and EELS mapping were performed at the Molecular Foundry, which is supported by the Office of Science, Office of Basic Energy Sciences, of the U.S. Department of Energy under Contract No. DE-AC02-05CH11231. The contribution from K. Joy and the University of Manchester research group was supported by the Royal Society (URF\R\201009 and RF\ERE\210158).
Declarations
Competing Interests
The authors declare that they have no conflict of interest.
Footnotes
ANGSA Science Team list at https://www.lpi.usra.edu/ANGSA/teams/ (cshearer@unm.edu).
C.K. Shearer, F.M. McCubbin, S. Eckley, F. McDonald, H.H. Schmitt, R. Parai, L. Sun, C. Dukes, A. Sehlke, T.M. Erickson and N. Petro are coordinators of sections.
C.K. Shearer and F.M. McCubbin are ANGSA Co-Leads.
Publisher’s Note
Springer Nature remains neutral with regard to jurisdictional claims in published maps and institutional affiliations.
References
- Allen C, Allton J, Lofgren G, Righter K, Zolensky M (2011) Curating NASA’s extraterrestrial samples—past, present, and future. Geochem 71(1):1–20 [Google Scholar]
- Allton J (1989) Catalog of Apollo lunar surface geological sampling tools and containers. Lockheed Engineering and Sciences Company Houston, Texas. Prepared for NASA/JSC Solar System Exploration Division. JSC23454 [Google Scholar]
- Amick CL, Lewis EK, Mitchell JL, Allums-Spencer K, Davis RE, Collins DL, McCubbin FM et al. (2021) Cleaning the ANGSA cold curation Apollo-era glovebox - training the next generation. In: 52nd Lunar and Planetary Science Conference 2021, vol 2506, [Google Scholar]
- Antoun G, Girard A, Tillocher T, Lefaucheux P, Faguet J, Maekawa K, Cardinaud C, Dussart R (2022) Quasi in situ XPS on a SiOxFy layer deposited on silicon by a cryogenic process. ECS J Solid-State Sci Technol 11(1):013013 [Google Scholar]
- Arvidson R, Drozd R, Guinness E, Hohenberg C, Morgan C, Morrison R, Oberbeck V (1976) Cosmic ray exposure ages of Apollo 17 samples and the age of Tycho. In: Proc. Lunar sci. conf. 7th, pp 2817–2832 [Google Scholar]
- Baker BB, Kasprzak DJ (1993) Thermal degradation of commercial fluoropolymers in air. Polym Degrad Stab 42(2):181–188 [Google Scholar]
- Baldwin RR (1972) Mission science planning document Apollo Mission J-3. (Apollo 17)
- Bandfield JL, Ghent RR, Vasavada AR, Paige DA, Lawrence SJ, Robinson MS (2011) Lunar surface rock abundance and regolith fines temperatures derived from LRO diviner radiometer data. J Geophys Res 116:E00H02. 10.1029/2011JE003866 [Google Scholar]
- Beamson G, Briggs D (1992) High resolution monochromated X-ray photoelectron spectroscopy of organic polymers: a comparison between solid state data for organic polymers and gas phase data for small molecules. Mol Phys 76(4):919–936 [Google Scholar]
- Bell SK, Joy KH, Nottingham M, Tartese R, Jones RH, Kent JJ, Shearer CK, the ANGSA Science Team (2022) Using QEMSCAN mapping techniques as a method of identifying potential exogenously-derived components nn Apollo 17 73002 continuous core thin sections. In: Apollo 17-ANGSA workshop 2022. Abstract # 2008 [Google Scholar]
- Bierhaus EB, Clark BC, Harris JW, Payne KS, Dubisher RD, Wurts DW, Hund RA, Kuhns RM, Linn TM, Wood JL, May AJ (2018) The OSIRIS-REx spacecraft and the touch-and-go sample acquisition mechanism (TAGSAM). Space Sci Rev 214:1–46 [Google Scholar]
- Bland DA Jr, Blevins RV, Olmsted JG, Olmsted RJ (1972). Final Apollo 17 lunar surface procedures
- Boyce JM, Mouginis-Mark P, Robinson M (2020) The Tsiolkovskiy crater landslide, the Moon: an LROC view. Icarus 337:113464 [Google Scholar]
- Burgess KD, Stroud RM (2018) Coordinated nanoscale compositional and oxidation state measurements of lunar space-weathered material. J Geophys Res, Planets 123(8):2022–2037. 10.1029/2018JE005537 [Google Scholar]
- Burlingame AL, Holland P, McFadden WH, Simoneit BR, Wilder JT, Wzolek PC (1971) UCB Space Science Laboratory organic clean room and lunar material transfer facilities. Univ. California, Space Sciences Lap Rpt. [Google Scholar]
- Butler P (1973a) Lunar Sample Info. Catalog, NASA JSC. JSC Astromaterials Curation Facility Cleaning Procedures for Contamination Control (JSC-03243 Rev E)
- Butler P (1973b) Lunar sample information catalog, Apollo 17. The Center
- Cadogan PH, Turner G (1976). The chronology of the Apollo 17 Station 6 boulder (No. INIS-MF–3149)
- Cantando ED, Dukes CA, Loeffler MJ, Baragiola RA (2008) Aqueous depletion of Mg from olivine surfaces enhanced by ion irradiation. J Geophys Res 113:E09011 [Google Scholar]
- Carpenter PK, Ogliore RC, Minocha A, Yen CJK, Jolliff BL, the ANGSA Science Team (2022) Advances in quantitative EPMA compositional mapping applied to Apollo 17 Core 73002, 6015-6018. In: Apollo 17-ANGSA workshop 2022. Abstract # 2031 [Google Scholar]
- Carrier WD III, Bromwell LG, Martin RT (1973) Behavior of returned lunar soil in vacuum. J Soil Mech Found Div 99:979–996 [Google Scholar]
- Chaves LC, Thompson MS, Loeffler MJ, Dukes CA, Szabo PS, Horgan BH (2023) Evaluating the effects of space weathering on magnetite on airless planetary bodies, ICARUS-D-23-00158. In review
- Clark DT, Kilcast D, Musgrave WKR (1971) Molecular core binding energies for some monosubstituted benzenes, as determined by X-ray photoelectron spectroscopy. J Chem Soc, Chem Commun 10:516b–518 [Google Scholar]
- Clark DT, Feast WJ, Tweedale PJ, Thomas HR (1980) ESCA applied to polymers. XXVI. Investigation of a series of aliphatic, aromatic, and fluorine-containing polycarbonates. J Polym Sci, Polym Chem Ed 18(6):1651–1664 [Google Scholar]
- Collins GS, Melosh HJ (2003) Acoustic fluidization and the extraordinary mobility of sturzstroms. J Geophys Res 108(B10):2473. 10.1029/2003JB002465 [Google Scholar]
- Crozaz G, Drozd R, Hohenberg C, Morgan C, Ralston C, Walker R, Yuhas D (1974). Lunar surface dynamics: Some general conclusions and new results from Apollo 16 and 17 (No. NASA-CR-138489)
- De Groot FMF, Grioni M, Fuggle JC, Ghijsen J, Sawatzky GA, Petersen H (1989) Oxygen 1s X-ray-absorption edges of transition-metal oxides. Phys Rev B 40(8):5715–5723. 10.1103/PhysRevB.40.5715 [DOI] [PubMed] [Google Scholar]
- Denevi BW, Robinson MS (2020) Key science investigations of the Moon’s polar regolith—a nonvolatile perspective. In: Lunar surface science workshop, vol 2241, p 5122 [Google Scholar]
- Dorfeld WG, Hudson JB, Zuhr R (1976) The interaction of an O2 molecular beam with an Fe(110) surface. Surf Sci 57(2):460–474 [Google Scholar]
- Drozd RJ, Hohenber CM, Morga CJ, Podosek FA, Wroge ML (1977) Cosmic-ray exposure history at Taurus-Littrow. In: Proc. Lunar sci. conf. 8th, pp 3027–3043 [Google Scholar]
- Dukes CA, Baragiola RA (2011) Radiation-enhanced aqueous dissolution of minerals. MRS Online Proc Libr 1298:131–139. mrsf10-1298-r04-05 [Google Scholar]
- Dukes CA, Baragiola RA, McFadden LA (1999) Surface modification of olivine by H+ and He+ bombardment. J Geophys Res 104(E1):1865 [Google Scholar]
- Durrani SA (1972) Refrigeration of lunar samples destined for thermoluminescence studies. Nature 240(5376):96–97 [Google Scholar]
- Durrani SA, Khazal KAR, Ali A (1977) Temperature and duration of the shadow of a recently-arrived lunar boulder. Nature. Preprint. 10.1038/266411a0 [Google Scholar]
- Elsila JE, Aponte JC, Dworkin JP, Glavin DP, McLain HL, Simkus DN, the ANGSA Science Team (2020) Analysis of volatile organic compounds in the Apollo Next Generation Sample Analysis (ANGSA) 73002 core sample. In: 51st Lunar and Planetary Science Conference, Lunar and Planetary Institute Houston. Abstract # 1039 [Google Scholar]
- Elsila JE, Aponte JC, Dworkin JP, Glavin DP, McLain HL, Simkus DN, the ANGSA Science Team (2022) Organic compounds and cyanide in the Apollo 17 ANGSA samples. In: Apollo 17-ANGSA workshop 2022. Abstract # 2015 [Google Scholar]
- Elsila JE, Aponte JC, McLain HL, Simkus D, Dworkin JP, Glavin DP, Zeigler RA, McCubbin FM (2024) Soluble organic compounds and cyanide in Apollo 17 lunar samples: origins and curation effects. J Geophys Res, Planets 129:e2023JE008133 [Google Scholar]
- Erickson TM, Simon JI, Christoffersen R, Shearer CK, Hahn T, Rahman Z, Simon SB, Cato M, McCubbin FM, the ANGSA Science Team (2023) Microstructural characterization of felsite fragments from the Apollo Next Generation Sample Analysis (ANGSA) double drive tube 73001/73002. In: 54th Lunar and Planetary Science Conference, Lunar and Planetary Institute, Houston. Abstract #1666 [Google Scholar]
- Fearn S, McPhail DS, Morris RJ, Dowsett MG (2006) Sodium and hydrogen analysis of room temperature glass corrosion using low energy Cs SIMS. Appl Surf Sci 252(19):7070–7073 [Google Scholar]
- Fortezzo CM, Spudis PD, Harrel SL (2020) Release of the digital unified global geologic map of the Moon at 1: 5,000,000-scale. In: 51st Annual Lunar and Planetary Science Conference, vol 2326, p 2760 [Google Scholar]
- Frati F, Hunault MOJY, De Groot FMF (2020) Oxygen K-edge X-ray absorption spectra. Chem Rev 120(9):4056–4110. 10.1021/acs.chemrev.9b00439 [DOI] [PMC free article] [PubMed] [Google Scholar]
- Garrett D (1972) Apollo 17. (No. NASA NEWS-RELEASE-72-220K)
- Glavin DP, the CAESAR Project Team (2018) The CAESAR New Frontiers Mission: comet surface sample acquisition and preservation. In: International workshop on Instrumentation for Planetary Missions (IPM). No. GSFC-E-DAA-TN58563 [Google Scholar]
- Gross J, Krysher C, Mosie A, Zeigler RA, McCubbin FM, Shearer C (2021) Preliminary examination process of Apollo core 73002-insights and lessons learned from ANGSA for future sample return missions. In: 52nd Lunar and Planetary Science Conference [Google Scholar]
- Gross J, Mosie A, Krysher C, Eckley SA, Zeigler RA, McCubbin FM, Shearer C, the ANGSA Science Team (2022) From Apollo to Artemis: how processing ANGSA core samples 73001/2 can help to prepare for future sample return missions to the Moon and beyond. In: Meteoritical society annual meeting. Abstract # 6310 [Google Scholar]
- Gross J, Zeigler RA, Mosie A, Krysher C, Eckley SA, Ketcham RA, Edey D, Hanna RD, Kent JJ, McCubbin FM (2023) Preliminary Catalog for Double Drive Tube Samples 73001 and 73002. https://curator.jsc.nasa.gov/lunar/angsa_attachments/aapreliminary%20catalog/preliminary_73001-73002_catalog.pdf
- Gross J, Mosie A, Krysher C, Eckley SA, Zeigler RA, McCubbin FM, Shearer C, the ANGSA Science Team (2024) From Apollo to Artemis: How processing ANGSA core samples 73001/2 can help to prepare for future sample return missions to the Moon and beyond. J Geophys Res, Planets. In review
- Guo Z, Li C, Li Y, Wen Y, Wu Y, Jia B, Tai K, Zeng X, Li X, Liu J, Ouyang Z (2022) Sub-microscopic magnetite and metallic iron particles formed by eutectic reaction in Chang’E-5 lunar soil. Nat Commun 13(1):1–7. 10.1038/s41467-022-35009-7 [DOI] [PMC free article] [PubMed] [Google Scholar]
- Hapke B (2001) Space weathering from Mercury to the asteroid belt. J Geophys Res, Planets 106(E5):10039–10073. 10.1029/2000JE001338 [Google Scholar]
- Hayne PO, Bandfield JL, Siegler MA, Vasavada AR, Ghent RR, Williams JP, Paige DA (2017) Global regolith thermophysical properties of the Moon from the Diviner Lunar Radiometer experiment. J Geophys Res, Planets 122(12):2371–2400 [Google Scholar]
- Hayne PO, Aharonson O, Schörghofer N (2020) Micro cold traps on the Moon. Nat Astron 5(2):169–175 [Google Scholar]
- Heiken GH, Vaniman DT, French BM (1992) Lunar source book. Cambridge University Press, Cambridge, p 736 [Google Scholar]
- Henderson GS, de Groot FMF, Moulton BJA (2014) X-ray absorption near-edge structure (XANES) spectroscopy. In: Spectroscopic methods in mineralogy and materials sciences, vol 78. Mineralogical Society of America, pp 75–138. 10.2138/rmg.2014.78.3 [Google Scholar]
- Herd CDK, Hilts RW, Skelhorne AW, Simkus DN (2016) Cold curation of pristine astromaterials: insights from the Tagish Lake meteorite. Meteorit Planet Sci 519:499–519. 10.1111/maps.12603 [Google Scholar]
- Ishii HA, Krot AN, Bradley JP, Keil K, Nagashima K, Teslich N, Jacobsen B, Yin Q-Z (2010) Discovery, mineral paragenesis, and origin of wadalite in a meteorite. Am Mineral 95:440–448 [Google Scholar]
- Iverson RM (1997) The physics of debris flows. Rev Geophys 35(3):245–296 [Google Scholar]
- Jolliff BL, Gross J, Shearer CK, Head JW, Lapen TJ, Crow CA, Barnes JJ, Mitchell JL (2020) Science Priorities for Sample Return for Artemis Missions to the Lunar South Pole. LPI Contribution 2563
- Keihm SJ, Langseth MG (1973) Surface brightness temperatures at the Apollo 17 heat flow site: thermal conductivity of the upper 15 cm of regolith. In: Proc. 4th lunar sci. conf, pp 2503–2513 [Google Scholar]
- Keller LP, McKay DS (1993) Discovery of vapor deposits in the lunar regolith. Science 261(5126):1305–1307. 10.1126/science.261.5126.1305 [DOI] [PubMed] [Google Scholar]
- Keller LP, McKay DS (1997) The nature and origin of rims on lunar soil grains. Geochim Cosmochim Acta 61(11):2331–2341. 10.1016/s0016-7037(97)00085-9 [Google Scholar]
- Ketcham RA, Hanna RD, Edey DR, Zeigler RA, Eckley SA (2022) Acquisition and processing of X-ray CT whole-core data for Apollo samples 73001 and 73002. In: Apollo 17 – ANGSA workshop [Google Scholar]
- Lanford WA, Davis K, Lamarche P, Laursen T, Groleau R, Doremus RH (1979) Hydration of soda-lime glass. J Non-Cryst Solids 33(2):249–266 [Google Scholar]
- Leich DA, Kahl SB, Kirschbaum AR, Niemeyer S, Phinney D (1975) Rare gas constraints on the history of boulder 1, Apollo 17 station 2, Apollo 17. Moon 14:407–444 [Google Scholar]
- Lemelin M, Lucey PG, Gaddis LR, Hare T, Ohtake M (2016) Global map products from the Kaguya multiband imager at 512 ppd: minerals, FeO, and OMAT. In: 47th Annual Lunar and Planetary Science Conference, vol 1903, p 2994 [Google Scholar]
- Lemelin M, Lucey PG, Miljković K, Gaddis LR, Hare T, Ohtake M (2019) The compositions of the lunar crust and upper mantle: spectral analysis of the inner rings of lunar impact basins. Planet Space Sci 165:230–243 [Google Scholar]
- Lofgren G (2009) Apollo surface sampling procedures. Invited presentation to CAPTEM
- Lucchitta BK (1977) Crater clusters and light mantle at the Apollo 17 site; a result of secondary impact from Tycho. Icarus 30(1):80–96 [Google Scholar]
- Lucey PG, Blewett DT, Taylor GJ, Hawke BR (2000) Imaging of lunar surface maturity. J Geophys Res, Planets 105(E8):20377–20386 [Google Scholar]
- Lucey PG, Sun L, Flom AJ, Chertok MA, Zeigler RA, Gross J, Shearer CK, the ANGSA Science Team (2022) Infrared spectroscopy of Apollo 17 core sample 73002: implications for lunar surface water. In: Apollo 17-ANGSA workshop 2022. Abstract # 2017 [Google Scholar]
- Madorsky SL, Hart VE, Straus S, Sedlak VA (1953) Thermal degradation of tetrafluoro-ethylene and hydrofluoroethylene polymers in a vacuum. J Res Natl Bur Stand 51(6):2461 [Google Scholar]
- Magnarini G, Mitchell TM, Grindrod PM, Schmitt HH, Petro NE (2021) Scaling relationship between the wavelength of longitudinal ridges and the thickness of long runout landslides on the Moon. JGR Planets. 10.1029/2021E006922 [Google Scholar]
- Malkovsky VI, Yudintsev SV, Ojovan MI, Petrov VA (2020) The influence of radiation on confinement properties of nuclear waste glasses. Sci Technol Nucl Install 2020:8875723 [Google Scholar]
- Maltagliati LA (2023) Long-awaited return to the Moon. Nat Astron 7:10 [Google Scholar]
- Maschhoff BL, Armstrong NR (1991) Thin oxide layers on clean iron surfaces: formation under vacuum and characterization by photoelectron spectroscopy and electrochemical reactions of probe molecules ant the oxide/electrolyte interface. Langmuir 7:693–703 [Google Scholar]
- McCanta MC, Dyar MD, Lanzirotti A, Newville M, Breitenfeld LB (2019) In-situ mapping of ferric iron variations in lunar glasses using X-ray absorption spectroscopy. Am Mineral 104(3):453–458. 10.2138/am-2019-6863 [Google Scholar]
- McCubbin FM, Herd CDK, Yada T, Hutzler A, Calaway MJ, Allton JH, Corrigan CM, Fries MD, Harrington AD, McCoy TJ, Mitchell JL, Regberg AB, Righter K, Snead CJ, Tait KT, Zolensky ME, Zeigler RA (2019) Advanced curation of astromaterials for planetary science. Space Sci Rev 215(8):48. 10.1007/s11214-019-0615-9 [Google Scholar]
- Melosh HJ (1979) Acoustic fluidization: a new geologic process? J Geophys Res 84:7513–7520 [Google Scholar]
- Meyer C (2012) Lunar Sample Compendium, 76001. https://curator.jsc.nasa.gov/lunar/lsc/index.cfm
- Meyer MA, Kminek G, Beaty DW, Carrier BL, Haltigin T, Hays LE, Zorzano MP et al (2022). Final report of the Mars sample return science planning group 2 (MSPG2) [DOI] [PubMed]
- Miedema PS, De Groot FMF (2013) The iron L edges: Fe 2p X-ray absorption and electron energy loss spectroscopy. J Electron Spectrosc Relat Phenom 187(1):32–48. 10.1016/J.ELSPEC.2013.03.005 [Google Scholar]
- Minocha A, Ogliore RC, Carpenter PK, Jolliff BL, the ANGSA Science Team (2022) Quantitative microanalysis explorer: a web-based visualization software for visualization of optical, electron, and quantitative X-ray maps. In: Apollo 17-ANGSA workshop 2022. Abstract # 2019 [Google Scholar]
- Mitchell J, Artemis Curation Lead (2021) Artemis sample science and curation. In: 2021 EVA exploration workshop [Google Scholar]
- Mitchell J, McCubbin F, Shearer C, the ANGSA Science Team (2020) Apollo Next Generation Sample Analysis (ANGSA): a segue to the next era of lunar exploration and sample return activities. In: American geophysical union fall meeting 2020 [Google Scholar]
- Miura YN, Okazaki R, Takano Y, Sakamoto K, Tachibana S, Yamada K, Sakai S, Sawada H (2022) The GAs Extraction and Analyses system (GAEA) for immediate extraction and measurements of volatiles in the Hayabusa2 sample container. Earth Planets Space 74:76. 10.1186/s40623-022-01638-x [Google Scholar]
- Moriarty DP, Petro NE (2020) Mineralogical diversity of the lunar south pole: critical context for future sample return goals and interpretation. In: 51st Annual Lunar and Planetary Science Conference, vol 2326, p 2428 [Google Scholar]
- Moriarty DP, Petro NE, Shearer CK, the ANGSA Science Team (2022) Remote sensing characterization of feldspathic and noritic materials in the south massif. In: Apollo 17-ANGSA workshop, 2022. Abstract # 2014 [Google Scholar]
- Morris RV (1978) The surface exposure (maturity) of lunar soils: some concepts and Is/FeO compilation, lunar sci. IX. Geochim Cosmochim Acta 9:2287–2297 [Google Scholar]
- Morris RV, Haney NC, Agresti DG, Neuman MD, Wang K, Jolliff BL, Shearer CK, Schmitt HH, the ANGSA Science Team (2022) Stratigraphy of the Apollo 17 landslide core 73002 from FMR maturity and VNIR and Mössbauer spectroscopy. In: 53rd Lunar and Planetary Science Conference. Abstract # 1849 [Google Scholar]
- Muehlberger WR, Wolfe EW (1973) The challenge of Apollo 17: the discoveries of the last manned lunar landing add much to our knowledge of the moon’s geological history. Am Sci 61(6):660–669 [Google Scholar]
- Muirhead BK, Nicholas AK, Umland J, Sutherland O, Vijendran S (2020) Mars sample return campaign concept status. Acta Astronaut 176:131–138 [Google Scholar]
- NASA JSC (1971). CSVC Technical Drawing, M-11306
- Neuman M, Koefoed P, Wang K, Jolliff BL, Korotev RL, Morris RV, the ANGSA Science Team (2022) Major and trace element variations and lithologic component analysis in Apollo 17 drive tube 73002. In: Apollo 17-ANGSA workshop, LPI contribution 2704. Abstract # 2027 [Google Scholar]
- Nozette S, Spudis P, Bussey B (2010) The lunar reconnaissance orbiter miniature radio frequency (mini-RF) technology demonstration. Space Sci Rev 150:285–302 [Google Scholar]
- Ogliore RC (2021) Acquisition and online display of high-resolution backscattered electron and X-ray maps of meteorite sections. Earth Space Sci 8(7):e2021EA001747 [Google Scholar]
- Petro NE, Valencia S, Schmitt HH, Moriarty D, Baker DM, Shearer C, Jolliff BJ (2020) Geologic context of Apollo 17 station 3 from recent remote sensing datasets: implications for the Apollo Next Generation Sample Analysis (ANGSA) double core tube samples 73001/73002. In: 51st Annual Lunar and Planetary Science Conference, vol 2326, p 2234 [Google Scholar]
- Petro NE, Moriarty DP, the ANGSA Science Team (2022) Regolith history of the Taurus-Littrow light mantle deposit: implications for core samples 72001/2. In: Apollo 17-ANGSA workshop 2022. Abstract # 2038 [Google Scholar]
- Petrowski C, Kerridge JF, Kaplan IR (1974) Light element geochemistry of the Apollo 17 site, lunar and plant sci conf v. Geochim Cosmochim Acta 5:1939–1948 [Google Scholar]
- Physical Electronics Inc. (2023) PHI Transfer Vessel 04-111 in PHI Versaprobe 4 Brochure, Physical Electronics USA, 18725 Lake Drive East, Chanhassen, MN 55317
- Pieters CM, Hawke BR, Butler P, Waltz S, Nagle JS (1980) Multispectral imaging of the lunar regolith core samples-preliminary results for 74002. In: Lunar and Planetary Science Conference proceedings, vol 11, pp 1593–1608 [Google Scholar]
- Pieters CM, Taylor LA, Noble SK, Keller LP, Hapke B, Morris RV, Allen CC, McKay DS, Wentworth S (2000) Space weathering on airless bodies: resolving a mystery with lunar samples. Meteorit Planet Sci 35(5):1101–1107. 10.1111/j.1945-5100.2000.tb01496.x [Google Scholar]
- Pike RJ (1974) Depth/diameter relations of fresh lunar craters: revisions from spacecraft data. Geophys Res Lett 1:291–294 [Google Scholar]
- Raney RK (2007) Hybrid-polarity SAR architecture. IEEE Trans Geosci Remote Sens 45:3397 [Google Scholar]
- Raney RK, Spudis PD, Bussey B, Crusan J, Jensen JR, Marinelli W, McKerracher P, Neish C, Palsetia M, Schulze R, Sequeira HB, Winters H (2011) The lunar mini-RF radars: hybrid polarimetric architecture and initial results. Proc IEEE 99(5):808–823. 10.1109/JPROC.2010 [Google Scholar]
- Roberts MW, Wood PR (1977) The mechanism of the oxidation and passivation of iron by water vapor-an electron spectroscopic study. J Electron Spectrosc Relat Phenom 11:431–437 [Google Scholar]
- Robinson MS, Brylow SM, Tschimmel M, Humm D, Lawrence SJ, Thomas PC, Hiesinger H (2010) Lunar reconnaissance orbiter camera (LROC) instrument overview. Space Sci Rev 150:81–124 [Google Scholar]
- Sato H, Robinson MS, Lawrence SJ, Denevi BW, Hapke B, Jolliff BL, Hiesinger H (2017) Lunar mare TiO2 abundances estimated from UV/Vis reflectance. Icarus 296:216–238 [Google Scholar]
- Scaioni M, Yordanov V, Brunetti MT, Melis MT, Zinzi A, Kang Z, Giommi P (2018) Recognition of landslides in lunar impact craters. Eur J Remote Sens 51(1):47–61 [Google Scholar]
- Schild TS, Tuohy E, Medeiros PD, Crespi C, Scharnholz F, Cowley A, Bamsey N, Makaya A, McDonald F, Carpenter J, the ANGSA Science Team (2021) Development of a high vacuum CSVC penetration system for the Apollo Next-Generation Sample Analysis programme. In: 52nd LPSC. Abstract #1888 [Google Scholar]
- Schmitt HH (1972) Transcript, Apollo 17 Mission. NASA Apollo Lun Surf J, EVA 2
- Schmitt HH (1973) Apollo 17 report on the valley of Taurus-Littrow: a geological investigation of the valley visited on the last Apollo mission to the Moon. Science 182(4113):681–690 [DOI] [PubMed] [Google Scholar]
- Schmitt HH (2006) Return to the Moon. Springer, New York, p 335 [Google Scholar]
- Schmitt HH (2014) Apollo 17: New Insights from the Synthesis and Integration of Field Notes, Photo-Documentation, and Analytical Data LPS XXXXV. Abstract 2732
- Schmitt HH (2016) North Massif regolith at Taurus-Littrow may contain lithic-clastic volcanic debris erupted prior to mare basalt. In: LEAG ann. mtg. Abstract 5008 [Google Scholar]
- Schmitt HH (2022) Maturation rate of immature zone in Taurus-Littrow regolith deep drill core estimated at one 0.243 is/FeO unit per Myr with nearly equal solar wind and U+Th alpha decay radiation. In: Lun. planet. sci. conf. LIII. Abstract 2723 [Google Scholar]
- Schmitt HH, Petro NE, Wels RA, Robinson MS, Weiss BP, Mercer CM (2017) Revisiting the field geology of Taurus-Littrow. Icarus 298:2–33 [Google Scholar]
- Schorghofer N, Taylor GJ (2007) Subsurface migration of H2O at lunar cold traps. J Geophys Res 112(E2):E02010. 10.1029/2006je002779. [Google Scholar]
- Scott RF (1987) Failure. Geotechnique 37:423–466 [Google Scholar]
- Sear DW, Ninagawa K, Singhvi AK (2013) Luminescence studies of extraterrestrial materials: insights into their recent radiation and thermal histories and into their metamorphic history. Geochemistry 73(1):1–37 [Google Scholar]
- Sehlke A, Sears DWG (2022a) Thermal histories of lunar cold traps: prospecting for volatiles by thermoluminescence. In: 54th Lunar and Planetary Science Conference. abs #5024 [Google Scholar]
- Sehlke A, Sears DWG (2022b) A 50 year experiment, the natural TL kinetics of Apollo 17 regolith, and prospecting for waterand other volatiles on the Moon. In: Apollo 17-ANGSA workshop. abs #2030 [Google Scholar]
- Sehlke A, Sears DWG (2023) Lunar Regolith Thermoluminescence Glow Curve Fitting to Extract Its Most Important Kinetic Parameters 53rd Lunar and Planetary Science Conference, abs #1870
- Senthil Kumar P, Keerthi V, Senthil Kumar A, Mustard J, Gopala Krishna B, Amitabh, Goswami JN et al. (2013) Gullies and landslides on the Moon: evidence for dry-granular flows. J Geophys Res, Planets 118(2):206–223. [Google Scholar]
- Sharp ZD, Shearer CK, Meshik A, Parai R, Pravdivtseva O, Cassata W, Gross J, McCubbin FM, Zeigler R, Jolliff BL, McDonald F, the ANGSA Science Team (2022) Major element gas composition of the Apollo 73001 inner (CSVC) and outer (OVC) containers. In: Apollo 17-ANGSA workshop (LPI contribution 2704). Abstract #2052 [Google Scholar]
- Shearer CK (2008) Presentation to CAPTEM
- Shearer CK, Neal CR, Jolliff BL, Wieczorek MA, Mackwell S, Lawrence S (2015) New Views of the Moon II. An initiative to integrate new lunar information into our fundamental understanding of the Moon and the next stages of international lunar exploration. Abstract# EPSC2015-860
- Shearer CK, Schmitt HH, Jolliff BL (2019) An Apollo legacy. Samples, the gift that keeps on giving to future generations. In: Lunar and Planetary Science Conference. Abstract #1412 [Google Scholar]
- Shearer CK, McCubbin FM, Zeigler RA, Gross J (2020) Apollo Next Generation Sample Analysis (ANGSA) initiative. Fulfilling Apollo science goals and preparing for returning to the Moon. In: AGU Fall Meeting abstracts, vol 2020. V013-0001 [Google Scholar]
- Shearer CK, McCubbin FM, ANGSA Science Team (2022) The ANGSA initiative: fulfilling science goals of Apollo 17 and looking ahead to Artemis. In: Apollo 17-ANGSA workshop 2022. Abstract # 2005 [Google Scholar]
- Shreve RL (1968) The blackhawk debris flow. Spec Pap, Geol Soc Am 108:1–48 [Google Scholar]
- Silver LT (1974) Patterns of U-Th-Pb distributions and isotope relations in Apollo 17 soils. In: LPSC V. Abstract # 2446 [Google Scholar]
- Simoneit BR, Wilder JT, Wszolek PC, Burlingame AL (1972) UCB Space Science Laboratory organic clean room and lunar material transfer facilities. The transfer of pristine lunar material from the Apollo 15 SESC 15012 and SESC 15013. Univ. California Space Sciences Lab Rpt. June 10. 1–154
- Sun L, Lucey PG, Flom A, Ferrari-Wong C, Zeigler RA, Gross J, Shearer CK, the ANGSA Science Team (2021) Multispectral imaging and hyperspectral scanning of the first dissection of core 73002: preliminary results. Meteorit Planet Sci 56(8):1574–1584 [Google Scholar]
- Sun L, Lucey PM, Flom A, Ferrari-Wong C, Zeigler RA, Gross J, Petro N, Shearer CK, McCubbin FM, the ANGSA Science Team (2022b) Multispectral imaging results of Apollo 17 double drive tube 73001/2. In: Apollo 17-ANGSA workshop 2022. Abstract # 2021 [Google Scholar]
- Sun L, Lucey PG, Flom A, Ferrari-Wong C, Zeigler RA, Gross J, Shearer CK, McCubbin FM, the ANGSA Science Team (2022a) Multispectral imaging of Apollo 17 core sample 73002. In: LPI contributions, 2678, 1890 [Google Scholar]
- Taylor LA, Pieters C, Keller LP, Morris RV, McKay DS, Patchen A, Wentworth S (2001) The effects of space weathering on Apollo 17 mare soils: petrographic and chemical characterization. Meteorit Planet Sci 36:285–299 [Google Scholar]
- Thompson MS, Zega TJ, Becerra P, Keane JT, Byrne S (2016) The oxidation state of nanophase Fe particles in lunar soil: implications for space weathering. Meteorit Planet Sci 51(6):1082–1095. 10.1111/maps.12646 [Google Scholar]
- Turner G, Cadogan PH (1974) Possible effects of 39Ar recoil in 40Ar-39Ar dating. In: Proceedings of the fifth lunar science conference, vol 5, pp 1601–1615 [Google Scholar]
- Valverde JM, Castellanos A (2006) Compaction of fine powders: from fluidized agglomerates to primary particles. Granul Matter 9:19–24 [Google Scholar]
- Van der Bogert CH, Hiesinger HH, Banks MI, Watters TI, Robinson MS (2012) Derivation of absolute model ages for lunar lobate scarps. In: LPSC XVIII. Abstract #1847 [Google Scholar]
- Vogel U, Brachmann E, Oswald S, Menzel S, Gemming T, Eckert J (2015) Evaluation of a mobile vacuum transfer system for in vacuo XPS analysis using as-deposited Ti thin-films. Vacuum 117:81–84 [Google Scholar]
- Winkler A, Rendulic KD, Wendl K (1983) Quantitative measurement of the sticking coefficient for oxygen on nickel. Appl Surf Sci 1983(14):209–220 [Google Scholar]
- Wolfe EW, Bailey NG, Lucchitta BK, Muehlberger WR, Scott DH, Sutton RL, Wilshire HG (1981) The Geologic Investigation of the Taurus-Littrow Valley: Apollo 17 Landing Site. Geological Survey Professional Paper 1080, p 280
- Wu ZY, Gota S, Jollet F, Pollak M, Gautier-Soyer M, Natoli CR (1997). Characterization of iron oxides by X-ray absorption at the oxygen K edge using a full multiple-scattering approach
- Xian H, Zhu J, Yang Y, Li S, Lin X, Xi J, Xing J, Wu X, Yang H, Zhou Q, Tsuchiyama A, He H, Xu YG (2023) Ubiquitous and progressively increasing ferric iron content on the lunar surfaces revealed by the Chang’e-5 sample. Nat Astron 1(7):280–286. 10.1038/s41550-022-01855-0 [Google Scholar]
- Xiao Z, Zeng Z, Ding N, Molaro J (2013) Mass wasting features on the Moon–how active is the lunar surface? Earth Planet Sci Lett 376:1–11 [Google Scholar]
- Zeigler RA, Eckley SA, Hanna R, Edey D, Ketcham RA, Gross J, McCubbin FM (2021) Using X-ray computed tomography to image Apollo drive tube 73002. In: 52nd Lunar and Planetary Science Conference [Google Scholar]
- Zeigler RA, Eckley SA, Edey D, Ketcham RA, Hanna R, Gross J, McCubbin FM, Shearer CK, ANGSA Science Team (2022b) X-ray computed tomography of Apollo drive tube 73001 as part of the Apollo Next Generation Sample Analysis program. In: Europlanet Science Congress 2022. EPSC2022-1189 [Google Scholar]
- Zeigler RA, Gross J, Eckley SA, McCubbin FM (2022a) Using X-ray computed tomography to catalog rock fragments in Apollo drive tube 73002. In: 53rd Lunar and Planetary Science Conference [Google Scholar]
- Zhang S, Wimmer-Schweingruber RF, Yu J, Wang C, Quan Z et al. (2020) First measurements of the radiation dose on the lunar surface. Sci Adv 6(39):eaaz1334. 10.1126/sciadv.aaz1334. [DOI] [PMC free article] [PubMed] [Google Scholar]