

Abstract
The objective of this study was to evaluate fish habitat suitability by simulating hydrodynamic and water quality factors using SWAT and HEC-RAS linked simulation considering time-series analysis. A 2.9 km reach of the Bokha stream was selected for the habitat evaluation of Zacco platypus, with hydrodynamic and water quality simulations performed using the SWAT and HEC-RAS linked approach. Based on simulated 10-year data, the aquatic habitat was assessed using the weighted usable area (WUA), and minimum ecological streamflow was proposed from continuous above threshold (CAT) analysis. High water temperature was identified as the most influential habitat indicator, with its impact being particularly pronounced in shallow streamflow areas during hot summer seasons. The time-series analysis identified a 28% threshold of WUA/WUAmax, equivalent to a streamflow of 0.48 m3/s, as the minimum ecological streamflow necessary to mitigate the impact of rising water temperatures. The proposed habitat modeling method, linking watershed-stream models, could serve as a useful tool for ecological stream management.
Keywords: Fish habitat suitability, Habitat suitability index (HSI), Weighted usable area (WUA), Ecological streamflow, SWAT, HEC-RAS
Subject terms: Hydrology, Ecological modelling, Freshwater ecology
Introduction
Streamflow regimes significantly influence the geological, chemical, and biological characteristics of the stream1–4. Humans have altered the streamflow patterns for water management through excessive flow regulation and diversion5,6. This can change the aquatic environment, including disconnections between the stream and floodplain, watershed hydrology, channel hydrodynamic, and water quality, potentially causing ecological impairment in stream ecosystems7–9.
In the pursuit of sustainable water management addressing both human and ecological needs, several studies have been conducted on the ecological responses to changes in streamflow regimes, employing diverse approaches such as hydrological methods, hydraulic rating, and habitat simulation10,11. Hydrological methods estimate ecological streamflow with an annual or seasonal bias by suggesting a fixed percentage from historical flow records. Hydraulic rating assesses ecological streamflow by identifying altered flows resulting from breakpoints in changed hydraulic variables. These two methods have the advantage of general applications; however, there is a lack of consideration for biological responses to changes in streamflow. Therefore, habitat simulation methods that integrate hydrological, hydraulic rating, and biological responses have been developed and applied to estimate ecological streamflow.
Bovee12 suggested the concept of physical habitat simulation based on the framework of the instream flow incremental methodology (IFIM). This framework simulates an ecosystem by considering hydraulic habitat factors such as water depth and velocity under streamflow increment conditions. It evaluates habitat suitability using the proxy indicator of the weighted usable area (WUA), which refers to the relative preference of the target species within the stream surface area. Ultimately, ecological streamflow is defined as the discharge that maximizes the value of WUA. Due to its descriptive and sophisticated characteristics, habitat simulation has been widely used to evaluate stream habitat over the last few decades13,14. Ecological streamflow has been estimated by applying two widely used hydrodynamic models: the Physical Habitat Simulation Model (PHABSIM)15–17 and River2D model18–20. Despite its applicability, the physical habitat simulation method has been criticized for its limited consideration of other environmental factors affecting stream habitat conditions. Furthermore, many studies proposing ecological streamflow insufficiently incorporate time-series analysis, which was suggested as a key element of IFIM analysis21.
Water quality factors, which significantly influence stream habitat, have been considered to complement the physical habitat simulation methodology. The US Fish and Wildlife Service (USFWS)22 identified water temperature and dissolved oxygen (DO) as the two major factors influencing aquatic habitat. Subsequently, the water quality habitat suitability index (HSI) was estimated23,24 using the Instream Flow and Aquatic Systems Group (IFASG) and Weibull distribution methods, and coupled habitat suitability index (HSI) for hydraulic and water quality was estimated using fuzzy logic25,26. Some studies have proposed ecological streamflow considering only water quality factors27,28; however, few studies have proposed ecological streamflow considering both hydraulic and water quality factors due to the lack of observational data that couples hydraulic and water quality with biological responses.
Several models and methodologies provide a way to bridge the gap where environmental flow assessments are not currently feasible due to missing hydrologic and water quality data. For example, depending on the spatial scale of the model, the Soil and Water Assessment Tool (SWAT) has been applied at the watershed scale29–31, while the US Hydrologic Engineering Center River Analysis System (HEC-RAS) has been used at the stream scale32–34. The SWAT model simulates hydrology and water quality based on hydrological response units (HRUs), which are divided from the watershed based on soil type, land use, and slope classes, using the water balance equation29,35. It is capable of simulating watershed-scale land use and management practices. Conversely, the HEC-RAS model simulates hydrodynamics based on the principles of continuity and momentum conservation, and performs water quality simulations using the 1-dimensional diffusion equation and the nutrient simulation module (NSM I)36,37, allowing for spatiotemporally detailed simulations.
An integrated modeling approach has been proposed, where hydrology and water quality at watershed outlet points were simulated using a watershed model, and its output is used as input for a stream model to perform detailed stream cross-sectional simulations. This approach has demonstrated applicability in hydraulic simulations38,39. However, few studies have comprehensively considered both hydrodynamics and water quality; consequently, research on ecological streamflow estimation is needed.
The objectives of this study were to simulate hydrodynamic and water quality factor using SWAT and HEC-RAS linked simulation approach and to estimate ecological streamflow by considering time-series analysis.
Materials and methods
Study area
Selection of study area
The study area was selected as approximately a 2.9 km section of the Bokha stream located in the Bokha watershed of the Korean standard watershed map (Fig. 1). The Bokha stream is formed by the confluence of one main stem and three tributaries. The study area was identified as a site where the aquatic habitat improvement is necessary according to the Biomonitoring Survey and Assessment Manual40.
Figure 1.

Selection of target area and location of monitoring stations. The image was generated using Esri® ArcMap™, version 10.1 (available at https://www.esri.com).
The total watershed area of the target Bokha watershed is 309.5 km2, with forest covering 128.4 km2 (41.5%), paddy fields 45.8 km2 (14.8%), upland 68.9 km2 (22.2%), urban areas 11.2 km2 (3.6%), and other areas 55.2 km2 (17.8%). Average slope of the stream sections was surveyed to 1/793.7. The annual average precipitation in the study area was 1159.7 mm. Particularly noteworthy is the concentration of rainfall during July and August, with 289.6 mm and 246.3 mm, respectively. Additionally, the region experiences low average temperatures during winter (January and December, 4.3 °C and 4.6 °C, respectively) and high temperatures during summer (July and August, averaging 25.4 °C and 25.5 °C, with maximum temperatures reaching 28.3 °C and 29.4 °C).
Data acquisition
For the watershed simulation, terrain information such as digital elevation model (DEM), land use, and soil type are required. In this study, the resolution of 12.5 m DEM was obtained from ALOS-PALSAR with high-resolution terrain-corrected images. Additionally, land use data and soil information were obtained from the National Geographic Information Institute (NGII) and the Korean Soil Information System (KSIS), respectively. For the stream simulation, stream cross-section elevation information is essential. A total 20 stream cross-sectional data (Fig. 1c) was retrieved from the Bokha Stream Maintenance Basic Plan by the Korean Ministry of Land, Transport and Maritime Affairs41. The average interval between obtained cross-sections was 143.8 m, the average channel width was 317.7 m, and the average channel bed sediment size was 1.85 mm. Meteorological data, necessary for both watershed and stream models, were obtained from daily observations at the Icheon weather station.
The observation data of hydrology and water quality were obtained from Heungcheon and Bokha monitoring stations and used for model calibration and validation. The hydrology data were obtained on a daily basis, while water temperature and DO were compiled from monthly observational data. The overall observational information used in the SWAT and HEC-RAS simulation was summarized in the Table 1.
Table 1.
Observational information of each SWAT and HEC-RAS simulation.
| Variables | Watershed model (SWAT) | Stream model (HEC-RAS) |
|---|---|---|
| Monitoring station: Heungcheon | Monitoring station: Bokha | |
| Hydrology | Daily observed streamflow | Daily observed water depth |
| Water quality | Monthly observed water temperature and DO | Monthly observed water temperature and DO |
Target species and habitat influence indicators
The representative species for the habitat suitability evaluation was selected as the Zacco platypus, a dominant fish species in the stream reach, according to the stream maintenance plan provided by MOLTMA41. The target species is a fish that can immediately and sensitively respond to changes in aquatic habitat and is positioned as a top predator in the aquatic food chain, thus, it is widely utilized for the assessment of aquatic habitats42,43.
The habitat environment for fish is primarily influenced by hydraulic conditions such as velocity and water depth14, as well as water quality factors including water temperature and dissolved oxygen (DO)22,44,45. These factors have been widely utilized as key parameters in ecological modeling. The target species, Zacco platypus, was also significantly affected by common hydraulic and water quality conditions found in typical fish habitats46–48, thus, these factors were chosen as the habitat influence indicators for the stream habitat modeling.
Stream habitat was quantified using the habitat suitability index (HSI), ranging from 0 to 1, where higher values indicate a more favorable habitat for species. The hydrodynamic HSIs of velocity and water depth were obtained from Kang et al.49, which was indexed based on the data collected from 1476 samples in the same Han River. For water quality HSIs were derived from data compiled by Hong et al.24, utilizing information from 683 water quality monitoring stations and 3039 bio-monitoring observations (Fig. 2). The quoted HSI aligns with the habitat preferences of the typical Zacco platypus, which exhibits a preference for riffles with flowing water, shows active behavior at water temperatures above 6 °C, and tends to avoid high water temperature conditions46–48.
Figure 2.

Habitat suitability index (HSI) of hydrodynamic (a) velocity and (b) water depth, and water quality (c) water temperature, (d) dissolved oxygen (DO).
SWAT and HEC-RAS linked simulation
In this study, we used the SWAT and HEC-RAS linked approach to simulate daily hydrodynamics and water quality. The SWAT model was used to simulate hydrology and water quality at four inlet points, including one main inlet and three tributaries (Fig. 1c). These simulated values were then utilized as boundary conditions for the HEC-RAS model to conduct section-specific hydrodynamic and water quality simulations. The simulation using the integration model of watershed and stream was conducted in 10 years from 2013 to 2022. The simulation focused on the period from April to November, which is the active period for the target species of the study, the Zacco platypus36,37,50.
SWAT simulation
The SWAT model (SWAT2012, rev.688) was used to simulate hydrologic and water quality at four inlet points on a watershed scale, supplement the gaps in survey data. The selection of appropriate parameters is crucial for SWAT hydrology and water quality simulations. Based on the prior studies, we identified parameters that have a major influence on SWAT modeling (Table 2). For hydrology, a total 8 parameters for each influencing factor of base flow, surface runoff, and lateral flow were selected. In water quality simulations, two parameters—slope and intercept—derived from the regression equation of water temperature and air temperature were identified as the water temperature parameters. Additionally, DO was influenced by the nutrient cycle such as Total Nitrogen (TN), Total Phosphorus (TP), and DO; thus, total 11 parameters, including those influencing TN, TP, DO, was selected for the DO simulation.
Table 2.
Applied watershed model (SWAT) parameters and its range, adjusted value, and description.
| Target factor | Parameter | Range | Adjusted value | Description | Unit | |
|---|---|---|---|---|---|---|
| Streamflow | Base flow | ALPHA_BH | 0–1 | 0.48 | Baseflow alpha factor | Day |
| GW_DELAY | 0–500 | 273.5 | Groundwater delay | Day | ||
| GW_REVAP |
0.02 − 0.2 |
0.06 | Groundwater re-evaporation coefficient | – | ||
| Surface runoff | CN2 | 35–98 | 0.76 times | Initial SCS runoff curve number for moisture condition | – | |
| CH_N1 |
0.01 − 30 |
0.06 | Manning's n value for tributary channel | – | ||
| SOL_AWC | 0–1 | 0.99 times | Available water capacity of the soil layer | – | ||
| Lateral flow | ESCO | 0–1 | 0.01 | Soil evaporation compensation factor | – | |
| EPCO | 0–1 | 0.09 | Plant uptake compensation factor | – | ||
| Water temperature | Water temperature | Slope | 0.79 | 0.79 | Slope of the regression equation between water temperature and air temperature | – |
| Intercept | 7.89 | 7.89 | Intercept of the regression equation between water temperature and air temperature | – | ||
| Dissolved oxygen | Total nitrogen (TN) | BC1 | 0.1–1 | 0.78 | Rate constant for biological oxidation of NH4 to NO2 in the reach at 20 °C | 1/day |
| BC2 | 0.2–2 | 1.79 | Rate constant for biological oxidation of NO2 to NO3 in the reach at 20 °C | 1/day | ||
| BC3 |
0.2 − 0.4 |
0.27 | Rate constant for hydrolysis of organic N to NH4 in the reach at 20 °C | 1/day | ||
| RS4 |
0.001 − 0.1 |
0.08 | Rate coefficient for organic N settling in the reach at 20 °C | 1/day | ||
| Total phosphorus (TP) | BC4 |
0.01 − 0.7 |
0.21 | Rate constant for mineralization of organic P to dissolved P in the reach at 20 °C | 1/day | |
| RS5 |
0.001 − 0.1 |
0.03 | Organic phosphorus settling rate in the reach at 20 °C | 1/day | ||
| Dissolved oxygen (DO) | RK1 |
0.02 − 3.4 |
0.02 | Carbonaceous biological oxygen demand deoxygenation rate coefficient in the reach at 20 °C | 1/day | |
| RK2 | 0–100 | 97.7 | Oxygen reaeration rate in accordance with Fickian diffusion in the reach at 20 °C | 1/day | ||
| Al3 |
1.4 − 1.8 |
1.62 | Rate of oxygen production per unit algal photosynthesis | – | ||
| Al4 |
1.6 − 2.3 |
2.04 | Rate of oxygen uptake per unit algal respiration | – | ||
The model validation and calibration were conducted using the SWAT-calibration and uncertainty program (SWAT-CUP, ver. 5.1.6.2) tool based on sequential uncertainty fitting technique (SUFI2)50. The overall simulation period covered 12 years from 2011 to 2022, with the initial 2 years dedicated to the stabilization of the SWAT model, the subsequent 5 years for model calibration, and the following 5 years for validation.
HEC-RAS simulation
The hydrodynamic and water quality simulations at detailed stream sections were performed using the HEC-RAS model (ver. 5.0.7) under unsteady conditions, utilizing hydrology and water quality data simulated from SWAT model at four inlets. The key parameters for hydrodynamic simulations included the Manning coefficient and frictional slope. The Manning coefficient was set to 0.041 in the range of 0.026 to 0.045 considering the channel bed sediment size and vegetation51, while the frictional slope was applied to 0.0021 in the range of 0.001 to 0.0025 considering the average slope of the stream37.
For water quality simulations, the main variables were the diffusion coefficient and parameters for the nutrient cycle in NSM I module. The diffusion coefficient range was determined to 25 m2/s using Fisher’s method, applying values fitted to Korean rivers, ranging from 10.2 to 64.9 m2/s52. The coefficients for NSM I were set as variables based on the same parameters used in the previous SWAT water quality simulations.
The HEC-RAS simulations were conducted over a period of 10 years (2013–2022), with the first 5 years utilized for model calibration and the subsequent 5 years for model validation. The hydrodynamic and water quality parameters of the configured HEC-RAS model were adjusted through trial and error.
Accuracy estimation methods
The watershed and stream models were evaluated using the coefficient of determination (R2), Nash–Sutcliffe efficiency (NSE), and root-mean-square error (RMSE), mainly used indicators in the assessment of hydrological and water quality simulations. The calculation methods and accuracy evaluation criteria for each indicator are outlined in Table 353.
Table 3.
Accuracy assessment statistics and criteria of accuracy53.
| Statistic | Equation | Accuracy evaluation criteria | |||
|---|---|---|---|---|---|
| Very good | Good | Satisfactory | Not satisfactory | ||
| Coefficient of determination (R2) | R2 > 0.85 | R2 > 0.75 | R2 > 0.60 | R2 ≤ 0.60 | |
| Nash–Sutcliffe efficiency (NSE) | NSE > 0.80 | NSE > 0.70 | NSE > 0.50 | NSE ≤ 0.50 | |
| Root-mean-square error (RMSE) | RMSE > 0 | ||||
Habitat suitability assessment
WUA estimation
The aquatic habitat was simulated by calculating the WUA, which represents the suitable area for target species within the total water surface area (Eqs. 1 & 2 and Fig. 3). The WUA was calculated by summing up cross-sectional WUA values, which was calculated by multiplying the water surface area with the HSI of each habitat influence indicators. Each cross section was assumed to influence the midpoint of the section before and after it, and WUA calculation was performed based on this assumption. The calculated WUA, representing a habitat preference in terms of an area unit, denotes the relative preference of the target species for that specific habitat54; thus, we assessed the habitat analysis using the ratio of WUA, which was related with water surface area (WUA/water surface area, %) or maximum WUA (WUA/WUAmax, %).
| 1 |
| 2 |
where, is weighted usable area and is WUA at cross section . is habitat suitable index at habitat influence indicator .
Figure 3.

Schematics of estimation of weighted usable area (WUA).
Continuous above threshold (CAT) analysis
The characteristics of species is that a decrease in their population due to the temporal habitat condition decrease creates difficulties in the recovery of population, even when the habitat returns to a suitable condition; thus, it is essential to consider the continuity of suitable habitats. In this study, we utilized the continuous above threshold (CAT) methods to analyze the continuity of habitats, and based on this, we estimated the least ecological streamflow necessary for maintaining the suitable habitat conditions.
In the CAT analysis (Fig. 4), daily habitat condition was evaluated using the ratio of WUA to WUAmax, which is the maximum WUA value during the simulated 10 years, expressed as WUA/WUAmax. Suitable habitats were determined by comparing daily WUA/WUAmax to a threshold, a specific value of WUA/WUAmax. The higher daily WUA/WUAmax compare to a threshold represents suitable habitat conditions for that day. Based on this, the number of continuous suitable habitat days () and cumulative percentages of continuous durations () were calculated. By plotting these suitable habitat days with cumulative percentages in descending order, a line in CAT diagram for specific thresholds can be generated (Fig. 4b black line). Consequently, the whole CAT diagram can be obtained by combining the lines created by increasing the thresholds from 0 to 100%.
Figure 4.

Schematics of continuous above threshold (CAT) analysis (modified from55,56). (a) time series WUA/WUAmax and (b) CAT diagram.
The CAT diagram shows a tendency for the number of consecutive suitable habitat days to decrease as the threshold increases, which is represented by the lines in the diagram decreasing at similar intervals. However, when the threshold reaches the habitat limitation points, the continuity of the habitat is disrupted, and this is depicted as a significant gap appearing as an anomaly in the CAT diagram. Please refer to the Park et al.55 for more detailed CAT methodology. Based on the anomaly, we detected the specific thresholds that disrupt the continuity of the habitat and propose the least ecological streamflow which could sustain the stream WUA/WUAmax above the anomaly threshold.
Results and discussion
Hydrodynamic and water quality simulation
The accuracy evaluation results for the watershed was presented in Table 4. Overall, the watershed-scale hydrology and water quality simulations using SWAT demonstrated satisfactory result for stream discharge (average R2 of 0.62 and NSE of 0.59) and DO (average R2 of 0.86 and NSE of 0.74), and very good results for water temperature (average R2 of 0.90 and NSE of 0.88). The model performances were also considered acceptable as the modeling accuracy meets recommended satisfactory levels53 and shows comparable accuracy values to those from previous daily watershed-scale simulation studies57,58. Therefore, we conducted the section-level simulation utilizing the simulated four inlets, including one main inlet and four tributaries, for hydrology and water quality data as the input boundary condition.
Table 4.
SWAT and HEC-RAS model calibration and validation statistics.
| Calibration | Validation | |||||
|---|---|---|---|---|---|---|
| Variable | Statistics | Value | Variable | Statistics | Value | |
| Watershed model (SWAT) | Discharge | R2 | 0.62 | Discharge | R2 | 0.62 |
| NSE | 0.58 | NSE | 0.59 | |||
| RMSE (m3/s) | 17.5 | RMSE (m3/s) | 23.1 | |||
| Water temperature | R2 | 0.90 | Water temperature | R2 | 0.89 | |
| NSE | 0.89 | NSE | 0.87 | |||
| RMSE (°C) | 2.26 | RMSE (°C) | 2.00 | |||
| DO | R2 | 0.86 | DO | R2 | 0.86 | |
| NSE | 0.73 | NSE | 0.74 | |||
| RMSE (kg) | 4502.5 | RMSE (kg) | 7777.3 | |||
| Stream model (HEC-RAS) | Water depth | R2 | 0.62 | Water depth | R2 | 0.65 |
| NSE | 0.62 | NSE | 0.62 | |||
| RMSE (m) | 0.10 | RMSE (m) | 0.13 | |||
| Water temperature | R2 | 0.82 | Water temperature | R2 | 0.85 | |
| NSE | 0.75 | NSE | 0.73 | |||
| RMSE (°C) | 3.87 | RMSE (°C) | 2.65 | |||
| DO | R2 | 0.69 | DO | R2 | 0.61 | |
| NSE | 0.65 | NSE | 0.55 | |||
| RMSE (mg/L) | 0.80 | RMSE (mg/L) | 1.06 | |||
The results of the calibration and validation of the HEC-RAS model were also illustrated in Table 4, and the time-series simulation results were shown in Fig. 5. The accuracy of the stream simulations for each variable showed a tendency to be similar to that obtained from SWAT simulation. However, the DO was simulated in different units, with SWAT providing results in total load units, while HEC-RAS simulated concentration units. This difference leads to a decrease in DO accuracy due to the combined uncertainty of discharge and DO. Despite this, all simulated variables, including water depth (average R2 of 0.64 and NSE of 0.62), water temperature (average R2 of 0.84 and NSE of 0.74), and DO (average R2 of 0.65 and NSE of 0.60), evaluated as satisfactory or higher level. Based on the simulated section-level hydrodynamic and water quality by SWAT and HEC-RAS linked simulation approach, micro-habitat modeling was conducted for the study area.
Figure 5.

Simulation results for SWAT and HEC-RAS linked simulation. (a-1) & (a-2), (b-1) & (b-2), and (c-1) & (c-2) shows the temporal variation and scatter plots of water depth, water temperature, and DO, respectively.
Spatial and temporal habitat estimation
The spatial distribution of cross-sectional velocity, water depth, water temperature, and DO was visualized in Fig. 6a–d by averaging the temporal distribution. Each habitat influence indicators were illustrated in five categories based on the range of the HSI; especially the segments highlighted in red were assessed as suitable for target species with an HSI value of 1. As water temperature exhibits a wide annual variation, the annual average water temperature for all sections fall within the range of 0 < HSI < 1; therefore, the temporal average water temperature was categorized into five classes to visually confirm the trend of the water temperature. Consequently, the estimated WUA, weighting the water surface area with HSI of each habitat influence indicators, was presented in Fig. 6e and f, shown from overhead and longitudinal view.
Figure 6.

Spatial distribution of HSI and estimated WUA. (a) and (b) shows the HSI distributions of the hydrodynamic factors of velocity and water depth and (c) and (d) shows the HSI distributions of the water quality factors of water temperature and DO, respectively. (e) and (f) illustrates estimated WUA in overhead view and longitidunal view, respectively.
Overall, there was a tendency for high WUA values in five cross sections, ranging from 15.4 to 16.2, and one section at 17.2, corresponding to areas with habitat influence indicators having an HSI of 1 (Fig. 6e,f). Notably, within the five cross sections ranging from 15.4 to 16.2, three sections from 15.8 to 16.2 showed relatively low WUA compared to the two sections from 15.4 to 15.6. Target species, Zacco platypus, prefers habitats like riffles where the water flows relatively fast and turbulent46–48, and the section from 15.8 to 16.2 aligned well with the physical habitat preferences of the target species. However, the section from 15.8 to 16.2 showed a tendency for higher average water temperature than sections from 15.4 to 15.6 due to the overall shallow water depth, indicating habitat limitations could be occurred due to the high water temperatures. Consequently, driven by water temperature as a significant factor, the overall WUA tended to be higher in areas with relatively deeper depths behind riffles.
The temporal WUA was estimated in 10 year period from 2013 to 2022, and spatially averaged HSI values of habitat influence indicators were illustrated in Fig. 7a and b, respectively. When considering only the hydrodynamic factors, the WUA was estimated relatively high regardless of the temporal variation (Fig 7a red dotted line). However, when both hydrodynamic and water quality factors were considered, the estimated WUA values began to increase from April, reaching the highest values during the months of June to August, followed by a decreasing trend (Fig. 7a black line). In reality, Zacco platypus emerges from hibernation in April, exhibits active habitat characteristics from June to August, and enters hibernation again in December46–48. Some restrictions on physical habitats due to heavy rainfall events were observed from hydrodynamic considered WUA (Fig. 7a blue arrow); however, overall, considering both hydrodynamic and water quality factors, the WUA trends align with the life cycle of the target species.
Figure 7.

Temporal distribution of (a) WUA and (b) HSI of each habitat influence indicators.
When considering both hydrodynamic and water quality for habitat estimation, there was a sharp decrease in WUA during the active habitat characteristic period of June to August (Fig. 7a,b red arrow). This decline was attributed to the elevated air temperature during this period, leading to increased water temperature. As a result, the water temperature exceeded the suitable range for the habitat of Zacco platypus, causing a rapid decrease in WUA. It has been reported that freshwater fish exposed to water temperature above 28 °C exhibit gill damage59, increased stress hormones60, and reproductive dysfunction61–63. The physiological responses of fish to high water temperature were consistent with the habitat restriction caused by the increase in water temperature. Through spatiotemporal WUA analysis, it was confirmed that water temperature is a major influencing factor on habitat suitability. Notably, the impact of water temperature on habitat restriction is more pronounced temporally during the summer season and spatially in shallow water depths.
Proposal of ecological streamflow
The CAT diagram was illustrated in Fig. 8a. A total of five anomalies, with WUA/WUAmax of 6%, 12%, 19%, 28%, and 49%, were detected based on CAT analysis. Although there are some uncertainties involved in hydrodynamic and water quality simulations, and concequently in daily WUA, their impact on anomalies might be partial. This is because CAT detects inflection points or trends where changes in WUA occur. Simulated factors, especially water temperature, which has a dominant influence on WUA, changes continuously on a daily basis, thus the trends remain fairly stable. Nevertheless, it still implies that anomaly values may fluctuate due to simulation uncertainty. Therefore, the five detected anomalies were set as the minimum criteria, and based on this, the minimum ecological streamflow was proposed.
Figure 8.

(a) illustrates the CAT diagram, (b) and (c) shows the trends of HSI and time-series WUA/WUAmax following the detected anomaly thresholds.
Fig. 8b and c shows the trends of WUA/WUAmax thresholds detected by the CAT analysis in the HSI of habitat influence indicator and time series WUA/WUAmax, respectively. There was a trend of increasing HSI values for flow velocity and water depth with the increase in WUA/WUAmax, however, the impact on WUA was evaluated to be relatively small. The HSI of water temperature showed a significant increase with the rise in WUA/WUAmax. This implies that maintaining habitat conditions above a specific WUA/WUAmax could alleviate habitat restrictions due to water temperature. Particularly, when considering the most active period of target species, June to August (Fig. 8b black arrow), the shift in WUA/WUAmax from 19% to 28% could alter the water temperatrue HSI above zero in all daily WUA estimations as demonstrated in positive water temperature HSI values on all days (Fig. 8b red line). Consequently, the 28% threshold was evaluated as the minimum criterion to alleviate the impact of water temperature rise. The results exhibited a similarity to the suggested minimum ecological threshold range of 25% in the Nakdong River Basin of Korea's Banbyun streams55. This consistency accross multiple watersheds suggest that the threshold value of WUA/WUAmax may exist around 25% and be applicable to other streams for minimum ecological streamflow estimation. As shown in Fig. 8c, maintaining the stream habitat above the WUA/WUAmax 28% could be expected to improve the habitat limitations caused by high water temperatures during the low-flow summer period.
The relationship between streamflow and WUA/WUAmax was depicted in Fig. 9 using the time series WUA/WUAmax (Fig. 7a) and the corresponding streamflows. There was an increasing trend in WUA/WUAmax with increasing streamflow up to 6.9 m3/s, where WUA/WUAmax is equal to 100%. Considering the mean streamflow of the bokha stream was 2.39 m3/s, the significant dates of habitat restriction caused by low streamflow and high water temperature corresponded to the blue zone in Fig. 9. Thus, a regression equation for the correlation between hydrodynamic considered WUA and streamflow was formulated, and the streamflow corresponding to each anomaly was derived from the regression equation. As previously mentioned, the WUA/WUAmax of 28% was suggested as the minimum anomaly to alleviate the habitat conditions affected by water temperature. Therefore, the streamflow of 0.48 m3/s, corresponding to the WUA/WUAmax of 28%, was proposed as the minimum ecological streamflow for the bokha steam.
Figure 9.
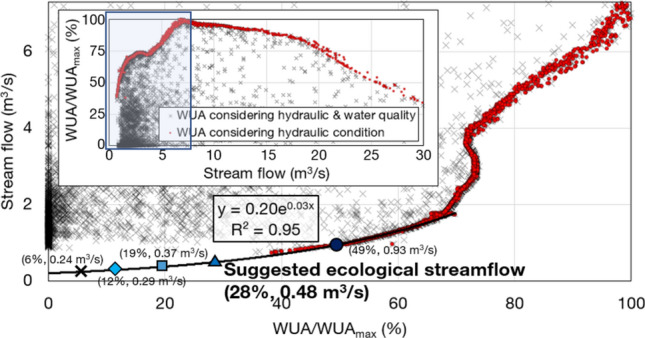
The correlation between streamflow and WUA/WUAmax.
Conclusions
In this study, we applied a linked approach using the SWAT and HEC-RAS models to assess the fish habitat, considering cross-sectional hydrodynamic and water quality conditions in the Bokha Stream. Additionally, we proposed a least ecological streamflow to maintain the habitat of Zacco platypus, utilizing time-series CAT analysis.
The hydrodynamic and water quality simulations demonstrated accuracy equal to or greater than satisfactory in both SWAT and HEC-RAS models. Through spatial and temporal habitat analysis, we identified conditions where the continuity of significant habitat suitability is disrupted, notably breaking in habitat suitability continuity caused by high water temperature. This phenomenon was more pronounced during the summer season temporally and in shallow water depths spatially. During the 10 years time-series analysis, a total of five anomalies were detected, and 28% threshold was evaluated as the minimum criterion to alleviate the impact of water temperature. Consequently, the streamflow of 0.48 m3/s, corresponding to the WUA/WUAmax of 28%, was proposed as a least ecological streamflow for the Bokha stream.
In this study, we proposed an SWAT and HEC-RAS linked simulation approach, allowing us to simulate and enhance fish habitat modeling even in areas with limited data, such as tributaries. The actual stream ecosystem consists of a variety of species, including not only fish but also birds, aquatic plants, and invertebrates. Therefore, it is essential to modeling the habitat considering the overall species composition and the interactions between species, and this will be the further study.
Acknowledgements
This work was supported by the Korea Environment Industry & Technology Institute (KEITI) through the Aquatic Ecosystem Conservation Research Program, funded by the Korea Ministry of Environment (MOE) (Grant number 2020003050001).
Author contributions
J.P. and I.S. conceptualized the methodology and developed model for linked approach using the SWAT and HEC-RAS models. S.J. contributed to data manipulation and interpretation. H.L. and J.G. assisted in raw data processing. All authors reviewed the manuscript.
Data availability
The datasets used and/or analyzed during the current study are available from the corresponding author upon reasonable request. There are no restrictions on data availability.
Competing interests
The authors declare no competing interests.
Footnotes
Publisher's note
Springer Nature remains neutral with regard to jurisdictional claims in published maps and institutional affiliations.
References
- 1.Bunn, S. E. & Arthington, A. H. Basic principles and ecological consequences of altered flow regimes for aquatic biodiversity. Environ. Manag.30, 492–507 (2002). 10.1007/s00267-002-2737-0 [DOI] [PubMed] [Google Scholar]
- 2.Poff, N. L. & Ward, J. V. Implications of streamflow variability and predictability for lotic community structure: A regional analysis of streamflow patterns. Can. J. Fish. Aquat. Sci.46, 1805–1818 (1989). 10.1139/f89-228 [DOI] [Google Scholar]
- 3.Poff, N. L. et al. The ecological limits of hydrologic alteration (ELOHA): A new framework for developing regional environmental flow standards. Freshw. Biol.55, 147–170 (2010). 10.1111/j.1365-2427.2009.02204.x [DOI] [Google Scholar]
- 4.Poff, N. L. et al. The natural flow regime. BioScience47, 769–784 (1997). 10.2307/1313099 [DOI] [Google Scholar]
- 5.Kennard, M. J. et al. Classification of natural flow regimes in Australia to support environmental flow management. Freshw. Biol.55, 171–193 (2010). 10.1111/j.1365-2427.2009.02307.x [DOI] [Google Scholar]
- 6.Patil, R., Wei, Y., Pullar, D. & Shulmeister, J. Understanding hydro-ecological surprises for riverine ecosystem management. Curr. Opin. Environ. Sustain.33, 142–150 (2018). 10.1016/j.cosust.2018.05.021 [DOI] [Google Scholar]
- 7.Carlisle, D. M., Wolock, D. M. & Meador, M. R. Alteration of streamflow magnitudes and potential ecological consequences: A multiregional assessment. Front. Ecol. Environ.9, 264–270 (2011). 10.1890/100053 [DOI] [Google Scholar]
- 8.Sabater, S. et al. Effects of human-driven water stress on river ecosystems: A meta-analysis. Sci. Rep.8, 11462 (2018). 10.1038/s41598-018-29807-7 [DOI] [PMC free article] [PubMed] [Google Scholar]
- 9.Yarnell, S. M. et al. Functional flows in modified riverscapes: Hydrographs, habitats and opportunities. BioScience65, 963–972 (2015). 10.1093/biosci/biv102 [DOI] [Google Scholar]
- 10.Tharme, R. E. A global perspective on environmental flow assessment: Emerging trends in the development and application of environmental flow methodologies for rivers. River Res. Appl.19, 397–441 (2003). 10.1002/rra.736 [DOI] [Google Scholar]
- 11.Ahmadi-Nedushan, B. et al. A review of statistical methods for the evaluation of aquatic habitat suitability for instream flow assessment. River Res. Appl.22, 503–523 (2006). 10.1002/rra.918 [DOI] [Google Scholar]
- 12.Bovee, K. D. A guide to stream habitat analysis using the instream flow incremental methodology (Vol. 1). Western Energy and Land Use Team, Office of Biological Services, Fish and Wildlife Service, US Department of the Interior (1982).
- 13.Reiser, D. W., Wesche, T. A. & Estes, C. Status of instream flow legislation and practices in North America. Fisheries14, 22–29 (1989). [DOI] [Google Scholar]
- 14.Stamou, A. et al. Determination of environmental flows in rivers using an integrated hydrological-hydrodynamic-habitat modelling approach. J. Environ. Manag.209, 273–285 (2018). 10.1016/j.jenvman.2017.12.038 [DOI] [PubMed] [Google Scholar]
- 15.Ayllón, D., Almodóvar, A., Nicola, G. & Elvira, B. The influence of variable habitat suitability criteria on PHABSIM habitat index results. River Res. Appl.28, 1179–1188 (2012). 10.1002/rra.1496 [DOI] [Google Scholar]
- 16.Park, J., Jang, S. & Song, I. Estimation of an optimum ecological stream flow in the Banbyeon Stream using PHABSIM-focused on Zacco platypus and Squalidus chankaensis tsuchigae. J. Korean Soc. Agric. Eng.62, 51–62 (2020). [Google Scholar]
- 17.Wang, H. et al. Multi-objective assessment of the ecological flow requirement in the upper Yangtze national nature reserve in China using PHABSIM. Water10, 326 (2018). 10.3390/w10030326 [DOI] [Google Scholar]
- 18.Lee, J. H., Kil, J. T. & Jeong, S. Evaluation of physical fish habitat quality enhancement designs in urban streams using a 2D hydrodynamic model. Ecol. Eng.36, 1251–1259 (2010). 10.1016/j.ecoleng.2010.05.004 [DOI] [Google Scholar]
- 19.Steffler, P., & Blackburn, J. Two-dimensional depth averaged model of river hydrodynamics and fish habitat. River2D User’s Manual, University of Alberta, Canada (2002).
- 20.Theodoropoulos, C., Skoulikidis, N., Rutschmann, P. & Stamou, A. Ecosystem-based environmental flow assessment in a Greek regulated river with the use of 2D hydrodynamic habitat modelling. River Res. Appl.34, 538–547 (2018). 10.1002/rra.3284 [DOI] [Google Scholar]
- 21.Bovee, K. D. et al. Stream habitat analysis using the instream flow incremental methodology (1998).
- 22.TRRIT (Truckee River Recovery Implementation Team). Short term action plan for Lahontan Cutthroat Trout Oncorhynchus clarkii henshawi in the Truckee River Basin (2003).
- 23.Adriaenssens, V., Goethals, P. L. & De Pauw, N. Fuzzy knowledge-based models for prediction of Asellus and Gammarus in watercourses in Flanders (Belgium). Ecol. Modell.195, 3–10 (2006). 10.1016/j.ecolmodel.2005.11.043 [DOI] [Google Scholar]
- 24.Hong, R., Park, J., Jang, S. & Song, I. Estimation of fish habitat suitability index for stream water quality-case species of Zacco platypus. J. Korean Soc. Agric. Eng.63, 89–100 (2021). [Google Scholar]
- 25.Li, R., Chen, Q. & Ye, F. Modelling the impacts of reservoir operations on the downstream riparian vegetation and fish habitats in the Lijiang River. J. Hydroinform.13, 229–244 (2011). 10.2166/hydro.2010.008 [DOI] [Google Scholar]
- 26.Marsili-Libelli, S., Giusti, E. & Nocita, A. A new instream flow assessment method based on fuzzy habitat suitability and large scale river modelling. Environ. Modell. Softw.41, 27–38 (2013). 10.1016/j.envsoft.2012.10.005 [DOI] [Google Scholar]
- 27.Missaghi, S., Hondzo, M. & Herb, W. Prediction of lake water temperature, dissolved oxygen, and fish habitat under changing climate. Clim. Chang.141, 747–757 (2017). 10.1007/s10584-017-1916-1 [DOI] [Google Scholar]
- 28.Nukazawa, K., Shiraiwa, J.-I. & Kazama, S. Evaluations of seasonal habitat variations of freshwater fishes, fireflies, and frogs using a habitat suitability index model that includes river water temperature. Ecol. Modell.222, 3718–3726 (2011). 10.1016/j.ecolmodel.2011.09.005 [DOI] [Google Scholar]
- 29.Arnold, J., Kiniry, J., Srinivasan, R., Williams, J., Haney, E., & Neitsch, S. SWAT 2012 input/output documentation (2013).
- 30.Gassman, P. W., Reyes, M. R., Green, C. H. & Arnold, J. G. The soil and water assessment tool: Historical development, applications, and future research directions. Trans. ASABE50, 1211–1250 (2007). 10.13031/2013.23637 [DOI] [Google Scholar]
- 31.Williams, J., Arnold, J., Kiniry, J., Gassman, P. & Green, C. History of model development at temple, Texas. Hydrol. Sci. J.53, 948–960 (2008). 10.1623/hysj.53.5.948 [DOI] [Google Scholar]
- 32.Fan, C., Wang, W.-S., Liu, K.F.-R. & Yang, T.-M. Sensitivity analysis and water quality modeling of a tidal river using a modified streeter–phelps equation with HEC-RAS-calculated hydraulic characteristics. Environ. Model. Assess.17, 639–651 (2012). 10.1007/s10666-012-9316-4 [DOI] [Google Scholar]
- 33.Haghiabi, A. H. & Zaredehdasht, E. Evaluation of HEC-RAS ability in erosion and sediment transport forecasting. World Appl. Sci. J.17, 1490–1497 (2012). [Google Scholar]
- 34.Tamiru, H. & Dinka, M. O. Application of ANN and HEC-RAS model for flood inundation mapping in lower Baro Akobo River Basin, Ethiopia. J. Hydrol. Reg. Stud.36, 100855 (2021). 10.1016/j.ejrh.2021.100855 [DOI] [Google Scholar]
- 35.Neitsch, S. L., Arnold, J. G., Kiniry, J. R., & Williams, J. R. Soil and water assessment tool theoretical documentation version 2009 (2011).
- 36.Brunner, G. W. HEC-RAS river analysis system. Hydraulic reference manual. Version 1.0. US Army Corps of Engineers–Hydrologic Engineering Center (1995).
- 37.Brunner, G. W. HEC-RAS River Analysis System: Hydraulic Reference Manual, Version 5.0. US Army Corps of Engineers–Hydrologic Engineering Center547 (2016).
- 38.Zeiger, S. J. & Hubbart, J. A. Measuring and modeling event-based environmental flows: An assessment of HEC-RAS 2D rain-on-grid simulations. J. Environ. Manag.285, 112125 (2021). 10.1016/j.jenvman.2021.112125 [DOI] [PubMed] [Google Scholar]
- 39.Wang, Y. et al. An acute increase in water temperature can increase free amino acid concentrations in the blood, brain, liver, and muscle in goldfish (Carassius auratus). Fish Physiol. Biochem.45, 1343–1354 (2019). 10.1007/s10695-019-00642-5 [DOI] [PubMed] [Google Scholar]
- 40.NIER (National Institute of Environmental Research). Biomonitering Survey and Assessment Manual. Office of Water and Environmental Engineering, National Institute of Environmental Research: Seoul, Republic of Korea, p. 129 (2019).
- 41.MOLTMA (Ministry of Land, Transport and Maritime Affairs). Stream Maintenance Basic Plan Report for the Bokha Stream. Seoul: Ministry of Land, Transport and Maritime Affairs (2011).
- 42.Park, C.-B., Kim, G.-E., Kim, D.-W., Kim, S. & Yeom, D.-H. Biomonitoring the effects of urban-stream waters on the health status of pale chub (Zacco platypus): A comparative analysis of biological indexes and biomarker levels. Ecotoxicol. Environ. Saf.208, 111452 (2021). 10.1016/j.ecoenv.2020.111452 [DOI] [PubMed] [Google Scholar]
- 43.Kim, Y.-W. et al. Design of ecological flow (E-Flow) considering watershed status using watershed and physical habitat models. Water15, 3267 (2023). 10.3390/w15183267 [DOI] [Google Scholar]
- 44.Cline, T. J., Bennington, V. & Kitchell, J. F. Climate change expands the spatial extent and duration of preferred thermal habitat for Lake Superior fishes. PloS one8, e62279 (2013). 10.1371/journal.pone.0062279 [DOI] [PMC free article] [PubMed] [Google Scholar]
- 45.Kang, H., Hur, J. W. & Park, D. The effects of cold water released from dams on Zacco platypus gonad maturation in the Nakdong River, South Korea. KSCE J. Civil Eng.21, 1473–1483 (2017). 10.1007/s12205-016-1063-7 [DOI] [Google Scholar]
- 46.Baek, H.-M., Song, H.-B. & Cho, D.-H. Reproductive ecology of the pale chub, Zacco platypus in a tributary to the Han river. Korean J. Ichthyol.18, 193–201 (2006). [Google Scholar]
- 47.Yoon, J.-D. et al. Distribution patterns of fish communities with respect to environmental gradients in Korean streams. Annales de Limnologie-Int. J. Limnol.10.1051/limn/2011020 (2011). 10.1051/limn/2011020 [DOI] [Google Scholar]
- 48.Lee, H., Park, J., Jang, S., Hong, R. & Song, I. Physical habitat assessment of Bokha downstream reach considering life cycle stages of Zacco platypus using PHABSIM. J. Korean Soc. Agric. Eng.64, 55–64 (2022). [Google Scholar]
- 49.Kang, H. Comparision of physical habitat suitability index for fishes in the rivers of Han and Geum river watersheds. KSCE J. Civil Environ. Eng. Res.32, 71–78 (2012). [Google Scholar]
- 50.Abbaspour, K. C. et al. Modelling hydrology and water quality in the pre-alpine/alpine Thur watershed using SWAT. J. Hydrol.333, 413–430 (2007). 10.1016/j.jhydrol.2006.09.014 [DOI] [Google Scholar]
- 51.Arcement, G. J., & Schneider, V. R. Guide for selecting Manning's roughness coefficients for natural channels and flood plains (Vol. 2339). US Government Printing Office Washington, DC (1989).
- 52.Yun, S.-U., Han, G.-Y., Han, J.-S. & Kim, J.-S. An esitimation of lognitudinal dispersion coefficient in natural stram using hydraulic model. J. Korea Water Resour. Assoc.33, 407–417 (2000). [Google Scholar]
- 53.Moriasi, D. N., Gitau, M. W., Pai, N. & Daggupati, P. Hydrologic and water quality models: Performance measures and evaluation criteria. Trans. ASABE58, 1763–1785 (2015). 10.13031/trans.58.10715 [DOI] [Google Scholar]
- 54.Payne, T. R. The concept of weighted usable area as relative suitability index. IFIM Users Workshop (2003).
- 55.Park, J., Jang, S., Hong, R. & Song, I. Estimation of least ecological streamflow through long-term habitat evaluation using stream hydrodynamics and water quality factors. Hydrol. Sci. J.68, 1794–1808 (2023). 10.1080/02626667.2023.2241582 [DOI] [Google Scholar]
- 56.Capra, H., Breil, P. & Souchon, Y. A new tool to interpret magnitude and duration of fish habitat variations. Regul. Rivers Res. Manag.10, 281–289 (1995). 10.1002/rrr.3450100221 [DOI] [Google Scholar]
- 57.Postingel Quirino, P. et al. The influence of increased water temperature on the duration of spermatogenesis in a neotropical fish, Astyanax altiparanae (Characiformes, Characidae). Fish Physiol. Biochem.47, 747–755 (2021). 10.1007/s10695-020-00869-7 [DOI] [PubMed] [Google Scholar]
- 58.Park, C.-B., Kim, Y. J. & Soyano, K. Effects of increasing temperature due to aquatic climate change on the self-fertility and the sexual development of the hermaphrodite fish, Kryptolebias marmoratus. Environ. Sci. Pollut. Res.24, 1484–1494 (2017). 10.1007/s11356-016-7878-4 [DOI] [PubMed] [Google Scholar]
- 59.Nur, F. et al. Effect of water temperature on the physiological responses in Betta rubra, Perugia 1893 (Pisces: Osphronemidae). Int. Aquatic Res.12 (2020).
- 60.Morid, R., Shimatani, Y. & Sato, T. An integrated framework for prediction of climate change impact on habitat suitability of a river in terms of water temperature, hydrological and hydraulic parameters. J. Hydrol.587, 124936 (2020). 10.1016/j.jhydrol.2020.124936 [DOI] [Google Scholar]
- 61.Marin, M. et al. Assessing the vulnerability of water resources in the context of climate changes in a small forested watershed using SWAT: A review. Environ. Res.184, 109330 (2020). 10.1016/j.envres.2020.109330 [DOI] [PubMed] [Google Scholar]
- 62.Kiesel, J., Hering, D., Schmalz, B. & Fohrer, N. A transdisciplinary approach for modelling macroinvertebrate habitats in lowland streams. IAHS Publ.20, 24 (2009). [Google Scholar]
- 63.Brungs, W. A. Chronic effects of constant elevated temperature on the fathead minnow (Pimephales promelas Rafinesque). Trans. of the Am. Fish. Soc.100, 659–664 (1971). [DOI] [Google Scholar]
Associated Data
This section collects any data citations, data availability statements, or supplementary materials included in this article.
Data Availability Statement
The datasets used and/or analyzed during the current study are available from the corresponding author upon reasonable request. There are no restrictions on data availability.