

Abstract
Dietary micronutrients are integral to the development and progression of constipation; however, the specific relationship between dietary copper intake and constipation has not been thoroughly investigated. This study aims to examine the correlation between dietary copper intake and constipation among U.S. adults, thereby offering novel insights and recommendations for the clinical management and prevention of constipation. Bowel health data from the National Health and Nutrition Examination Survey (NHANES) conducted between 2005 and 2010 were analyzed. Subjects’ dietary information was collected through questionnaire records. Multivariate logistic regression analysis, subgroup analysis, and curve fitting analysis were used to assess the correlation between dietary copper intake and chronic constipation. After adjusting for all possible confounders, each unit increase in dietary copper intake (converted to natural logarithms) was associated with a 20% reduction in the prevalence of constipation (OR = 0.80; 95% CI 0.65–0.98; P = 0.037). The interaction P-values for all subgroups were greater than 0.05, indicating that the findings were stable and consistent across subgroups. The present study showed a significant negative association between dietary copper intake and chronic constipation in adults. This finding raises clinical and healthcare professionals’ awareness of the impact of dietary trace elements on intestinal health and has important implications for the development of personalized meal plans and rational supplementation of trace copper in patients with constipation.
Keywords: Constipation, Dietary copper intake, National Health and Nutrition Examination Survey, Cross-sectional study
Subject terms: Gastrointestinal diseases, Gastrointestinal system
Introduction
Constipation is a common symptom of chronic disease or chronic illness, which hurts the human physiological system, and long-term chronic constipation increases the burden on the healthcare system and the cost of treatment1–3. The prevalence of constipation has been reported to be 16% in North America4. To date, the presence or absence of a decrease in the number of bowel movements, the effort involved in defecation, the nature of the feces, and the feeling of incomplete defecation have all been included in the assessment of constipation5. Meanwhile, constipation can also be categorized into functional constipation and traumatic constipation6,7. The former belongs to non-organic lesions, including constipation caused by functional bowel disorders or irritable bowel syndrome, which is mostly primary chronic constipation8–12; the latter includes constipation caused by colorectal cancer surgery, spinal injuries or deformities, which is often manifested as prolonged intestinal transport time, impaired rectal and anal canal defecation reflexes, etc., and is mostly acute constipation related to nerve injury and intestinal obstruction at the relevant sites2,5,7. Notably, functional constipation in children also includes fecal incontinence, which does not apply to adults6,13. It can be seen that the inclusion criteria for the etiology of constipation and the definition of constipation are different in different populations, and therefore the risk factors for constipation in different populations need to be further expanded and investigated.
Copper is an essential trace element that has two main physiological states in the body: reduced and oxidized, each corresponding to its respective ligand14,15. The transition between these two states determines the function of copper. Furthermore, copper engages with various ligands and is involved in a multitude of biochemical processes, including redox reactions, energy metabolism, and mitochondrial respiration, among others14. It has been shown that the recommended daily intake and daily requirement of dietary copper for adults are 0.9 mg and 2 mg, respectively15,16. The primary site of dietary copper absorption is the small intestine, which is dependent on two proteins, CTR1 and ATP7A, and maintains copper homeostasis in concert with intestinal biliary excretion17,18. There is now a large body of evidence linking copper metabolism in vivo not only to diseases such as breast cancer, lung cancer, hypertension, and stroke19–22 but also to colitis, colitis-associated cancers, and other colorectal cancers23. Therefore, the effect of copper on intestinal diseases and their associated symptoms deserves further investigation.
Over the past few years, a substantial amount of research has focused on the connection between dietary micronutrients and constipation24–27. However, the impact of consuming copper-rich foods on constipation has not been studied so far. This original study, which pooled a large dataset from the National Health and Nutrition Examination Survey (NHANES) 2005–2010, investigated and explored the correlation between dietary copper intake and constipation in U.S. adults, to provide valuable new insights and recommendations for clinical management and prevention of constipation.
Materials and methods
Survey description and study participants
The NHANES is a survey conducted by the National Center for Health Statistics of the US Centers for Disease Control and Prevention (CDC), which gathers data from a cross-sectional sample of the population that represents the nation. The questionnaire employs a design that includes stratification, multiple stages, and a probability-based selection of classes. At the mobile medical examination centers, individuals undergo a demographic, socio–economic, and medical health interview followed by a medical examination and laboratory tests. Written informed consent was obtained from all participants, and the CDC Ethics Review Board approved the protocol.
Rigorous inclusion and exclusion criteria were implemented to ensure the completeness and accuracy of the results. 31,034 participants were enrolled in the 2005–2010 survey cycle. Initially, we excluded participants with missing data from the bowel health questionnaire (N = 16,414), those with chronic diarrhea (N = 2602), those with colorectal cancer (N = 78), pregnant women (N = 293), and those who did not complete the dietary questionnaire (N = 200). Furthermore, individuals who had incomplete data regarding their body mass index (BMI), outliers in dietary energy intake, and missing information on lifestyle-related habits (such as smoking and alcohol consumption) were not included in the study26,28,29. Finally, individuals with missing data on medical comorbidities (such as heart disease, liver disease, hypertension, and diabetes), key demographic variables (including education level, marital status, and poverty-to-income ratio), physical activity, and dietary supplement usage were excluded from the study. The ultimate sample size for our study comprised 10,367 adult participants (age distribution 20–85 years). Figure 1 illustrates the detailed screening process for participants.
Figure 1.

Flowchart of participant selection from NHANES 2005–2010.
Definition of constipation
In the NHANES database, constipation was determined by either the frequency of stool per week or the consistency of feces30,31. Data on the texture of feces was documented in three rounds of the NHANES Bowel Health Questionnaire spanning from 2005 to 2010. Participants were asked to estimate their fecal consistency by referring to a card displaying a variety of colorful pictures representing different types of feces. They were then requested to indicate the number that corresponds to the fecal type that is typical or most frequently observed for them, according to the Bristol stool forms scale (BSFS). Constipation is characterized by BSFS type 1, which refers to hard lumps resembling nuts, or type 2, which is described as sausages with a lumpy texture. The definition of normal stool consistency includes BSFS type 3 (resembling a sausage, but with surface cracks), type 4 (resembling a sausage or snake, smooth and soft), or type 5 (soft lumps with distinct edges). Chronic diarrhea was characterized by BSFS type 6, which refers to feces that are fluffy, crumbly, and pasty with rough edges, or type 7, which describes watery feces with no solid crumbs. According to the definition, constipation was classified as either type 1 or type 227.
As part of the survey, participants were additionally inquired about their estimation of the number of times they have bowel movements in a week. We assessed the frequency of bowel movements by asking: “How many times do you usually have a bowel movement per week?”. Individuals with fewer than three bowel movements weekly were categorized as constipated, while those with three or more bowel movements weekly were classified as non-constipated 30,31.
Dietary copper intake
Previous studies have provided descriptions of techniques used to gather dietary information32,33. We used a multichannel approach to collect copper intake information from 24 h dietary recalls. Every interviewer underwent two interviews, during which dietary recalls were gathered. The first was a face-to-face interview with an investigator at a mobile screening center, followed by a subsequent phone interview within a span of 3–10 days. To ensure the reliability and accuracy of the study, we employed the average consumption derived from two 24 h dietary recalls. This method is both straightforward and widely utilized in comparable previous research34.
Covariates
To ensure the comprehensiveness of the study, multiple covariates were incorporated, drawing upon insights from previous research and clinical expertise. The covariates incorporated in the analysis comprised gender, age, race, educational level, marital status, BMI, smoking status, alcohol consumption, supplement use, antacid use, physical activity, medical comorbidities (including hypertension, diabetes, heart disease, and liver disease), as well as dietary information encompassing carbohydrate intake, protein intake, dietary fiber intake, and fluid intake. Levels of education were classified as ‘less than high school’, ‘high school or GED’, and ‘above high school’. The classification of BMI was divided into three categories: below average or healthy weight (< 25.0 kg/m2), overweight (25.0–30.0 kg/m2), and obese (≥ 30 kg/m2)24,35,36. Marital status was divided into three categories: married or cohabiting; divorced, separated or widowed; and unmarried. Smoking status was divided into three categories: smokers, ex-smokers, and never-smokers. Individuals who consumed a minimum of 12 alcoholic beverages annually were categorized as drinkers. Information on dietary intake conducted by NHANES between 2005 and 2010 was assessed by trained professional interviewers.
Statistical analyses
The power size of the study was calculated using PASS software (version 11) based on the large sample data set of NHANES to clarify that the current sample size has the efficacy to obtain reliable results. The significance level α was set at 0.05 and the power size derived using the current sample size (N = 10,367) was 1, proving that the sample size was adequate. Due to the non-normal distribution of dietary copper intake, a natural logarithmic Ln transformation was used before data analysis. In the logistic regression model, dietary copper intake was stratified into quartiles, with the lowest quartile (Q1) serving as the reference group. Continuous variables were characterized using the median and interquartile range, while categorical variables were presented as counts and percentages. Comparisons between groups for continuous variables were conducted using the Wilcoxon rank-sum test. For categorical data, the Fisher exact test was employed when expected frequencies were less than 5; otherwise, the Chi-squared test was utilized. Multifactorial logistic regression analyses were conducted to investigate the correlation between copper consumption and chronic constipation. Model 1 is a univariate model without the inclusion of covariates. Model 2 incorporates adjustments for primary demographic variables, including gender, age, and race. Model 3 represents a fully adjusted core model, extending model 2 by incorporating additional variables such as educational level, marital status, BMI, smoking status, alcohol consumption, physical activity, documented medical comorbidities (including hypertension, diabetes, heart disease, and liver disease), as well as dietary supplement and antacid usage, and detailed dietary information (including carbohydrate intake, protein intake, dietary fiber intake, and fluid consumption). Subgroup analyses were conducted to assess the robustness of the correlation between dietary copper intake and chronic constipation, as well as to identify potential variations across specific subpopulations. In addition, the dose–response relationship between dietary copper intake and constipation was assessed using the restricted cubic spline (RCS) smoothing curve fitting technique. By employing these statistical methodologies, a comprehensive analysis can be undertaken to investigate the potential correlation between dietary copper intake and the likelihood of experiencing constipation. Statistical analyses were performed using R (version 4.2.1) and MSTATA (version 0.93), and all tests of significance were two-sided, with the significance level set at P < 0.05.
Ethics approval and consent to participate
The data used in this study were extracted from NHANES (a publicly freely available database). All experimental protocols were approved by the NCHS Ethics Review Committee. Informed consent for the study was obtained from all subjects and/or their legal guardians by signing an informed consent form. The study was performed in strict accordance with the Declaration of Helsinki and was approved by the Ethics Committee of the Wuxi People’s Hospital with the ethical approval ID KY23188.
Results
Clinical baseline characteristics of subjects
Table 1 delineates the clinical baseline characteristics of the study participants, categorized by the presence or absence of constipation. Among the 10,367 individuals who satisfied the inclusion criteria and participated in the survey, 1122 were diagnosed with constipation, corresponding to a prevalence rate of 10.82%. Regarding racial demographics, the sample comprised 17.21% Mexican Americans, 51.10% non-Hispanic whites, 19.44% non-Hispanic blacks, and 12.25% individuals from other racial groups. The median age of the participants was 49 years. Figure 2 shows the gender–age pyramid diagram, which visualizes the gender and age distribution of this study population. Furthermore, the prevalence of constipation was significantly higher among women compared to men. It is noteworthy that the median dietary copper intake was significantly higher in the non-constipated group compared to the constipated group (1.17 vs. 1.02; P < 0.001).
Table 1.
Comparison of baseline characteristics between the constipated and non-constipated population groups.
| Characteristic | Overall N = 10,367 | Non-constipation N = 9245 | Constipation N = 1122 | P-value |
|---|---|---|---|---|
| Age | 49 (34, 63) | 49 (35, 64) | 45 (31, 62) | < 0.001 |
| Gender | ||||
| Male | 5315 (51.27%) | 4959 (53.64%) | 356 (31.73%) | < 0.001 |
| Female | 5052 (48.73%) | 4286 (46.36%) | 766 (68.27%) | |
| Race | ||||
| Mexican American | 1784 (17.21%) | 1610 (17.41%) | 174 (15.51%) | < 0.001 |
| Non-Hispanic white | 5298 (51.10%) | 4785 (51.76%) | 513 (45.72%) | |
| Non-Hispanic black | 2015 (19.44%) | 1733 (18.75%) | 282 (25.13%) | |
| Other races | 1270 (12.25%) | 1117 (12.08%) | 153 (13.64%) | |
| Education level | ||||
| Less than high school | 2690 (25.95%) | 2336 (25.27%) | 354 (31.55%) | < 0.001 |
| High school or GED | 2496 (24.08%) | 2183 (23.61%) | 313 (27.90%) | |
| Above high school | 5181 (49.98%) | 4726 (51.12%) | 455 (40.55%) | |
| Marital status | ||||
| Married or cohabiting | 6357 (61.32%) | 5730 (61.98%) | 627 (55.88%) | < 0.001 |
| Divorced, separated, or widowed | 2287 (22.06%) | 2013 (21.77%) | 274 (24.42%) | |
| Unmarried | 1723 (16.62%) | 1502 (16.25%) | 221 (19.70%) | |
| PIR | ||||
| < 2 | 4644 (44.80%) | 4031 (43.60%) | 613 (54.63%) | < 0.001 |
| ≥ 2 | 5723 (55.20%) | 5214 (56.40%) | 509 (45.37%) | |
| BMI (Kg/m2) | ||||
| < 25 | 3031 (29.24%) | 2625 (28.39%) | 406 (36.19%) | < 0.001 |
| 25–30 | 3582 (34.55%) | 3214 (34.76%) | 368 (32.80%) | |
| ≥ 30 | 3754 (36.21%) | 3406 (36.84%) | 348 (31.02%) | |
| Heart disease | ||||
| Yes | 423 (4.08%) | 376 (4.07%) | 47 (4.19%) | 0.845 |
| No | 9944 (95.92%) | 8869 (95.93%) | 1075 (95.81%) | |
| Liver diseases | ||||
| Yes | 340 (3.28%) | 306 (3.31%) | 34 (3.03%) | 0.619 |
| No | 10,027 (96.72%) | 8939 (96.69%) | 1088 (96.97%) | |
| Diabetes | ||||
| Yes | 1135 (10.95%) | 1008 (10.90%) | 127 (11.32%) | 0.674 |
| No | 9232 (89.05%) | 8237 (89.10%) | 995 (88.68%) | |
| Hypertension | ||||
| Yes | 3556 (34.30%) | 3217 (34.80%) | 339 (30.21%) | 0.002 |
| No | 6811 (65.70%) | 6028 (65.20%) | 783 (69.79%) | |
| Smoking status | ||||
| Smokers | 2306 (22.24%) | 2048 (22.15%) | 258 (22.99%) | < 0.001 |
| Ex-smokers | 2648 (25.54%) | 2426 (26.24%) | 222 (19.79%) | |
| Never-smokers | 5413 (52.21%) | 4771 (51.61%) | 642 (57.22%) | |
| Alcohol consumption | ||||
| Yes | 7607 (73.38%) | 6888 (74.51%) | 719 (64.08%) | < 0.001 |
| No | 2760 (26.62%) | 2357 (25.49%) | 403 (35.92%) | |
| Energy intake (Kcal) | ||||
| Low [503.5, 1612) | 3456 (33.34%) | 2974 (32.17%) | 482 (42.96%) | < 0.001 |
| Medium [1612, 2273) | 3454 (33.32%) | 3093 (33.46%) | 361 (32.17%) | |
| High [2273, 7420] | 3457 (33.35%) | 3178 (34.38%) | 279 (24.87%) | |
| Carbohydrate intake (g) | ||||
| Low [31.9, 197) | 3456 (33.34%) | 3032 (32.80%) | 424 (37.79%) | < 0.001 |
| Medium [197, 278) | 3453 (33.31%) | 3079 (33.30%) | 374 (33.33%) | |
| High [278, 971] | 3458 (33.36%) | 3134 (33.90%) | 324 (28.88%) | |
| Protein intake (g) | ||||
| Low [7.38, 61.9) | 3456 (33.34%) | 2960 (32.02%) | 496 (44.21%) | < 0.001 |
| Medium [61.9, 89.3) | 3454 (33.32%) | 3092 (33.45%) | 362 (32.26%) | |
| High [89.3, 322] | 3457 (33.35%) | 3193 (34.54%) | 264 (23.53%) | |
| Dietary fiber intake (g) | ||||
| Low [0, 11.8) | 3455 (33.33%) | 2951 (31.92%) | 504 (44.92%) | < 0.001 |
| Medium [11.8, 18.2) | 3446 (33.24%) | 3092 (33.45%) | 354 (31.55%) | |
| High [18.2, 80] | 3466 (33.43%) | 3202 (34.63%) | 264 (23.53%) | |
| Fluid intake (g) | ||||
| Low [23.4, 109) | 3455 (33.33%) | 3019 (32.66%) | 436 (38.86%) | < 0.001 |
| Medium [109, 157) | 3456 (33.34%) | 3099 (33.52%) | 357 (31.82%) | |
| High [157, 824] | 3456 (33.34%) | 3127 (33.82%) | 329 (29.32%) | |
| Supplements use | ||||
| Yes | 5004 (48.27%) | 4522 (48.91%) | 482 (42.96%) | < 0.001 |
| No | 5363 (51.73%) | 4723 (51.09%) | 640 (57.04%) | |
| Antacids use | ||||
| Yes | 1395 (13.46%) | 1255 (13.57%) | 140 (12.48%) | 0.309 |
| No | 8972 (86.54%) | 7990 (86.43%) | 982 (87.52%) | |
| Vigorous physical activity | ||||
| Yes | 2364 (22.80%) | 2145 (23.20%) | 219 (19.52%) | 0.005 |
| No | 8003 (77.20%) | 7100 (76.80%) | 903 (80.48%) | |
| Moderate physical activity | ||||
| Yes | 4357 (42.03%) | 3936 (42.57%) | 421 (37.52%) | 0.001 |
| No | 6010 (57.97%) | 5309 (57.43%) | 701 (62.48%) | |
| Dietary copper intake (mg) | 1.16 (0.87, 1.53) | 1.17 (0.88, 1.56) | 1.02 (0.77, 1.33) | < 0.001 |
PIR poverty-to-income ratio, BMI body mass index, GED general equivalency diploma.
Figure 2.
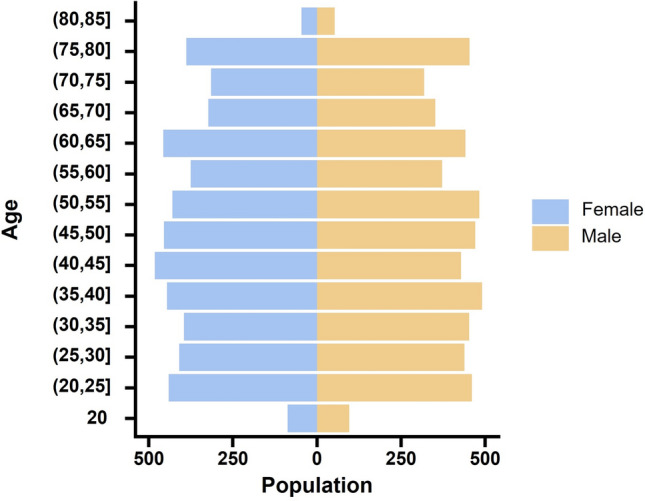
Pyramid diagram of gender and age distribution of participants.
The subjects were stratified into four quartile groups based on dietary copper intake, as detailed in Table 2. Group 1 (Q1) encompassed values ranging from 0.0755 to 0.87, group 2 (Q2) included values from 0.87 to 1.16, group 3 (Q3) comprised values from 1.16 to 1.53, and group 4 (Q4) contained values from 1.53 to 31.1. It is noteworthy that the prevalence of constipation gradually decreased as the subjects’ dietary copper intake increased (Q1: 15.13%; Q2: 11.52%; Q3: 9.93%; Q4: 6.71%; P < 0.001).
Table 2.
Baseline characteristics of the study population based on dietary copper intake.
| Characteristic | Dietary copper intake (mg) | P-value | |||
|---|---|---|---|---|---|
| Q1 [0.0755,0.87), N = 2591 | Q2 [0.87,1.16), N = 2586 | Q3 [1.16,1.53), N = 2598 | Q4 [1.53,31.1], N = 2592 | ||
| Age | 50 (34, 66) | 50 (34, 66) | 48 (34, 62) | 47 (35, 60) | < 0.001 |
| Gender | |||||
| Male | 968 (37.36%) | 1157 (44.74%) | 1424 (54.81%) | 1766 (68.13%) | < 0.001 |
| Female | 1623 (62.64%) | 1429 (55.26%) | 1174 (45.19%) | 826 (31.87%) | |
| Race | |||||
| Mexican American | 448 (17.29%) | 449 (17.36%) | 450 (17.32%) | 437 (16.86%) | < 0.001 |
| Non-Hispanic white | 1154 (44.54%) | 1276 (49.34%) | 1408 (54.20%) | 1460 (56.33%) | |
| Non-Hispanic black | 675 (26.05%) | 537 (20.77%) | 414 (15.94%) | 389 (15.01%) | |
| Other races | 314 (12.12%) | 324 (12.53%) | 326 (12.55%) | 306 (11.81%) | |
| Education level | |||||
| Less than high school | 890 (34.35%) | 731 (28.27%) | 571 (21.98%) | 498 (19.21%) | < 0.001 |
| High school or GED | 706 (27.25%) | 683 (26.41%) | 577 (22.21%) | 530 (20.45%) | |
| Above high school | 995 (38.40%) | 1172 (45.32%) | 1450 (55.81%) | 1564 (60.34%) | |
| Marital status | |||||
| Married or cohabiting | 1403 (54.15%) | 1560 (60.32%) | 1677 (64.55%) | 1717 (66.24%) | < 0.001 |
| Divorced, separated, or widowed | 697 (26.90%) | 598 (23.12%) | 528 (20.32%) | 464 (17.90%) | |
| Unmarried | 491 (18.95%) | 428 (16.55%) | 393 (15.13%) | 411 (15.86%) | |
| PIR | |||||
| < 2 | 1466 (56.58%) | 1185 (45.82%) | 1028 (39.57%) | 965 (37.23%) | < 0.001 |
| ≥ 2 | 1125 (43.42%) | 1401 (54.18%) | 1570 (60.43%) | 1627 (62.77%) | |
| Smoking status | |||||
| Smokers | 741 (28.60%) | 564 (21.81%) | 479 (18.44%) | 522 (20.14%) | < 0.001 |
| Ex-smokers | 577 (22.27%) | 663 (25.64%) | 694 (26.71%) | 714 (27.55%) | |
| Never-smokers | 1273 (49.13%) | 1359 (52.55%) | 1425 (54.85%) | 1356 (52.31%) | |
| Alcohol consumption | |||||
| Yes | 1699 (65.57%) | 1848 (71.46%) | 1978 (76.14%) | 2082 (80.32%) | < 0.001 |
| No | 892 (34.43%) | 738 (28.54%) | 620 (23.86%) | 510 (19.68%) | |
| Hypertension | |||||
| Yes | 982 (37.90%) | 959 (37.08%) | 848 (32.64%) | 767 (29.59%) | < 0.001 |
| No | 1609 (62.10%) | 1627 (62.92%) | 1750 (67.36%) | 1825 (70.41%) | |
| Diabetes | |||||
| Yes | 317 (12.23%) | 322 (12.45%) | 269 (10.35%) | 227 (8.76%) | < 0.001 |
| No | 2274 (87.77%) | 2264 (87.55%) | 2329 (89.65%) | 2365 (91.24%) | |
| Heart disease | |||||
| Yes | 144 (5.56%) | 107 (4.14%) | 90 (3.46%) | 82 (3.16%) | < 0.001 |
| No | 2447 (94.44%) | 2479 (95.86%) | 2508 (96.54%) | 2510 (96.84%) | |
| Liver diseases | |||||
| Yes | 58 (2.24%) | 92 (3.56%) | 92 (3.54%) | 98 (3.78%) | 0.007 |
| No | 2533 (97.76%) | 2494 (96.44%) | 2506 (96.46%) | 2494 (96.22%) | |
| Constipation | |||||
| Yes | 392 (15.13%) | 298 (11.52%) | 258 (9.93%) | 174 (6.71%) | < 0.001 |
| No | 2199 (84.87%) | 2288 (88.48%) | 2340 (90.07%) | 2418 (93.29%) | |
| BMI (Kg/m2) | |||||
| < 25 | 756 (29.18%) | 721 (27.88%) | 759 (29.21%) | 795 (30.67%) | 0.026 |
| 25–30 | 885 (34.16%) | 868 (33.57%) | 903 (34.76%) | 926 (35.73%) | |
| ≥ 30 | 950 (36.67%) | 997 (38.55%) | 936 (36.03%) | 871 (33.60%) | |
| Energy intake (Kcal) | |||||
| Low [503.5, 1612) | 1904 (73.49%) | 977 (37.78%) | 431 (16.59%) | 144 (5.56%) | < 0.001 |
| Medium [1612, 2273) | 556 (21.46%) | 1128 (43.62%) | 1124 (43.26%) | 646 (24.92%) | |
| High [2273, 7420] | 131 (5.06%) | 481 (18.60%) | 1043 (40.15%) | 1802 (69.52%) | |
| Carbohydrate intake (g) | |||||
| Low [31.9, 197) | 1798 (69.39%) | 1000 (38.67%) | 443 (17.05%) | 215 (8.29%) | < 0.001 |
| Medium [197, 278) | 607 (23.43%) | 1096 (42.38%) | 1099 (42.30%) | 651 (25.12%) | |
| High [278, 971] | 186 (7.18%) | 490 (18.95%) | 1056 (40.65%) | 1726 (66.59%) | |
| Protein intake (g) | |||||
| Low [7.38, 61.9) | 1833 (70.74%) | 970 (37.51%) | 479 (18.44%) | 174 (6.71%) | < 0.001 |
| Medium [61.9, 89.3) | 637 (24.59%) | 1122 (43.39%) | 1060 (40.80%) | 635 (24.50%) | |
| High [89.3, 322] | 121 (4.67%) | 494 (19.10%) | 1059 (40.76%) | 1783 (68.79%) | |
| Dietary fiber intake (g) | |||||
| Low [0, 11.8) | 2041 (78.77%) | 941 (36.39%) | 351 (13.51%) | 122 (4.71%) | < 0.001 |
| Medium [11.8, 18.2) | 517 (19.95%) | 1276 (49.34%) | 1146 (44.11%) | 507 (19.56%) | |
| High [18.2, 80] | 33 (1.27%) | 369 (14.27%) | 1101 (42.38%) | 1963 (75.73%) | |
| Fluid intake (g) | |||||
| Low [23.4, 109) | 1775 (68.51%) | 1023 (39.56%) | 458 (17.63%) | 199 (7.68%) | < 0.001 |
| Medium [109, 157) | 538 (20.76%) | 1052 (40.68%) | 1168 (44.96%) | 698 (26.93%) | |
| High [157, 824] | 278 (10.73%) | 511 (19.76%) | 972 (37.41%) | 1695 (65.39%) | |
| Supplements use | |||||
| Yes | 1008 (38.90%) | 1226 (47.41%) | 1347 (51.85%) | 1423 (54.90%) | < 0.001 |
| No | 1583 (61.10%) | 1360 (52.59%) | 1251 (48.15%) | 1169 (45.10%) | |
| Antacids use | |||||
| Yes | 276 (10.65%) | 355 (13.73%) | 363 (13.97%) | 401 (15.47%) | < 0.001 |
| No | 2315 (89.35%) | 2231 (86.27%) | 2235 (86.03%) | 2191 (84.53%) | |
| Vigorous physical activity | |||||
| Yes | 443 (17.10%) | 495 (19.14%) | 659 (25.37%) | 767 (29.59%) | < 0.001 |
| No | 2148 (82.90%) | 2091 (80.86%) | 1939 (74.63%) | 1825 (70.41%) | |
| Moderate physical activity | |||||
| Yes | 906 (34.97%) | 1006 (38.90%) | 1176 (45.27%) | 1269 (48.96%) | < 0.001 |
| No | 1685 (65.03%) | 1580 (61.10%) | 1422 (54.73%) | 1323 (51.04%) | |
PIR poverty-to-income ratio, BMI body mass index, GED general equivalency diploma.
Relationship between dietary copper intake and constipation
Table 3 presents the findings from both univariate and multivariate logistic regression analyses, which investigate the association between constipation and dietary copper intake. In model 1, which did not include any covariates, there was a significant negative association between dietary copper intake and the prevalence of constipation (OR = 0.50; 95% CI 0.44–0.57; P < 0.0001). This strong negative correlation remained significant (OR = 0.61; 95% CI 0.53–0.71; P < 0.0001) after accounting for key demographic factors such as gender, age, and ethnicity in model 2. Model 3 adjusted for all possible confounders and showed that each unit increase in dietary copper intake (converted to natural logarithms) was associated with a 20% reduction in the prevalence of constipation (OR = 0.80; 95% CI 0.65–0.98; P = 0.037). In the sensitivity analyses, continuous copper intake was further transformed into quartiles, with the first quartile group serving as the reference category. In model 3, it was observed that participants in the highest quartile of dietary copper intake exhibited a 27% lower prevalence of constipation compared to those in the lowest quartile, more precisely with an OR of 0.73 (95% CI 0.55–0.97, P = 0.0323), indicating a statistical difference between the two groups.
Table 3.
Correlation between dietary copper intake and constipation based on logistic regression analysis.
| Exposure | OR (95% CI), P value | ||
|---|---|---|---|
| Model 1 | Model 2 | Model 3 | |
| Per 1 unit incrementa |
0.50 (0.44, 0.57) < 0.0001 |
0.61 (0.53, 0.71) < 0.0001 |
0.80 (0.65, 0.98) 0.037 |
| Dietary copper intake (quartile) | |||
| Quartile 1 | Reference | Reference | Reference |
| Quartile 2 |
0.73 (0.62, 0.86) 0.0001 |
0.78 (0.66, 0.92) 0.0032 |
0.92 (0.76, 1.11) 0.3876 |
| Quartile 3 |
0.62 (0.52, 0.73) < 0.0001 |
0.72 (0.61, 0.85) 0.0002 |
0.95 (0.75, 1.19) 0.6590 |
| Quartile 4 |
0.40 (0.33, 0.49) < 0.0001 |
0.52 (0.43, 0.63) < 0.0001 |
0.73 (0.55, 0.97) 0.0323 |
| P for trend |
0.41 (0.35, 0.49) < 0.0001 |
0.54 (0.45, 0.65) < 0.0001 |
0.76 (0.57, 1.01) 0.0579 |
Model 1: No covariates were adjusted.
Model 2: Adjusted for gender, age, and race.
Model 3: Adjusted for gender, age, race, education level, marital status, BMI, alcohol consumption, smoking status, vigorous physical activity, moderate physical activity, supplements use, antacid use, medical comorbidities (hypertension, diabetes, heart disease, liver disease), and diet (carbohydrate intake, protein intake, dietary fiber intake, fluid intake).
aCopper intake was naturally logarithmically transformed before analysis. In the sensitivity analysis, copper intake was converted from a continuous variable to a categorical variable (quartiles).
Subgroup analyses
Subgroup analyses were conducted to investigate the correlation between dietary copper consumption and constipation. The results, as shown in Fig. 3, the negative association between dietary copper intake and constipation was more pronounced in participants under 60 years of age, non-hypertensives, alcohol drinkers, vigorous exercisers, and those using dietary supplements. The interaction P-values for all subgroups were greater than 0.05, indicating that our findings were stable and consistent across subgroups.
Figure 3.

Subgroup analysis of the relationship between dietary copper intake and constipation.
Linear relationship between dietary copper intake and constipation
To further investigate the dose–response relationship between dietary copper intake and constipation, we employed RCS modeling for curve fitting. The adjusted smoothed curve, accounting for all covariates and presented in Fig. 4, demonstrated a significant linear negative association between copper intake and constipation (P-nonlinear = 0.756).
Figure 4.
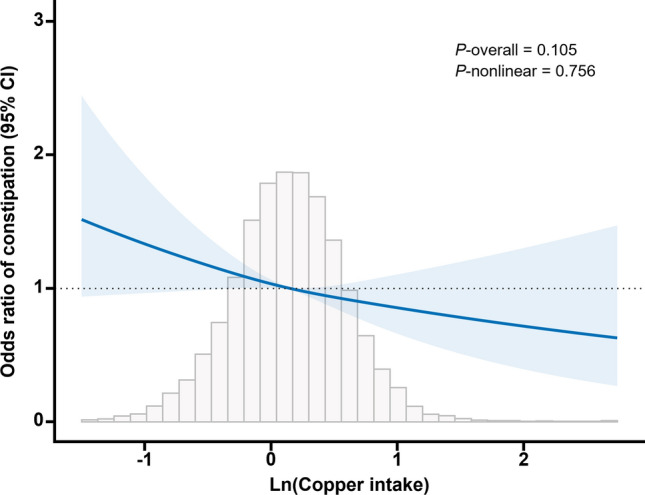
Dose–response relationship between dietary copper intake and constipation. Adjusted for gender, age, race, education level, marital status, BMI, alcohol consumption, smoking status, vigorous physical activity, moderate physical activity, supplements use, antacid use, medical comorbidities (hypertension, diabetes, heart disease, liver disease), and diet (carbohydrate intake, protein intake, dietary fiber intake, fluid intake).
Discussion
This study investigated the potential correlation between the consumption of copper in the diet and the occurrence of constipation in adults recorded in the NHANES database. Comprehensive logistic regression analysis showed a negative association between dietary copper intake and chronic constipation. Moreover, our subgroup analyses revealed that the inverse correlation between copper consumption and constipation remained consistent among the overall populace. Curve-fitting analysis additionally indicated a direct correlation, indicating that a suitable augmentation in copper consumption could potentially decrease the likelihood of experiencing constipation.
In recent years, researchers have investigated potential associations between chronic constipation and dietary micronutrients, as well as microbiota, through ongoing analysis of the NHANES database. Wang and colleagues37 claimed a nonlinear positive association between dietary inflammation index and constipation in US adults, and that this association was not consistent across racial subgroups. Interestingly, Hong and his team34 found that the correlation between dietary protein intake and constipation was statistically different by gender. For men, a moderate increase in protein intake helped prevent constipation, while for women, exceeding a certain threshold increased the risk of constipation. A large cross-sectional study conducted by Wang et al.38 demonstrated a significant negative correlation between the incidence of constipation and overall oxidative balance score and diet-related oxidative balance score and concluded that the intake of an antioxidant-rich diet is essential for the prevention of constipation. This may be attributed to the role of oxidative stress. Oxidative stress affects constipation primarily by influencing the gut microbiota and enteric nervous system, which can be found in constipated patients with a significant reduction in the diversity of the gut microbiota and enteric neurons, and leads to impaired intestinal motility. Yang and colleagues39 demonstrated that the consumption of diets rich in active microorganisms is correlated with a reduced prevalence of constipation. A clinical trial indicated that the intake of fermented milk containing a specific strain of Lactobacillus paracasei alleviated constipation symptoms and increased bowel frequency in individuals with depression. This effect is likely associated with the modulation of the gut microbiota and a reduction in IL-6 levels40. Multiple lines of evidence indicate a significant crosstalk between the gut microbiome and colonic motility. A primary characteristic of gut dysbiosis in individuals with constipation is the diminished presence of lactate- and butyrate-producing bacteria, coupled with an elevated concentration of methanogenic bacteria41. The gut microbiota can modulate the enteric nervous system (ENS) via gut commensal bacteria, thereby affecting the rate and frequency of colonic peristalsis. In addition, gut microbes can act on the ENS through bacterial metabolites (such as short-chain fatty acids, bile acids, and methane) that act as signaling molecules to accelerate or delay intestinal transport42,43.
To the best of our knowledge, this investigation represents the inaugural cross-sectional study to examine the association between dietary copper intake and constipation, a subject that has not been explored in depth in prior large-scale epidemiologic research. Upon comprehensive adjustment for potential confounders, our findings indicate that higher dietary copper intake is associated with a reduced risk of constipation, demonstrating a significant inverse dose–response relationship. This significant finding raises the awareness of clinical and healthcare practitioners about the impact of dietary trace elements on intestinal health, helps clinical and healthcare practitioners to understand the impact of dietary trace elements on intestinal health, and is of great significance for the development of personalized dietary regimens and rational supplementation of trace copper elements for patients with constipation. Prior research endeavors have explored the connection between copper and numerous ailments, utilizing diverse epidemiological methodologies and concentrating on various target populations. Klevay LM et al. noted that low copper is associated with anemia16, and He et al. also noted a U-shaped correlation between copper and hypertension21. Furthermore, as copper is selectively elevated in cancer, it inevitably reflects a correlation with gastrointestinal tumors such as colon cancer. Liao et al. in a study noted that elevated copper was attributed to IL-17 inducing the metalloreductase STEAP4. This enzyme promotes the cellular uptake of copper (assisted by the copper transport protein, CTR1) accompanied by an elevation of superoxide dismutase 1 (SOD1) elevation and sustained activation of NFκB, which in turn activates X-chain inhibitor of apoptosis (XIAP), ultimately promoting colon tumor growth44,45. Interestingly, however, Al-Zharani M et al. stated in an evaluation report that copper nanoparticles (CuNPs) have antitumor effects on colon cancer46. In the most recent copper death study, Tsvetkov P et al. concluded that copper plays a role in mediating cell death with the involvement of mitochondrial respiration, relying on the FDX1 (copper reductase) to lipidated proteins (in particular, to bind to one of the circulating proteins, TCA). This implies that copper overload promotes cell death47. Indeed, as early as 2002, Novak-Hofer I et al. investigated the role of copper-67 in immunotherapy for tumor radiotherapy, which has a higher uptake and persistence rate than radioactive iodine and accumulates in cells for therapeutic effects48. This shows that copper complexes or isotopes, for example, can be used as therapeutic tools for diseases. Also in terms of inflammation, in inflammatory bowel disease, the COMMD1 gene, which is closely related to copper, is under-expressed. This activates the STAT3 pathway, which in turn promotes the transformation of inflammation to inflammation-associated cancers by a mechanism whereby COMMD1 can interact with endogenous ubiquitination ligases, leading to ubiquitination of the NF-κB subunit, and ultimately inhibition of NF-κB activity49. This again reflects the specific role of copper in colon tumors or inflammation. Therefore, our findings could serve as further evidence and extension of the effects of copper on the gastrointestinal tract.
However, it has previously been shown that excess copper promotes inflammation in the gut and also damages the physical and chemical barriers on the surface of the jejunum and colon. This leads to limited expression of mucus-related genes and reduced secretion of the mucin MUC250. Interestingly, in another study, Reznik N et al. showed that the mucin MUC2 binds to both Cu1+ and Cu2+, preventing the excessive redox function of copper as a way of modulating the toxic effects of excessive copper intake51. This shows that there is a close link between copper and mucins. On the other hand, in a study of Lactobacillus plantarum PS128 and mouse intestines, Chen et al. found that this bacterium can change the constipation of mice with a laxative effect. The reason for this is that in mice after the action of this bacterium, in addition to the increase in small bowel peristalsis, there was also a significant increase in mucins in the distal colonic tissue52. Combined with our results of a negative correlation between copper intake and constipation, it is clear that there is a complex link between copper, mucins, and constipation. Of course, since there are no studies on the mechanisms directly related to copper and constipation, there is no clear conclusion as to whether copper affects constipation through mucins. In addition, copper toxicity is not limited to the intestinal tract, but also affects the nervous system. Excessive copper accumulation can damage the brain, which may also contribute to depression53. In a recent meta-analysis, Ding et al. found that overall the linear relationship between dietary copper intake and depression was negatively correlated and robust in the female population, but not in men54. The mechanism for this is related to the attenuated inhibition of pro-inflammatory factor release by copper55,56. This also happens to be consistent with the fact that it is more common in women among constipated patients. In summary, multiple perspectives have demonstrated that both the indirect and direct effects of copper intake on constipation cannot be ignored.
The study’s advantages encompass the utilization of a nationally representative group of U.S. citizens, encompassing a substantial number and diverse array of demographic factors, dietary variables, and comorbid conditions. Data on constipation was gathered from the NHANES database between 2005 and 2010, and the collected data was analyzed to ensure its generalizability. In addition, although constipation can be treated in several ways, the economic and life suffering it causes cannot be ignored, and therefore prevention of constipation is of great significance. Dietary modification is a simple and convenient measure for constipated patients and potentially constipated patients, which makes our study informative for the treatment and prevention of constipation. Of course, this study has limitations. Firstly, this was a cross-sectional study and it was not possible to determine a before-and-after causal relationship between dietary copper intake and constipation. Second, much of the dietary information was obtained by interviewing subjects, which is highly influenced by recall and subjective feelings, and two 24 h dietary interviews may not reflect an individual’s long-term dietary habits. Finally, although we included multiple diseases, antacid use, and supplement use as covariates, there were still some confounding factors affecting constipation that were not taken into account, so we need to analyze the findings with caution. Future studies could build on this study, supplemented with prospective cohort follow-up, to further analyze the relationship between constipation and whether or not patients with these disorders take medication and receive specific treatments, as well as to explore potential physiological mechanisms underlying the effect of dietary copper on constipation.
Conclusion
In summary, our study reveals a significant inverse correlation between dietary copper consumption and chronic constipation among the adult population at large. This observed alleviation of constipation symptoms can be attributed to the softening effect of dietary copper on fecal matter and its ability to enhance intestinal motility. Consequently, these findings offer valuable insights for the management of constipation symptoms. It is recommended that healthcare professionals prioritize the promotion of a well-balanced diet as an initial therapeutic approach before resorting to medical interventions.
Acknowledgements
The authors thank all the staff for their help.
Abbreviations
- BMI
Body mass index
- CI
Confidence interval
- OR
Odds ratio
- SD
Standard deviation
- NHANES
National Health and Nutrition Examination Survey
- PIR
Poverty-to-income ratio
- GED
General equivalency diploma
- NCHS
The National Center for Health Statistics
- CDC
Centers for Disease Control and Prevention
- RCS
Restricted cubic spline
Author contributions
WYD, YKW, CY, YFL, ZQT, YL, and WS contributed to study conception and design; WYD, YKW, CY, and ZQT contributed to data acquisition and analysis; WYD, YKW, and YL contributed to the interpretation of data; WS and YL had primary responsibility for final content; all authors contributed to critical revision and approved the final manuscript.
Funding
This work was supported by the Top Talent Support Program for young and middle-aged people of the Wuxi Health Committee (Grant No. HB2020007).
Data availability
The datasets generated and/or analyzed for the current study can be found in the NHANES database. Raw data are available from the corresponding author upon request.
Competing interests
The authors declare no competing interests.
Footnotes
Publisher's note
Springer Nature remains neutral with regard to jurisdictional claims in published maps and institutional affiliations.
These authors contributed equally: Wenyi Du, Chen Yan and Yinkang Wang.
Contributor Information
Yuan Liu, Email: liuyuanjs@outlook.com.
Wei Shen, Email: shenweijs@outlook.com.
References
- 1.Higgins, P. D. & Johanson, J. F. Epidemiology of constipation in North America: A systematic review. Am. J. Gastroenterol.99, 750–759. 10.1111/j.1572-0241.2004.04114.x (2004). 10.1111/j.1572-0241.2004.04114.x [DOI] [PubMed] [Google Scholar]
- 2.Pare, P., Ferrazzi, S., Thompson, W. G., Irvine, E. J. & Rance, L. An epidemiological survey of constipation in Canada: Definitions, rates, demographics, and predictors of health care seeking. Am. J. Gastroenterol.96, 3130–3137. 10.1111/j.1572-0241.2001.05259.x (2001). 10.1111/j.1572-0241.2001.05259.x [DOI] [PubMed] [Google Scholar]
- 3.Belsey, J., Greenfield, S., Candy, D. & Geraint, M. Systematic review: Impact of constipation on quality of life in adults and children. Aliment. Pharmacol. Ther.31, 938–949. 10.1111/j.1365-2036.2010.04273.x (2010). 10.1111/j.1365-2036.2010.04273.x [DOI] [PubMed] [Google Scholar]
- 4.Mugie, S. M., Benninga, M. A. & Di Lorenzo, C. Epidemiology of constipation in children and adults: A systematic review. Best Pract. Res. Clin. Gastroenterol.25, 3–18. 10.1016/j.bpg.2010.12.010 (2011). 10.1016/j.bpg.2010.12.010 [DOI] [PubMed] [Google Scholar]
- 5.Rao, S. S., Rattanakovit, K. & Patcharatrakul, T. Diagnosis and management of chronic constipation in adults. Nat. Rev. Gastroenterol. Hepatol.13, 295–305. 10.1038/nrgastro.2016.53 (2016). 10.1038/nrgastro.2016.53 [DOI] [PubMed] [Google Scholar]
- 6.Vriesman, M. H., Koppen, I. J. N., Camilleri, M., Di Lorenzo, C. & Benninga, M. A. Management of functional constipation in children and adults. Nat. Rev. Gastroenterol. Hepatol.17, 21–39. 10.1038/s41575-019-0222-y (2020). 10.1038/s41575-019-0222-y [DOI] [PubMed] [Google Scholar]
- 7.Devroede, G. et al. Traumatic constipation. Gastroenterology77, 1258–1267 (1979). 10.1016/0016-5085(79)90166-5 [DOI] [PubMed] [Google Scholar]
- 8.Dhroove, G., Chogle, A. & Saps, M. A million-dollar work-up for abdominal pain: Is it worth it?. J. Pediatr. Gastroenterol. Nutr.51, 579–583. 10.1097/MPG.0b013e3181de0639 (2010). 10.1097/MPG.0b013e3181de0639 [DOI] [PubMed] [Google Scholar]
- 9.Rasquin, A. et al. Childhood functional gastrointestinal disorders: Child/adolescent. Gastroenterology130, 1527–1537. 10.1053/j.gastro.2005.08.063 (2006). 10.1053/j.gastro.2005.08.063 [DOI] [PMC free article] [PubMed] [Google Scholar]
- 10.Benninga, M. A. et al. Childhood functional gastrointestinal disorders: Neonate/toddler. Gastroenterology10.1053/j.gastro.2016.02.016 (2016). 10.1053/j.gastro.2016.02.016 [DOI] [PubMed] [Google Scholar]
- 11.Camilleri, M. Diagnosis and treatment of irritable bowel syndrome: A review. JAMA325, 865–877. 10.1001/jama.2020.22532 (2021). 10.1001/jama.2020.22532 [DOI] [PubMed] [Google Scholar]
- 12.Mearin, F. et al. Bowel disorders. Gastroenterology10.1053/j.gastro.2016.02.031 (2016). 10.1053/j.gastro.2016.02.031 [DOI] [PubMed] [Google Scholar]
- 13.Wald, E. R. et al. Bowel habits and toilet training in a diverse population of children. J. Pediatr. Gastroenterol. Nutr.48, 294–298. 10.1097/mpg.0b013e31817efbf7 (2009). 10.1097/mpg.0b013e31817efbf7 [DOI] [PubMed] [Google Scholar]
- 14.Tisato, F., Marzano, C., Porchia, M., Pellei, M. & Santini, C. Copper in diseases and treatments, and copper-based anticancer strategies. Med. Res. Rev.30, 708–749. 10.1002/med.20174 (2010). 10.1002/med.20174 [DOI] [PubMed] [Google Scholar]
- 15.Ge, E. J. et al. Connecting copper and cancer: From transition metal signalling to metalloplasia. Nat. Rev. Cancer22, 102–113. 10.1038/s41568-021-00417-2 (2022). 10.1038/s41568-021-00417-2 [DOI] [PMC free article] [PubMed] [Google Scholar]
- 16.Klevay, L. M., Reck, S. J. & Barcome, D. F. Evidence of dietary copper and zinc deficiencies. JAMA241, 1916–1918. 10.1001/jama.1979.03290440038025 (1979). 10.1001/jama.1979.03290440038025 [DOI] [PubMed] [Google Scholar]
- 17.Wang, Y. et al. Maternofetal and neonatal copper requirements revealed by enterocyte-specific deletion of the Menkes disease protein. Am. J. Physiol. Gastrointest. Liver Physiol.303, G1236–G1244. 10.1152/ajpgi.00339.2012 (2012). 10.1152/ajpgi.00339.2012 [DOI] [PMC free article] [PubMed] [Google Scholar]
- 18.Nose, Y., Kim, B. E. & Thiele, D. J. Ctr1 drives intestinal copper absorption and is essential for growth, iron metabolism, and neonatal cardiac function. Cell Metab.4, 235–244. 10.1016/j.cmet.2006.08.009 (2006). 10.1016/j.cmet.2006.08.009 [DOI] [PubMed] [Google Scholar]
- 19.Cui, L. et al. Mitochondrial copper depletion suppresses triple-negative breast cancer in mice. Nat. Biotechnol.39, 357–367. 10.1038/s41587-020-0707-9 (2021). 10.1038/s41587-020-0707-9 [DOI] [PMC free article] [PubMed] [Google Scholar]
- 20.Dìez, M., Cerdàn, F. J., Arroyo, M. & Balibrea, J. L. Use of the copper/zinc ratio in the diagnosis of lung cancer. Cancer63, 726–730 (1989). [DOI] [PubMed] [Google Scholar]
- 21.He, P. et al. U-shaped association between dietary copper intake and new-onset hypertension. Clin. Nutr.41, 536–542. 10.1016/j.clnu.2021.12.037 (2022). 10.1016/j.clnu.2021.12.037 [DOI] [PubMed] [Google Scholar]
- 22.Yang, L., Chen, X., Cheng, H. & Zhang, L. Dietary copper intake and risk of stroke in adults: A case-control study based on national health and nutrition examination survey 2013–2018. Nutrients10.3390/nu14030409 (2022). 10.3390/nu14030409 [DOI] [PMC free article] [PubMed] [Google Scholar]
- 23.Li, Z. R. et al. Macrocyclic colibactin induces DNA double-strand breaks via copper-mediated oxidative cleavage. Nat. Chem.11, 880–889. 10.1038/s41557-019-0317-7 (2019). 10.1038/s41557-019-0317-7 [DOI] [PMC free article] [PubMed] [Google Scholar]
- 24.Wang, C., Zhang, L. & Li, L. Association between selenium intake with chronic constipation and chronic diarrhea in adults: Findings from the national health and nutrition examination survey. Biol. Trace Elem. Res.199, 3205–3212. 10.1007/s12011-020-02451-x (2021). 10.1007/s12011-020-02451-x [DOI] [PubMed] [Google Scholar]
- 25.Zhang, L., Du, Z., Li, Z., Yu, F. & Li, L. Association of dietary magnesium intake with chronic constipation among US adults: Evidence from the national health and nutrition examination survey. Food Sci. Nutr.9, 6634–6641. 10.1002/fsn3.2611 (2021). 10.1002/fsn3.2611 [DOI] [PMC free article] [PubMed] [Google Scholar]
- 26.Zhao, X., Wang, L. & Quan, L. Association between dietary phosphorus intake and chronic constipation in adults: Evidence from the national health and nutrition examination survey. BMC Gastroenterol.23, 24. 10.1186/s12876-022-02629-8 (2023). 10.1186/s12876-022-02629-8 [DOI] [PMC free article] [PubMed] [Google Scholar]
- 27.Li, Y., Tong, W. D. & Qian, Y. Effect of physical activity on the association between dietary fiber and constipation: Evidence from the national health and nutrition examination survey 2005–2010. J. Neurogastroenterol. Motil.27, 97–107. 10.5056/jnm20051 (2021). 10.5056/jnm20051 [DOI] [PMC free article] [PubMed] [Google Scholar]
- 28.Yang, S. et al. Association of dietary energy intake with constipation among men and women: Results from the national health and nutrition examination survey. Front. Nutr.9, 856138. 10.3389/fnut.2022.856138 (2022). 10.3389/fnut.2022.856138 [DOI] [PMC free article] [PubMed] [Google Scholar]
- 29.Liu, Q., Kang, Y. & Yan, J. Association between overall dietary quality and constipation in American adults: A cross-sectional study. BMC Public Health22, 1971. 10.1186/s12889-022-14360-w (2022). 10.1186/s12889-022-14360-w [DOI] [PMC free article] [PubMed] [Google Scholar]
- 30.Markland, A. D. et al. Association of low dietary intake of fiber and liquids with constipation: Evidence from the national health and nutrition examination survey. Am. J. Gastroenterol.108, 796–803. 10.1038/ajg.2013.73 (2013). 10.1038/ajg.2013.73 [DOI] [PMC free article] [PubMed] [Google Scholar]
- 31.Wilson, P. B. Associations between physical activity and constipation in adult Americans: Results from the national health and nutrition examination survey. Neurogastroenterol. Motil.32, e13789. 10.1111/nmo.13789 (2020). 10.1111/nmo.13789 [DOI] [PubMed] [Google Scholar]
- 32.Chen, F., Yang, D. & Wang, Z. Associations between iron intake and serum iron with inflammatory bowel disease and chronic diarrheal symptoms in adults: The national health and nutrition examination survey, 2007–2010. Biol. Trace Elem. Res.199, 4084–4091. 10.1007/s12011-020-02550-9 (2021). 10.1007/s12011-020-02550-9 [DOI] [PubMed] [Google Scholar]
- 33.Zhang, L., Shao, F. & Li, L. Association of copper and zinc intake with inflammatory bowel disease and fecal incontinence symptoms: Evidence from the national health and nutrition examination survey. Biol. Trace Elem. Res.199, 2543–2551. 10.1007/s12011-020-02390-7 (2021). 10.1007/s12011-020-02390-7 [DOI] [PubMed] [Google Scholar]
- 34.Hong, Y., Shen, H., Chen, X. & Li, G. Gender differences in the association between dietary protein intake and constipation: Findings from NHANES. Front. Nutr.11, 1393596. 10.3389/fnut.2024.1393596 (2024). 10.3389/fnut.2024.1393596 [DOI] [PMC free article] [PubMed] [Google Scholar]
- 35.Ballou, S. et al. Chronic diarrhea and constipation are more common in depressed individuals. Clin. Gastroenterol. Hepatol.17, 2696–2703. 10.1016/j.cgh.2019.03.046 (2019). 10.1016/j.cgh.2019.03.046 [DOI] [PMC free article] [PubMed] [Google Scholar]
- 36.Shen, L. et al. Lower dietary fibre intake, but not total water consumption, is associated with constipation: A population-based analysis. J. Hum. Nutr. Diet32, 422–431. 10.1111/jhn.12589 (2019). 10.1111/jhn.12589 [DOI] [PubMed] [Google Scholar]
- 37.Wang, B. et al. Association of dietary inflammatory index with constipation: Evidence from the national health and nutrition examination survey. Food Sci. Nutr.12, 2122–2130. 10.1002/fsn3.3914 (2024). 10.1002/fsn3.3914 [DOI] [PMC free article] [PubMed] [Google Scholar]
- 38.Wang, Y. et al. Associations between the oxidative balance score and constipation: A cross-sectional study of the NHANES, 2005–2010. BMC Public Health24, 1908. 10.1186/s12889-024-19428-3 (2024). 10.1186/s12889-024-19428-3 [DOI] [PMC free article] [PubMed] [Google Scholar]
- 39.Yang, C. et al. Association between dietary intake of live microbes and chronic constipation in adults. J. Nutr.154, 526–534. 10.1016/j.tjnut.2023.11.032 (2024). 10.1016/j.tjnut.2023.11.032 [DOI] [PubMed] [Google Scholar]
- 40.Zhang, X. et al. Effects of fermented milk containing Lacticaseibacillus paracasei strain Shirota on constipation in patients with depression: A randomized, double-blind placebo-controlled trial. Nutrients10.3390/nu13072238 (2021). 10.3390/nu13072238 [DOI] [PMC free article] [PubMed] [Google Scholar]
- 41.Pan, R. et al. Crosstalk between the gut microbiome and colonic motility in chronic constipation: Potential mechanisms and microbiota modulation. Nutrients10.3390/nu14183704 (2022). 10.3390/nu14183704 [DOI] [PMC free article] [PubMed] [Google Scholar]
- 42.Martin-Gallausiaux, C., Marinelli, L., Blottière, H. M., Larraufie, P. & Lapaque, N. SCFA: Mechanisms and functional importance in the gut. Proc. Nutr. Soc.80, 37–49. 10.1017/s0029665120006916 (2021). 10.1017/s0029665120006916 [DOI] [PubMed] [Google Scholar]
- 43.Sayin, S. I. et al. Gut microbiota regulates bile acid metabolism by reducing the levels of tauro-beta-muricholic acid, a naturally occurring FXR antagonist. Cell Metab.17, 225–235. 10.1016/j.cmet.2013.01.003 (2013). 10.1016/j.cmet.2013.01.003 [DOI] [PubMed] [Google Scholar]
- 44.Makhov, P. et al. Zinc chelation induces rapid depletion of the X-linked inhibitor of apoptosis and sensitizes prostate cancer cells to TRAIL-mediated apoptosis. Cell Death Differ.15, 1745–1751. 10.1038/cdd.2008.106 (2008). 10.1038/cdd.2008.106 [DOI] [PMC free article] [PubMed] [Google Scholar]
- 45.Liao, Y. et al. Inflammation mobilizes copper metabolism to promote colon tumorigenesis via an IL-17-STEAP4-XIAP axis. Nat. Commun.11, 900. 10.1038/s41467-020-14698-y (2020). 10.1038/s41467-020-14698-y [DOI] [PMC free article] [PubMed] [Google Scholar]
- 46.Al-Zharani, M. et al. Antitumor effect of copper nanoparticles on human breast and colon malignancies. Environ. Sci. Pollut. Res. Int.28, 1587–1595. 10.1007/s11356-020-09843-5 (2021). 10.1007/s11356-020-09843-5 [DOI] [PubMed] [Google Scholar]
- 47.Tsvetkov, P. et al. Copper induces cell death by targeting lipoylated TCA cycle proteins. Science375, 1254–1261. 10.1126/science.abf0529 (2022). 10.1126/science.abf0529 [DOI] [PMC free article] [PubMed] [Google Scholar]
- 48.Novak-Hofer, I. & Schubiger, P. A. Copper-67 as a therapeutic nuclide for radioimmunotherapy. Eur. J. Nucl. Med. Mol. Imaging29, 821–830. 10.1007/s00259-001-0724-y (2002). 10.1007/s00259-001-0724-y [DOI] [PubMed] [Google Scholar]
- 49.Maine, G. N., Mao, X., Komarck, C. M. & Burstein, E. COMMD1 promotes the ubiquitination of NF-kappa B subunits through a cullin-containing ubiquitin ligase. EMBO J.26, 436–447. 10.1038/sj.emboj.7601489 (2007). 10.1038/sj.emboj.7601489 [DOI] [PMC free article] [PubMed] [Google Scholar]
- 50.Liao, J. et al. Toxic effects of copper on the jejunum and colon of pigs: Mechanisms related to gut barrier dysfunction and inflammation influenced by the gut microbiota. Food Funct.12, 9642–9657. 10.1039/d1fo01286j (2021). 10.1039/d1fo01286j [DOI] [PubMed] [Google Scholar]
- 51.Reznik, N. et al. Intestinal mucin is a chaperone of multivalent copper. Cell185, 4206-4215.e4211. 10.1016/j.cell.2022.09.021 (2022). 10.1016/j.cell.2022.09.021 [DOI] [PubMed] [Google Scholar]
- 52.Chen, C. M. et al.Lactobacillus plantarum PS128 promotes intestinal motility, mucin production, and serotonin signaling in mice. Probiotics Antimicrob. Proteins14, 535–545. 10.1007/s12602-021-09814-3 (2022). 10.1007/s12602-021-09814-3 [DOI] [PMC free article] [PubMed] [Google Scholar]
- 53.Winge, D. R. & Mehra, R. K. Host defenses against copper toxicity. Int. Rev. Exp. Pathol.31, 47–83. 10.1016/b978-0-12-364931-7.50007-0 (1990). 10.1016/b978-0-12-364931-7.50007-0 [DOI] [PubMed] [Google Scholar]
- 54.Ding, J. & Zhang, Y. Associations of dietary copper, selenium, and manganese intake with depression: A meta-analysis of observational studies. Front. Nutr.9, 854774. 10.3389/fnut.2022.854774 (2022). 10.3389/fnut.2022.854774 [DOI] [PMC free article] [PubMed] [Google Scholar]
- 55.Maes, M. et al. Increased plasma concentrations of interleukin-6, soluble interleukin-6, soluble interleukin-2 and transferrin receptor in major depression. J. Affect. Disord.34, 301–309. 10.1016/0165-0327(95)00028-l (1995). 10.1016/0165-0327(95)00028-l [DOI] [PubMed] [Google Scholar]
- 56.Xu, J. et al. Low-dose copper exposure exacerbates depression-like behavior in ApoE4 transgenic mice. Oxid. Med. Cell. Longev.2021, 6634181. 10.1155/2021/6634181 (2021). 10.1155/2021/6634181 [DOI] [PMC free article] [PubMed] [Google Scholar]
Associated Data
This section collects any data citations, data availability statements, or supplementary materials included in this article.
Data Availability Statement
The datasets generated and/or analyzed for the current study can be found in the NHANES database. Raw data are available from the corresponding author upon request.