

Abstract
Plant leaf diseases are a significant concern in agriculture due to their detrimental impact on crop productivity and food security. Effective disease management depends on the early and accurate detection and diagnosis of these conditions, facilitating timely intervention and mitigation strategies. In this study, we address the pressing need for accurate and efficient methods for detecting leaf diseases by introducing a new architecture called DenseNet201Plus. DenseNet201 was modified by including superior data augmentation and pre-processing techniques, an attention-based transition mechanism, multiple attention modules, and dense blocks. These modifications enhance the robustness and accuracy of the proposed DenseNet201Plus model in diagnosing diseases related to plant leaves. The proposed architecture was trained using two distinct datasets: Banana Leaf Disease and Black Gram Leaf Disease. Through extensive experimentation, we evaluated the performance of DenseNet201Plus in terms of various classification metrics and achieved values of 0.9012, 0.9012, 0.9012, and 0.9716 for accuracy, precision, recall, and AUC for the banana leaf disease dataset, respectively. Similarly, the black gram leaf disease dataset model provides values of 0.9950, 0.9950, 0.9950, and 1.0 for accuracy, precision, recall, and AUC. Compared to other well-known pre-trained convolutional neural network (CNN) architectures, our proposed model demonstrates superior performance in both utilized datasets. Last but not least, we combined the strength of Grad-CAM++ with our proposed model to enhance the interpretability and localization of disease areas, providing valuable insights for agricultural practitioners and researchers to make informed decisions and optimize disease management strategies.
Keywords: Leaf diseases, Transfer-learning, DenseNet201, Data augmentation, Explainable AI, Deep-learning
1. Introduction
Plant leaf diseases significantly impact agriculture and the environment, with far-reaching consequences for global ecosystems. These diseases affect various crops, from staple foods to ornamental plants, and their effects are observed in many facets of human life and the natural world [1], [2], [3]. Plant leaf diseases have a wide-ranging influence on agricultural production, food security, economic stability, and even ecosystem health [4], [5]. These diseases can result in lower agricultural output, higher production costs, food shortages, and economic losses for farmers, making them a significant problem in the agricultural industry. Furthermore, plant diseases can cause changes in plant populations, affecting the species that rely on them and disrupting their ecological balance. Therefore, understanding the impact of plant leaf diseases is critical for solving food security and sustainability issues while protecting the complicated interplay between plants, ecosystems, and human livelihoods [6], [7].
By the year 2050, there will likely be more than 9 billion people on the planet, which will cause food consumption to double. As a result, there will be a critical need to boost food production by at least 70% to meet this increased demand [8]. Tackling the issue of food security, whether on a local or global scale, is a big issue that needs to be resolved to ensure the constant pursuit of development that protects resources for future generations while meeting present needs. Therefore, it is crucial to prioritize aspects such as maintaining a sustainable environment, preventing diseases, and achieving better quality and yield to enhance agricultural output and meet future demands. To achieve the necessary agricultural production, it is crucial to check the health of the plants. Owing to the high levels of inter-class similarity and intricate pattern changes, categorizing plant leaf diseases is a complex undertaking [9]. The use of deep-learning (DL) techniques to diagnose plant illnesses is crucial for monitoring and assessing the production of various plant species, deep-learning techniques outperform conventional classification networks for real-time diagnosis of plant leaf diseases [10]. Traditional machine learning methods cannot generalize and require manual extraction of disease-related data. Deep learning offers a new method for disease detection. It is widely acknowledged that one of the most well-known methods in the field of deep learning is the CNN (CNN) [11]. A CNN can independently extract distinguishing features from images of varying scales. CNN exhibits a tremendous ability to segment visual components accurately. Agriculture has been substantially used in recent years [12]. By employing deep-learning methods to monitor plant health, the agricultural industry can ensure the cultivation of premium crops, streamline field maintenance operations on a large scale, attain favorable yields, and minimize substantial output losses. Nonetheless, it is vital to underscore the complexity and dynamism of the natural environment, characterized by variables like varying light conditions, foliage obstructions, brightness fluctuations, overlapping foliage or fruits, similarities in plant backgrounds, and other challenges. These characteristics complicate the detection of leaf disease. Hence, selecting an advanced technique that is precise, accurate, efficient, resilient, and cost-efficient is imperative [13]. Another critical factor is the generality of the leaf disease-detection system. A generic plant leaf disease detection strategy is crucial owing to its adaptability and extensive effects. Generic approaches can handle a broad range of illnesses and plant species, whereas specific approaches can be customized for specific pathogens or crops. Inclusively is essential in agriculture, where various crops face different disease threats and favorable adaptation and flexibility in detection strategies. Generic approaches also encourage cost-effectiveness, allowing for a single, all-inclusive solution to many problems.
This study presents a modified DenseNet201 architecture for the detection of leaf diseases in various plants using authentic field images. The architecture uses a transfer-learning method, which is a branch of deep learning. Transfer learning is a powerful deep-learning technique with many benefits over building models from scratch for different applications. Due to its faster training, lower data requirements, resilience, adaptability, efficient feature extraction, and enhanced ability to generalize, this method has garnered considerable attention and acknowledgment. The general framework outlines the classification of healthy and diseased plant leaf images and how they can be used to identify different diseases. Overall contributions of this work,
-
•
Suggested an enhanced transfer-learning model called DenseNet201Plus, designed to efficiently detect multi-leaf diseases with greater speed, robustness, precision, and accuracy. This framework integrates DenseNet201 with improved data augmentation, pre-processing techniques, attention-based transitions, attention modules, dense blocks, batch normalization, global average pooling, and denser layers employing Swish activation.
-
•
The proposed architecture was applied to two different and complex plant leaf disease datasets to evaluate its performance.
-
•
Various optimization strategies have been used to successfully address the issues of under-fitting and over-fitting in complicated datasets for the best performance.
-
•
The proposed architecture outperformed all the experimental pre-trained models for every performance metrix for the both banana and black gram leaf disease datasets.
-
•
Grad-CAM++ has been incorporated into the suggested architecture to provide model interpretability and localize the exact position of the disease.
The remainder of the paper is structured into six sections as follows: Section 2 delves into related literature, Section 3 outlines materials and methods, Section 4 provides an analysis of the results, Section 5 discusses the findings, and Section 6 concludes the paper, followed by the references.
2. Related works
The lack of distinct borders between diseased and healthy plant tissue makes it difficult to identify some plant diseases using current methods. Therefore, it is crucial to overcome these restrictions effectively by building a comprehensive classification system. Advanced deep-learning algorithms have been employed in the agricultural sector to address these challenges. The utilization of deep learning has gained significant popularity in recent years, primarily because of its remarkable performance in situations characterized by limited data availability.
Recent studies have shown significant advancements in detecting and identifying plant diseases using cutting-edge pre-trained models, including variants of DenseNet, VGG, ResNet, Inception, MobileNet, EfficientNet, and Xception. These developments leverage the power of deep learning algorithms to enhance the accuracy and efficiency of diagnosing plant health issues, offering promising tools for agricultural technology and crop management. In a study utilizing the Plant Village dataset, the model exhibited exceptional classification accuracy of 99.81%, surpassing other models in accuracy [14]. Krishnamoorthy et al. [15] employed a transfer-learning approach with the DCNN InceptionResNetV2 model for rice leaf disease classification, achieving an accuracy of 95.67% through fine-tuning various hyperparameters. Furthermore, Rajeena et al. [16] proposed a method involving modification of EfficientNet variables to enhance the accuracy of corn leaf disease detection, achieving a recognition accuracy of 98.85%, surpassing previous advanced approaches.
The research conducted by Mukti and Biswas [17] introduced an innovative approach to plant disease diagnosis, employing transfer-learning techniques. Specifically, they utilized the ResNet50 CNN architecture, emphasizing its use as a pre-trained model within the transfer-learning framework. Their study showcased exceptional performance, with the ResNet50 model achieving a remarkable training accuracy of 99.80%. Additionally, Sanga et al. [18] proposed an innovative method for detecting banana leaf diseases, particularly Fusarium wilt race and black Sigatoka illnesses, utilizing the InceptionV3 model tailored for mobile devices. Their technique, designed for implementation on Android smartphones, demonstrated impressive precision, achieving an accuracy rate of 95.41% through experimentation on a dataset comprising 3000 banana images. In a separate study, Sangeetha et al. [19] proposed a deep-learning methodology for early detection of Panama Wilts disease in banana leaves, achieving a notable accuracy of 91.56% when evaluated on a dataset comprising symptoms commonly associated with the disease.
Jiang et al. [20] conducted a study to improve the performance of the VGG16 model that was previously trained on the IMAGENET dataset. The authors refined this model by utilizing images depicting illnesses found in rice and wheat leaves. Significantly, their methodology yielded a commendable accuracy of 98.75%, particularly for identifying illnesses affecting wheat leaves. Hridoy et al. [21] proposed an innovative ensemble methodology incorporating the Xception and ResNet50 models to detect leaf diseases in various plant species. This technique was applied to a dataset comprising four distinct plant species: black gram, betel, spinach, and litchi. The dataset consisted of nine discrete categories representing images of healthy and ill plants. The methodology exhibited a significant level of accuracy, attaining a success rate of 99.20% while demonstrating competitive performance.
Talasila et al. [27] introduced a novel approach that utilized MobileNetV2 to detect illnesses in black gram leaves. This study describes a methodology for segmenting images depicting black gram leaf disease using a high-resolution sensor dataset. Furthermore, as mentioned earlier, researchers have proposed a classification methodology for black gram leaf disease using deep CNN architecture. The technique mentioned above exhibited remarkable accuracy, with a percentage of 99.54% [28]. Using transfer learning, Safran [29] presented a real-time plant disease segmentation and identification method that effectively identified local plant illnesses affecting crops and provided a detailed treatment plan. Many CNN architectures, including ResNet, VGG, and EffectiveNet, have been trained using an actual dataset of prevalent plant illnesses in the area. Advanced preprocessing and segmentation techniques were utilized to enhance image quality and accurately isolate the region of interest before training commenced, thereby facilitating more efficient transfer learning. The EfficientNet-B0 model emerged as the top performer, balancing both accuracy and prediction time efficiency. It achieved a remarkable prediction time of 0.0145 s, alongside an impressive overall accuracy of 99.0% and a mean F1 score of 98.7%. Some of the more recent contributions and limitations of research articles are listed in Table 1.
Table 1.
In this table we present some of the recent work in the field of leaf disease detection.
| Ref | Year | Model | Major Contribution | Limitation |
|---|---|---|---|---|
| [1] | 2024 | CNN | This paper proposes a novel method for accurately diagnosing tea leaf diseases using artificial intelligence. It introduces a hybrid pooling-based CNN for efficient feature extraction and employs a weighted Random Forest model optimized by Cuckoo Search Optimization. Evaluation on the Tea Sickness Dataset shows superior accuracy (92.47%) compared to previous techniques, indicating significant advancements in tea leaf disease identification. | This paper's limitations include increased training time due to separate CNN and WRF models for feature extraction, lack of detailed discussion on computational resources, uncertainty about dataset representativeness for real-world scenarios, and insufficient exploration of pre-processing challenges potentially affecting disease identification accuracy. |
| [2] | 2024 | Multi-scale Residual Network (MResNet) | This paper introduces a novel Multi-scale Residual Network (MResNet) for accurately classifying multi-type maize leaf diseases from images. It employs a hybrid feature weight optimization technique to enhance classification performance, achieving a remarkable 97.45% accuracy, surpassing state-of-the-art methods. The model demonstrates robust generalization performance and effectiveness in disease identification. | This paper's limitation is the lack of detailed analysis of imbalanced samples, particularly for grayspot disease, and fails to comprehensively discuss generalization performance, computational efficiency, and specific evaluation metrics for the proposed MResNet model. |
| [22] | 2024 | CNN | This paper introduces “Plant Diseases Finder”, a mobile app employing a deep-learning model to accurately identify Fusarium Wilt and Black Sigatoka banana diseases. It achieves a 91.17% accuracy rate after training on a dataset of 27,360 images. The app provides prompt disease classification and offers research-based mitigation advice in English and Kiswahili, aiding local farmers in making informed decisions to protect their yields. | The study's limitations include its narrow focus on only Fusarium Wilt and Black Sigatoka diseases in bananas, potentially excluding other relevant diseases. Additionally, there's ambiguity regarding the dataset used, hindering the assessment of result reliability. Lastly, the lack of detail on model enhancement strategies and future expansion plans limits understanding of its long-term effectiveness and adaptability. |
| [23] | 2024 | SqueezeNet+NN | This paper presents a deep-learning model utilizing ensemble techniques (SqueezeNet with Neural Network) and fine-tuned pre-trained models to accurately detect biotic rice leaf diseases. Achieving a peak accuracy of 93.3% and providing access to the dataset, it offers valuable insights for timely intervention, minimizing ecological and economic impacts in agriculture. | The paper's limitations include reliance on potentially biased datasets from Mendley and Kaggle, lack of information on dataset partitioning, neglect of computational resource requirements, insufficient comparison with state-of-the-art techniques, and failure to address challenges regarding model interpretability and explainability, hampering its practical implementation and assessment against existing methods. |
| [24] | 2023 | Ghost ResNeSt-Attention RReLU-Swish Net (GR-ARNet) | The paper introduces the K-scale VisuShrink algorithm (KVA) for denoising banana leaf images and presents the Ghost ResNeSt-Attention RReLU-Swish Net (GR-ARNet), incorporating Ghost and ResNeSt modules for efficient feature extraction and identification. Achieving 96.98% accuracy and 89.31% precision on 13021 images underscores its remarkable effectiveness. | This paper acknowledges limitations in existing studies for accurately identifying banana leaf diseases and does not address the challenge of distinguishing similar diseases. Additionally, while introducing the K-scale VisuShrink algorithm for denoising banana leaf images, it notes its time-consuming nature due to the iterative selection process for generating optimal offspring images. |
| [25] | 2023 | SqueezeNet | This paper introduces BananaSqueezeNet, a deep-learning model achieving 96.25% accuracy in diagnosing banana leaf diseases, surpassing existing models. It detects seven additional diseases with 95.13% accuracy, facilitating early detection via a smartphone app for farmers, potentially boosting banana production globally, particularly in Bangladesh. | The main limitation of this study is the lack of comprehensive validation across diverse geographical regions and environmental conditions, which may affect the generalizability of BananaSqueezeNet's performance. Additionally, the paper does not address potential challenges related to the accessibility and adoption of the smartphone application by farmers, which could impact its real-world effectiveness. |
| [26] | 2023 | Generative Adversarial Network (GAN) with Modified Faster Region-based CNN (MFRCNN) | The paper introduces a novel approach for banana leaf disease identification by combining a modified GAN with MFRCNN, integrating autoencoder for data augmentation, and fuzzy logic for enhanced classification. Achieving superior performance metrics of 98% accuracy, 97% precision, and 96% F1-score, it outperforms existing methods while maintaining dynamic adaptability across diverse datasets. | The paper lacks details on the size and diversity of the banana plant leaf dataset used, omits discussion on computational resource requirements, fails to address challenges in implementing modified GAN and MFRCNN models, lacks comparative analysis on computational efficiency, and doesn't discuss the generalizability of the model to other plant species or diseases, limiting its broader applicability and understanding. |
Most of the research that has already been conducted has focused on good performance results and leaf diseases specific to one plant. Researchers have attempted to evaluate the proposed approaches using multiple leaf disease datasets. Although prior studies have yielded remarkable outcomes, several aspects, such as optimizing the model complexity and robustness, still require improvement. It is also clear that there were no additional noteworthy performance measurements. Careful experimentation is necessary to overcome the problem of inadequately complicated data. The current study requires a thorough analysis of many common problems, such as robustness, capacity to operate on complicated images, under-fitting, and over-fitting. A solution to the numerous problems caused by plant diseases is presented in this study. This includes the development of a reliable model to identify leaf diseases in various plant species.
3. Methods and materials
This section explains the dataset, data augmentation and pre-processing, proposed architecture, and method for interpreting using Explainable Artificial Intelligence (XAI).
3.1. Dataset
A suitable dataset serves as the foundation for conducting deep-learning research. The careful selection of a dataset is of utmost importance because it substantially affects the performance and generalizability of deep-learning models. The selection of a dataset should prioritize its representation of the problem area, inclusion of diverse cases, and coverage of numerous situations, classes, or conditions pertinent to the research. Data quality, quantity, and balance are crucial to ensure that the dataset effectively represents the model's real-world difficulties. This study aims to develop a universal system for detecting plant leaf diseases using images with complicated backgrounds regardless of leaf size. Two distinct and different leaf size datasets were chosen to evaluate the system's performance: the banana leaf disease dataset [30] and the black gram leaf disease dataset [31], as they satisfied all necessary criteria. The dataset of banana leaf illness consisted of two distinct classes reflecting different diseases and a separate class representing samples considered healthy. The black gram leaf disease dataset comprises four separate diseases and a class representing healthy plants. All datasets were accessible to the public via Mendeley data. The dataset images were divided into two groups: the training set, which accounted for 80% of the data, and the test set, which constituted the remaining 20%. Table 2 presents the comprehensive data regarding the datasets and the number of training and test images per class.
Table 2.
Number of images showing leaf diseases in the two chosen datasets.
| Dataset | Class | Train | Test |
|---|---|---|---|
| Banana Leaf Disease |
Healthy | 125 | 30 |
| Segatoka | 260 | 60 | |
| Xamthomonas | 661 | 153 | |
| Black Gram Leaf Disease | Anthracnose | 180 | 50 |
| Healthy | 179 | 42 | |
| Leaf Crinckle | 122 | 30 | |
| Powdery Mildew | 144 | 36 | |
| Yellow Mosaic | 182 | 42 | |
3.2. Data augmentation and pre-processing
Data augmentation and pre-processing are fundamental methodologies in the field of deep-learning research, serving the purpose of improving the overall quality and increasing the diversity of training data [32]. Data augmentation includes applying diverse changes to the initial dataset, including, but not limited to, rotation, scaling, cropping, flipping, and the introduction of noise. This approach artificially enhances the quantity and variety of training data, enhancing the generalizability and robustness of the model [33]. In contrast, pre-processing is a crucial step that involves data preparation to resolve many challenges, such as noise reduction, standardization, normalization, and resizing. This process aims to achieve uniformity and consistency in data. Ensuring compatibility between a deep-learning model's data format and architecture is of utmost importance. Data augmentation and pre-processing are essential components for strengthening the quality of training data, mitigating overfitting, and improving the overall performance and dependability of deep-learning models. The use of these strategies plays a pivotal role in the extraction of vital insights and the attainment of cutting-edge outcomes.
The leaf images from the selected datasets underwent various transformations, including shearing, rotation, adjustments in height and width, and horizontal flipping, to closely simulate real-world conditions. The datasets consisted of RGB coefficients ranging from 0 to 255; however, handling images with higher values posed challenges. To address this, a normalization process was applied, scaling pixel values to a range between 0 and 1 using a scale factor of 1/255. Additionally, standardization was carried out to ensure a consistent image ratio of , facilitating the training process. The use of neural networks with higher-resolution images requires a fourfold increase in input pixels, resulting in extended training times [34].
3.3. The proposed architecture
Developing a singular deep-learning model for identifying multiple plant leaf diseases is important owing to various compelling factors. This presents a pragmatic and economically viable approach to manage plant diseases. Instead of creating individual models for each plant disease, employing a unified model simplifies the detection procedure, and, enhances its availability to farmers and researchers, thereby facilitating early disease identification and management. Integrating a unified model contributes to the enhancement of generalization capabilities, as it acquires the ability to identify patterns and abnormalities across a wide range of diseases, leading to increased accuracy and robustness. This strategy makes a valuable contribution to promoting sustainable and ecologically conscious agricultural practices, ensuring the preservation of crop yields and food security. Additionally, it represents a noteworthy advancement in the utilization of technology for managing plant diseases.
To develop a comprehensive framework for detecting leaf diseases across various plant species, this study introduced a modified version of DenseNet201. Before starting the training procedure for the proposed architecture, various data augmentation and pre-processing methods were implemented to enhance the model's performance and mitigate the risk of over-fitting. The utilization of feature reuse by multiple layers in DenseNet201 increased the input variance of the subsequent layer, resulting in improved performance. This approach allows DenseNet201 to be easily trained and highly efficient in terms of parameters [35]. To optimize the transmission of information across various layers within the network, the DenseNet architecture employs a straightforward connectivity pattern. This pattern establishes direct connections between all the layers, allowing for a feed-forward flow of information. DenseNet offers a range of notable benefits such as addressing the issue of vanishing gradients, enhancing the propagation of features, promoting the reuse of features, and significantly decreasing the parameter count. The design of DenseNet201 was initiated with an input layer that received the unprocessed image data as its input. Generally, it is customary to adjust the dimensions of these images to a predetermined size. Following the input layer, the initial convolutional layer has a comparatively small kernel size and a reasonable number of filters. The subsequent layer comprises batch normalization and ReLU activation. The fundamental component of DenseNet is comprised of dense blocks. A dense block is a consecutive sequence of tightly interconnected convolutional layers that commonly employs kernels. The layers above preserve the reuse of features and promote the smooth propagation of gradients. The number of convolutional layers in a dense block can exhibit variability. To decrease the number of parameters within the network, a bottleneck layer was implemented before each convolution in a dense block. The bottleneck layers employed 1x1 convolutions to decrease the quantity of feature mappings before applying 3x3 convolutions. The transition layers between the dense blocks consist of a composite of convolutional layers and average pooling. The primary function of these layers is to decrease the spatial dimensions of the features, regulate the quantity of parameters, and offer a means of downsampling. The terminal stage of the network architecture comprises a global average pooling layer. This process involves taking the feature maps and calculating the mean value across each, yielding a spatial dimension while preserving the channel information. The output layer represents the concluding layer of the neural network and is responsible for generating predictions or outcomes relevant to a given task. The setup choice for a given application may vary, including Softmax for multiclass classification or linear activation for regression. Fig. 1 shows the core components and output size of the DenseNet201 architecture.
Figure 1.

The core components and output size of each component of the DenseNet201 model.
To improve our design's performance, we added an attentive transition layer with 1920 filters, dense blocks, and attention modules. We also used global average pooling and introduced dense layers with 1046 and 512 filters, both using Swish activation and batch normalization. A final dense layer with SoftMax activation is used for classification. Details on these additions are provided below.
3.3.1. Attentive transition
The attentive transition process in the proposed model architectures plays a critical role in enhancing performance by selectively focusing on important features within input data that come from the base Densenet201. The attentive transition process initiates the computation of attention maps by employing a global average pooling operation on the input feature maps. This operation condenses the spatial dimensions of the feature maps into a single value for each channel. Subsequently, the attention map undergoes processing in a dense layer comprising 1920 filters, where it is subjected to a sigmoid activation function. Through training, this layer allocates attention weights across multiple channels within the input feature maps. Subsequently, the attention map is resized to (1, 1, 1920 filters). A convolutional layer then compresses the feature map filters. This layer, comprised of 1920 filters, utilizes a kernel size of . Finally, the spatial dimensions of the feature maps are decreased via max pooling, employing a pool size of and a stride of .
The attentive transition module computes attention weights across various channels of the input feature maps. This functionality empowers the proposed architecture to selectively highlight the most crucial features. By assigning higher weights to vital features and lower weights to less informative ones, the model efficiently prioritizes and utilizes discriminative information. The attentive transition operation adaptively refines features based on their relevance by multiplying the input feature maps with the attention map. This allows the model to enhance essential features and suppress noise or less informative features, leading to more meaningful and discriminative representations. Attentive transition utilizes a convolutional layer to decrease the number of filters significantly. Dimensionality reduction techniques can potentially enhance computational efficiency and mitigate the threat of overfitting. Reducing the number of filters makes the model more compact and efficient while preserving important information. The attentive transition operation integrates max pooling, a method that efficiently reduces the spatial dimensions. By preserving the relevant spatial information, the model can better capture spatial dependencies and improve its ability to discriminate between different classes. Fig. 2 shows a block diagram of the attentive transition layer in the proposed architecture.
Figure 2.

The block diagram of the attentive transition layer of the proposed architecture.
3.3.2. Dense block
Dense block layers play a crucial role in the proposed architecture. The function has three parameters:
-
•
An input tensor x
-
•
The desired number of layers to be created
-
•
The growth rate determines the number of feature maps generated by each convolutional layer
The process begins by applying batch normalization to input tensor x, thereby normalizing the activations and promoting enhanced stability and efficiency during the training phase. Subsequently, a Rectified Linear Unit (ReLU) activation function was employed to incorporate the non-linearity. A convolutional layer is a bottleneck, effectively decreasing the number of channels to one-fourth of the growth rate. Dimensionality-reduction techniques are valuable for parameter control. Subsequently, the function applies an additional round of batch normalization and ReLU activation to feature maps that have undergone bottlenecking. Utilizing a convolutional layer augments the channel count to the designated growth rate, thereby enabling the acquisition of a more comprehensive array of features. The resulting feature map from the convolutional layer is combined with the original input tensor x using concatenation, to create a skip connection. Establishing these linkages is crucial for facilitating the preservation of information from the preceding layers, thereby mitigating the problem of vanishing gradients and fostering the reuse of features. The series above of processes is iterated for a specified number of layers , and the resultant tensor x encompasses the aggregated outcomes of all the convolutional layers within the dense block. The present design dramatically improves the efficiency of training, extraction of features, and flow of gradients, thereby establishing itself as a distinguishing characteristic of architectures inspired by DenseNet. Fig. 3 shows a block diagram of the dense block of the proposed architecture.
Figure 3.

The block diagram of the dense block of the proposed DenseNet201Plus architecture.
3.3.3. Attention module
The attention mechanism in the DenseNet201Plus architecture employs a convolution followed by a sigmoid activation function to generate attention scores ranging from 0 to 1. These scores determine the relevance of different spatial locations within the feature maps. Through element-wise multiplication with the original feature maps, areas highlighted by higher attention scores receive amplified representation, effectively emphasizing crucial details while maintaining the integrity of the original information. This targeted enhancement is particularly advantageous in tasks such as object recognition and segmentation, where identifying and prioritizing significant regions in images can significantly improve model accuracy and robustness. By selectively focusing on informative areas dictated by the attention weights, the model becomes more adept at capturing intricate patterns and nuanced features, thereby enhancing its overall performance in complex visual tasks. This adaptive approach ensures that the attended features not only preserve essential details but also elevate the model's ability to discern and classify objects accurately in diverse real-world scenarios. The attention module of the proposed architecture is illustrated in Fig. 4.
Figure 4.
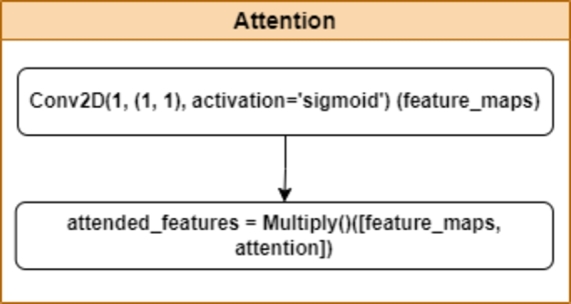
The block diagram of the attention module of the proposed DenseNet201Plus architecture.
3.3.4. Global average pooling, dense layers, and batch normalization
This study prioritized global average pooling over adopting a flattened layer. Global average pooling is a technique that enables the reduction of data dimensions while retaining crucial information. This process plays a significant role in mitigating over-fitting and enhancing computing efficiency. The method incorporates translation invariance by calculating the mean of the feature maps, thereby improving the model's ability to handle spatial translations in the input data. Additionally, Global Average Pooling is regularization, as it introduces noise into the training process. It effectively extracts global information from feature maps, rendering it highly advantageous for tasks, such as image classification. This is because image classification tasks primarily depend on the overall content of an image, rather than on complex spatial relationships. Furthermore, utilizing Global Average Pooling can enhance the interpretability of the features by effectively summarizing the information in each channel.
Before incorporating the final classifier layer, the proposed architecture was extended to incorporate three dense layers, each consisting of 1024, 512, and 128 neurons, respectively.
When comparing the Swish activation function with ReLU and PReLU, it is evident that Swish activation exhibits some advantageous characteristics. It exhibits enhanced effectiveness, heightened expressiveness, and a superior gradient flow. Furthermore, empirical evidence has substantiated its superior performance on several tasks, including the experiment conducted in our study.
Additionally, two Batch Normalization [36] layers were added following the first two dense layers to increase the reliability and speed of our proposed architecture. Batch Normalization is crucial for enhancing the training process and the overall performance of neural networks. The layer is commonly placed within a neural network following the activation function. The core concept underlying Batch Normalization is to standardize the output of each layer during the training process by removing the mean of the batch and dividing it by its standard deviation. The proposed method has several advantages. First, it effectively addresses the issue of internal covariate shifts, resulting in enhanced training stability and efficiency. Second, it successfully mitigated the problem of vanishing or bursting gradients. Finally, it contributes to the regularization of the network by introducing noise throughout the training process. Batch Normalization is a technique that enhances the learning process and generalization capabilities of neural networks by normalizing inputs to each layer. This normalization results in improved convergence and increased accuracy. At the end of the network, a dense layer was employed in conjunction with the SoftMax activation function. The number of neurons required in this layer depends on the classes present in the dataset. In multiclass classification scenarios, the SoftMax function is commonly employed [37]. The formal description of the SoftMax activation function is as follows:
| (1) |
Where, z denotes the values of the neurons in the output layer, and the exponential function serves as the chosen non-linear activation function.
To investigate the impact of different learning rates on the adjustment of hyperparameters within the Adam optimizer, experiments were conducted. The recommended configuration utilized the Adam optimizer with a learning rate set at . For the proposed model tailored to solve multiclass classification challenges, the categorical_crossentropy loss function was employed [38]. This function plays a crucial role in guiding the training process by measuring the disparity between the predicted class probabilities generated by the network and the actual class labels of the training dataset. Categorical_crossentropy loss promotes the adjustment of internal parameters, such as weights and biases, within the model by quantifying the divergence between the two distributions. Consequently, this phenomenon results in enhanced predictive accuracy and improved congruence between the model's output probabilities and the actual class labels. The mathematical details underlying can be elucidated as follows:
| (2) |
where, P= predictions, t= targets, i= data points, j= class.
Furthermore, to tackle overfitting, an early stopping mechanism is employed. This mechanism is established by specifying the monitoring parameter as ‘val_loss’ and setting patience of 3. The training process automatically ceased when the validation loss began to rise, indicating the potential onset of overfitting. This helps prevent the model from excessively training on data, which could hinder its ability to generalize effectively. The diagram in Fig. 5 illustrates the layout and operational flow of the suggested architecture.
Figure 5.
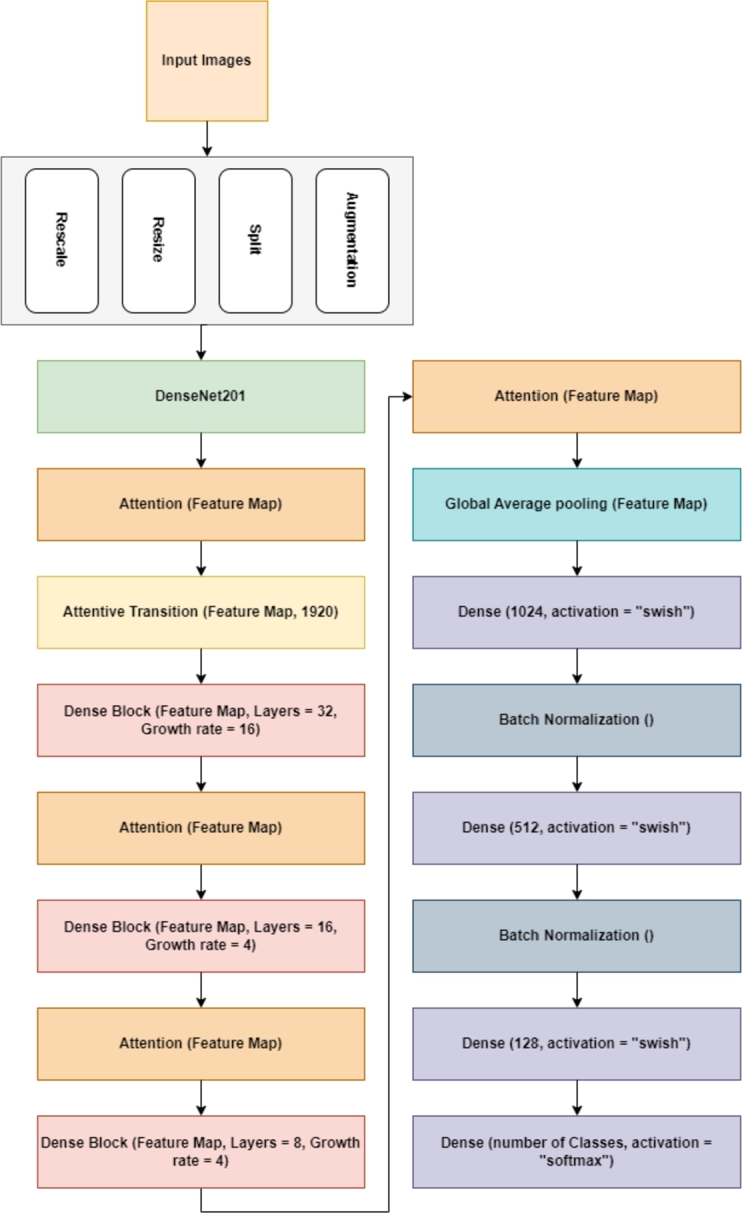
The structural design and workflow of the proposed DenseNet201Plus architecture.
3.4. Interpreting with XAI
Explainable Artificial Intelligence approaches have significant significance in interpreting neural networks. Intense neural networks' learning models have significantly accomplished diverse demanding tasks. However, their sophisticated structures and extensive parameterization frequently render them incomprehensible, which are commonly called black boxes. The interpretation of these models holds great importance in fostering trust, promoting openness, and ensuring accountability, especially in applications with a substantial impact on the real world. XAI facilitates the comprehension of decision-making processes in neural networks, offering valuable insights into the influential factors and patterns that shape these judgments. The capacity to interpret models' behavior serves the purpose of detecting and addressing biases and guaranteeing compliance with ethical and legal norms. Furthermore, it aids in model debugging, validation, and optimization, simplifying fine-tuning and enhancing model performance. Using Explainable Artificial Intelligence in the analysis of neural networks enables individuals to effectively leverage the complete capabilities of deep learning, ensuring that decisions made in critical domains are well-informed, ethically sound, and dependable. To strengthen the trustworthiness and reliability of our proposed architecture, we used Grad-CAM++ [39], an advanced version of Grad-CAM, to provide a visual representation of our approach. The strategy under consideration is a visual explanatory approach that relies on Class Activation Mapping (CAM).
3.4.1. Grad-CAM++
The Grad-CAM technique proves valuable in pinpointing various instances linked to a specific class. Furthermore, it is expected that the heatmaps generated by Grad-CAM could exhibit improved precision in identifying specific regions corresponding to a particular class within an image. Integration of the Grad-CAM++ technique [39] serves to enhance the visualization of predictions made by CNN models. The mathematical formulation of Grad-CAM++ can be expressed as follows:
| (3) |
where, represents the weights of neurons, denotes the significance of location , refers to the activation map, c stands for the target class, and represents the score of class c.
4. Experimental results
Precise diagnosis is pivotal in resolving plant-related concerns that directly impact humans. This study presents an adapted DensenNet201 architecture employing transfer-learning techniques. The aim is to construct a deep-learning model adept at precisely detecting leaf diseases across various plant species, regardless of leaf size and background. Two separate datasets were used to compare the proposed architecture with existing CNN models, specifically banana and black gram leaf diseases. This study intends to evaluate the resilience of the proposed architecture and provide a comparative analysis with the currently available CNN model. The performance of the proposed architecture was assessed by analyzing multiple performance parameters, such as accuracy, precision, recall, and AUC value. The performance of the DenseNet201 pre-trained models surpassed all other pre-trained models on the two chosen datasets. The experimental pre-trained models demonstrated exceptional performance when applied to datasets featuring background images of lower complexity, particularly those of Black Gram Leaf Disease. Nevertheless, their performance needs to satisfy the substantial minimum threshold on the complex background image dataset, notably the dataset of Banana Leaf Disease. The pre-trained models exhibited overfitting and underfitting in both datasets, suggesting an issue in their ability to function consistently and reliably. To address these concerns more efficiently, we modified the DenseNet201 model, which yielded excellent outcomes. After executing a series of trials involving multiple modifications, the proposed architecture demonstrated a substantial advantage over all other investigated models.
The remainder of the section is organized into distinct subsections, including the experimental setup, evaluation metrics, results, and explainability analysis.
4.1. Experimental setup
We conducted training using multiple pre-trained models on the Nvidia GeForce RTX 2060 Super GPU, utilizing the Keras and TensorFlow libraries. Our investigation encompassed various factors such as input dimensions, batch sizes, epochs, augmentation methods, optimizers with diverse learning rates, and activation functions. Resizing of models was carried out to match appropriate input shapes based on their specifications. Augmentation techniques employed were rotation, vertical and horizontal flipping, as well as width and height shifting. Each experiment utilized the Adam optimizer with a batch size of 8, a learning rate of , and 50 epochs with early stopping. Performance metrics assessed included accuracy, precision, recall, and AUC.
4.2. Performance metrics
Evaluating the performance of a deep-learning model is a crucial aspect of its development. Performance metrics or assessment metrics were utilized to evaluate the model's effectiveness for a given dataset. By using these measurements, researchers can enhance their comprehension of the degree of similarity between the data and the model. Consequently, they can adjust the model parameters appropriately to enhance their effectiveness. Diverse assessment measures are utilized to elucidate the efficacy of the proposed framework. The subsequent passage succinctly outlines the evaluation criteria employed in this investigation.
4.2.1. Confusion matrix
The confusion matrix stands as a pivotal assessment instrument in both deep-learning and machine-learning realms. It allows researchers to gauge the efficacy of a classification model by encapsulating true-positive, true-negative, false-positive, and false-negative predictions within a concise matrix. These elements within the matrix play a pivotal role in deriving metrics like precision, recall, accuracy, F1 score, and other performance indicators crucial for evaluating model performance. Consequently, the confusion matrix serves as an indispensable resource for refining and optimizing models in the field of deep learning research. This allows researchers to pinpoint particular instances when a model can incorrectly classify data and enables them to make well-informed tweaks to improve the model's accuracy and generalizability. Additionally, the confusion matrix is crucial for creating sophisticated deep-learning methods, such as transfer-learning and neural network architectures, which allow researchers to continually push the limits of what is possible in disciplines such as computer vision, natural language processing, and more. From the confusion matrix, we can easily calculate the Accuracy, Precision, and Recall using the following equation (5), (6), and (7).
| (4) |
| (5) |
| (6) |
Here, TP = true-positive, TN = true-negative, FP = false-positive, FN = false-negative.
4.2.2. Area under the ROC curve (AUC)
The AUC is crucial in deep-learning research. AUC is a metric that evaluates the discriminatory power of a model to distinguish between positive and negative classes. This was achieved by evaluating the equilibrium between the rates of accurately identified positive instances (true-positives) and erroneously identified negative instances (false-positives) across various classification thresholds In deep learning, the AUC provides a comprehensive and intuitive assessment of a model's performance, enabling researchers to effectively gauge its discriminative capabilities. A high AUC indicated that the model could accurately categorize cases. This attribute makes it highly effective in fields such as medical diagnostics, where the ability to make dependable predictions is of utmost importance. In the field of deep learning, it is common practice to utilize the AUC metric in conjunction with other evaluation measures. This approach allows for a full assessment of model performance, enabling researchers to make appropriate adjustments as necessary. The influence of this metric on research is indisputable because it functions as a dependable standard for assessing the effectiveness and precision of deep-learning models.
4.2.3. Average time per epoch in seconds (ATPES)
Average Time Per Epoch in Seconds (ATPES) is an important metric in machine learning training that provides information about the efficiency and duration of each epoch. It represents the average time, in seconds, required to complete one full training epoch of a model on a given dataset. The ATPES is calculated by dividing the total training time by the number of epochs performed during the training phase. This metric is critical for understanding the time complexity of model training, which allows researchers and practitioners to evaluate and optimize training workflows. A lower ATPES indicates faster epoch completion, which may lead to faster model convergence or better utilization of computational resources. Monitoring ATPES aids in managing training schedules, optimizing hyperparameters, and comparing training efficiencies across models and datasets. Equation (7) shows the formula for calculating Average Time Per Epoch in Seconds (ATPES) below:
| (7) |
-
•
: Total training time in seconds
-
•
: Total number of epochs
4.2.4. Average GPU inference time in seconds (AGITS)
Average GPU Inference Time in Seconds (AGITS) is the average time in seconds that a GPU takes to perform inference tasks on a deep learning model. AGITS directly reflects the model's prediction speed and efficiency, which are critical for real-time applications. Lower AGITS values indicate faster inference speeds, which optimize GPU utilization and improve overall system responsiveness in deployment scenarios. Equation (8) shows the formula for calculating Average GPU Inference Time in Seconds (AGITS) below:
| (8) |
-
•
: Total inference time in seconds
-
•
: Total number of instances
4.3. Results
Our objective was to create a dependable, effective, and versatile leaf disease detection system capable of delivering high performance across diverse leaf sizes and backgrounds. The transfer-learning technique was chosen because it allows existing knowledge to be reused to solve a new challenge, saving the time required to develop a new architecture. Because the layers of the pre-trained models are developed using a large dataset, the transfer-learning technique decreases the training time and improves performance.
All pre-trained models underwent the training process without implementing layer freezing. This approach facilitated the model's enhanced understanding of the novel task without any limitations in the learning process. The DenseNet201 model exhibited consistent superiority over other pre-trained models in evaluations conducted on datasets of banana and black gram leaf diseases. Certain pre-trained models have been observed to suffer from a notable issue of underfitting. In contrast, others have been observed to suffer from overfitting, thereby highlighting the substantial drawbacks associated with these pre-trained models. Various transfer learning (TL) techniques have been investigated to improve the effectiveness of the suggested framework and address issues related to underfitting and overfitting. The paper includes detailed performance comparisons of the proposed architecture and other pre-trained models for banana and black gram leaf diseases in Table 3, Table 4.
Table 3.
Comparison summary of pre-trained models vs. proposed architecture on banana leaf disease dataset (Accuracy: Acc, Precision: P, Recall: R, Average time per epoch in seconds: ATPES, Average GPU Inference Time in Seconds: AGITS).
| Model | Acc | P | R | AUC | ATPES | AGITS |
|---|---|---|---|---|---|---|
| MobileNetV2 | 0.7531 | 0.7660 | 0.7407 | 0.9104 | 10 | 0.088 |
| DenseNet121 | 0.8148 | 0.8174 | 0.8107 | 0.9251 | 15.1 | 0.096 |
| ResNet152V2 | 0.7942 | 0.8042 | 0.7942 | 0.9180 | 19.3 | 0.129 |
| DenseNet169 | 0.8107 | 0.8133 | 0.8066 | 0.9469 | 15.7 | 0.097 |
| DenseNet201 | 0.8230 | 0.8257 | 0.8189 | 0.9429 | 17.3 | 0.098 |
| InceptionV3 | 0.7407 | 0.7586 | 0.7243 | 0.8983 | 20.7 | 0.142 |
| NASNetLarge | 0.7860 | 0.7925 | 0.7860 | 0.9184 | 27.9 | 0.163 |
| InceptionResNetV2 | 0.6955 | 0.7294 | 0.6543 | 0.8275 | 22.8 | 0.154 |
| EfficientNetV2S | 0.7819 | 0.7908 | 0.7778 | 0.9313 | 16.02 | 0.107 |
| EfficientNetV2L | 0.7407 | 0.7469 | 0.7407 | 0.9059 | 32.2 | 0.198 |
| Modified DenseNet201_PReLU | 0.8971 | 0.9004 | 0.8930 | 0.9716 | 17.37 | 0.098 |
| Modified DenseNet201_Relu | 0.8971 | 0.8996 | 0.8848 | 0.9670 | 17.37 | 0.098 |
| DenseNet201Plus with only attention mechanism | 0.8712 | 0.8501 | 0.8501 | 0.9529 | 17.37 | 0.098 |
| DenseNet201Plus with only attentive transition | 0.8788 | 0.8694 | 0.8714 | 0.9602 | 17.37 | 0.098 |
| Proposed DenseNet201Plus | 0.9012 | 0.9012 | 0.9012 | 0.9716 | 17.37 | 0.098 |
Table 4.
Comparison summary of pre-trained models vs. proposed architecture on black gram leaf disease dataset (Accuracy: Acc, Precision: P, Recall: R, Average time per epoch in seconds: ATPES, Average GPU Inference Time in Seconds: AGITS).
| Model | Acc | P | R | AUC | ATPES | AGITS |
|---|---|---|---|---|---|---|
| MobileNetV2 | 0.9300 | 0.9340 | 0.9200 | 0.9951 | 12.02 | 0.108 |
| DenseNet121 | 0.8800 | 0.8987 | 0.8750 | 0.9836 | 17.3 | 0.135 |
| ResNet152V2 | 0.8500 | 0.8601 | 0.8300 | 0.9740 | 21 | 0.187 |
| DenseNet169 | 0.9050 | 0.9146 | 0.9050 | 0.9871 | 18.5 | 0.138 |
| DenseNet201 | 0.9150 | 0.9246 | 0.9100 | 0.9900 | 19.08 | 0.144 |
| InceptionV3 | 0.9000 | 0.9192 | 0.8950 | 0.9776 | 23.8 | 0.167 |
| NASNetLarge | 0.8700 | 0.8796 | 0.8400 | 0.9790 | 28.06 | 0.189 |
| InceptionResNetV2 | 0.8450 | 0.8624 | 0.8150 | 0.9578 | 25.1 | 0.172 |
| EfficientNetV2S | 0.9000 | 0.9147 | 0.9050 | 0.9850 | 18.02 | 0.129 |
| EfficientNetV2L | 0.8800 | 0.8890 | 0.8750 | 0.9775 | 33.9 | 0.219 |
| Modified DenseNet201_PReLU | 0.9700 | 0.9700 | 0.9700 | 0.9989 | 19.1 | 0.145 |
| Modified DenseNet201_Relu | 0.9900 | 0.9949 | 0.9850 | 0.9995 | 19.1 | 0.145 |
| DenseNet201Plus with only attention mechanism | 0.9400 | 0.9408 | 0.9408 | 0.9802 | 19.1 | 0.145 |
| DenseNet201Plus with only attentive transition | 0.9678 | 0.9700 | 0.9700 | 0.9802 | 19.1 | 0.145 |
| Proposed DenseNet201Plus | 0.9950 | 0.9950 | 0.9950 | 1.000 | 19.1 | 0.145 |
The results presented in Table 3, Table 4 clearly indicate that the proposed architecture outperformed all other pre-trained models across both datasets. This observation underscores the capability of the proposed architecture to accurately detect leaf diseases, irrespective of variations in leaf size or background complexity, owing to its intricate design. Additionally, the experimental results revealed that the utilization of different activation functions, coupled with the incorporation of denser layers, significantly influenced the performance of the proposed architecture. Notably, the Swish activation function demonstrated superior performance compared to the PReLU and ReLU activation functions, attributed to its incorporation of non-monotonicity, thereby facilitating the capture of intricate patterns within the data. The additional layers slightly increased the proposed architecture's average training time and GPU inference time when compared to the base model, but improved performance. Figs. 6a, and 6b show the confusion matrix of the proposed architecture for banana and black gram leaf disease, respectively.
Figure 6.

Confusion matrix of the proposed architecture on different datasets.
Accurate predictions are represented visually by diagonal blue boxes in the confusion matrix in Figs. 6a, and 6b. The proposed architecture correctly predicted the classification of 222 images out of the 243 images analyzed to test for banana leaf disease, while misclassifying 21 images. About the healthy class test images, the suggested architecture correctly identified 28 images, misclassifying only two. When classifying the images from the Segatoka disease test, it performed similarly. It correctly classified 55 out of the 60 test images, misclassifying only five. The proposed architecture correctly diagnosed 141 out of 153 test images for Xamthomonas illness while incorrectly classifying 12 images. The proposed architecture demonstrated notably high accuracy in the black gram leaf disease dataset. The proposed architecture correctly predicted every test image without any instances of misclassification.
As mentioned earlier, the pre-trained models that exhibited the highest performance on the datasets of banana (DenseNet201) and black gram (DenseNet201) leaf diseases confronted the challenge of underfitting, as illustrated in Fig. 7.
Figure 7.

The best-performing pre-trained models' loss on the two leaf disease datasets: Banana (left) and Black gram (right).
Fig. 7 demonstrates that the pre-trained model with the highest performance encountered the underfitting problem, as evidenced by the validation loss graph exhibiting significantly higher values than the training graph. This observation suggests that the inclusion of more complex layers is necessary to address this issue. Despite encountering underfitting, the pre-trained model did not experience any incidents of overfitting owing to a successful implementation of the early stopping mechanism. The training process was stopped prematurely by the early stopping mechanism as a result of three consecutive epochs showing a rise in validation loss.
The proposed architecture aims to mitigate the challenges of both underfitting and overfitting by introducing a more intricate framework, which involves alterations to the DenseNet201 model. Additionally, the integration of an early stopping mechanism within this framework effectively tackles overfitting concerns by ceasing the training process upon detecting a consecutive increase in validation loss over three epochs. Fig. 8 provides visual depictions of the loss experienced by the proposed model architecture across the two datasets focusing on leaf diseases.
Figure 8.

The loss of the proposed architecture on the two leaf disease datasets: Banana (left) and Black gram (right).
Based on the loss graph presented in Fig. 8, the proposed architectural model demonstrated exceptional performance. It has a small underfitting issue, as illustrated in Fig. 8. However, when the training and validation curves converged, the model demonstrated improved learning abilities and effectively demonstrated its ability to acquire knowledge from the training data. The loss graphs consistently showed only slight disparities between the training and validation losses, suggesting the model's strong efficacy. However, when tested on the banana leaf disease dataset, the suggested architecture didn't perform as well as it did on the black gram leaf disease dataset. This disparity can be ascribed to the intricate backgrounds present in the images.
4.4. Explainibilty analysis
It is imperative to cultivate a sense of confidence and reliability among users by explaining the proposed architecture thoroughly. This study utilized Grad-CAM++ to graphically depict the predictions made by the proposed architecture, focusing on the specific portions of the image within the layer of the model. The Grad-CAM++ technique was employed to capture and analyze the images of each class in the dataset. Every image poses distinct issues, such as differences in the rotation and background. The region that has been generated has a noticeable heat map using yellow, red, and green colors, which signifies its importance as a vital location identified by the proposed architecture and projected label. The heatmap identified a red region where a flaw was detected in each location. The contours and edges were precisely depicted, demonstrating the distinct absence of overlapping issues. Figs. 9a and 9b depict the input and images generated by Grad-CAM++ using the two disease datasets.
Figure 9.

Comparison of Input Images and Grad-CAM++ Assisted Outputs for Different Leaf Disease Datasets.
5. Discussion
The evaluation of various transfer-learning models underscored a common challenge of underfitting when confronted with datasets consisting of an insufficient amount of complicated images, particularly evident in the banana leaf dataset. Despite their initial promise, pre-existing models such as ResNet152V2, InceptionV3, and others demonstrated limitations in capturing intricate patterns and features present in these datasets. This underperformance highlights the need for more robust and adaptable architectures capable of effectively learning from sparse and complex data.
In response to these challenges, the proposed DenseNet201 architecture introduced significant improvements in model performance across multiple datasets. By leveraging a modified structural design, this architecture exhibited remarkable enhancements in accuracy, precision, recall, and AUC metrics. The incorporation of attentive transition layers, dense blocks, attention modules, and global average pooling techniques played vital roles in enhancing feature extraction and learning capabilities. Notably, the integration of attention mechanisms and dense layers with Swish activation functions further amplified the model's discriminative power, enabling it to effectively distinguish between healthy and diseased leaf samples with higher accuracy.
Furthermore, the utilization of explainable artificial intelligence techniques, such as Grad-CAM++, provided valuable insights into the decision-making processes of the DenseNet201 architecture. By generating visual heatmaps highlighting regions of interest within input images, Grad-CAM++ facilitated the interpretation of model predictions, thereby enhancing transparency, trust, and interpretability. This interpretability is crucial, especially in agricultural contexts, where stakeholders require clear explanations of model predictions to make informed decisions regarding disease management and crop protection strategies.
Looking ahead, future research directions may focus on further optimizing the proposed DenseNet201 architecture and exploring additional avenues for improving model performance and interpretability. This could involve fine-tuning hyperparameters, experimenting with different activation functions, and incorporating additional XAI techniques to enhance model explainability. Additionally, investigations into the transferability of the proposed approach to other agricultural domains and datasets with similar challenges would broaden its applicability and impact. Moreover, efforts to develop scalable and efficient deployment strategies for the DenseNet201 architecture in real-world agricultural settings could pave the way for its widespread adoption and practical implementation. Overall, this research represents a significant step forward in the development of advanced deep-learning models for leaf disease identification and management, with promising implications for sustainable agriculture and food security.
6. Conclusions
Plants play a critical role in sustaining life and economies globally, making plant health a key factor in agricultural productivity and economic stability. Diseases caused by pathogens like bacteria, fungi, and insects can significantly impact plant health, underscoring the need for early detection. This study aimed to develop a reliable method for detecting plant leaf diseases that is adaptable to variations in leaf size and background complexity. Through exploring advanced transfer-learning approaches and evaluating various pre-trained models, the research faced challenges with underfitting. To overcome these, a modified Densenet201Plus architecture was proposed, enhancing detection performance over traditional models on banana and black gram leaf disease datasets. While the results show promise in disease detection, further research is needed to refine these systems, with future work focusing on optimizing to prevent overfitting and underfitting and a more detailed comparison with recent advancements like convolutional transformers or ViT models with different experimental settings. This study contributes to improving plant disease control through advanced deep-learning techniques.
Ethical approval and consent to participate consent for publication statement
We adhered to all ethical guidelines and obtained appropriate consent for the preparation of this manuscript.
CRediT authorship contribution statement
Md. Khairul Alam Mazumder: Writing – original draft, Formal analysis, Conceptualization. Md Mohsin Kabir: Writing – original draft, Investigation, Formal analysis, Conceptualization. Ashifur Rahman: Methodology, Formal analysis. Md. Abdullah-Al-Jubair: Writing – review & editing, Visualization, Validation. M.F. Mridha: Writing – review & editing, Supervision.
Declaration of Competing Interest
The authors declare that they have no known competing financial interests or personal relationships that could have appeared to influence the work reported in this paper.
Contributor Information
Md. Khairul Alam Mazumder, Email: khairul@aiub.edu.
Md Mohsin Kabir, Email: mdmkabi@gmail.com.
Ashifur Rahman, Email: ashifurrahman.bubt@gmail.com.
Md. Abdullah-Al-Jubair, Email: abdullah@aiub.edu.
M.F. Mridha, Email: firoz.mridha@aiub.edu.
Data availability
This study utilized publicly accessible datasets for analysis, which can be accessed at the following links: the Banana leaf disease dataset: https://data.mendeley.com/datasets/rjykr62kdh/1 [30] and the Black Gram leaf disease dataset: https://data.mendeley.com/datasets/zfcv9fmrgv/3 [31].
References
- 1.Heng Q., Yu S., Zhang Y. A new ai-based approach for automatic identification of tea leaf disease using deep neural network based on hybrid pooling. Heliyon. 2024 doi: 10.1016/j.heliyon.2024.e26465. [DOI] [PMC free article] [PubMed] [Google Scholar]
- 2.Liu L., Qiao S., Chang J., Ding W., Xu C., Gu J., Sun T., Qiao H. A multi-scale feature fusion neural network for multi-class disease classification on the maize leaf images. Heliyon. 2024 doi: 10.1016/j.heliyon.2024.e28264. [DOI] [PMC free article] [PubMed] [Google Scholar]
- 3.Girma F., Fininsa C., Terefe H., Amsalu B. Evaluation of common bean (phaseolus vulgaris) genotypes for resistance to common bacterial blight and angular leaf spot diseases, and agronomic performances. Heliyon. 2022;8(8) doi: 10.1016/j.heliyon.2022.e10425. [DOI] [PMC free article] [PubMed] [Google Scholar]
- 4.Anani O.A., Mishra R.R., Mishra P., Enuneku A.A., Anani G.A., Adetunji C.O. Innovations in Food Technology: Current Perspectives and Future Goals. 2020. Effects of toxicant from pesticides on food security: current developments; pp. 313–321. [Google Scholar]
- 5.Nandini B., Mawale K.S., Giridhar P. Nanomaterials in agriculture for plant health and food safety: a comprehensive review on the current state of agro-nanoscience. 3 Biotech. 2023;13(3):73. doi: 10.1007/s13205-023-03470-w. [DOI] [PMC free article] [PubMed] [Google Scholar]
- 6.Ratnadass A., Fernandes P., Avelino J., Habib R. Plant species diversity for sustainable management of crop pests and diseases in agroecosystems: a review. Agron. Sustain. Dev. 2012;32:273–303. [Google Scholar]
- 7.Muluneh M.G. Impact of climate change on biodiversity and food security: a global perspective—a review article. Agric. Food Secur. 2021;10(1):1–25. [Google Scholar]
- 8.Gebbers R., Adamchuk V.I. Precision agriculture and food security. Science. 2010;327(5967):828–831. doi: 10.1126/science.1183899. [DOI] [PubMed] [Google Scholar]
- 9.Idris H., Mayura E., Budiyanti T., Gustia H., Ramadhan A.I., et al. Effect of doses fertilizer and harvest interval on the intensity of leaf spot diseases, production and quality of citronella grass (cymbopogon nardus l.) essential oils in ultisols soil. Heliyon. 2024 doi: 10.1016/j.heliyon.2024.e26822. [DOI] [PMC free article] [PubMed] [Google Scholar]
- 10.Shah D., Trivedi V., Sheth V., Shah A., Chauhan U. Rests: residual deep interpretable architecture for plant disease detection. Inf. Process. Agric. 2022;9(2):212–223. [Google Scholar]
- 11.Wu Y., Feng X., Chen G. Plant leaf diseases fine-grained categorization using convolutional neural networks. IEEE Access. 2022;10:41087–41096. [Google Scholar]
- 12.Li Z., Liu F., Yang W., Peng S., Zhou J. A survey of convolutional neural networks: analysis, applications, and prospects. IEEE Trans. Neural Netw. Learn. Syst. 2021;33(12):6999–7019. doi: 10.1109/TNNLS.2021.3084827. [DOI] [PubMed] [Google Scholar]
- 13.Xu D., Zhao H., Lawal O.M., Lu X., Ren R., Zhang S. An automatic jujube fruit detection and ripeness inspection method in the natural environment. Agronomy. 2023;13(2):451. [Google Scholar]
- 14.Eunice J., Popescu D.E., Chowdary M.K., Hemanth J. Deep learning-based leaf disease detection in crops using images for agricultural applications. Agronomy. 2022;12(10):2395. [Google Scholar]
- 15.Krishnamoorthy N., Prasad L.N., Kumar C.P., Subedi B., Abraha H.B., Sathishkumar V. Rice leaf diseases prediction using deep neural networks with transfer learning. Environ. Res. 2021;198 doi: 10.1016/j.envres.2021.111275. [DOI] [PubMed] [Google Scholar]
- 16.Rajeena F.P.P., Su A., Moustafa M.A., Ali M.A. Detecting plant disease in corn leaf using efficientnet architecture—an analytical approach. Electronics. 2023;12(8):1938. [Google Scholar]
- 17.Mukti I.Z., Biswas D. 2019 4th International Conference on Electrical Information and Communication Technology (EICT) IEEE; 2019. Transfer learning based plant diseases detection using resnet50; pp. 1–6. [Google Scholar]
- 18.Sanga S., Mero V., Machuve D., Mwanganda D. Mobile-based deep learning models for banana diseases detection. 2020. arXiv:2004.03718 arXiv preprint.
- 19.Sangeetha R., Logeshwaran J., Rocher J., Lloret J. An improved agro deep learning model for detection of Panama wilts disease in banana leaves. AgriEngineering. 2023;5(2):660–679. [Google Scholar]
- 20.Jiang Z., Dong Z., Jiang W., Yang Y. Recognition of rice leaf diseases and wheat leaf diseases based on multi-task deep transfer learning. Comput. Electron. Agric. 2021;186 [Google Scholar]
- 21.Hridoy R.H., Arni A.D., Haque A. Improved vision-based diagnosis of multi-plant disease using an ensemble of deep learning methods. Int. J. Electr. Comput Eng. 2023;13(5):5109–5117. [Google Scholar]
- 22.Elinisa C.A., Mduma N. Mobile-based convolutional neural network model for the early identification of banana diseases. Smart Agric. Technol. 2024 [Google Scholar]
- 23.Kaur A., Guleria K., Trivedi N.K. A deep learning-based model for biotic rice leaf disease detection. Multimed. Tools Appl. 2024:1–27. [Google Scholar]
- 24.Deng J. sheng, Huang W. qi, Zhou G. xiong, Hu Y. hui, Li jun L., Wang Y. feng. Identification of banana leaf disease based on kva and gr-arnet1. J. Integr. Agric. 2023 doi: 10.1016/j.jia.2023.11.037. [DOI] [Google Scholar]
- 25.Bhuiyan M.A.B., Abdullah H.M., Arman S.E., Rahman S.S., Mahmud K. Al. Bananasqueezenet: a very fast, lightweight convolutional neural network for the diagnosis of three prominent banana leaf diseases. Smart Agric. Technol. 2023;4 [Google Scholar]
- 26.Raja N.B., Rajendran P.S. A novel fuzzy-based modified gan and faster rcnn for classification of banana leaf disease. J. Inst. Eng. (India), Ser. A. 2023;104(3):529–540. [Google Scholar]
- 27.Talasila S., Rawal K., Sethi G., et al. Deep learning-based leaf region segmentation using high-resolution super had ccd and isocell gw1 sensors. J. Sens. 2023:2023. [Google Scholar]
- 28.Talasila S., Rawal K., Sethi G. Black gram disease classification using a novel deep convolutional neural network. Multimed. Tools Appl. 2023;82(28):44309–44333. [Google Scholar]
- 29.Safran M. 2023 3rd International Conference on Computing and Information Technology (ICCIT) IEEE; 2023. Real-time plant disease segmentation and identification using deep learning; pp. 377–383. [Google Scholar]
- 30.Hailu Y. Banana leaf disease images. v1. mendeley data. 2022. https://doi.org/10.17632/rjykr62kdh.1
- 31.Talasila G.S. Srinivas, Rawal Kirti. Blackgram plant leaf disease dataset. v3. mendeley data. 2023. https://doi.org/10.17632/zfcv9fmrgv.3
- 32.Li L., Zhang S., Wang B. Plant disease detection and classification by deep learning—a review. IEEE Access. 2021;9:56683–56698. [Google Scholar]
- 33.Jiang P., Chen Y., Liu B., He D., Liang C. Real-time detection of apple leaf diseases using deep learning approach based on improved convolutional neural networks. IEEE Access. 2019;7:59069–59080. [Google Scholar]
- 34.Saponara S., Elhanashi A. International Conference on Applications in Electronics Pervading Industry, Environment and Society. Springer; 2021. Impact of image resizing on deep learning detectors for training time and model performance; pp. 10–17. [Google Scholar]
- 35.Huang G., Liu Z., Van Der Maaten L., Weinberger K.Q. Proceedings of the IEEE Conference on Computer Vision and Pattern Recognition. 2017. Densely connected convolutional networks; pp. 4700–4708. [Google Scholar]
- 36.Ioffe S., Szegedy C. International Conference on Machine Learning. PMLR; 2015. Batch normalization: accelerating deep network training by reducing internal covariate shift; pp. 448–456. [Google Scholar]
- 37.Sharma S., Sharma S., Athaiya A. Activation functions in neural networks. Towards Data Sci. 2017;6(12):310–316. [Google Scholar]
- 38.Li P., He X., Cheng X., Qiao M., Song D., Chen M., Zhou T., Li J., Guo X., Hu S., et al. An improved categorical cross entropy for remote sensing image classification based on noisy labels. Expert Syst. Appl. 2022;205 [Google Scholar]
- 39.Chattopadhay A., Sarkar A., Howlader P., Balasubramanian V.N. 2018 IEEE Winter Conference on Applications of Computer Vision (WACV) IEEE; 2018. Grad-cam++: generalized gradient-based visual explanations for deep convolutional networks; pp. 839–847. [Google Scholar]
Associated Data
This section collects any data citations, data availability statements, or supplementary materials included in this article.
Data Availability Statement
This study utilized publicly accessible datasets for analysis, which can be accessed at the following links: the Banana leaf disease dataset: https://data.mendeley.com/datasets/rjykr62kdh/1 [30] and the Black Gram leaf disease dataset: https://data.mendeley.com/datasets/zfcv9fmrgv/3 [31].