Abstract
It has been shown previously that binding of vesicles and monolayers containing PE (phosphatidylethanolamine) by either erythroid or non-erythroid spectrin proved sensitive to inhibition by purified erythrocyte ankyrin. We tested the lipid-binding affinities of the purified ankyrin-binding domain of β-spectrin and of its truncated mutants in four ways, by analysing: (1) penetration of ‘loose’ PE/PC (phosphatidylcholine) monolayers; (2) binding to liposomes in suspension; (3) competition with spectrin for liposomes; and (4) binding of a PE/PC monolayer in a surface plasmon resonance system. The results obtained indicated that the full-length ankyrin-binding domain bound PE/PC mono- and bi-layers with moderate affinity, penetrated monolayers and competed with spectrin for liposomes. Moreover, its truncated mutants that retained the N-terminal part, in contrast with those lacking eight or 38 N-terminal residues (which bound lipid mono- and bi-layers with lower affinity), bound PE/PC mono- and bi-layers with an affinity and capacity comparable with those of the full-length ankyrin-binding domain, and this activity was inhibited by purified erythrocyte ankyrin. The full-length domain, in contrast with the mutant lacking 38 N-terminal residues, induced a small increase in the fluidity of PE/PC membranes when probed with 5′-doxyl stearate, similar to the effect of purified spectrin. Therefore we conclude that the binding site for PE-rich lipids, which is sensitive to ankyrin inhibition, is located in a 38-residue N-terminal fragment of the β-spectrin ankyrin-binding domain, and that the first eight residues play a key role in this activity.
Keywords: ankyrin-binding domain, membrane skeleton, phospholipid, β-spectrin, spectrin–phospholipid interaction
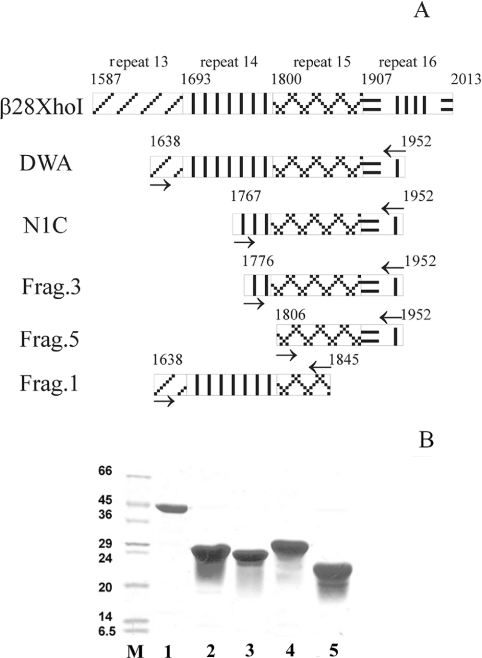
Abbreviations: AE1, anion-exchanger protein 1; FAT-liposomes, frozen and thawed liposomes; HPA, hexadecanethiol; PC, phosphatidylcholine; PE, phosphatidylethanolamine; PS, phosphatidylserine; RITC, rhodamine isothiocyanate; RU, resonance units; SPR, surface plasmon resonance; protein designations DWA, N1C, Frag.1, Frag.3 and Frag.5 are illustrated in Figure 1(A)
INTRODUCTION
The remarkable mechanical properties of the erythrocyte (red blood cell) membrane stem from the presence on the cytoplasmic surface of a dense, well organized protein network called the membrane skeleton. Its major component is spectrin, a high-molecularmass, flexible, rod-like protein formed by head-to-head association of two heterodimers composed of α (280 kDa) [1] and β (247 kDa) [2] subunits. Spectrin heterodimers are formed by antiparallel association of α and β subunits, each of which forms predominantly a segmental triple-helical molecule. Five to six spectrin tetramers interact with a short (37 nm) actin protofilament to form a structure known as the junctional complex, in which several other proteins (protein 4.1, adducin, dematin, p55, tropomyosin and tropomodulin) are also present [3,4]. The membrane skeleton of the erythrocyte is attached to the lipid bilayer embedded with integral membrane proteins through pathways of interaction with transmembrane proteins, i.e. spectrin–ankyrin–AE1 (anion-exchanger protein 1; band 3) protein (e.g. [5–7]) and the ternary interaction protein 4.1–p55–glycophorin C or D [8], or a recently discovered connection involving Rh (Rhesus factor), RhAG (Rh-associated glycoprotein), CD47, band 4.2 protein and/or ankyrin [9,10].
There are many indications from various studies on cells, isolated membranes and model systems that direct protein–lipid interactions contribute to the attachment of the membrane skeleton to the bilayer. The earliest published studies [11,12] on the interaction of spectrin with phospholipids pre-date the discovery of ankyrin in erythrocytes. Further studies showed that purified spectrin had the ability to bind hydrophobic and amphipathic ligands [13–18], supporting the view that spectrin contains a number of hydrophobic sites.
When the effect of ankyrin on the binding of spectrin to phospholipid vesicles was tested, inhibition of this interaction was observed [19]. The effect was greater for vesicles containing PE (phosphatidylethanolamine) [PE/PC (phosphatidylcholine), 3:2 (mol/mol)], for which 60% inhibition was found, compared with 10–20% inhibition for PS (phosphatidylserine)/PC vesicles. Almost identical results were obtained using a monolayer technique. Dixon-type analysis indicated a competitive mechanism of inhibition of a PE/PC vesicle or monolayer by ankyrin. Tetrameric spectrin bound similarly to a PE/PC monolayer, but inhibition with ankyrin suggested that only one of the two possible binding sites is engaged in this interaction [20]. Moreover, when interactions of brain spectrin with PE/PC monolayers in the presence of ankyrin were analysed, a similar level of inhibition of these interactions by ankyrin was observed [21]. Also, when an isolated erythroid spectrin β subunit was introduced into the subphase of PE/PC monolayers in the presence of ankyrin, the inhibition was even stronger, i.e. a 3-fold lower concentration of ankyrin was sufficient to induce the same effect. If the α subunit was used instead of the β subunit, its effect on the monolayer surface pressure was small and entirely insensitive to inhibition by ankyrin [21]. These data imply that a functional relationship and spatial proximity between ankyrin and phospholipid-binding sites exist in β-spectrin.
Here we report the results of experiments that document further the ability of the ankyrin-binding domain of erythroid β-spectrin to bind PE-rich mono- and bi-layers. We expressed in bacteria a polypeptide corresponding to the ankyrin-binding domain and a series of its truncated mutants, and performed lipid mono- and bi-layer binding studies. We found that the purified ankyrin-binding domain and its truncated mutants penetrated ‘loose’ PE/PC monolayers. The results of liposome-binding studies and of studies performed with a SPR (surface plasmon resonance) system indicated that the full-length ankyrin-binding domain bound PE/PC mono- and bi-layers with moderate affinity (KD values in the submicromolar range). In addition, truncated mutants of the ankyrin-binding domain that retained the N-terminal part bound PE/PC mono- and bi-layers with an affinity and a capacity comparable with those of the full-length ankyrin-binding domain. They also competed effectively for lipids with purified, labelled spectrin. On the other hand, truncated mutants that lacked even the eight most N-terminal amino acid residues showed a lower (by at least an order of magnitude) affinity and a much higher maximal binding capacity.
We also found that the expressed full-length ankyrin-binding domain induced a small decrease in the order parameter (an increase in the fluidity) of PE/PC membranes when probed with 5′-doxyl stearate, similar to the effect of purified spectrin, while mutants lacking 38 residues from the N-terminus induced a small increase in the order parameter (a decrease in fluidity), which was similar to the effect of BSA. Furthermore, binding of PE/PC monolayers by the expressed ankyrin-binding domain and its variants containing an intact N-terminus was inhibited by purified ankyrin. The effect of ankyrin on the binding of PE/PC mono- and bi-layers by both N-terminal mutants (i.e. lacking eight or 38 N-terminal residues) was either reduced or abolished.
MATERIALS AND METHODS
Construction of full-length and truncated mutants of the ankyrin-binding domain of erythrocyte β-spectrin
We used erythroid β-spectrin produced from a cDNA encoding approximately the C-terminal half of the protein (amino acid residues 1397–2015). Sequential N- and C-terminal truncations were constructed by PCR (Roche), using appropriate oligonucleotides containing restriction sites (BamHI, HindIII, XhoI). Forward primers: ANKNBam, 5′-GAGGACTACGGCCGGATCCTCAAGCAGCTG-3′; ANKN1Bam, 5′-GAGGCGGCCAGGATCCCCGAGTGGAAGGAC-3′; ANKN15/6Xho, 5′-GGGCTGCTCGAGATGTGGGCAGACCTCCTG-3′; ANKN15/33Bam, 5′-CGCTACTTCTACACGGGATCCGAGATCCTG-3′; reverse primers: ANKCHind, 5′-CGGTTTCAAGCTTTGCATTGATGCCCTGGTG-3′; ANKC15/27Hind, 5′-CAGGTGAAGCTTCCGCTCGAAGGCTGTGTG-3′. The PCR products obtained were cloned into a pRSET A and C expression vector and were stored in Escherichia coli strain JM109. The resulting mutant cDNAs were sequenced to verify the mutations. Plasmids were then transferred into BL21(DE3)pLysS cells for expression of the mutated spectrin proteins. A His6 tag was introduced at the C-terminus of the expressed ankyrin-binding domain and its truncated mutants using the pRSET plasmid. Recombinant proteins were expressed in a bacterial expression system using isopropyl β-D-thiogalactoside as an inducer for 3 h at 37 °C, extracted with 8 M urea and 100 mM NaCl in 20 mM Tris/HCl, pH 8.0, and purified by immobilized Co2+-affinity chromatography (Clontech). The His-tagged proteins were analysed in Coomassie Blue-stained SDS/PAGE (10%) gels and identified by Western blot using an antibody against erythroid β-spectrin subunits and an antibody against the full-length ankyrin-binding domain of erythrocyte β-spectrin.
Erythrocyte spectrin
Bovine erythrocyte spectrin dimer was purified by extraction of erythrocyte ghosts with low-ionic-strength buffer at 37 °C, as described previously [22]. Following incubation, the extract was subjected to chromatography on a Sepharose CL4B column (2.5 cm×70 cm). For this purpose, the column was equilibrated with phosphate buffer (20 mM sodium phosphate, pH 7.4, 0.1 mM EDTA, 1 mM NaN3, 0.1 mM β-mercaptoethanol). Peak fractions were analysed by SDS/PAGE (7% gels).
Erythrocyte ankyrin
Erythrocyte ankyrin was purified as described previously by Hall and Bennett [23] and Białkowska et al. [19].
CD analysis
CD measurements were performed on a JASCO CD spectrometer, using a thermostat-controlled cell with 0.1 cm path length at 10 °C, or from 10 to 70 °C in 10 °C increments. The spectra were obtained at 0.2 nm resolution from 190 to 260 nm. Spectra of Tris/HCl buffer (20 mM Tris/HCl, pH 8.0, 100 mM NaCl) under similar CD conditions were used to correct spectral baselines of the samples. Ellipticity (θ; degrees) values from CD spectra were converted into molar residue ellipticity ([θ]M; degrees·cm2·dmol−1) values. Helical contents were calculated from values of the amide nπ* transition at 222 nm ([θ222]), using a value of −36000 degrees·cm2·dmol−1 to represent 100% α-helical content [24].
Ankyrin-binding activity of expressed polypeptides
The ankyrin-binding activity of expressed polypeptides was tested in experiments in which a metal affinity resin (Talon®) saturated with His-tagged polypeptides was incubated with increasing concentrations of RITC (rhodamine isothiocyanate)-labelled erythrocyte ankyrin in buffer containing 20 mM Tris/HCl, pH 7.5, and 150 mM NaCl for 30 min at room temperature (20 °C). After incubation, the samples were centrifuged at 13000 g for 5 min. The pellets were washed with 20 mM Tris/HCl, pH 7.5, 150 mM NaCl, containing 1 mM imidazole for 15 min and centrifuged at 13000 g for 5 min. The polypeptides together with labelled ankyrin were eluted with the same buffer containing 50 mM imidazole and were analysed by measurements of fluorescence in a Kontron SFM 25 spectrofluorimeter. Excitation and emission wavelengths were 553 and 575 nm respectively.
Monolayer experiments
Monolayer measurements were performed by the Wihelmy technique, using a Teflon trough (surface area 24 cm2) and a Nima tensiometer (NimaTechnology, Coventry, U.K.), at room temperature (20 °C). Subphase buffer (25 ml) contained 5 mM Tris/HCl, pH 7.5, 0.5 mM EDTA, 150 mM NaCl, 0.5 mM dithiothreitol and 1 mM NaN3. Monolayers were formed by the injection of a chloroform solution of a mixture of phospholipids (PE/PC, 3:2) with a Hamilton syringe. Measurements were performed at initial surface pressure values of 9–11 mN/m. Expressed polypeptides were dissolved in the subphase buffer and injected into the subphase to obtain the indicated concentrations. For inhibition of lipid–protein interactions by ankyrin, expressed polypeptides were preincubated for 30 min at room temperature with purified ankyrin at polypeptide/ankyrin ratios of 1:0.05, 1:0.1, 1:0.15 and 1:0.2 (w/w), and then injected into the subphase.
Preparation of FAT-liposomes (frozen and thawed liposomes)
FAT-liposomes were prepared according to Hope et al. [25], using buffer comprising 5 mM Tris, pH 7.5, 0.5 mM EDTA, 150 mM NaCl, 0.5 mM dithiotreitol, 1 mM NaN3 and 20% dextran T-40. The liposome suspension was diluted with the assay buffer without dextran and centrifuged at 15000 g to remove small vesicles and untrapped dextran.
Fluorescent labelling of proteins
Purified erythrocyte spectrin and the expressed polypeptides were fluorescently labelled using tetramethylrhodamine-5-maleimide, which reacts with thiol groups on proteins to give thioether, except for Frag.1 (see Figure 1A for designations of truncated mutants of the ankyrin-binding domain), which does not contain a cysteine residue. Labelling was performed according to the manufacturer's directions. In the case of Frag.1 and erythrocyte ankyrin, labelling with RITC was carried out in sodium carbonate buffer, pH 9.0, for 8 h at 4 °C. Unreacted label was quenched with 100 mM Tris/HCl, pH 8.0, and dialysed out against the assay buffer.
Figure 1. The β-spectrin ankyrin-binding domain and its truncated mutants.
(A) Schematic representation of the ankyrin-binding domain of erythrocyte spectrin and of the location of primers (→) used to amplify appropriate DNA fragments. Clone β 28 Xho was obtained from Dr J.S. Morrow [29]. DWA is the full-length ankyrin-binding domain, and N1C, Frag.1, Frag.3 and Frag.5 denote specific truncated mutants as indicated. (B) Amplified DNA fragments coding for the full-length ankyrin-binding domain of erythrocyte β-spectrin and its truncated mutants obtained by PCR using appropriate primers were cloned into pRSET vector. Recombinant proteins were expressed in a bacterial strain BL-21 expression system using isopropyl β-D-thiogalactoside induction for 3 h at 37 °C, and were purified by immobilized Co2+-affinity chromatography (Clontech). A Coomassie Blue-stained SDS/polyacrylamide gel (10%) electophoretogram of the expressed proteins is shown. Lanes: M, protein markers (molecular masses in kDa are shown to the left); 1, DWA (full-length ankyrin-binding domain); 2, N1C; 3, Frag.3; 4, Frag.1; 5, Frag.5.
Pelleting assays
Fluorescently labelled proteins were incubated with FAT-liposomes (10 mg of lipid/ml) in test buffer containing 5 mM Tris/HCl, pH 7.5, 0.5 mM EDTA, 150 mM NaCl, 0.5 mM dithiothreitol and 1 mM NaN3 for 30 min at room temperature (20 °C). After incubation, the samples were centrifuged at 15000 g for 6 min. The liposome pellets were dissolved in 1% (w/v) SDS for 15 min. Fluorescence measurements were performed using a Kontron SFM 25 spectrofluorimeter. The excitation and emission wavelengths for tetramethylrhodamine-labelled proteins were 541 and 567 nm respectively, while for RITC-labelled proteins these values were 553 and 575 nm respectively. Inhibition experiments were performed in the presence of an excess of unlabelled full-length ankyrin-binding domain or Frag.3, which were added to the samples with the liposomes and labelled fragments. KD and Bmax values were calculated according to the equation B=(Bmax·free)/(KD+free) by using non-linear regression.
Biomolecular interaction analysis (SPR)
Experiments were performed using a BIAcore 1000 device in which was placed an HPA (hexadecanethiol) sensor chip (covered with octadecane thiol; BIAcore). A PE/PC (3:2) monolayer was deposited according to Cooper et al. [26] and Hubbard et al. [27], using extruded PE/PC vesicles (100 nm in diameter) at a concentration of 10 mg/ml in 5 mM Tris/HCl, pH 7.5, 0.5 mM EDTA, 150 mM NaCl, 0.5 mM dithiothreitol and 1 mM NaN3. A stable monolayer was used in the entire series of experiments. The bound protein was washed off with short pulses of 50 mM NaOH. Data evaluation was performed using BIAcore evaluation software assuming simple Langmuir dissociation and association (1:1) models. The choice of model was based on the linearity of the ln[abs ln(dY/dX)] criterion as suggested by the BiaCore manual. Dissociation and association curves were fitted separately. ka values were calculated by fitting to the expression
 |
[where ka is the association constant, kd is the dissociation constant, C is the concentration, RI is the resonance value in resonance units (RU) and Rmax is the value of the maximal resonance in RU], and kd values were calculated by fitting to the expression R0·exp[−kd·(t−t0)]+offset (where R0 is the initial value of the resonance in RU; other symbols are as shown above). The KD value (equilibrium dissociation constant) was then determined from kd/ka.
EPR experiments
Spectra were recorded with a Bruker ESP 300E 9 GHz spectrometer (equipped with a temperature control device) at magnetic field modulation frequencies of 100 kHz over a scan range of 100 G. 5′-Doxyl stearate was incorporated into the PE/PC vesicles to a final spin label/membrane lipid molar ratio of <0.01 in order to avoid line-broadening effects in the EPR spectra. Labelling with 5′-doxyl stearate (Aldrich) was achieved by a 30 min incubation at room temperature of the PE/PC membrane suspension in 5 mM Tris/HCl, pH 7.4, and 150 mM NaCl, in a glass test tube with a dry film of the spin label probe. Then an appropriate volume of protein was added to a final concentration of 150 μg/ml. DWA/liposome, Frag.5/liposome, spectrin/liposome and BSA/liposome suspensions were recorded at temperatures of 20, 25, 30, 35 and 40 °C. Order parameter values were calculated as described by Sefton and Gaffney [28]. The mean of four independent measurements is presented. Extruded PE/PC liposomes (1:1; 20 mg of lipids per 1 ml) were obtained as described above. The final, average size of liposomes was 114±3.7 nm (mean±S.E.M.), as assessed using a Zeta Sizer (Malvern) Photon Correlation Spectroscope.
RESULTS
Expression, purification and characterization of the ankyrin-binding domain of β-spectrin and its truncated mutants
In order to study the interrelationship between spectrin–phospholipid and spectrin–ankyrin interactions, we undertook to express and purify the ankyrin-binding domain of erythrocyte β-spectrin and fragments thereof. The strategy used to obtain the full-length ankyrin-binding domain was to amplify appropriate DNA fragments from a cDNA clone (β 28 Xho), which was generously provided by Dr J. S. Morrow (Yale University, New Haven, CT, U.S.A.). Appropriate DNA fragments coding for the ankyrin-binding domain of erythrocyte β-spectrin and its truncated mutants (Figure 1A) were PCR-amplified and cloned into a pRSET (A or C) expression vector. E. coli strain BL21(DE3)pLysS cells were transformed with purified plasmids and overexpression was induced with isopropyl β-D-thiogalactoside. Purification of the full-length ankyrin-binding domain and its truncated fragments at rather high quantities (∼1 mg/100 ml of bacterial culture) could be achieved by Co2+-affinity chromatography. The result of the electrophoretic analysis of such polypeptide preparations is presented in Figure 1(B). As can be seen, the ankyrin-binding domain and its mutants could be easily purified in high quantities, and they were stable after urea removal at concentrations of ∼300 μg/ml for ∼2 weeks at 4 °C. Stability in solution, together with the structural and functional features described below, suggest that the conformation of the expressed fragments resembles that of the ankyrin-binding domain in erythrocyte spectrin. This CD spectra of expressed and purified full-length and truncated ankyrin-binding domains (results not shown) indicated the presence of approx. 44–66% α-helical structure. Moreover, thermal denaturation profiles displayed a typical, sigmoidal shape (results not shown) and substantial loss of α-helicity at temperatures above 60 °C (Table 1), which is a characteristic feature of the spectrin rod domain. Another proof of the correct structure was the ability of the protein fragments to bind ankyrin in vitro.
Table 1. α-Helical structure content of the full-length ankyrin-binding domain and its mutants calculated on the basis of CD spectra at 10 and 60 °C.
Details are given in the Materials and methods section. See Figure 1(A) for protein designations.
| α-Helix content (%) | ||
|---|---|---|
| Protein | 10 °C | 60 °C |
| DWA | 65.9 | 31.7 |
| N1C | 51.4 | 36.6 |
| Frag.1 | 51.5 | 16.4 |
| Frag.3 | 41.0 | 22.4 |
| Frag.5 | 44.3 | 32.5 |
Ankyrin binding by the expressed polypeptides corresponding to the ankyrin-binding domain and its truncated mutants
The expressed ankyrin-binding domain (DWA) and its truncated mutants (Frag.1, Frag.3 and Frag.5) (see Figure 1A) were tested for ankyrin-binding activity in experiments in which a metal-affinity resin (Talon®) saturated with His-tagged polypeptides was incubated with increasing concentrations of RITC-labelled erythrocyte ankyrin. All immobilized polypeptides tested bound labelled ankyrin in a saturable manner (results not shown). KD values calculated using non-linear regression were of the order of 0.1 μM (Table 2). Surprising was the lack of difference in KD between Frag.1 corresponding to fragment β28-NdeI (1397–1865), which was found to be inactive in inhibition of spectrin binding to inside-out vesicles and therefore inactive in ankyrin binding by Kennedy et al. [29]. Another property of DWA and some of its truncated mutants was the sensitivity of the lipid-binding activity to ankyrin inhibition (see Figure 7 below).
Table 2. Equilibrium dissociation constants for binding of ankyrin by expressed full-length ankyrin-binding domain (DWA) and its truncated mutants (Frag.1, Frag.3 and Frag.5).
Data were obtained from hyperbolic binding isotherms (not shown) by non-linear regression according to the equation: B=Bmax·free/KD+free; B and Bmax, bound ankyrin, the concentration of free ankyrin is in mol/l. Values are means±S.E.M.
| Protein | KD (nM) |
|---|---|
| DWA | 173±28 |
| Frag.1 | 169±37 |
| Frag.3 | 370±75 |
| Frag.5 | 677±450 |
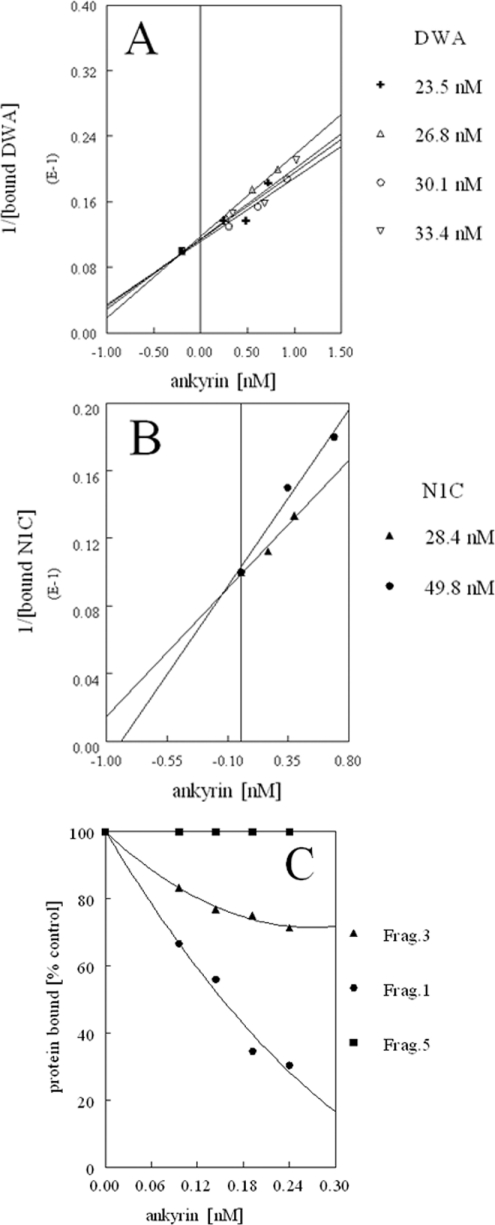
Figure 7. Effects of erythrocyte ankyrin on binding of the full-length ankyrin-binding domain and its truncated mutants to PE/PC (3:2) monolayers.
(A) Dixon-type plot [30] of the results obtained for the four indicated concentrations of DWA protein. The Ki value was 0.124 nM. (B) Dixon plot of the results obtained for two concentrations of N1C protein (Ki 0.148 nM). Proteins were preincubated for 30 min at room temperature with purified ankyrin at weight ratios of 1:0.05, 1:0.1, 1:0.15 and 1:0.2. (C) Effects of ankyrin on binding of Frag.1 (3.3 μM), Frag.3 (3.7 μM) and Frag.5 (4.3 μM) to the monolayer.
Lipid-binding activity of the expressed ankyrin-binding domain and its truncated mutants
The expressed purified ankyrin-binding domain induced an increase in surface pressure, in a concentration-dependent manner, of PE-rich (3:2 mixture with PC), ‘loose’ (9 mN/m) monolayers (results not shown). This method, although rapid and useful for indicating an interaction of proteins with lipids in a monolayer, can give only comparative results because the measurements are performed at low surface-pressure values far from the 30–35 mN/m suggested as being appropriate for comparisons with natural membrane bilayers.
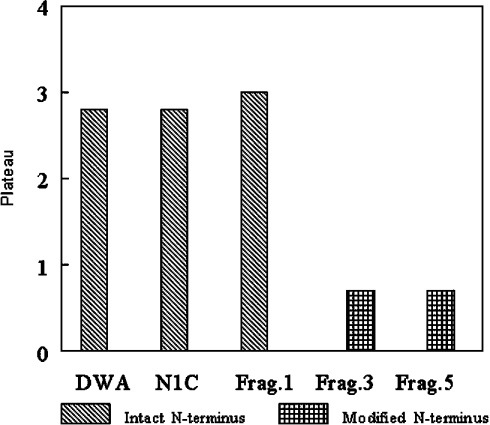
The presented data indicate that the effects of individual polypeptides were pronounced; however, if we consider the plateaus, we can see that the effects of fragments with an intact N-terminus were much greater than those of mutants with deleted N-terminal (either the first eight or 38 residues) sequences (Figure 2). The presence of a His tag was not responsible for the lipid-binding property, as a His-tagged fragment of emerin (residues 1–70), which does not bind lipids or other amphipathic ligands, did not change the surface pressure of the PE/PC monolayer.
Figure 2. Interaction of the expressed ankyrin-binding domain and its mutants with a monolayer composed of a PE/PC (3:2) mixture.
Measurements were performed at an initial surface pressure of 9 mN/m. Bars represent Δπ plateau values in mN/m obtained from plots of the dependence of Δπ on the concentration of the particular peptide in the subphase (not shown).
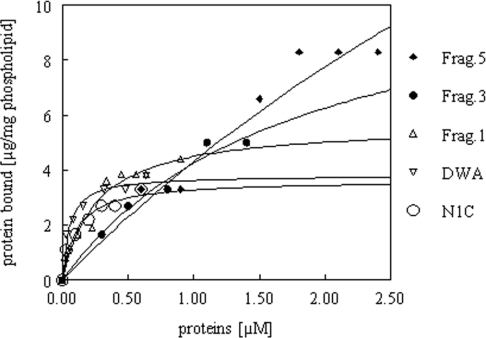
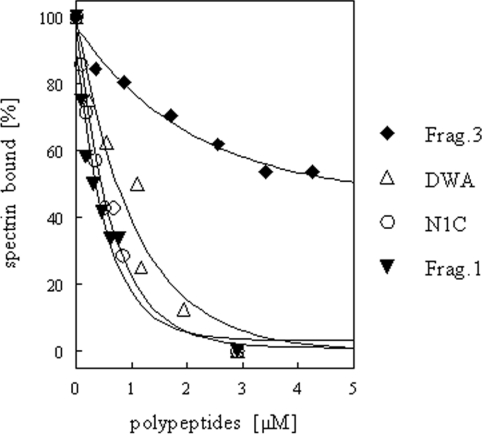
The isolated ankyrin-binding domain and its truncated fragments were fluorescently labelled with tetramethylrhodamine maleimide on a single cysteine residue. The only exception was Frag.1, which was labelled with RITC, since it does not contain thiol groups. The isotherms of binding of the ankyrin-binding domain and its four truncated mutants to PE/PC liposomes at room temperature are shown in Figure 3. The unlabelled fragments competed for the labelled ones, suggesting that labelling did not induce binding activity (results not shown). The binding isotherms presented in Figure 3 indicate that full-length ankyrin-binding domain and its truncated mutants N1C and Frag.1 displayed saturable binding. On the other hand, Frag.3, which lacks eight amino acid residues from the N-terminus of the ankyrin-binding domain, and Frag.5, which lacks the 38 N-terminal residues, reached saturation at much higher concentrations (Figure 3). The calculated KD values, presented in Table 3, indicate a lower affinity of these mutants towards PE/PC vesicles compared with the full-length ankyrin-binding domain and its mutants retaining the N-terminal sequence.
Figure 3. Binding of increasing concentrations of purified, fluorescently labelled full-length ankyrin-binding domain and its mutants by PE/PC (3:2) FAT-liposomes.
Curves were fitted by non-linear regression according to the equation B=Bmax×free/KD+free. B and Bmax denote protein bound; the concentration of free protein is given in mol/l. Details in are given in the Materials and methods section.
Table 3. Kinetic parameters for the interaction of the full-length ankyrin-binding domain and its mutants with PE/PC mono- and bi-layers obtained from SPR measurements (Figure 5) and pelleting assay (Figure 3).
The parameters were determined as described in the Materials and methods section. In addition, KD and Rmax values for the interaction of the full-length ankyrin-binding domain and Frag.5 with the hydrophobic surface of a bare chip (hexadecane thiol-covered) are presented.
Another way to demonstrate the lipid-binding activity of the ankyrin-binding domain and its mutants was to analyse the competition for binding to liposomes with fluorescently labelled erythrocyte spectrin. The results of these experiments, shown in Figure 4, indicate that the full-length ankyrin-binding domain and its mutants retaining the N-terminal sequence effectively inhibited binding of labelled spectrin to PE/PC liposomes. Again, in the case of Frag.3, the competition was rather small. Frag.5, however, at higher concentrations inhibited the binding of spectrin to liposomes by binding to spectrin, as demonstrated by gel filtration chromatography on a Sepharose 4B column (results not shown).
Figure 4. Purified ankyrin-binding domain and its truncated mutant Frag.3 inhibit binding of erythrocyte spectrin to PE/PC (3:2) liposomes.
Purified erythrocyte spectrin (50 nM), labelled with tetramethyl rhodamine-5-maleimide, was incubated with PE/PC (3:2) FAT-liposomes (10 mg of lipid/ml). The indicated concentrations of DWA (the full-length ankyrin-binding domain) or Frag.3 were included in the incubation mixture. Details are given in the Materials and methods section.
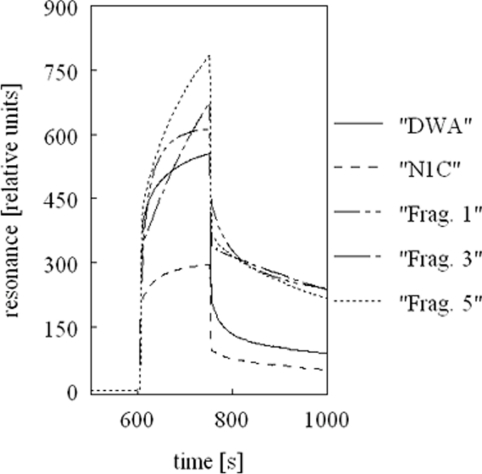
To obtain more quantitative data on binding to the PE/PC lipid mixture, we deposited the PE/PC monolayer on to an HPA-coated plasmon resonance sensor plate (see the Materials and methods section). Such a monolayer served as a binding matrix for the ankyrin-binding domain and its mutants. Examples of traces of binding of the ankyrin-binding domain and its fragments are shown in Figure 5. The curves for Frag.3 and Frag.5 did not reach a plateau. Kinetic data obtained by using a one-site model from the BIAEvaluation software are also shown in Table 3. The KD values obtained from the SPR measurements are in good agreement with these obtained in the pelleting experiments. We also performed an experiment with a bare HPA chip using the entire ankyrin-binding domain and Frag.5. The results presented in Table 3 also indicate differences in the affinity towards hydrophobic surfaces. Although the difference in the obtained dissociation constants between full-length ankyrin-binding domain and its truncated highly active mutants (N1C and Frag.1), when compared with its ‘less active’ mutants Frag.3 and Frag.5, was not large, it is nevertheless consistent when this interaction is tested in several ways.
Figure 5. Examples of SPR traces obtained from the interaction of the ankyrin-binding domain and its truncated mutants with a PE/PC monolayer deposited on a HPA chip (BiaCore).
Concentrations were as follows: DWA, 4.4 μM; N1C, 3.3 μM; Frag.1, 6.08 μM; Frag.3, 6.18 μM; Frag.5, 7.76 μM. Details are given in the Materials and methods section; kinetic parameters calculated from the experimental data are shown in Table 3.
Effects of the expressed polypeptides on the fluidity of the PE/PC bilayer
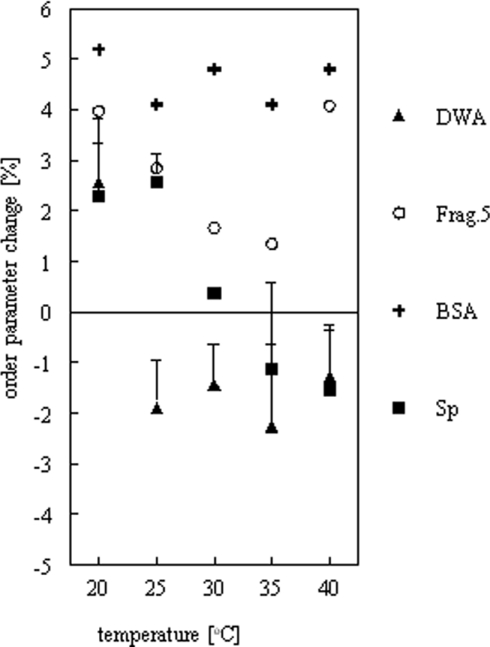
Another question was whether the ankyrin-binding domain, under the conditions that facilitate interaction with phospholipid membranes, affects the properties of the membrane. We used simple spin labelling of PE/PC liposomes with 5′-doxyl stearate (10 μM) and recorded EPR spectra in the presence or absence of the full-length ankyrin-binding domain or its fragment Frag.5, which displayed a lower affinity in the pelleting assay and SPR experiments. The results of the spin-labelling experiments are shown in Figure 6. The ankyrin-binding domain induced a small decrease in the order parameter, which indicates an increase in the mobility of the probe (which is located close to the polar region of the membrane), similar to that induced by purified erythrocyte spectrin, while Frag.5 induced a small increase in the order parameter, similar to that induced by BSA at the same concentration (w/v).
Figure 6. Effects of the ankyrin-binding domain on the order parameter of PE/PC membranes.
Details are given in the Materials and methods section.
Effects of purified erythrocyte ankyrin on binding of a PE/PC monolayer by the expressed ankyrin-binding domain and its truncated mutants
As mentioned in the Introduction, the PE-rich-lipid-binding ability of spectrin is inhibited by purified ankyrin. Bacterially expressed and purified ankyrin-binding domain DWA and the N1C construct (Figures 7A and 7B), as well as the truncated mutant Frag.1 (Figure 7C), showed a dependence of lipid-binding activity on ankyrin, while this activity of the mutant constructs with deletions at the N-terminus (Frag.3 and Frag.5) was weakly sensitive or entirely insensitive to inhibition by purified ankyrin (Figure 7C). Therefore it seems clear that the expressed ankyrin-binding domain and its truncated mutants containing the N-terminal sequence show the PE-rich-lipid-binding activity of the native spectrin molecule. Ki values for inhibition of this interaction by ankyrin for the full-length ankyrin-binding domain and its shorter form of 0.124 and 0.148 nM respectively were obtained by performing Dixon-type analysis [30]. It can therefore be concluded that PE-rich-lipid-binding activity that is sensitive to inhibition to ankyrin is dependent exclusively on the N-terminal part (∼30–40 amino acid residues) of this domain. Fragments that do not contain even the first eight residues of this sequence bind lipids with lower affinity, and this binding remains insensitive to inhibition by purified ankyrin (Figure 7C).
DISCUSSION
It has been known for a long time that spectrin binds phospholipid mono- and bi-layers. This activity (in particular, the binding of PE-rich lipid layers) was found to be sensitive to inhibition by purified erythrocyte ankyrin, suggesting the localization of a lipid-binding site in the ankyrin-binding domain of β-spectrin. Therefore we attempted to map and characterize the phospholipid-binding site in this ankyrin-binding domain. It should be noted that a recent, very interesting study on the mapping of a binding site for another amino-phospholipid, PS, indicated the same region (ankyrin-binding domain) to be one of the lipid-binding centres [31]. That study, however, was concerned with the location of such sites in the entire spectrin molecule, and was rather qualitative in nature, indicating mostly binding capacities for lipid vesicles. In the present study we report quantitative data and the identification of a binding site for PE-rich mono- and bi-layers. We cloned, bacterially expressed and affinity purified the β-spectrin ankyrin-binding domain and a small series of its truncated mutants. All of the constructs (Figure 1) had an α-helical structure and bound purified, fluorescently labelled erythrocyte ankyrin with similar affinities (KD∼0.1–1 μM). The latter data are interesting, as they indicate that Frag.1 (residues 1638–1844) showed ankyrin-binding activity similar to that of the full-length ankyrin-binding domain, whereas Kennedy et al. [29] reported previously that a similar fragment (residues 1397–1865) did not inhibit spectrin binding to inside-out vesicles. Perhaps this difference results from different experimental approaches.
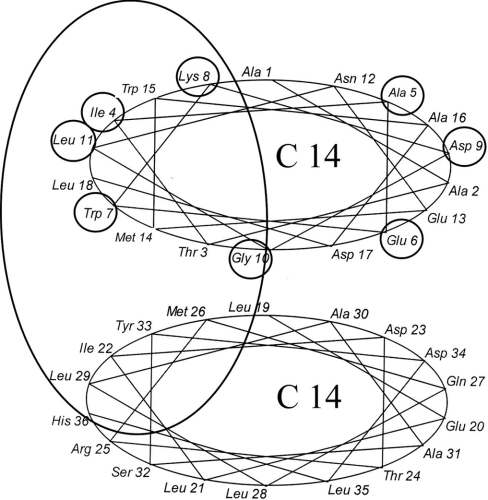
We tested the interaction of the full-length β-spectrin ankyrin-binding domain and its truncated mutants with PE/PC mono- and bi-layers in four ways: (1) binding to PE/PC monolayers at moderate surface pressure; (2) binding of fluorescently labelled polypeptides to liposomes composed of a PE/PC mixture; (3) competition of unlabelled polypeptides with fluorescently labelled erythrocyte spectrin; and (4) binding of pure polypeptides to a PE/PC monolayer deposited on solid support using the SPR technique. The data from all four types of experiment indicate that this domain is responsible to a large extent for spectrin binding to phospholipid mono- and bi-layers rich in PE. This finding is in accordance with our previous data on phospholipid binding by erythroid spectrin [19]. Systematic analyses performed by using truncated mutants of the erythrocyte β-spectrin ankyrin-binding domain revealed similar affinities towards lipids rich in PE of ankyrin-binding domain fragments in which the ‘native’ N-terminus was retained after truncation. Obtained KD and Rmax values were similar to those for the wild-type ankyrin-binding domain. On the other hand, two fragments truncated from the N-terminus by eight and 38 residues displayed a markedly lower affinity towards PE/PC mono- and bi-layers. Both pelleting assays with liposomes and SPR analyses indicated a decrease in affinity of an order of magnitude and a significant increase in maximal binding capacity observed in both assays. Therefore the N-terminal sequence of 38 amino acid residues (shown in part in Figure 8) seems to be responsible for the high to moderate affinity of this domain towards lipid mono- and bi-layers containing PE. In particular, the first eight amino acids, IAEWKDGL, are likely to play a key role in this activity. This region does not seem very hydrophobic, but rather is amphipathic, when folded in an α-helix. This short structure could be responsible either for a direct interaction (being an important fragment of the hydrophobic surface) or for proper folding of the entire fragment forming the hydrophobic surface. Experiments on the interaction of purified ankyrin-binding domain polypeptides with ‘loose’ (9 mN/m) PE/PC monolayers may indicate penetration of the latter by polypeptides. The effect of a full-length polypeptide seems to be in accordance with the results of a spin-label experiment indicating a small increase in lipid hydrocarbon chain mobility of PE/PC liposomes, resembling the effect of native spectrin [32]. What would be the nature of this interaction – is it a vertical penetration (integral protein-type) or a horizontal surface-seeking protein-type (amphipathic helix, e.g. mellitin) interaction? The plot of hydrophobic moment against hydrophobicity [33] indicates the latter possibility – almost 95% of the residues of the ankyrin-binding domain displayed the properties of residues of a surface-seeking helix (results not shown). This may indicate a surface disposition of this part of the ankyrin-binding domain in native spectrin. This conclusion is also supported by the fact that purified ankyrin competitively inhibits binding of this domain to the PE/PC monolayer, with a Ki in the nanomolar range. This was true only for constructs with an intact N-terminal domain. Removal of eight residues decreased the sensitivity of lipid binding to inhibition by ankyrin, while removal of the N-terminal 38 residues abolished it completely. Frag.1, which represents the ankyrin-binding domain truncated from the C-terminus, still retains this sensitivity. This, in addition to the data on ankyrin binding presented above, indicates an importance of physical binding of this part of the ankyrin-binding domain to ankyrin, and may indicate a spatial relationship of lipid- and ankyrin-binding sites. Namely, the N-terminal region (∼38 residues) plays a role in ankyrin binding and is essential for ankyrin-sensitive lipid binding. When this region is absent, the high(er)-affinity phospholipid-binding site is not functional, while ankyrin still can be bound. The lower-affinity lipid-binding activity still exists, but remains insensitive to inhibition by ankyrin. It is possible that the absence of first eight residues may affect folding of this region, and this change is invisible in CD spectra. However, the occurrence of ankyrin-binding activity suggests that the structure of the fragment resembles native spectrin.
Figure 8. ‘Helical wheel’ representation of the N-terminal part of the erythrocyte β-spectrin ankyrin-binding domain.
The first eight amino acid residues are circled. The vertical ellipse indicates the presumed phospholipid-binding surface. The start of the helical segment is based on data from [40].
With regard to the physiological significance of the observed inhibition of spectrin–phospholipid interactions by ankyrin, we proposed [34] an ankyrin/PE model to explain the role of the affinity of the ankyrin-binding site towards PE/PC-rich domains. The present data seem to support and further explore this phenomenon. It is well known that, at least in erythrocyte membranes, there are situations in which either ankyrin is deficient or its affinity for spectrin is reduced. Spectrin tetramers bind ankyrin at the highest-affinity site, but when there is not enough functional ankyrin to accommodate all of them, they will bind to PE-rich domains. For instance, erythrocytes of mutant mice, whose erythroblasts fail to synthesize ankyrin, still accumulate half of the normal amount of spectrin [35]; moreover, their foetal erythrocytes are morphologically similar to foetal erythrocytes of normal mice [36]. A similar situation is seen with erythrocytes of ankyrin-deficient mice, which contain normal membrane skeletons, but lack AE1 (band 3) tetramers [37]. A reduced affinity of ankyrin for spectrin occurs when ankyrin is phosphorylated [38]. In all of these situations, PE-rich domains of the inner leaflet of the membrane would serve as anchors, substituting for ankyrin and ensuring the preservation of the mechanical properties of spectrin tetramers in the skeletal lattice. This would also explain why mice with a disrupted AE1 gene expressing no AE1 are characterized by severe spherocytosis despite normal erythrocyte membrane skeletons [39]; in contrast with the above-mentioned cases of ankyrin deficiency, in this case ankyrin possibly inhibits binding of spectrin to membrane lipids.
Baines [40] noted that the N-terminal part of the ankyrin-binding domain is very well conserved among canonical β-spectrins. In this region one could expect >90% identity between the human and bovine β-spectrins which were used in the present study, and similar identity with mouse and Drosophila β-spectrins is observed. In fact, this region is remarkably more conservative than the C-terminal part of this domain that is implied to play an essential role in ankyrin binding. We may hypothesize that lipid binding predated ankyrin binding in evolution, and that the stability of this N-terminal sequence arises from the physiological significance and the sensitivity of this activity to mutational changes.
Acknowledgments
We greatly appreciate Dr J.S. Morrow's generous gift of the β 28 clone, which facilitated this study. We are also indebted to Mr A. Spyra (Institute of Immunology and Experimental Therapy, Polish Academy of Sciences, Wrocław) for his help with plasmon resonance experiments, and to Dr hab. R. Rzepecki (Institute of Biochemistry, University of Wrocław) for providing the His-tagged emerin fragment. This work was supported by the Polish Research Committee (KBN) grant no. 6 P04A 05218, and in part by a Joint Project Grant from the Royal Society.
References
- 1.Sahr K., Laurila P., Kotula L., Scarpa A., Coupal E., Leto T., Linnenbach A., Winkelmann J., Speicher D., Marchesi V., et al. The complete cDNA sequences of human erythroid α-spectrin. J. Biol. Chem. 1990;265:4434–4443. [PubMed] [Google Scholar]
- 2.Winkelmann J., Chang J.-G., Tse W., Scarpa A., Marchesi V., Forget B. Full-length sequence of the cDNA for human erythroid β-spectrin. J. Biol. Chem. 1990;264:11827–11832. [PubMed] [Google Scholar]
- 3.Byers T., Branton D. Visualization of the protein associations in the erythrocyte membrane skeleton. Proc. Natl. Acad. Sci. U.S.A. 1985;82:6153–6157. doi: 10.1073/pnas.82.18.6153. [DOI] [PMC free article] [PubMed] [Google Scholar]
- 4.Hartwig J. Actin-binding proteins: spectrin superfamily. Protein Profile. 1995;2:703–800. [PubMed] [Google Scholar]
- 5.Bennett V., Branton D. Selective associations of spectrin with the cytoplasmic surface of human erythrocyte membranes. Quantitative determination with purified (32P) spectrin. J. Biol. Chem. 1977;252:2753–2763. [PubMed] [Google Scholar]
- 6.Yu J., Goodman S. R. Syndeins: spectrin-binding protein(s) from the human erythrocyte membrane. Proc. Natl. Acad. Sci. U.S.A. 1979;76:2340–2344. doi: 10.1073/pnas.76.5.2340. [DOI] [PMC free article] [PubMed] [Google Scholar]
- 7.Bennett V., Stenbuck P. The membrane attachment protein for spectrin is associated with band 3 in human erythrocyte membrane. Nature (London) 1979;280:468–473. doi: 10.1038/280468a0. [DOI] [PubMed] [Google Scholar]
- 8.Hemming N. J., Anstee D. J., Staricoff M. A., Tanner M. J., Mohandas N. Identification of the membrane attachment sites for protein 4.1 in the human erythrocyte. J. Biol. Chem. 1995;270:5360–5366. doi: 10.1074/jbc.270.10.5360. [DOI] [PubMed] [Google Scholar]
- 9.Mauro-Chanteloup I., Delaunay J., Gane P., Nicolas V., Johansen M., Brown E. J., Peters L. L., Van Kim C. L., Cartron J. P., Colin Y. Evidence that the red cell skeleton protein 4.2 interacts with the Rh membrane complex member CD47. Blood. 2003;101:338–344. doi: 10.1182/blood-2002-04-1285. [DOI] [PubMed] [Google Scholar]
- 10.Nicolas V., Le Van Kim C., Gane P., Birkenmeier C., Cartron J. P., Colin Y., Mauro-Chanteloup I. Rh-RhAG/ankyrin-R, a new interaction site between the membrane bilayer and the red skeleton, is impaired by Rh(null)-associated mutation. J. Biol. Chem. 2003;278:25526–25533. doi: 10.1074/jbc.M302816200. [DOI] [PubMed] [Google Scholar]
- 11.Sweet C., Zull J. E. Interaction of erythrocyte-membrane protein, spectrin with model membrane systems. Biochem. Biophys. Res. Commun. 1970;41:135–141. doi: 10.1016/0006-291x(70)90479-1. [DOI] [PubMed] [Google Scholar]
- 12.Juliano R. L., Kimelberg H. K., Paphadjopoulos D. Synergistic effect of membrane protein, spectrin and Ca2+on Na+permeability of phospholipid vesicles. Biochim. Biophys. Acta. 1971;241:894–905. doi: 10.1016/0005-2736(71)90017-4. [DOI] [PubMed] [Google Scholar]
- 13.Isenberg G., Kenna J. G., Green N. M., Gratzer W. B. Binding of hydrophibic ligands to spectrin. FEBS Lett. 1981;129:109–112. doi: 10.1016/0014-5793(81)80767-3. [DOI] [PubMed] [Google Scholar]
- 14.O'Toole P. J., Morrison I. E., Cherry R. J. Investigations of spectrin-lipid interactions using fluoresceinphosphatidylethanolamine as a membrane probe. Biochim. Biophys. Acta. 2000;1466:39–46. doi: 10.1016/s0005-2736(00)00168-1. [DOI] [PubMed] [Google Scholar]
- 15.Sikorski A. F., Michalak K., Bobrowska M., Kozubek A. Interaction of erythrocyte spectrin with amphipathic compounds. Stud. Biophys. 1987;121:20–26. [Google Scholar]
- 16.Bitbol M., Dempsey C., Watts A., Devaux P. Weak interaction of spectrin with phosphatidylcholine-phosphatidylserine multilayers: a 3H and 31P NMR study. FEBS Lett. 1989;244:217–222. doi: 10.1016/0014-5793(89)81196-2. [DOI] [PubMed] [Google Scholar]
- 17.Sikorski A. F. Interaction of spectrin with hydrophobic agaroses. Acta Biochim. Polon. 1988;35:19–27. [PubMed] [Google Scholar]
- 18.Haest C. W. M. Interactin of spectrin with membrane intrinsic domain. Biochim. Biophys. Acta. 1981;694:331–352. doi: 10.1016/0304-4157(82)90001-6. [DOI] [PubMed] [Google Scholar]
- 19.Białkowska K., Zembroń A., Sikorski A. F. Ankyrin inhibits binding of erythrocyte spectrin to phospholipid vesicles. Biochim. Biophys. Acta. 1994;1191:21–26. doi: 10.1016/0005-2736(94)90228-3. [DOI] [PubMed] [Google Scholar]
- 20.Białkowska K., Leśniewski J., Nietubyć M., Sikorski A. F. Interaction of spectrin with phospholipids is inhibited by isolated erythrocyte ankyrin. Cell. Mol. Biol. Lett. 1999;4:203–218. [Google Scholar]
- 21.Diakowski W., Prychidny A., Swistak M., Nietubyć M., Białkowska K., Szopa J., Sikorski A. F. Brain spectrin (fodrin) interacts with phospholipids as revealed by intrinsic fluorescence quenching and monolayer experiments. Biochem. J. 1999;338:83–90. [PMC free article] [PubMed] [Google Scholar]
- 22.Michalak K., Bobrowska M., Sikorski A. F. Interaction of bovine erythrocyte spectrin with aminophospholipid liposomes. Gen. Physiol. Biophys. 1993;12:163–170. [PubMed] [Google Scholar]
- 23.Hall T. G., Bennett V. Regulatory domains of erythrocyte ankyrin. J. Biol. Chem. 1987;262:10537–10545. [PubMed] [Google Scholar]
- 24.Greenfield N., Fasman G. D. Computed circular dichroism spectra for the evaluation of protein conformation. Biochemistry. 1969;8:4108–4116. doi: 10.1021/bi00838a031. [DOI] [PubMed] [Google Scholar]
- 25.Hope M. J., Bally M. B., Mayer L. D., Janoff A. S., Cullis P. R. Generation of multilamellar and unilamellar phospholipid vesicles. Chem. Phys. Lipids. 1986;40:89–95. [Google Scholar]
- 26.Cooper M. A., Try A. C., Caroll J., Ellar D. J., Williams D. A. Surface plasmon resonance analysis at a supported lipid monolayer. Biochim. Biophys. Acta. 1998;1373:101–111. doi: 10.1016/s0005-2736(98)00091-1. [DOI] [PubMed] [Google Scholar]
- 27.Hubbard J. B., Silin V., Plant A. L. Self assembly driven by a hydrophobic interaction at alkanethiol monolayers: mechanisms of formation of hybrid bilayer. Biophys. Chem. 1998;75:163–176. doi: 10.1016/s0301-4622(98)00199-9. [DOI] [PubMed] [Google Scholar]
- 28.Sefton B. M., Gaffney B. J. Effect of the viral proteins on the fluidity of the membrane lipids in Sindbis Virus. J. Mol. Biol. 1974;90:343–358. doi: 10.1016/0022-2836(74)90378-7. [DOI] [PubMed] [Google Scholar]
- 29.Kennedy S. P., Warren S. L., Forget B. G., Morrow J. S. Ankyrin binds to the 15th repetitive unit of erythroid and non-erythroid beta-spectrin. J. Cell Biol. 1991;115:267–277. doi: 10.1083/jcb.115.1.267. [DOI] [PMC free article] [PubMed] [Google Scholar]
- 30.Dixon M. The determination of enzyme inhibitor constants. Biochem. J. 1953;55:170–171. doi: 10.1042/bj0550170. [DOI] [PMC free article] [PubMed] [Google Scholar]
- 31.An X., Guo X., Sum H., Morrow J., Gratzer W., Mohandas N. Phosphatidylserine binding sites in erythroid spectrin: location and implications for membrane stability. Biochemistry. 2004;43:310–315. doi: 10.1021/bi035653h. [DOI] [PubMed] [Google Scholar]
- 32.Sikorski A. F., Jezierski A. The effect of spectrin on the erythrocyte membrane fluidity. Stud. Biophys. 1987;113:193–201. [Google Scholar]
- 33.Eisenberg D., Schwarz E., Komaromy M., Wall R. Analysis of membrane and surface protein sequences with the hydrophobic moment plot. J. Mol. Biol. 1984;179:125–142. doi: 10.1016/0022-2836(84)90309-7. [DOI] [PubMed] [Google Scholar]
- 34.Sikorski A. F., Bialkowska K. Interactions of spectrins with membrane intrinsic domain. Cell. Mol. Biol. Lett. 1996;1:97–104. [Google Scholar]
- 35.Bodine M., Birkenmeier C. S., Barker J. E. Spectrin-deficient inherited hemolytic anemias in the mouse: characterization by spectrin synthesis and mRNA activity in reticulocytes. Cell. 1984;37:721–728. doi: 10.1016/0092-8674(84)90408-2. [DOI] [PubMed] [Google Scholar]
- 36.Peters L. I., Birkenmeier C. S., Barker J. E. Fetal compensation of the hemolytic anemia in mice homozygous for the normoblastosis (nb) mutation. Blood. 1992;80:2122–2127. [PubMed] [Google Scholar]
- 37.Yi S., Liu S.-C., Derick L. H., Murray J., Barker J. E., Cho M. R., Palek J., Golan D. E. Red cell membranes of ankyrin-deficient mice lack band 3 tetramers but contain normal skeletons. Biochemistry. 1997;36:9596–9604. doi: 10.1021/bi9704966. [DOI] [PubMed] [Google Scholar]
- 38.Lu P., Soong C.-J., Tao M. Phosphorylation of ankyrin decreases its affinity for spectrin tetramer. J. Biol. Chem. 1985;260:14958–14964. [PubMed] [Google Scholar]
- 39.Southgate C. D., Chishti A. H., Mitchell B., Yi S. J., Palek J. Targeted disruption of the murine band 3 gene results in spherocytis and severe hemolytic anemia despite a normal membrane skeleton. Nat. Genet. 1996;14:227–230. doi: 10.1038/ng1096-227. [DOI] [PubMed] [Google Scholar]
- 40.Baines A. J. Comprehensive analysis of all triple helical repeats in β-spectrin reveals patterns of selective evolutionary conservation. Cell. Mol. Biol. Lett. 2003;8:195–214. [PubMed] [Google Scholar]


