

SUMMARY
Neuronal activity is an energy-intensive process that is largely sustained by instantaneous fuel utilization and ATP synthesis. However, how neurons couple ATP synthesis rate to fuel availability is largely unknown. Here, we demonstrate that the metabolic sensor enzyme O-GlcNAc transferase regulates neuronal activity-driven mitochondrial bioenergetics in hippocampal and cortical neurons. We show that neuronal activity upregulates O-GlcNAcylation in mitochondria. Mitochondrial O-GlcNAcylation is promoted by activity-driven glucose consumption, which allows neurons to compensate for high energy expenditure based on fuel availability. To determine the proteins that are responsible for these adjustments, we mapped the mitochondrial O-GlcNAcome of neurons. Finally, we determine that neurons fail to meet activity-driven metabolic demand when O-GlcNAcylation dynamics are prevented. Our findings suggest that O-GlcNAcylation provides a fuel-dependent feedforward control mechanism in neurons to optimize mitochondrial performance based on neuronal activity. This mechanism thereby couples neuronal metabolism to mitochondrial bioenergetics and plays a key role in sustaining energy homeostasis.
Keywords: Neuronal metabolism, O-GlcNAcylation, Glycosylation, Mitochondria, Synaptic activity, ATP synthesis, O-GlcNAc transferase
Graphical Abstract

In brief
Despite their high metabolic demands, neurons rely on ATP synthesis as needed. Yu et. al. demonstrate that O-GlcNAcylation, a post-translational modification responsive to glucose flux, rapidly adjusts to neuronal activity, boosting mitochondrial plasticity and bioenergetics, thus coupling ATP synthesis rates to fuel availability for meeting energy demands.
INTRODUCTION
The brain is the most expensive organ to operate, consuming about 20 percent of the body’s resting metabolic energy mostly via the functions of neurons. In intense periods of neuronal activity, this energy demand increases by several fold and imposes an additional burden on neuronal metabolism 1,2. Because neurons have limited fuel stores, they meet their instantaneous energy needs by relying mainly on activity-driven ATP synthesis 3 , fueled primarily by glucose. To ensure a constant supply of glucose when energy demand is high, there is a tight coupling between neuronal activity and glucose metabolism. Neuronal activity transiently increases glucose flux, which leads to rapid glucose utilization for on-demand ATP synthesis via glycolysis and mitochondrial oxidative phosphorylation (OXPHOS) 3–6. The biochemical pathways of glucose regulation and flux are generally known; however, the molecular mechanisms regulating ATP synthesis based on glucose availability are poorly understood.
In cells, glucose availability is sensed via the metabolic flux-sensitive post-translational modification O-GlcNAcylation. Nutrient sensor enzyme O-GlcNAc transferase (OGT) catalyzes the reversible addition of a single sugar moiety, O-linked N-acetyl glucosamine (O-GlcNAc), onto serine and threonine residues of proteins. The catalytic activity of OGT is regulated by the intracellular uridine-diphosphate-N-acetylglucosamine (UDP-GlcNAc) concentrations, which fluctuate proportionally in response to nutrient flux through the hexosamine biosynthesis pathway (HBP) 7–9. Importantly, the extent of O-GlcNAcylation reflects glucose flux via the HBP pathway. Thus, OGT translates the cellular metabolic state to its >8000 protein substrates via O-GlcNAcylation 9,11. Although O-GlcNAcylation has been shown to fluctuate depending on glucose availability in the brain and participate in the regulation of mitochondrial positioning in neuronal axons 9,12,13, its role in neuronal metabolism and bioenergetics is unknown.
In this work, we hypothesized that O-GlcNAcylation provides glucose flux-dependent feedforward control to optimize mitochondrial performance based on fuel availability, neuronal activity, and energy demand. To test our hypothesis, we used in vivo and in vitro approaches to demonstrate that neuronal activity upregulates O-GlcNAcylation in hippocampal neurons. This upregulation of O-GlcNAcylation serves as a signal for mitochondria to sense glucose-flux rate and accelerate ATP synthesis accordingly. To identify the key mitochondrial proteins that are dynamically modified via OGT, we mapped the neuronal mitochondrial O-GlcNAcome. We found that O-GlcNAcylation regulates mitochondrial plasticity and alters bioenergetics to compensate for the neuronal activity-driven high energy demand. Thus, our study identifies a previously unknown mechanism for the regulation of neuronal energy homeostasis and on-demand ATP synthesis by mitochondrial protein O-glycosylation.
RESULTS
Neuronal activity promotes O-GlcNAcylation in neurons
To first determine if neuronal activity directly upregulates O-GlcNAcylation in neurons in vivo, we asked how O-GlcNAc levels respond to widespread neuronal activation by inducing seizures in mice via the administration of kainic acid (KA), a kainite-type glutamate receptor agonist 14 (Figure 1A). Because KA receptors are particularly abundant in the hippocampus 15, we examined sections of the mouse hippocampus for the cellular locus of O-GlcNAc upregulation in the brain. Somatic O-GlcNAc levels were measured using immunohistochemistry 1 hour after seizure onset (Figure 1A), having visually verified the induction of the seizure 16. We restricted our analysis to the somata of mature neurons by staining for the neuronal marker NeuN 17. We identified recently active neurons, which is key for determining rapid adaptations such as transient post-translational modifications, based on expression of the immediate-early gene c-Fos 18. Using this approach, we found that acute seizures enhanced O-GlcNAcylation in neurons throughout the hippocampus, specifically in CA1, CA3, and the dentate gyrus (DG) hippocampal regions (Figure 1B–F, Figure S1A–D). Consistent with elevated neuronal activity, administration of KA increased the number of c–Fos-positive hippocampal neurons. Across the entire population, the O-GlcNAc levels were also enhanced in response to elevated neuronal activity (Figure 1C–F). Taken together, these findings suggest that neuronal activity upregulates O-GlcNAcylation in vivo, and importantly, this modulation occurs within neurons.
Figure 1. Neuronal activity enhances O-GlcNAcylation in neurons.
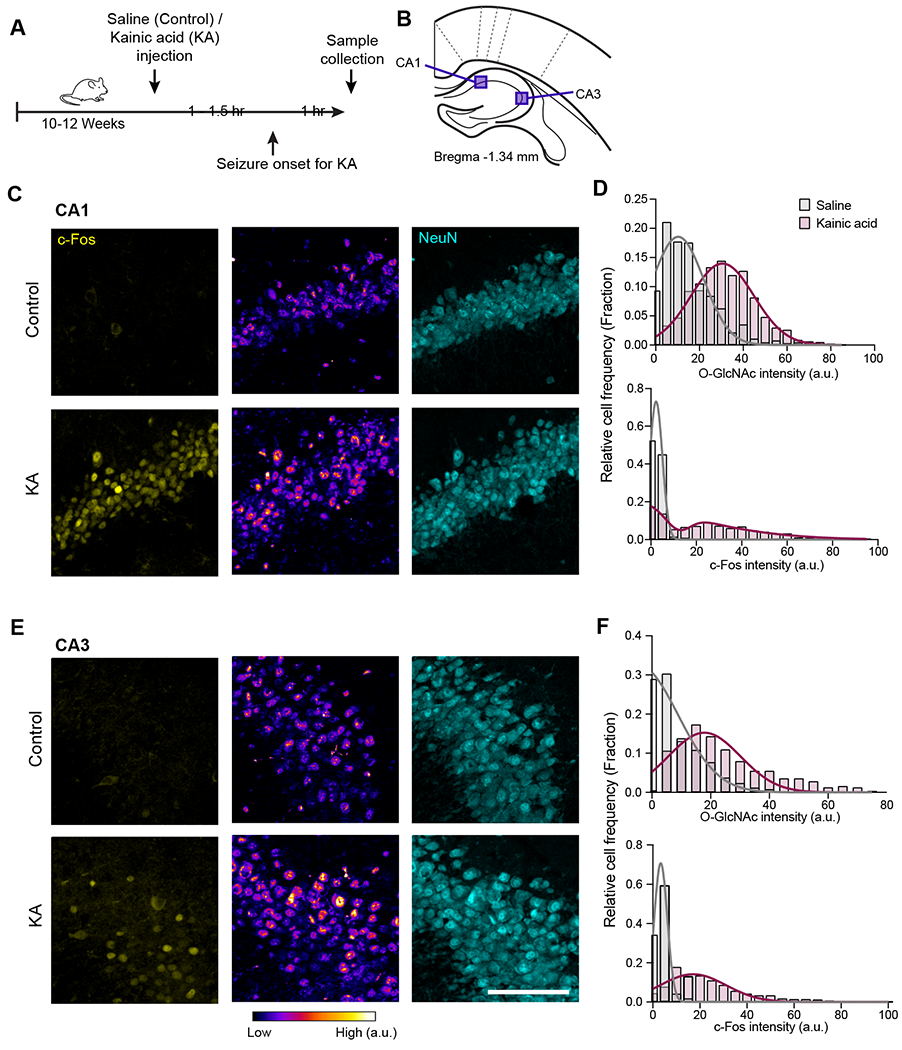
(A) Schematic illustration representing the experimental timeline for intraperitoneal injections of saline or kainic acid, seizure induction, and sample collection. (B) O-GlcNAc and c-Fos fluorescence intensities were analyzed in the indicated hippocampal areas (CA1 and CA3) from brain sections ranging from Bregma −1.22 mm to −1.45 mm. (C-F) Quantification and representative images of CA1 (C) and CA3 (E) hippocampal regions after saline (Control) or kainic acid (KA) injections and immunohistochemical staining with antibodies against c-Fos (yellow), O-GlcNAc (RL2, fire LUT), and NeuN (cyan). The distribution of c-Fos and O-GlcNAc intensities from NeuN-positive neurons were plotted for CA1 (D) and CA3 (F) hippocampal regions from saline (grey) and KA injected (magenta) brains. For each condition n = 655-811 neurons in CA1 and 508-566 neurons in CA3, 3 mice (Scale bars = 100 μm). See also Figure S1.
O-GlcNAcylation in neuronal processes is regulated by neuronal excitation
To further characterize the neuronal activity-driven regulation of O-GlcNAcylation at the subcellular level, we carried out immunocytochemistry analysis in dissociated rat hippocampal neurons. First, we examined O-GlcNAcylation levels in morphologically mature neurons at 14 days in vitro (DIV) exhibiting spontaneous electrical activity 19–21. Immunostaining neurons for O-GlcNAc at 14 DIV indicated that the dynamic cycling of neuronal O-GlcNAcylation in the soma as well as in dendrites and axons is mediated by the activity of OGT and O-GlcNAcase (OGA). Blocking these enzymes overnight resulted in significant alterations to neuronal O-GlcNAcylation patterns (Figure S2). Next, we elevated neuronal activity for 6 hours by blocking inhibitory synaptic transmission with the GABAA receptor antagonist picrotoxin (PTX) (Figure 2A–C). Prolonged enhancement of neuronal activity led to a ~2-fold increase in O-GlcNAcylation within neuronal somas, axons, and dendrites (Figure 2A–G). Importantly, we could reverse this upregulation of activity-driven O-GlcNAc modification using a pharmacological blockade of excitatory synaptic transmission via the selective AMPA receptor antagonist NBQX 22 (Figure 2A–G). Thus, our findings demonstrate that an increase in excitatory synaptic transmission promotes O-GlcNAcylation in neuronal processes.
Figure 2. Neuronal excitation promotes O-GlcNAcylation in dendrites and axons.
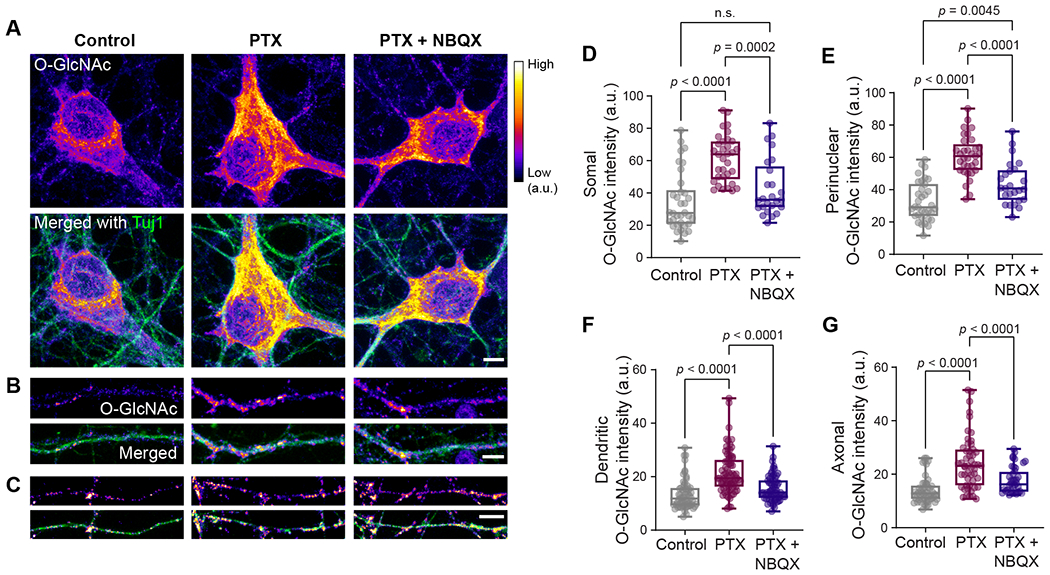
(A-C) Representative images of cortical neuron soma (A), dendrite (B), and axon (C) after 6 hours of DMSO (vehicle control), PTX or PTX+NBQX treatments and immunocytochemical staining with antibodies against βIII Tubulin (Tuj1) (green) and O-GlcNAc (RL2, fire LUT). (D-G) Quantification of O-GlcNAc intensities from somal (D), perinuclear (E), dendritic (F), and axonal (G) regions of cortical neurons after indicated treatments. n = 25-34 neuronal soma, 58-73 dendrites, 36-50 axons from three independent experiments. Data are shown as a Min-Max Box-whisker plot with associated p-values (n.s.= p>0.05) (one-way ANOVA with post hoc Tukey’s multiple comparison test. Scale bars = 5 μm). See also Figure S2.
Neuronal activity-driven O-GlcNAcylation targets mitochondria and regulates mitochondrial bioenergetics
We next aimed to determine the intracellular localization of O-GlcNAcylated proteins in neurons, with a specific focus on mitochondria. O-GlcNAcylation has been shown to immobilize mitochondria in neurons within glucose-enriched areas to maximize their fuel utilization 9,13,23. We hypothesized that O-GlcNAcylation regulates mitochondrial function to support the increased energy demands of neurons. Therefore, we examined the subcellular localization of O-GlcNAc in neuronal processes together with the pan-mitochondrial marker protein Tomm20 (Figure 3A–B) by performing colocalization analyses. When neuronal activity was elevated for 6 hours by PTX treatment, the colocalization of O-GlcNAc with mitochondria also increased in dendritic and axonal processes. This colocalization was reversed when excitatory synaptic transmission was blocked by NBQX treatment (Figure 3A–D, and Figure S3A–B). We also confirmed that the observed overlap of O-GlcNAc and Tomm20 staining reflected a real colocalization, rather than a random coincidence, using Costes’ approach to generate scrambled images and perform statistical significance analysis 24,25. A p-value greater than 95% (0.9858 ± 0.0317) for PTX-treated neurons confirmed that the observed colocalization was statistically significant and not due to random occurrence (Figure S3B). To further evaluate mitochondrial O-GlcNAc levels, we isolated crude mitochondrial and cytosolic fractions from cultured cortical neurons and analyzed them by immunoblotting. In these samples, PTX treatment predominantly increased O-GlcNAcylation of mitochondrial proteins compared to cytosolic proteins (Figure 3E–G). The increase in mitochondrial O-GlcNAcylation was not due to alterations of endogenous OGT or OGA protein levels (Figure S3C). Blocking neuronal activity with an inhibitor cocktail treatment containing NBQX, the N-methyl-D-aspartate receptor antagonist, 2-amino-5-phosphonopentanoic acid AP5, and voltage-gated sodium channel blocker tetrodotoxin (TTX), resulted in decreased mitochondrial protein O-GlcNAcylation level (Figure S3D–F). However, some mitochondrial proteins remained O-GlcNAc modified, even under network activity inhibition conditions, suggesting that the function of housekeeping mitochondrial proteins may also be regulated via O-GlcNAcylation. This was further evidenced by the amplification of the signal following overnight treatment with OGA inhibitor Thiamet-G. The transient inhibition of OGT activity reduced O-GlcNAcylation in neurons (Figure S3G), which further supports the dynamic nature of O-GlcNAc modification, and specificity of O-GlcNAc antibody for biochemical assays.
Figure 3. Neuronal activity-driven O-GlcNAcylation regulates mitochondria.
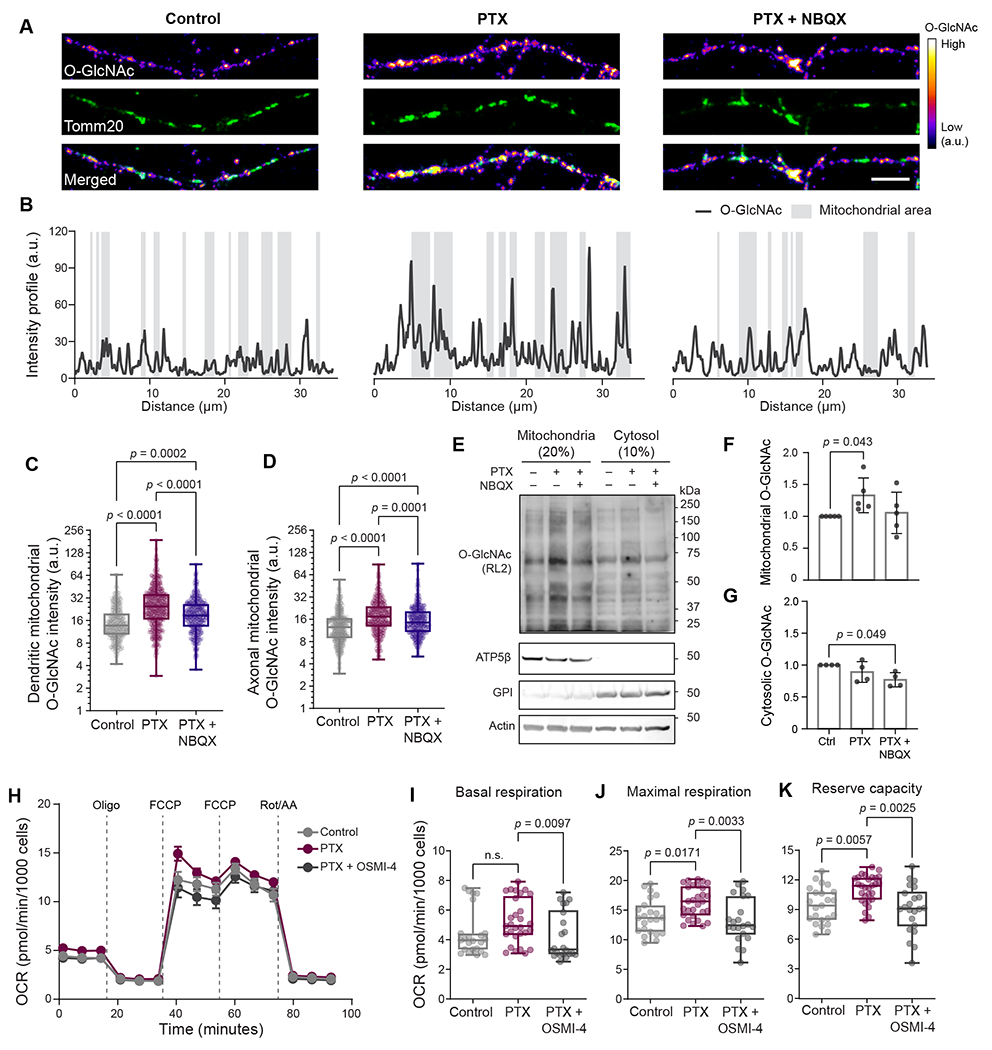
(A) Representative images of neuronal processes after 6 hours of DMSO (vehicle control), PTX or PTX+NBQX treatments and immunocytochemical staining with antibodies against Anti- Tomm20 (green) to label mitochondria and anti-O-GlcNAc (RL2, fire LUT). Scale bar = 5 μm. (B) Fluorescence intensity of O-GlcNAc measured along the length of neuronal processes shown in (A). The gray shaded areas represent regions along the neuronal processes that are stained with Tomm20, indicative of mitochondrial areas. (C-D) The total intensity of O-GlcNAc immunofluorescence at the dendritic and axonal mitochondrial compartments after indicated treatments. n = 1000-1281 mitochondria analyzed for each group from three independent experiments. Data are shown as a Min-Max Box-whisker plot with associated p-values (one-way ANOVA with post hoc Tukey’s multiple comparison test). (E-G) Mitochondrial and cytoplasmic protein O-GlcNAcylation level changes. Mitochondrial and cytosolic fractions, obtained from cortical neurons treated with DMSO (vehicle control), PTX, or PTX+NBQX treatments for 6 hours, were separated by SDS gel electrophoresis and probed with anti-O-GlcNAc antibodies (RL2), anti- ATP5β (mitochondrial marker), anti-GPI and anti-actin (cytosolic markers) antibodies. The total intensity of the O-GlcNAc immunoreactive bands was normalized to the intensity of ATP5β (F) or actin (G) bands for each lane. O-GlcNAc levels in control cells were set as 1, and fold changes in response to indicated treatments were calculated. n = 4-5 independent experiments. Data are shown as mean values ± SEM with associated p-values (one-way ANOVA with post hoc Kruskal-Wallis multiple comparison test). (H) Mitochondrial oxygen consumption rate (OCR) measured from primary cortical neuron cultures using the “mito stress test” protocol after treatments with DMSO (vehicle control), PTX, or PTX+OSMI-4 for 6 hours. (I-K) Basal (OCRbasal) and maximal respiration (OCRFCCP) and reserve capacity (OCRFCCP - OCRbasal) for indicated treatments. Mean ± SEM for each time point, n= 24-32 wells per condition from three independent experiments. Data are shown as a Min-Max Box-whisker plot with associated p-values (n.s.= p>0.05) (one-way ANOVA with post hoc Tukey’s multiple comparison test). See also Figure S3.
Because neuronal activity regulates mitochondrial O-GlcNAcylation, we next assessed the impact of O-GlcNAcylation on neuronal bioenergetics. To measure mitochondrial respiratory activity and the glycolytic rate, we cultured primary cortical neurons under physiological glucose levels and performed a respirometry analysis at 12–15 DIV, when the neuronal networks exhibit spontaneous electrical activity (Figure S3H). After each respirometry measurement, we quantified neuronal enrichment in primary neuronal cultures, and differentiated neurons from the glial cells, by co-staining each well with the mature neuron marker NeuN and the nuclear dye NucBlue (Figure S3I). This staining revealed that neurons represent 60–80% of the cellular population in our cultures (Figure S3I–J). We did not observe a change in mitochondrial respiration that would drive basal mitochondrial ATP synthesis. Next, to examine the maximal respiratory capacity of mitochondria, we stimulated uncoupled respiration using carbonyl cyanide-4-(trifluoromethoxy)phenylhydrazone (FCCP) and found that neuronal activity increases mitochondrial respiratory capacity (Figure 3H–K). Elevating the neuronal activity with PTX in the presence of the OGT inhibitor OSMI-4 (Figure S3H) reduced both the basal and maximal mitochondrial respiratory capacity (Figure 3I–K). OSMI-4-treated neurons also displayed a reduced glycolytic capacity (Figure S3K–M). These results confirm the involvement of OGT and mitochondrial O-GlcNAcylation in neural activity-driven metabolic flexibility.
Acute neuronal stimulation triggers glycolysis and mitochondrial O-GlcNAcylation
We next sought to establish the extent to which neuronal activity-dependent glucose metabolism might contribute to mitochondrial O-GlcNAcylation. To monitor the metabolic changes that occur following neuronal activity, we measured fructose 1,6-bisphosphate (FBP) levels in neuronal processes using HYlight, a fluorescent sensor that reports glycolytic dynamics 26 (Figure 4A). Because neuronal activity causes transient dips in intracellular glucose levels and also transiently increases neuronal glycolysis 4, we predicted that FBP levels would decrease as neuronal activity increases. Instead, measurements from neuronal processes revealed that even persistent action potential (AP) firing (10Hz, 600 AP) produced only small changes in cytosolic FBP levels. As a control, we confirmed that our stimuli induce neuronal activity using the Ca2+ sensor GCaMP6s (Figure S4A–B). Therefore, either neuronal activity does not significantly alter glycolysis or increases in demand are accompanied by activity-driven glycolytic flux. When the production of FBP was blocked by exchanging glucose for 2-deoxyglucose (2DG), the FBP levels slowly declined (τ = 3.007 min, Figure 4B–D, S4C). Neuronal stimulation under these conditions caused a more rapid decay in FBP levels (τ = 1.007 min), which implies that neuronal activity causes a further increase in FBP consumption.
Figure 4. Glycolysis and O-GlcNAcylation rise upon neuronal stimulation.
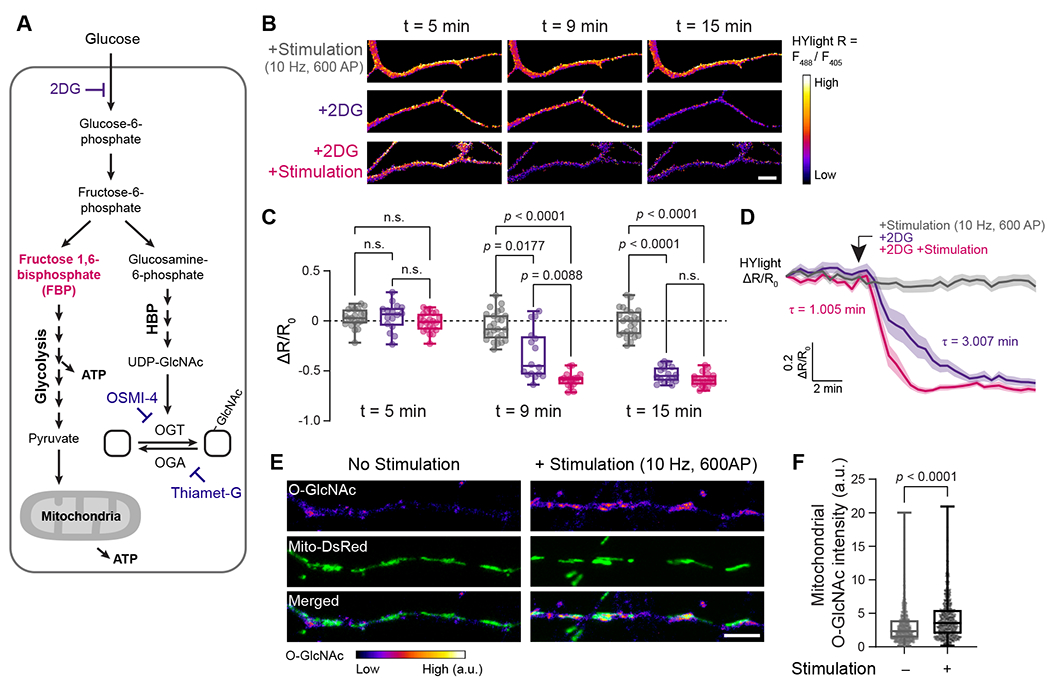
(A) Schematic representation of cellular glucose utilization pathways: glycolysis and hexosamine biosynthesis pathway (HBP). Genetically encoded sensor HYlight measures fructose1,6-bisphosphate (FBP) (magenta), the product of the committed step of glycolysis. Rate limiting steps and the inhibitors used in this study are also indicated: glycolysis inhibitor 2-deoxyglucose (2DG), O-GlcNAc transferase (OGT) inhibitor OSMI-4, O-GlcNAcase (OGA) inhibitor Thiamet-G. (B) Representative ratiometric HYlight (fire LUT) images from neuronal processes, before (t= 5 min), and after (t= 9 and 15 min) field stimulation (10Hz, 600AP) either with or without 2DG treatments. (C-D) The normalized HYlight emission ratio (R) induced by 488nm and 405nm excitations (ΔR/R0) at indicated time points, obtained from cortical neuron traces demonstrated as in (D) (gray: control with field stimulation; purple: only 2DG treatment; magenta: 2DG treatment with field stimulation). The arrowhead indicates the initiation time point of 2DG treatment and/or field stimulation (10Hz, 600AP). Data are shown as mean values ± SEM (D) and a Min-Max Box-whisker plot (C) with associated p-values (one-way ANOVA with post hoc Tukey’s multiple comparison test), n = 7-11 neurons from three independent experiments. Scale bar =10 μm. (E-F) Cortical neurons expressing MitoDsRed (green) to label mitochondria (as well as GCaMP6s to measure neuronal activity, see Figure S4) fixed and immunostained with anti-O-GlcNAc (RL2, fire LUT) antibody immediately after the field stimulation (10Hz, 600AP) or under baseline conditions. (F) The total intensity of O-GlcNAc immunofluorescence from dendritic and axonal mitochondrial compartments quantified from non-stimulated or stimulated neurons. Data are shown as a Min-Max Box-whisker plot with associated p-values (n.s.= p>0.05) (Mann-Whitney U test), n = 646-801 mitochondria from 17-21 neurons from three independent experiments. Scale bar = 5 μm. See also Figure S4.
Given that OGT activity is regulated by glucose flux and the availability of its substrate UDP-GlcNAc (Figure 4A) 9, we hypothesized that mitochondrial O-GlcNAcylation is regulated by activity-dependent glucose metabolism. We, therefore, examined O-GlcNAcylation in neurons expressing the mitochondrial marker Mito-DsRed immediately following acute neuronal stimulation. Colocalization analysis revealed enhanced mitochondrial O-GlcNAcylation in neuronal processes after the induction of neuronal activity (10Hz, 600 AP) (Figure 4E–F). Because O-GlcNAcylation is a dynamic post-translational modification, we blocked the removal of O-GlcNAc from proteins throughout the electrical stimulation by inhibiting the O–GlcNAc-removing enzyme using Thiamet-G (Figure S4D). This acute inhibition of OGA increased the accumulation of mitochondrial O-GlcNAcylation during baseline neuronal activity (Figure S4D–E), and this accumulation became more prominent upon neuronal stimulation. These results indicate that mitochondrial O-GlcNAcylation is a dynamic process in neurons that is rapidly promoted by neuronal activity and activity-dependent glucose metabolism.
O-GlcNAcylation regulates mitochondrial respiration in neurons
We next assessed how O-GlcNAcylation regulates mitochondrial bioenergetics in neurons. We blocked the removal of O-GlcNAcylation by treating neuronal cultures with the OGA inhibitor Thiamet-G overnight and verified that this treatment increased O-GlcNAcylation (Figure S5A). Then, we evaluated mitochondrial activity by double-labeling neurons with the mitochondrial membrane potential (Δψm)-sensitive fluorescent dye tetramethylrhodamine methyl ester (TMRM) and the Δψm-insensitive mitochondrial probe MitoTracker Green (MT Green) as a control. At subquenching concentrations, TMRM rapidly equilibrates in mitochondria and reflects Δψm. Thiamet-G treatment increased Δψm, which is quantified as the ratio between the intensities of TMRM and MT Green (Figure 5A–B). To evaluate mitochondrial respiratory capacity, we measured the mitochondrial oxygen consumption rate in control and Thiamet-G-treated neurons. As shown with neuronal activity (Figure 3H–K), changes in mitochondrial respiration did not seem to drive basal mitochondrial ATP synthesis, though the maximal respiratory capacity was enhanced in Thiamet-G-treated neurons (Figure 5C–E). We confirmed that the mitochondrial activity boost was not due to mitochondrial biogenesis, as Thiamet-G-treated neuronal mitochondrial protein levels remained constant (Figure S5A–B). To determine whether the O-GlcNAcylation-dependent enhancement of reserve respiratory capacity was specifically due to mitochondrial function, we substituted glucose with the direct mitochondrial fuel, methyl pyruvate, and enhanced O-GlcNAcylation using Thiamet-G and glucosamine treatments (Figure S5C) 9. In conditions of elevated O-GlcNAcylation, the mitochondrial fuel supply was sufficient to enhance reserve respiratory capacity (Figure S5D–E). Thus, our results suggest that O-GlcNAcylation plays an important role in regulating Δψm and promotes mitochondrial respiratory capacity in neurons.
Figure 5. O-GlcNAcylation enhances mitochondrial activity.
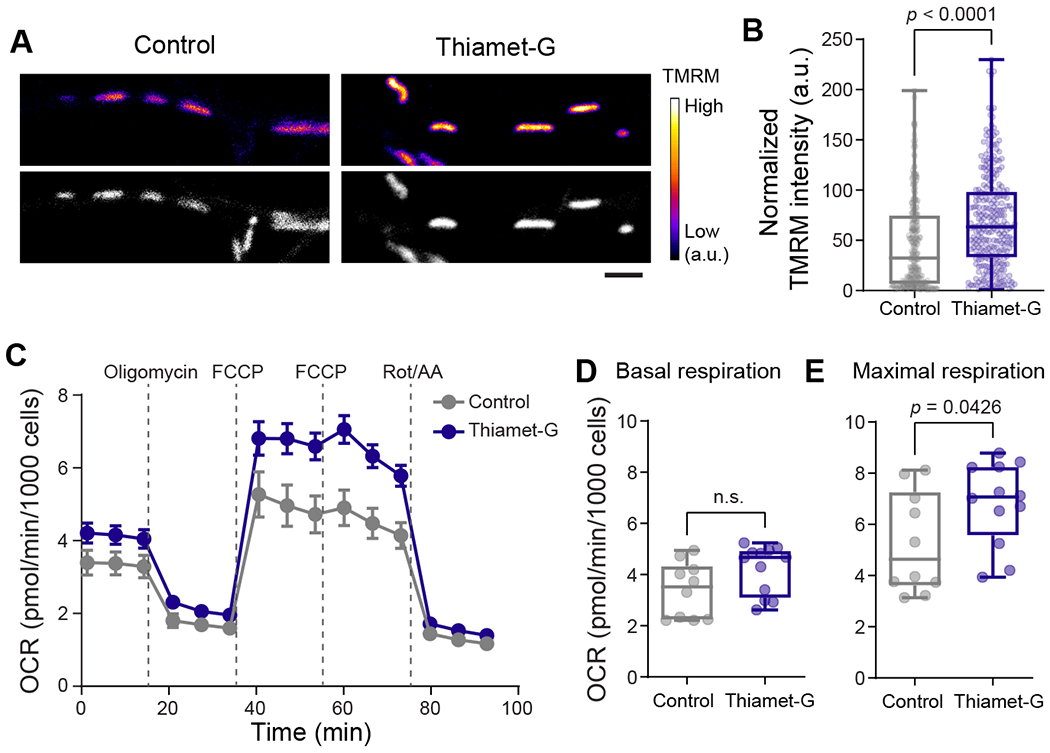
(A) Representative images demonstrating co-labeling of total mitochondria with MitoTracker (MT) Green (gray) and mitochondrial membrane potential with TMRM (fire LUT). (B) Mitochondrial membrane potential changes are represented as “Normalized TMRM intensity” by calculating the ratio of TMRM and MT Green intensities for each mitochondrion from neuronal processes. n= 268-281 mitochondria, four independent experiments. Data are shown as a Min-Max Box-whisker plot with associated p-values (Mann-Whitney U test). Scale bar = 2 μm. (C) Mitochondrial oxygen consumption rate (OCR) was measured from cortical neuron cultures using the “mito stress test” protocol after overnight treatments with DMSO (vehicle control) or Thiamet-G. (D-E) Basal (OCRbasal) and maximal respiration (OCRFCCP) for indicated treatments. n= 10-12 wells per condition from three independent experiments. Data are shown as a Min-Max Box-whisker plot with associated p-values (n.s.= p>0.05) (Mann-Whitney U test). See also Figure S5.
Mitochondrial O-GlcNAcome reveals adaptive bioenergetic mechanisms
Only a fraction of O-GlcNAcylated proteins undergo dynamic and reversible modification 27. To specifically identify the mitochondrial proteins that are O-GlcNAc modification when maximal respiratory capacity is enhanced (Figure 5), we developed a workflow for the comparative O-GlcNAcome profiling of neuronal mitochondria via quantitative mass spectrometry analysis. The mitochondria were purified from primary neuron cultures treated with Thiamet-G or vehicle control. We prepared crude-mitochondrial fractions, as opposed to ultra-pure mitochondria, and minimized the sample preparation steps/duration to preserve the chemically labile O-GlcNAc modification. We then treated mitochondrial lysate with succinylated wheat germ agglutinin (sWGA) agarose beads to selectively enrich for O-GlcNAcylated proteins (Figure 6A). We confirmed the binding specificity of O-GlcNAc-modified proteins to these beads using negative controls in the presence of free GlcNAc (Figure 6B). sWGA-bound fractions obtained from Thiamet-G-treated neurons displayed a higher level of O-GlcNAcylated proteins, confirming our approach to capture the mitochondrial proteins that undergo dynamic O-GlcNAcylation (Figure 6A–B).
Figure 6. Mitochondrial O-GlcNAcome reveals mitochondrial plasticity mechanisms.
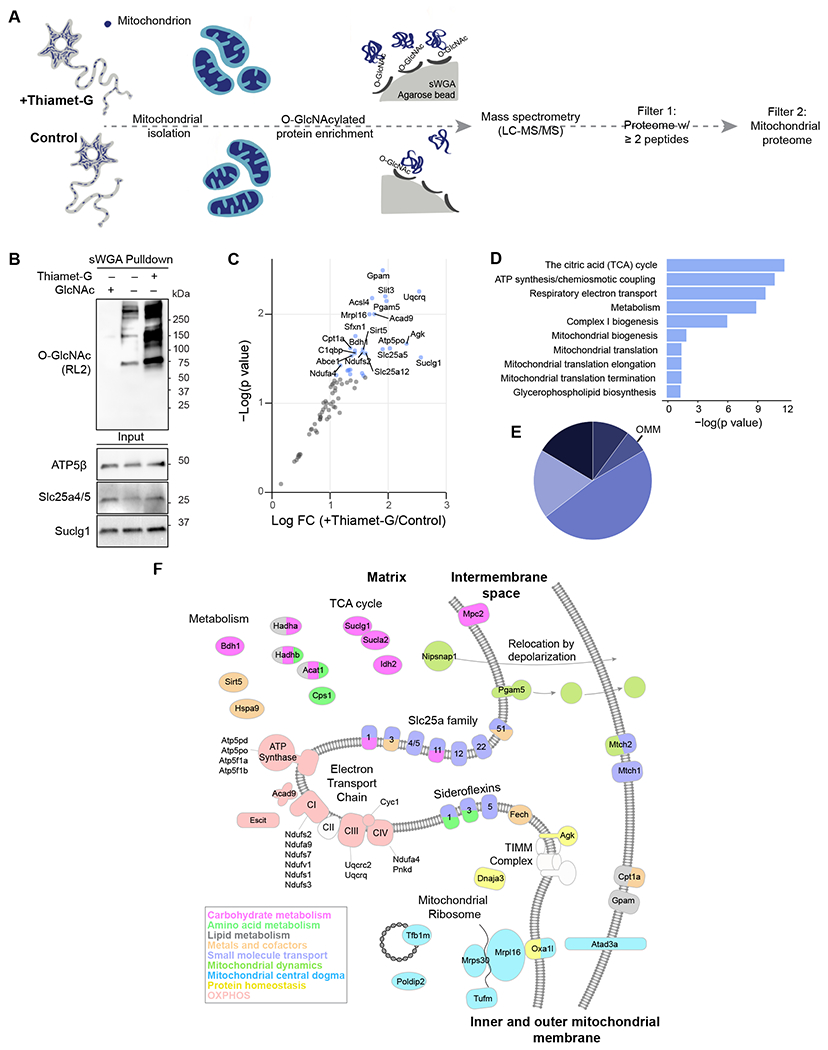
(A) Schematic outline of mass spectrometry sample preparation and analysis strategy. Cortical neurons at 12-15 DIV were treated with DMSO (vehicle control) or Thiamet-G overnight to capture dynamic O-GlcNAc modification. O-GlcNAc-modified proteins were enriched from crude mitochondrial fractions using succinylated wheat germ agglutinin (sWGA) beads. Label-free quantitative mass spectrometry (LC-MS/MS) data was further analyzed to select proteins with ≥ 2 peptides (Filter 1) and to identify mitochondrial proteins based on MitoCarta 3.0 and Mitominer databases (Filter 2). (B) Changes in the total sWGA-bound protein O-GlcNAcylation levels were evaluated by SDS gel electrophoresis and probed with anti-O-GlcNAc antibody (RL2). Crude mitochondrial fractions isolated from cortical neurons at 12-15 DIV were treated with DMSO (vehicle control) or Thiamet-G overnight to augment O-GlcNAc modification. O-GlcNAc modified proteins were enriched from crude mitochondrial fractions using sWGA beads, with free GlcNAc used as a control to validate the specificity of sWGA binding. Mitochondrial fractions (Input) were analyzed by SDS gel electrophoresis and probed with anti-ATP5β, anti-Slc25a4/5 and anti-Suclg1 antibodies. (C) Scatter plot analysis demonstrating the impact of Thiamet-G treatment on O-GlcNAcylated mitochondrial proteins. Annotated proteins (blue dots) represent p<0.05 (FC, fold change). (D) Pathway enrichment analysis, and (E) sub-mitochondrial localization of identified mitochondrial proteins. (F) Illustration of mitochondrial O-GlcNAcome, colored by MitoPathway assignments from MitoCarta3.0. n=3 biological replicates. See also Figure S5, Table S1 and S2.
To maximize the stringency in our subsequent mass spectrometry analysis, we selected proteins with ≥ 2 unique peptides 28 in all experimental replicates from Thiamet-G or vehicle-treated samples. Using these selection criteria, we identified a total of 770 proteins (Table S1 and S2), 80 of which (~10%) had confirmed mitochondrial localization based on the Mitominer and Mitocarta databases 29,30. To assess mitochondrial protein abundance, we performed a proteomics analysis of total mitochondrial proteins. Mitochondria were isolated from primary neuronal cultures treated with Thiamet-G or vehicle as a control (Figure 6A). The proteomics data revealed that the abundance of mitochondrial proteins in neurons exposed to Thiamet-G did not differ significantly from the control (Figure S6A). Additionally, we investigated whether the detection of O-GlcNAcylated mitochondrial proteins was influenced by their abundance. Our analyses confirmed the identification of O-GlcNAcylated mitochondrial proteins was not merely due to their abundance (Figure S6B). According to the O-GlcNAcome catalog 31, 142 of these proteins were previously identified to be O-GlcNAc modified (Figure S6C). The non-mitochondrial proteins were mostly localized in the cytosol (23.3%), plasma membrane (10.9%), or endoplasmic reticulum (ER) (10.8%) (Figure S6D–F), which was expected given the use of crude mitochondrial fractions. As predicted, treatment with Thiamet-G significantly increased the O-GlcNAcylation of mitochondrial proteins in neurons (Figure 6B–C).
We next analyzed the sub-mitochondrial localization of O-GlcNAcylated mitochondrial proteins (Figure 6C–E), finding that the majority were associated with the inner mitochondrial membrane (IMM) (48.1%) and matrix (19%), with only a minor proportion coming from the outer mitochondrial membrane (OMM) (Figure 6D). This further confirmed the involvement of this post-translational modification in regulating mitochondrial bioenergetics. Finally, we examined the specific mitochondrial functions regulated by O–GlcNAc-modified proteins using a protein-protein interaction network and pathway enrichment analyses. The top hits here were proteins involved in the tricarboxylic acid (TCA) cycle, ATP synthesis, electron transport chain function, and metabolite transport (Figure 6B–F, S6G and Table S1–2). Thus, O-GlcNAc modification of mitochondrial proteins may support metabolic plasticity in neurons by coordinating multiple pathways involved in energy metabolism.
O-GlcNAc transferase supports on-demand ATP synthesis
Because the majority of O-GlcNAcylated mitochondrial proteins enriched in our proteomics data (Figure 6C–F) are involved in pathways supporting ATP synthesis, we hypothesized that O-GlcNAcylation is involved in neuronal activity-driven on-demand ATP synthesis. To test our hypothesis, we expressed the cytoplasmic ATP sensor iATPSnFR1.0-mRuby in neurons and triggered AP firing at 10 Hz, 600 AP (or 10 Hz, 100AP in Figure S7C). These neurons were treated with the vehicle control or OGT inhibitor OSMI-4 (Figure 7A–B and S7A–C). Measurements from neuronal processes in control cells revealed that a burst of electrical activity resulted in only a small decrease in ATP levels during the post-stimulus period, which was followed by an immediate recovery (Figure 7A–C). On the contrary in OSMI-4-treated neurons, ATP levels never recovered and instead decreased by ~30% from the baseline at 10 min post-stimulation (Figure 7B). When both glycolytic and mitochondrial (2DG + Oligo) ATP synthesis pathways were blocked during electrical stimulation, the ATP level decreased by >60% in neurons. To assess whether reducing endogenous OGT levels also alters on-demand ATP synthesis, we depleted OGT transiently from neurons with a short hairpin RNA (shRNA) (OGT shRNA) (Figure 7D–E). The efficiency and specificity of OGT knock-down were confirmed biochemically in Neuro-2a neuronal cell line (Figure S7D). OGT depletion (OGT shRNA) also caused a decrease in ATP levels by ~30% from the baseline at 10 min post-stimulation. This reduction was suppressed by the coexpression of shRNA-resistant long isoform ncOGT (OGT shRNA + OGT shRNA resistant). Overexpression of ncOGT (OGT shRNA resistant) further improved the ATP synthesis rate (Figure 7D–E). By imaging intracellular Ca2+ with GCaMP6s before and after neuronal stimulation, we confirmed that the application of OSMI-4 (or OGA inhibitor Thiamet-G) to prevent the addition of O-GlcNAc did not alter activity-dependent calcium dynamics (Figure S7E–H). However, inhibition of OGT activity with OSMI-4 for 30 minutes reduced overall neuronal network level activity (Figure S7I–K). These results, combined with the observation that neuronal activity enhances glucose metabolism as well as mitochondrial O-GlcNAcylation (Figure 4), imply that OGT activity is required for the upregulation of neuronal bioenergetics on demand.
Figure 7. O-GlcNAc transferase supports on-demand ATP synthesis.
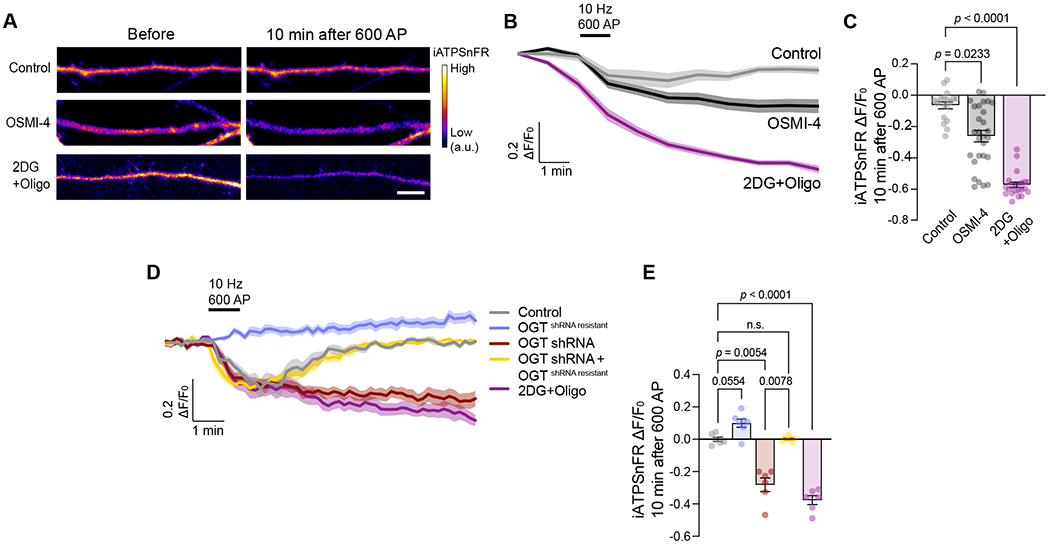
(A) Representative images of neuronal processes expressing ATP sensor, iATPSnFR, before and 10 minutes following indicated pharmacological treatments and field stimulation (10 Hz, 600AP) (OGT inhibitor OSMI-4, and 2DG and Oligomycin (Oligo)). Scale bar = 5 μm. (B) Average fluorescence traces of iATPSnFR, with indicated pharmacological treatments and field stimulation (10 Hz, 600AP) (gray: control; black: OGT inhibitor OSMI-4; magenta: 2DG and Oligo). Data are shown as mean values ± SEM. (C) Quantification of ATP depletion (iATPSnFR ΔF/F0) from neuronal processes at 10 minutes post-stimulation (t = 12 min) for each condition. Data are shown as mean values ± SEM with associated p-values (one-way ANOVA with post hoc Kruskal-Wallis multiple comparison test), n = 14-24 neuronal processes, 4-8 cells, and three independent experiments. (D) Average iATPSnFR fluorescence traces from neuronal axons with indicated pharmacological treatments, genetic manipulations, and field stimulation (10 Hz, 600AP) (gray: control; magenta: 2DG and Oligomycin; blue: ncOGT overexpression (OGTshRNA resistant); red: OGT knockdown with shRNA (OGTshRNA); yellow: OGT knockdown with shRNA (OGTshRNA) and rescue with ncOGT (OGTshRNA resistant). (E) Quantification of ATP depletion (iATPSnFR ΔF/F0) from neuronal processes at 10 minutes post-stimulation (t = 12 min) for each condition. Data are shown as mean values ± SEM with associated p-values (one-way ANOVA with post hoc Kruskal-Wallis multiple comparison test), n = 6-7 neuronal axons, 6-7 neurons from four independent experiments.
DISCUSSION
Metabolic flux-sensitive post-translational modification, O-GlcNAcylation, uniquely couples fuel availability to cellular metabolism and signaling pathways 32. Here, we demonstrate how O-GlcNAc modification magnifies the functional diversity of mitochondrial proteins and functions in neurons. We have now established that (1) neuronal activity drives glucose consumption and consequently dynamic O-GlcNAcylation in neuronal processes; (2) especially mitochondria are the loci of O-GlcNAc modification; (3) post-translational modification of mitochondrial proteins via OGT enhances mitochondrial respiratory capacity in neurons; and (4) mitochondrial O-GlcNAcome and O-GlcNAc cycling supports neuronal activity-driven on-demand ATP synthesis and energy homeostasis.
O-GlcNAcylation level in neurons correlated well with neuronal activity, when the activity was driven by chronic pharmacological manipulations in vivo (Figure 1) and in vitro (Figure 2) or by acute electrical stimulation (Figure 4). O-GlcNAcylation is highly enriched in the central nervous system33,34 and essential for brain function 27,35–37. While previous biochemical studies indicated that neuronal activity enhances O-GlcNAcylation in the brain 27, whether non-neuronal cells or neurons are the primary target of this post-translational modification was ambiguous. By using immunofluorescence staining and cellular analysis, we established that neurons, specifically neuronal processes and mitochondria are the loci of this modification. OGT expression and O-GlcNAcylation are developmentally regulated in neurons 35,37,38. O-GlcNAcylation plays a critical role in the nervous system function. Studies have demonstrated that the excitatory synaptic mechanisms, such as AMPA receptor-dependent synaptic plasticity, rely on O-GlcNAc cycling. Although there are some contradictions regarding the precise timings and mechanisms of this regulation, there is broad agreement that O-GlcNAc plays a significant role in modulating synaptic dynamics 36,39–41. We demonstrated that in mature neurons, O-GlcNAcylation was enriched in neuronal processes (Figure S2 and 2). An increase in axonal and dendritic O-GlcNAcylation also coincides with enhanced energy demand, synaptogenesis, and metabolic shift from glycolysis to OXPHOS 42,43. This supports the critical role of O-GlcNAcylation in sustaining metabolic homeostasis by coupling enhanced energy demand and associated fuel consumption in neuronal processes.
Glucose is the major fuel source of the neurons. In response to increased energy demand, neuronal glucose consumption and glycolysis can be upregulated 4–6. Long-term increase in glucose flux (1-2 hours), also leads to increased O-GlcNAcylation in neurons 9. However, we show that mitochondrial O-GlcNAcylation is rapidly upregulated within minutes upon activity-driven glucose utilization (Figure 4). Neuronal glucose flux has been shown to immobilize mitochondria at high-glucose areas by increasing the O-GlcNAc modification of motor-adaptor protein Milton and anchoring mitochondria to actin cytoskeleton 9,13. We find that global enhancement of O-GlcNAcylation by the pharmacologically inhibition of OGA, a manipulation that arrests mitochondrial motility 9,13, also enhances mitochondrial O-GlcNAcylation and promotes mitochondrial respiratory capacity in neurons. Co-regulation of mitochondrial localization and activity in fuel-rich areas allows neuronal mitochondria to rapidly adapt to local metabolic demand to sustain neuronal energy homeostasis. We specifically investigated which mitochondrial proteins are dynamically regulated via O-GlcNAcylation and identified proteins involved in ATP synthesis that include electron transport chain subunits, ADP phosphate carriers, and malate-aspartate shuttle subunits (Figure 6). Because we worked with crude mitochondrial fractions, our O-GlcNAcome data uncovered other neuronal proteins including pre-synaptic proteins, endolysosomal membrane proteins, and cytoskeletal components (Figure S6). Furthermore, immunostaining with O-GlcNAc-specific antibodies revealed the existence of additional non-mitochondrial puncta, potentially implicating the involvement of other subcellular compartments, notably in response to long-term neuronal activity manipulations (Figure 3A). Although O-GlcNAcylation’s influence on early secretory pathway proteins is well-documented 44–47, its specific functions within neurons have yet to be explored. These results may suggest that neuronal activity-driven O-GlcNAcylation may be a potential way to coordinate functions across multiple organelles based on fuel availability in neurons.
The origin of mitochondrial O-GlcNAcylation is controversial 48–50. A single pair of enzymes, OGA and OGT, regulates nuclear, cytoplasmic and mitochondrial protein O-GlcNAcylation in cells. Although both enzymes are encoded by a single gene, their splice isoforms are identified in different cellular compartments including mitochondria 10,48,51. It is possible that mitochondrial proteins are O-GlcNAcylated in the cytoplasm, then subsequently imported into mitochondria. However, the localization of mitochondrial OGT 48,51 and OGA 52 to the inner membrane, as well as the presence of mitochondrial UDP-GlcNAc transporter 51, supports the occurrence of O-GlcNAcylation within mitochondria 53. Our results are consistent with previous findings 50, suggesting that the nuclear cytoplasmic isoform of OGT (ncOGT) compensates for mitochondrial O-GlcNAc functions (Figure 7D–E). The spatiotemporal regulation of O-GlcNAc cycling is complex and regulated via multiple different mechanisms. While fuel availability can lead to global changes in the O-GlcNAc level, binding partners of the regulatory enzymes OGA and OGT can fine-tune O-GlcNAcylated substrates locally in different subcellular compartments. Further research is required to identify O-GlcNAcylated residues on mitochondrial proteins and to elucidate how OGT/OGA splice isoforms specifically regulate mitochondrial plasticity in neurons.
Mitochondrial respiration is mainly controlled by fuel availability and the ATP turnover rate 54. In neurons, electrical activity consumes ATP and enhances fuel utilization (Figure 4) for instantaneous ATP synthesis 3,6. Mitochondrial Ca2+ uptake is proposed as the critical regulator of activity-driven mitochondrial ATP synthesis, though downstream mechanisms have not been explored in neurons 55–58. We report a mechanism that uses post-translational modification, O-GlcNAcylation, to couple neuronal activity, metabolism, and mitochondria to support on-demand ATP synthesis. Mitochondrial O-GlcNAcylation is rapidly upregulated by activity-dependent glucose utilization (Figure 4). Both calcium and glucose may stimulate on-demand ATP synthesis by providing feedforward regulation. While mitochondrial Ca2+ uptake may initiate instantaneous on-demand mitochondrial activity, associated with Ca2+ entry from the plasma membrane, O-GlcNAcylation may provide continuous tailoring of mitochondrial ATP generation based on fuel availability. We identified proteins involved in the ketone body metabolism enzymes, i.e., D-beta-hydroxybutyrate dehydrogenase (BDH1) and metabolite transporters in our mitochondrial O-GlcNAcome (Figure 6). Although glucose is the main fuel source in the brain, neurons have the ability to adapt to changes in nutrient availability and utilize different energy substrates 59–61. Conceivably, nutrient sensing via the HBP pathway and OGT activity inform mitochondria about the source of fuel and allow mitochondrial metabolism to be tailored based on nutrient type and availability.
Mitochondrial function and neuronal O-GlcNAcylation impairments are associated with neurodegenerative disorders including Alzheimer’s, Huntington’s and Parkinson’s disease 1,62–66. Upregulating of O-GlcNAc modification protects against neurodegeneration, motor deficits and synaptic impairment; however, biological stress, such as epileptiform activity, and aging deplete brain O-GlcNAcylation 67–70. Compromised glucose metabolism and metabolic defects are also the main contributors of neurodegenerative diseases. Our study demonstrates a link between neuronal glucose metabolism, O-GlcNAc modification, and mitochondrial bioenergetics, thus providing important insight into the metabolic basis of neurodegeneration.
Limitations of the Study
Our study explored the role of O-GlcNAcylation, a posttranslational modification associated with glucose metabolism, in matching neuronal bioenergetics with activity demands through modifications of mitochondrial proteins. We provide correlative evidence for a relationship between O-GlcNAcylation and activity-induced bioenergetic changes in neurons. Although our research has identified a wide-array of O-GlcNAc-modified mitochondrial targets, the precise mechanisms by which these modifications regulate mitochondrial functions remain to be fully understood. Further research involving detailed mapping of O-GlcNAc-modified residues is essential to understand how the modification of individual proteins can dictate distinct mitochondrial functions. Our findings suggest a critical role for O-GlcNAc modification in regulating ATP synthesis relative to fuel availability. However, mitochondria have multifaceted functions, and additional investigation is required to understand how O-GlcNAcylation coordinates these diverse mitochondrial activities in different neuronal types and in vivo in the brain under different nutrient conditions and disease models.
STAR METHODS
RESOURCE AVAILABILITY
Lead contact
Further information and requests for resources should be directed and will be fulfilled by the lead contact, Gulcin Pekkurnaz (gpekkurnaz@ucsd.edu).
Materials availability
All biological resources and tools are either available from commercial sources or lead contact.
Data and code availability
Proteomics data are provided in Supplementary Tables S1 and S2. The data analysis code is available at DOI: 10.5281/zenodo.11111253. Agilent Seahorse XF96e Metabolic Flux Analyzer data normalization is performed via the custom-written macro “FluxNormalyzer”, available at DOI: 10.5281/zenodo.11111133. Any additional information required to reanalyze the data reported in this paper is available from the lead contact upon request.
EXPERIMENTAL MODEL AND STUDY PARTICIPANT DETAILS
Animals
All animal housing, breeding, and procedures were conducted according to the NIH Guide for the Care and Use of Experimental Animals and approved by the University of California San Diego Animal Care and Use Committee. C57BL/6J strain wild-type mice (Jackson Laboratory) were used for kainic acid and saline injections. Mice were housed at 22-24 °C in a room using a 12-hour light/dark cycle with ad libitum access to a standard chow diet and water. Sprague-Dawley strain wild-type rats (Envigo/Harlan) were used for primary neuron cultures. Timed pregnant female rats (embryonic days 13-16) were singly housed in a room with a 12-hour light/dark cycle with ad libitum food, water access, and environmental enrichment.
Primary neuronal culture
Hippocampal and cortical neurons were isolated from rat (Envigo) embryos (E18) as previously described 71 and plated at 5-7 × 10⁴ cells/cm2 on coverslips for imaging or on 6-well plates at 1-2 × 10⁵ cells/cm2 for biochemical assays. Before plating, the No.1 12mm coverslips (Carolina Biological Supplies) and plates were coated with 20 μg/mL Poly-L-Lysine (Sigma-Aldrich) and 3.5 μg/mL Laminin (Life Technologies) overnight at room temperature. Primary neuron cultures were maintained in Neurobasal (NB) medium containing 5mM glucose, supplemented with B27, GlutaMAX, and penicillin/streptomycin (Life Technologies) unless modified as specified. Each independent experiment was conducted by preparing primary neuron cultures from different pregnant rats. Cortical neurons used for biochemical assays were treated with 1 μM Ara-C (Cytarabine, Tocris) at 3 days in vitro (DIV) to prevent glia proliferation for 2 days. Ara-C-containing medium was replaced with fresh neuron maintenance medium at 5 DIV. The primary neuron cultures were maintained for 11-15 days in vitro by replacing one-third of the culture medium with a fresh medium every three days.
Cell line culture
Neuro-2a cell lines were used to perform shRNA and rescue validation experiments for OGT. The cell line was obtained from the American Type Culture Collection (ATCC), and was tested every 6 months for mycoplasma contamination using LookOut® Mycoplasma PCR Detection Kit. To achieve consistency, the cell line was used in no more than 15 passages. Neuro-2a cells were transfected with plasmid DNA (2.5 μg DNA per well) at 50% confluency using Lipofectamine™ 3000 transfection reagent in Opti-MEM medium. Cells were lysed for biochemical analysis 3 days after transfection, as indicated for each experiment.
METHOD DETAILS
Plasmid constructs
The following previously published or commercially DNA constructs were used: pDsRed2-Mito (Clontech Laboratories Inc.), Mito-BFP 72, HYLight 26. shRNA against mouse OGT was purchased from Sigma MISSION shRNA library (TRCN0000332668). pAAV.CAG.GCaMP6s.WPRE.SV40 was a gift from Douglas Kim & GENIE Project (Addgene plasmid #100844; http://n2t.net/addgene:100844; RRID: Addgene_100844) 73. Synapsin-cyto-mRuby3-iATPSnFR1.0 was a gift from Baljit Khakh (Addgene plasmid # 102557; http://n2t.net/addgene:102557; RRID: Addgene_102557) 74. pLenti PGK mKate2-OGT WT (Puro) was a gift from Suzanne Walker (Addgene plasmid # 154290 ; http://n2t.net/addgene:154290 ; RRID:Addgene_154290) 75.
Kainic acid administration
Age-matched (10-12 weeks) C57BL/6J male mice were injected intraperitoneally with either 10 mg/kg kainic acid (KA) (5mg/ml solution using pharmaceutical grade saline) per dose or an equivalent volume of saline as a control. Kainic acid-injected mice were singly housed and monitored for visible signs of seizure including rearing and repetitive paw movements (Racine scale 4)76. If mice failed to reach Racine scale 4 seizure behavior within one-hour after KA injection, a booster dose (5 mg/kg) of KA was administered. One hour after the onset of Racine scale 4 seizure behavior, the paired saline and KA injected mice were anesthetized by inhalation of isoflurane and perfused transcardially first with ice-cold phosphate-buffered saline (PBS, pH 7.4) followed by freshly prepared 4% paraformaldehyde (PFA). The brain was extracted and postfixed with 4% PFA solution overnight, then rinsed with PBS, cryoprotected in 30% sucrose, and embedded with Tissue Tek OCT Compound for cryosectioning.
Brain slice immunohistochemistry
Brains were sectioned at 25 μm on a cryostat (ThermoFisher Cryostart NX70). The sections were placed in blocking solution (5% Goat serum and 0.3% Triton X-100 in PBS) for 1 hour at room temperature, then incubated with primary antibodies in staining solution (1% Goat serum and 0.3% Triton X-100 in PBS) overnight at 4 °C. After washing with PBS three times, secondary antibody staining was performed for 1 hour at room temperature. The sections were mounted using DAPI (4’,6-diamidino-phenyindole)-Fluoromount-G (Southern Biotech, Birmingham, AL). The following primary antibodies were used for staining: mouse anti-O-GlcNAc (RL2, Abcam, Ab2739), rabbit anti-c-Fos (Synaptic Systems 226003), chicken anti-NeuN (Sigma-Aldrich ABN91). The secondary antibodies were: goat anti-mouse Alexa 488 (Life Technologies A11029), goat anti-rabbit Alexa 568 (Life Technologies A11036), goat anti-chicken Alexa 647 (Life Technologies A21449), and DAPI for nuclear staining. Images were acquired using a Zeiss LSM780 confocal laser scanning microscope, Plan-Apochromat 20x/0.8 M27 objective using the same image acquisition settings across different conditions and sections. The distribution of c-Fos and O-GlcNAc intensities from NeuN-positive neurons were further analyzed using Fiji 77, using only linear adjustments of brightness and contrast for visualization.
Transfection and live-cell imaging
Primary cortical neuron cultures were transfected with indicated DNA constructs using Lipofectamine 2000 (Life Technologies). Live-cell imaging of neurons was performed 2-3 days after transfections at 11-12 DIV. Coverslips were mounted on a stimulation chamber (Warner Instruments RC-47FSLP) with laminar-flow perfusion and imaged at 37 °C using a Zeiss LSM780 laser scanning confocal microscope equipped with a heated stage and C-Apochromat 40x/1.20 W Korr FCS M27 objective. Laser power was set to <1% for each channel to minimize phototoxicity during time-lapse image acquisition. For most of the experiments, neurons were continuously perfused at 0.2-0.25 ml/min with Tyrode buffer (50mM HEPES pH 7.4, 119 mM NaCl, 2.5 mM KCl, 2 mM CaCl2, 2 mM MgCl2, 5 mM glucose, 2mM pyruvate, and 2mM lactate). Trains of action potentials were evoked by electrical field stimulation (100 mA,10 Hz, 600/100/50/10 APs as indicated) during live-cell imaging to measure calcium dynamics, ATP, and glucose metabolism with genetically encoded sensors. The images were further analyzed as described below using Fiji 77.
Calcium dynamics imaging and analysis
Neurons were transfected with fluorescent calcium sensor GCaMP6s to image neuronal activity as previously described 73. Time-lapse movies were acquired from 11-12 DIV neurons expressing GCaMP6s for a total of 5 minutes at 0.1-0.2 Hz. For each imaging session, first pre-stimulus fluorescence baseline (F0) measurements were performed for 2 minutes in the absence of electrical activity as a control, then action potentials were evoked by field stimulation (100mA, 10 Hz,600 AP). GCaMP6s peak fluorescence (ΔF/F0) for each stimulation was calculated by dividing the highest intensity data point by pre-stimulus intensity. O-GlcNAc transferase and O-GlcNAcase activities were blocked by 5 μM OSMI-4 (MedChem Express) and 5 μM Thiamet-G (Calbiochem) treatments, respectively. Neurons were preincubated with OSMI-4 and Thiamet-G for 30 minutes before imaging and perfused with Tyrode buffer containing the inhibitors during live-cell imaging. In the experiments demonstrated in Figure S7H, electrical field stimulation at 10 Hz with 600, 100, 50, or 10 APs was applied to neurons in Tyrode’s buffer, which contained 0.01 mM CNQX and 0.05 mM AP5. For each neuron, at least three regions of interest (ROIs) with an average area of 20-30 μm2, encompassing all neuronal compartments (soma, dendrites, and axons) were selected for image analysis.
Glycolysis measurements with HYlight sensor and analysis
Glycolysis dynamics were measured using a genetically encoded fluorescent biosensor for fructose 1,6-bisphosphate (FBP) termed HYlight as described 26. Neurons were transfected with HYlight and imaged at 11-12 DIV. Before the beginning of image acquisition, the neurons were pre-equilibrated with Tyrode buffer perfusion for 10 minutes in the stimulation chamber. In 2-deoxyglucose (2DG) experiments, 5mM glucose in the Tyrode buffer was replaced with 5mM 2DG as indicated with the arrow in Figure 4D. For each imaging session, first pre-stimulus fluorescence baseline (R0) measurements were performed for 5 minutes in the absence of electrical activity as a control, then action potentials were evoked by field stimulation (100mA, 10 Hz,600 AP). Time-lapse movies from neurons expressing HYlight were acquired as described previously 26 for 15-20min. Briefly, the neuron images were acquired for each time point by using 488 nm and 405 nm lasers for excitation and emission detection ranges at 492-598 nm and 490-596 nm, respectively. HYlight fluorescence ratio was calculated from individual neurons by selecting at least 3 ROIs with an average area of 20-30 μm2 from both proximal and medial/distal (>75 μm away from soma boundary) neuronal processes. Then the normalized HYlight emission induced by 488nm and 405nm excitations (ΔR/R0) was calculated as a readout of temporal changes in FBP level by dividing the HYlight intensity data points with pre-stimulus intensity.
ATP level imaging and analysis
Single-wavelength genetically encoded ratiometric fluorescent sensor mRuby-iATPSnFR1.0 was used for cytoplasmic ATP measurements (Synapsin-cyto-mRuby3-iATPSnFR1.0) 74. Neurons were transfected with mRuby-iATPSnFR1.0 and Mito-BFP plasmids. Time-lapse movies were acquired from 11-12 DIV neurons for a total of 10-15 minutes at 0.1-0.2 Hz using 488 nm, 568nm, and 405 nm lasers for excitation. O-GlcNAc transferase activity was blocked by 5 μM OSMI-4 treatment. Neurons were preincubated with OSMI-4 for 30 minutes before imaging, and perfused with Tyrode buffer containing OSMI-4 during live-cell imaging. In 2-deoxy-D-glucose (2DG) and Oligomycin (Oligo) experiments, 5mM glucose in the Tyrode buffer was replaced with 5mM 2DG and 2 μM Oligo added during live-cell imaging. For each imaging session, first pre-stimulus fluorescence baseline (F0) measurements were performed for 2 minutes in the absence of electrical activity as a control, then action potentials were evoked by field stimulation (100mA, 10 Hz,600 AP and 100AP as indicated). Changes in mRuby-iATPSnFR1.0 fluorescence (ΔF/F0) were calculated by dividing the fluorescent intensity differences between frames with pre-stimulus intensity for each stimulation. For each neuron, one to four regions of interest (ROIs) with an average area of 20-30 μm2 of neuronal processes (<75 μm away from the soma) were selected for image analysis. ΔF/F0 for mRuby and iATPSnFR1.0 channels were plotted independently without the ratiometric calculations for each condition for the mRuby-iATPSnFR1.0 sensor data. In the experiments demonstrated in Figure S7C and E, neuronal axons were selected for image analysis.
Mitochondrial membrane potential measurements
Primary hippocampal neuron cultures (9-13 DIV) were treated with 2 μM Thiamet-G or vehicle DMSO (Sigma-Aldrich) overnight. For mitochondrial membrane potential measurements, neurons were stained with tetramethylrhodamine methyl ester (TMRM) (Invitrogen) at a non-quenching concentration (20nM), and co-stained with membrane potential insensitive mitochondria dye MitoTracker Green FM (Invitrogen) (40nM) for 20 minutes. For live-cell imaging, coverslips were transferred to Hibernate E (BrainBits) medium containing 5nM TMRM as described previously 72. Live-cell imaging was performed at 37 °C, using Zeiss LSM 780 laser scanning confocal microscope equipped with a temperature-controlled stage, and Plan-Apochromat 100x/1.40 Oil DIC M27 objective. For the relative quantification of membrane potential for each mitochondrion, the fluorescence intensity of TMRM was normalized to the MitoTracker Green signal for each mitochondrion from neuronal processes.
Immunocytochemistry of neurons
11-15 DIV dissociated primary neuron cultures were fixed and immunostained immediately after indicated neuronal stimulations. Neuronal activity was manipulated either with field stimulation (100mA, 10 Hz,600 AP) or 6 hours of 50 μM picrotoxin (PTX, Tocris) treatment 78, either alone or with 10 μM 2,3-Dioxo-6-nitro-1,2,3,4-tetrahydrobenzo[f]quinoxaline-7-sulfonamide (NBQX, Tocris). To modulate neuronal O-GlcNAcylation levels, primary hippocampal neuron cultures at 11-13 DIV were incubated overnight with 5 μM Thiamet-G, 10 μM OSMI-4, or a vehicle control (DMSO). Neurons were fixed with 4% PFA and 4% sucrose in PBS for 10 minutes at room temperature, and immunostained with the antibodies in 1x GBD (10% goat serum, 1% bovine serum albumin, and 0.1% Triton X-100 in PBS) as previously described 79. The coverslips were mounted using Fluoromount-G (Southern Biotech, Birmingham, AL). The following primary antibodies were used for staining: mouse anti-O-GlcNAc (RL2, Abcam), chicken Anti-βIII Tubulin (Tuj1) (Novus Biological), rabbit anti-Tomm20 (Sigma-Aldrich). The secondary antibodies were: goat anti-mouse Alexa 488 (Life Technologies), goat anti-rabbit Alexa 568 (Life Technologies), goat anti-chicken Alexa 647 (Life Technologies), goat anti-chicken Alexa 405 (Abcam), and donkey anti-mouse Alexa 647 (Jackson ImmunoResearch Laboratories, Inc.). Images were acquired using a Zeiss LSM780 confocal laser scanning microscope, Plan-Apochromat 100x/1.40 Oil DIC M27 objective using the same image acquisition settings across different conditions and coverslips. DAPI staining was used to define the perinuclear cytoplasmic regions in the somal compartment for each neuron (Figure 2). Axonal and dendritic neuronal processes are determined based on their mitochondrial and structural morphology as previously described 80,81. In Figure 3, the mitochondrial area was defined based on the Anti-Tomm20 positive areas with a mean gray value of 25 and higher. The images were further analyzed using Fiji 77, using only linear adjustments of brightness and contrast for visualization. For colocalization analysis, the Coloc2 plugin for Fiji was used to calculate Mander’s and Pearson’s correlation coefficients, as well as to perform Costes’ test for statistical significance, with comparison to randomized images24.
Verification of OGT knock-down with shRNA and rescue
For the experiments involving OGT knockdown, a validated shRNA construct from the Sigma MISSION shRNA library was selected to assess the efficiency of OGT knockdown. Because the target sequence is conserved between mouse and rat OGT, knockdown efficiency was first validated in Neuro-2a cells. The specificity of the OGT shRNA construct was further confirmed by co-expressing it with shRNA-resistant human ncOGT (OGT shRNA resistant) for two days followed by measurement of OGT levels from cell lysates (Figure S7D). Following confirmation of mouse OGT knockdown efficiency, OGT shRNA and the OGT shRNA resistant rescue constructs were further characterized in rat primary neuron cultures using anti-O-GlcNAc antibodies. Rat hippocampal neurons were transfected with either empty vector control plasmid DNA or OGT shRNA plasmid together with mRuby-iATPSnFR1.0 and OGT shRNA resistant plasmids as indicated (Figure 7D and E). Given that the half-life of OGT protein was estimated to be ~13 hours82, the shRNA construct was expressed in rat neurons for 3 days, allowing efficient knockdown of endogenous OGT. The efficiency of rat HK1 knockdown was verified retrospectively for each transfection by immunocytochemistry using an antibody against endogenous HK1 (Figure S4D).
Preparation of mitochondrial fractions and protein analysis
Mitochondrial fractions were isolated from primary cortical neurons at 11-15 DIV, which were cultured on 6-well plates. The following pharmacological treatments, as specified in Figure 3 and S3, were applied: 50 μM PTX for 6 hours, either alone or in combination with 10 μM NBQX; and an overnight neuronal activity inhibition cocktail consisting of 1 μM Tetrodotoxin (TTX), 10 μM NBQX and 50 μM AP5, either alone or with 2 μM Thiamet-G, and 10 μM OSMI-4. The mitochondrial fractions were obtained by homogenization of cultured neurons in mitochondrial isolation buffer (MIB) (10mM Tris-HCl (pH 7.4), 10mM KCl, 250mM Sucrose, 1 mM EDTA, 1x Protease Inhibitor Cocktail Set III (Calbiochem), 0.1mM PMSF, 2 μM Thiamet-G and 2mM DTT) and differential centrifugation. Each well containing neurons was washed (~1.5 × 10⁷ cells per condition) and incubated with freshly prepared MIB on ice for 10 minutes. Cells were detached with a cell scraper and homogenized (20-30 strokes with a tight-fitting B pestle in a 1ml Dounce homogenizer). Nuclear waste and large debris were pelleted by centrifugation at 700g for 10 minutes. The supernatant (containing mitochondria) was centrifuged again at 10,000g for 10 minutes to pellet the crude mitochondrial fraction. The supernatant (cytoplasmic fraction) was collected and concentrated using Amicon Ultracel-10 centrifugal filter units (Millipore). 20% of mitochondrial and 10% of cytoplasmic fractions were then loaded in SDS-PAGE and analyzed by western blotting. The whole-cell lysate was collected using lysis buffer (50mM Tris-HCl (pH 7.4), 150 mM NaCl, 1 mM EDTA (pH 8.0), and 2% NP-40 with 1x Protease Inhibitor Cocktail Set III, 0.1 mM PMSF, 2 μM Thiamet-G and 2 mM DTT), centrifuged at 13,500g for 15min to remove cell debris and analyzed by western blotting. The following antibodies were used for probing blots: mouse anti-O-GlcNAc (RL2, Abcam), rabbit anti-ATP5β (Sigma-Aldrich), rabbit anti-Tomm20 (Sigma-Aldrich), rabbit anti-GPI (Thermo-Fisher), mouse anti-actin (Sigma-Aldrich), rabbit anti-OGT (DM-17, Sigma-Aldrich), rabbit anti-OGA (MGEA5) (Proteintech), mouse anti-tubulin (Sigma-Aldrich), rabbit anti-RHOT1(Miro1) (Aviva Systems Biology), mouse anti-cytochrome c (Abcam), rabbit anti-TFAM (mtTFA) (Abcam), mouse anti-Slc25a4/5 (ANT1/2) (Abcam), rabbit anti-Suclg1 (Cell signaling Technology), goat anti-mouse peroxidase (Jackson Immuno Research Laboratories, Inc.), goat anti-rabbit peroxidase (Jackson Immuno Research Laboratories, Inc.). For quantitative western blot measurements, image exposure times were optimized for the linear range of detection using the Azure Biosystem gel documentation system. The images were further analyzed using the Fiji gel analyzer 77, applying only linear adjustments of brightness and contrast for visualization.
Respirometry measurements with primary cortical neurons
Oxygen consumption and extracellular acidification rates were measured using an Agilent Seahorse XFe96 Analyzer and Seahorse XF Mito Stress Test protocol, from 12-15 DIV primary cortical neurons. Neurons were cultured on XF96e plates at 45,000/well density and treated with 1 μM Ara-C (Cytarabine, Tocris) for two days at 3 DIV as described above. Neuronal activity was manipulated with 6 hours of 50 μM picrotoxin (PTX, Tocris) treatment, either alone or with 5 μM OSMI-4 as demonstrated in Figure S3. The neurons were treated with OGA inhibitor 5 μM Thiamet-G or DMSO (Control) and incubated overnight for the experiments to upregulate O-GlcNAcylation. For respirometry measurements, the neuronal maintenance medium was exchanged with XF DMEM Base Medium (pH 7.4) with no phenol red (Agilent) supplemented with 5 mM glucose and 1 mM pyruvate. For the glucose-free experimental conditions presented in Figure S5 C–E, neurons were incubated with either 5 μM Thiamet-G or DMSO as a control overnight. Subsequently, they were transferred to XF DMEM Base Medium (pH 7.4) without phenol red (Agilent), which was supplemented with 5 mM glucosamine and 3 mM methyl pyruvate as specified. NucBlue dye (Thermo Fisher Scientific) was included to stain nuclei for cell counting immediately after the assay. Respiration was measured under basal conditions as well as after injections of 1 μM Oligomycin (Sigma-Aldrich), 0.5 μM FCCP (Sigma-Aldrich), and 0.5 μM Rotenone (Sigma-Aldrich)/0.5 μM Antimycin A (Sigma-Aldrich) injections. Basal and maximal respiration, reserve capacity, basal glycolysis and glycolytic capacity values were calculated as previously described 83 after cell count normalization with custom written FluxNormalyzer macro. After each assay, the neuronal enrichment percentage was calculated by immunostaining of seahorse plates with neuron-specific antibody (anti-NeuN) and cellular nuclei (NucBlue).
Multielectrode array (MEA) recordings and analysis
Rat cortical neurons were cultured at a density of 85,000 neurons per well on CytoView 24-well MEA plates (Axion Biosystems) for 12 DIV. Prior to cell plating, each well was prepared by coating with a 0.1% poly(ethyleneimine) solution (Polyscience) in borate buffer (pH 8.4) for one hour at room temperature. After coating, wells were washed four times with water and left to air dry overnight. Additionally, two hours before neuron plating, wells were coated with 20 μg/mL laminin. To modulate neuronal O-GlcNAcylation levels, cultures were incubated for 30 minutes either with 5 μM Thiamet-G, 10 μM OSMI-4, or a vehicle control (DMSO). As a negative control, neurons were treated overnight with 10 μM NBQX and 50 μM AP5 to suppress neuronal activity. Recordings were carried out on the Maestro MEA platform using AxIS navigator (Axion Biosystems) with a 200Hz to 3 kHz bandpass filter. Spike detection was performed using an adaptive threshold set to 6 times the standard deviation of the estimated noise on each electrode. Each plate was allowed to acclimate to the Maestro instrument for 3-5 minutes before recordings. Following acclimatization, a 10-15 minute recording session was conducted to assess the mean firing rates and network burst frequencies. Multi-electrode data analysis was performed using the Neural Metrics Tool (Axion Biosystems), and an active electrode was considered once five spikes occurred over a minute (five spikes/min). Network bursts were identified in the data recorded from each electrode using an inter-spike interval (ISI) threshold requiring a minimum number of 5 spikes with a maximum ISI of 100 ms. Network bursts were defined as having a minimum number of 50 spikes across an entire well with a maximum ISI of 100 ms and a minimum percentage of participating electrodes as 35%.
Mass spectrometry sample preparation and analysis for O-GlcNAcylated proteins
O-GlcNAcylated protein enrichment and in-gel digestion:
Mitochondrial fractions were prepared from 11-15 DIV primary cortical neuron cultures, treated either with 5 μM Thiamet-G or vehicle overnight. Mitochondrial pellets were dissolved in the lysis buffer. 9 μg of succinylated Wheat Germ Agglutinin (sWGA)-bound agarose beads (Vector Laboratories, Burlingame, CA) and mitochondrial lysates were incubated for 12hr at 4 °C for O-GlcNAcylated protein enrichment. Monosaccharide inhibitor GlcNAc (40mM) was added before the incubation of mitochondrial lysate with sWGA beads as a negative control. To eliminate non-specific binding sWGA beads were washed with lysis buffer 4 times with gentle agitation and resuspended with 1x Laemmli buffer. 80-90% of each sample was separated by pre-cast 4-20% SDS-PAGE (Bio-Rad). “SimplyBlue SafeStain” (Invitrogen) stained gel bands were excised, minced, and prepared for mass spectrometry analysis as previously described 84. Briefly, the gel slices were cut into 1mm x 1 mm cubes and de-stained 3 times by first washing with 100 μl of 100 mM ammonium bicarbonate for 15 minutes, followed by additions of the same volume of acetonitrile (ACN) for 15 minutes. The samples were dried in a speedvac and reduced by mixing with 200 μl of 100 mM ammonium bicarbonate-10 mM DTT and incubated at 56 °C for 30 minutes. The solution was removed, and 200 μL of 100 mM ammonium bicarbonate-55mM iodoacetamide was added to gel pieces and incubated at room temperature in the dark for 20 minutes. After removing the supernatant and washing the gel pieces with 100 mM ammonium bicarbonate for 15 minutes, the same volume of ACN was added to dehydrate the gel pieces. The samples were dried in a speedvac and processed for trypsin digestion. For digestion, ice-cold trypsin (0.01 μg/μL) in 50 mM ammonium bicarbonate was added to cover the gel pieces and incubated on ice for 30 min. After complete rehydration, the excess trypsin solution was removed, replaced with fresh 50 mM ammonium bicarbonate, and left overnight at 37°C. The peptides were extracted twice by the addition of 50 μl of 0.2% formic acid and 5 % ACN and vortex mixing at room temperature for 30 min. The supernatant was removed and saved. A total of 50 μl of 50% ACN-0.2% formic acid was added to the sample, which was vortexed again at room temperature for 30 min. The supernatant was removed and combined with the supernatant from the first extraction for further analysis.
Identification of O-GlcNAc captured proteins:
The samples were analyzed by ultra-high pressure liquid chromatography (UPLC) coupled with tandem mass spectroscopy (LC-MS/MS) using nanospray ionization. The nanospray ionization experiments were performed using an Orbitrap Fusion Lumos hybrid mass spectrometer (Thermo) interfaced with nano-scale reversed-phase UPLC (Thermo Dionex UltiMate™ 3000 RSLC nano System) using a 25 cm, 75-micron ID glass capillary packed with 1.7-μm C18 (130) BEHTM beads (Waters Corporation). Peptides were eluted from the C18 column into the mass spectrometer using a linear gradient (5–80%) of ACN at a flow rate of 375 μl/min for one hour. The buffers used to create the ACN gradient were: Buffer A (98% H2O, 2% ACN, 0.1% formic acid) and Buffer B (100% ACN, 0.1% formic acid). Mass spectrometer parameters are as follows; an MS1 survey scan using the orbitrap detector set to (mass range (m/z): 400-1500 (using quadrupole isolation), 120000 resolution setting, spray voltage of 2200 V, Ion transfer tube temperature of 275 C, AGC target of 400000, and maximum injection time of 50 ms) was followed by data-dependent scans (top speed for most intense ions, with charge state set to only include +2-5 ions, and 5 second exclusion time, while selecting ions with minimal intensities of 50000 at in which the collision event was carried out in the high energy collision cell (HCD Collision Energy of 30%). The fragment masses were analyzed in the ion trap mass analyzer (With the ion trap scan rate of turbo, first mass m/z was 100, AGC Target 5000, and maximum injection time of 35ms). PEAKS Studio 8.5 software was used for peptide identification and label-free quantification of the relative abundance of all peptides detected in Thiamet-G or vehicle samples 85.
LC-MS/MS data analysis:
Label-free quantification data for the O-GlcNAc captured proteins from paired Thiamet-G or vehicle treated primary neuron cultures were generated in three separate experiments. These values represent an estimated abundance for each protein in each sample. Prior to merging the sample data, proteins with < 2 peptides and/or not detected in at least one sample in each of the groups (Thiamet-G and vehicle treated) were removed. The merged data matrix was used as input to the Perseus software package 86, which performed a series of processing steps. First, label-free quantification values were log transformed. Second, abundance values were imputed for proteins in samples where the protein was undetected. The imputed values were randomly assigned from a gaussian distribution with the Perseus default parameters for width and downshift. Finally, the processed abundance value matrix was imported into the R statistical computing environment (www.cran.org) for additional analyses. To identify differentially abundant proteins, moderated t-tests from the limma package 87 were used to compare the two groups (Thiamet-G treatment vs vehicle treatment) where the experimental design was modeled upon treatment (~0 + treatment) and p-value < 0.05 was used as the cutoff for significance. Scatter plots and pie charts were made with the ggplot2 package for R 88. Of primary importance in this study were proteins detected in the mitochondrial databases MitoMiner, Mouse Mitocarta 3.0 29,30 and the O-GlcNAc Database 31,89. Proteins identified by mass spec were annotated with the information from these databases including subcellular localization, mitochondria-specific localization, and mitochondria-related processes. Annotation data for the identified proteins were used for filtering to relevant subsets, aggregated, and used as input to generate pie charts and other visualizations. Enrichment analysis was performed with gprofiler2 90,91 within R using a p-value cutoff of 0.05. Network analysis was performed using the string-db.org web application 92 and exported to Cytoscape 93 for image preparation.
Mass spectrometry sample preparation and analysis for mitochondrial proteins
Protein digestion:
Mitochondrial pellets were lysed in a lysis buffer containing 8 M urea, 50 mM Tris (pH 8.0), 75 mM NaCl, and 1X protein-phosphatase inhibitor. The protein concentrations of the lysates were determined by the Bradford assay. Proteins were reduced with 10 mM TCEP for 30 minutes at room temperature (RT) in the dark and alkylated with 5 mM iodoacetamide for 15 minutes at RT in the dark. The protein solution was then diluted to 2 M urea with 50 mM Tris (pH 8.0). Proteolytic digestion was carried out using a 1:50 protease-to-protein ratio with Lys-C for 2 hours at RT with shaking at 800 rpm, followed by trypsin digestion overnight at RT with shaking at 800 rpm. The digestion was terminated by acidification with 1% formic acid and centrifuged at 18,000 g for 15 minutes to clear any debris.
Sample preparation:
C18 stage tips were crafted from Empore C18 extraction disks 94. These tips were conditioned with 100 μL methanol and then centrifuged at 3,500 g for 30 seconds at RT to remove the flow-through. They were then washed with 100 μL of 50% methanol/0.1% formic acid (v/v) and equilibrated with four 100 μL aliquots of 0.1% formic acid (v/v). The samples, adjusted to 100 μL with 0.1% formic acid (v/v), were loaded onto the stage tips and washed three times with 100 μL 0.1% formic acid (v/v). Elution was performed with 60 μL of 50% acetonitrile/0.1% formic acid (v/v) into new collection vials. The eluates were transferred to HPLC vials, frozen, and dried under vacuum. Prior to LC-MS/MS analysis, samples were resuspended in 9 μL of 2% acetonitrile/0.1% formic acid (v/v) 95.
LC-MS/MS data analysis:
Chromatographic separation was achieved using UHPLC with a flow rate of 200 nL/min. Peptides were eluted from a 75 μm i.d. PicoFrit column (New Objective, Woburn, MA) packed with 1.9 μm AQ-C18 material (Dr. Maisch, Germany) to a length of 33 cm over a 194-minute gradient. The gradient profile began with 2% buffer B (80% acetonitrile/0.1% formic acid, v/v) and progressed to 30% over 169 minutes, then to 72% at 178 minutes, reaching 90% at 179 minutes and held until 184 minutes, before returning to 60% for the run’s duration. Mass spectrometric analysis was conducted on a Thermo Scientific Eclipse mass spectrometer, executing a precursor scan from 350 to 2000 m/z at a resolution of 60,000. The top 20 most intense multiply charged precursors underwent HCD fragmentation at a resolution of 15,000. The precursor isolation window was set to 0.7 m/z, and the maximum MS2 injection time was 50 ms, targeting an automatic gain control of 3e4. Dynamic exclusion was set to 45 s, selecting charge states from +2 to +5 for MS2 scans. A quantity of 1 μg of each sample was loaded for each acquisition run.
Data processing:
The acquired data were processed using MaxQuant against the UniProt Mouse database, which included common experimental contaminants. Searches accounted for fixed modifications of carbamidomethylation on cysteine residues and variable modifications including N-terminal acetylation and methionine oxidation. Trypsin was set as the cleavage enzyme, allowing for up to three missed cleavages. Mass tolerances for MS1 and MS2 were set at 20 ppm. Peptide and protein false discovery rates (FDRs) were established at <1% through a reverse decoy database strategy. Label-free quantification was employed for protein identification. Proteins with less than 2 unique peptides or identified in only replicate were filtered. The average intensity of each protein was shown as protein abundance. Next, the identified protein list was queried into the STRING database to obtain the functional annotations of all proteins and to identify mitochondrial proteins96.
QUANTIFICATION AND STATISTICAL ANALYSIS
Throughout the paper, error bars indicate the mean ± SEM unless otherwise noted. All p-values and the number of replicas were indicated in the figure legend for each experiment. Statistical analysis was performed with GraphPad Prism 8 or R. The Mann-Whitney U test was used to determine the significance of differences between the two conditions. Multiple conditions were compared by the Kruskal-Wallis nonparametric ANOVA test, which was followed by Dunn’s multiple comparisons test or by one-way ANOVA with post hoc Tukey’s test as appropriate to determine the significance of differences across every condition to control condition. Statistical methods are indicated in figure legends.
Supplementary Material
Table S1. Mitochondrial Proteomics Data, Related to Figure 6.
Table S2. Total Proteomics Data, Related to Figure 6.
KEY RESOURCES TABLE
| REAGENT or RESOURCE | SOURCE | IDENTIFIER |
|---|---|---|
| Antibodies | ||
| Anti-O-linked N-acetyl glucosamine (O-GlcNAc) [RL2] | Abcam | Ab2739 |
| Anti-c-Fos | Synaptic Systems | 226 003 |
| Anti-NeuN | Sigma Aldrich | ABN91 |
| Anti-NeuN | EMD Millipore | MAB377 |
| Anti-βIII Tubulin (Tubb3, Tuj1) | Novus Biologicals | NB100-1612 |
| Anti-Tomm20 | Sigma Aldrich | HPA011562 |
| Anti-ATP5β | Sigma Aldrich | HPA001520 |
| Anti-RHOT1 (Miro1) | Aviva | ARP44817-P050 |
| Anti-GPI | Invitrogen | PA5-26787 |
| Anti-Actin | Sigma Aldrich | A2228 |
| Anti-Tubulin | Sigma Aldrich | T6199 |
| Anti-OGT [DM-17] | Sigma Aldrich | O6264 |
| Anti-OGA (MGEA5) | Proteintech | 14711-AP |
| Anti-Cytochrome c | Abcam | Ab13575 |
| Anti-TFAM (mtTFA) | Abcam | Ab131604 |
| Anti-ANT1/2 (Slc25a4/5) | Abcam | Ab110322 |
| Anti-Suclg1 | Cell Signaling | 8071S |
| Goat anti-mouse Alexa 488 | Life Technologies | A11029 |
| Goat anti-rabbit Alexa 568 | Life Technologies | A11036 |
| Goat anti-chicken Alexa647 | Life Technologies | A21449 |
| Goat anti-chicken Alexa405 | Abcam | Ab175674 |
| Donkey anti-mouse Alexa647 | Jackson ImmunoResearch Laboratories | 715-605-151 |
| Goat anti-mouse HRP | Jackson ImmunoResearch Laboratories | 115-035-166 |
| Goat anti-rabbit HRP | Jackson ImmunoResearch Laboratories | 111-035-144 |
| Chemicals | ||
| Kainic acid (KA) | Tocris | 0222 |
| Picrotoxin (PTX) | Tocris | 1128 |
| Tetrodotoxin (TTX) | Abcam | ab120054 |
| 2,3-Dioxo-6-nitro-1,2,3,4-tetrahydrobenzo[f]quinoxaline-7-sulfonamide (NBQX) disodium salt | Tocris | 1044 |
| CNQX disodium salt | Tocris | 1045 |
| D-AP5 | Tocris | 0106 |
| Oligomycin A | Sigma Aldrich | 75351 |
| Carbonyl cyanide 4-(trifluoromethoxy)phenylhydrazone (FCCP) | Sigma Aldrich | C2920 |
| Rotenone | Sigma Aldrich | R8875 |
| Antimycin A | Sigma Aldrich | A8674 |
| Cytosine β-D-arabinofuranoside (Cytarabine, Ara-C) | Tocris | 4520 |
| Thiamet-G | Calbiochem | 110165CBC-25MG |
| OSMI-4 | MedChem Express | HY114361 |
| N-Acetyl-D-glucosamine (GlcNAc) | Sigma Aldrich | A8625 |
| 2-deoxyD-glucose (2DG) | Sigma Aldrich | D8375 |
| Urea | VWR | M123-1KG |
| Protease-phosphatase inhibitor cocktail | Thermo Scientific | 78429 |
| Tris (2-carboxyethyl) phosphine HCl | Thermo Scientific | 77720 |
| Iodoacetamide | Thermo Scientific | 122270250 |
| Formic acid | Sigma Aldrich | 56302 |
| Methanol | Fluka | 34966 |
| Acetonitrile | Thermo Scientific | 047138-M6 |
| DTT | Sigma Aldrich | 10197777001 |
| Trypsin | Thermo Scientific | 90058 |
| TCEP | Thermo Scientific | 77720 |
| 0.1% Formic Acid (v/v) in Acetonitrile | Thermo Scientific | 85174 |
| ACQUITY UPLC Peptide BEH C18 Column | Waters | 186003687 |
| Sodium tetraborate decahydrate, 99+% | Thermo Scientific | A16176.36 |
| Boric Acid | Sigma Aldrich | B6768-1KG |
| Deposited data | ||
| Data analysis code for proteomics data in Table S1 and S2 | This paper | DOI: 10.5281/zenodo.11111253 |
| “FluxNorm”: Macro for data normalization from Agilent Seahorse XF96e Metabolic Flux Analyzer | This paper | DOI: 10.5281/zenodo.11111133 |
| Experimental models: Organisms/strains | ||
| C57BL/6J | The Jackson Laboratory | RRID:IMSR_JAX:000664 |
| Hsd:Sprague Dawley® SD® | Envigo | RRID:RGD_737903 |
| Recombinant DNA (plasmid) | ||
| CMV-HYLight (CggR0-180-PPKE) | Koberstein et al., 2022. 26 | |
| pDsRed2-Mito | Clontech | 632421 |
| pAAV.CAG.GCaMP6s.WPRE.SV40 | Chen et al., 2013. 73 | Addgene plasmid #100844 |
| Synapsin-cyto-mRuby3-iATPSnFR1.0 | Lobas et al., 2019. 74 | Addgene plasmid #102557 |
| Mito-BFP | Ashrafi et al., 2014. 72 | |
| shRNA against OGT (targeting all splice isoforms) | This paper | Sigma Mission shRNA library (TRCN0000332668) |
| pLenti PGK mKate2-OGT WT | Levine et al., 2021. 75 | |
| Software and algorithms | ||
| Fiji | Schindelin et.al.,2021. 77 | https://imagej.net/software/fiji/ |
| GraphPad Prism 8 | GraphPad | https://www.graphpad.com |
| The R Project for Statistical Computing v4.0.4 | Free Software Foundation, GNU Project | https://www.r-project.org/ |
| Cytoscape | National Institute of General Medical Sciences (NIGMS) | https://cytoscape.org/_ |
| MaxQuant | Max Plank Institute of Biochemistry | http://maxquant.org/ |
| STRING database | Szklarczyk et al., 2015. 92 | https://string-db.org/ |
| Peaks Studio 8.5 | Bioinformatics Solutions Inc. | https://www.bioinfor.com/ |
| Axion Neural Metrics and AxIS Navigator | Axion Biosystems | https://www.axionbiosystems.com/ |
| Other | ||
| NucBlue Live ReadyProbes Reagent (Hoechst 33342) | Invitrogen | R37605 |
| Tetramethylrhodamine (TMRM) | Invitrogen | T668 |
| MitoTracker Green FM | Invitrogen | M7514 |
| Succinylated Wheat Germ Agglutinin (sWGA), Agarose bound | Vector Laboratories | AL-1023S |
| Seahorse XFe96 FluxPak | Agilent | 102416-100 |
| XF DMEM Base Medium, no phenol red (pH7.4) | Agilent | 103575-100 |
| CytoView MEA24™-White | Axion BioSystems, Inc | M384-tMEA-24W |
| 6-well plate | Corning | 3516 |
| 12mm coverslip (No.1) | Carolina Biological Supplies | 633029 |
| Poly-L-Lysine | Sigma Aldrich | P2636-25MG |
| Laminin | Life Technologies | 23017015 |
| Neurobasal medium | Life Technologies | 21103049 |
| Neurobasal-A medium, no D-glucose, no sodium pyruvate | Life Technologies | A2477501 |
| B27 supplement | Life Technologies | 17504044 |
| GlutaMAX | Life Technologies | 35050061 |
| Penicillin/Streptomycin | Life Technologies | 15070063 |
| Saline | Fisher Scientific | NC9054335 |
| Isoflurane | MWI Veterinary | 502017 |
| Phosphate-buffered saline (PBS) | Genesee Scientific | 25-507X |
| 37% Paraformaldehyde (PFA) | Fisher Scientific | 50-980-485 |
| OCT Compound | Tissue Tek | 102094-106 |
| Goat serum | Life Technologies | 16210064 |
| Bovine serum albumin (BSA) | Genesee Scientific | 25-529 |
| Triton X-100 | Sigma Aldrich | T8787 |
| DAPI-Fluoromount-G | Southern Biotech | 0100-20 |
| Fluoromount-G | Southern Biotech | 0100-01 |
| Lipofectamine 2000 | Life Technologies | 11668019 |
| RC47FSLP Stimulation Chamber | Warner Instruments | 640374 |
| Sodium pyruvate | Sigma Aldrich | S8636 |
| Sodium lactate | Sigma Aldrich | L7022 |
| D-Glucose | Fisher Scientific | D16-500 |
| DMSO | Sigma Aldrich | D2650 |
| BrainBits Hibernate E Low Fluorescence | Fisher Scientfic | NC0285514 |
| Protease inhibitor cocktail set III | Calbiochem | 535140 |
| Amicon Ultra-0.5 Centrifugal Filter Unit | Millipore | UFC501024 |
| 4-20% SDS-PAGE | Bio-Rad | 456-1096 |
| SimplyBlue SafeStain | Invitrogen | LC6060 |
| Lys-C | Wako Chemicals | 125-05061 |
| Trypsin | Promega | V5113 |
| Stage-tip C18 material | Empore | 66883-U |
| HPLC vial | Waters | 186002626 |
| Picofrit column | New Objective | PF360-75-10-N-5 |
| 1.9 μm AQ-C18 material | Dr. Maisch HPLC GmbH | R119.aq.0001 |
Highlights.
Neuronal activity drives dynamic O-GlcNAcylation in neuronal processes
Mitochondria are the loci of O-GlcNAc modification in neurons
O-GlcNAcylation boosts the respiratory capacity of neuronal mitochondria
Mitochondrial O-GlcNAcome supports neuronal activity-driven on-demand ATP synthesis
ACKNOWLEDGEMENTS
We thank members of the G.P. laboratory, Dr. Ajit Divakaruni, Dr. Jeffrey Esko, Dr. Gerald Shadel, Dr. Anthony Molina, Dr. Lance Wells, Dr. Brenda Bloodgood, Daniel Heinz, Dr. Alysson Muotri, Dr. Matthew Banghart, and Dr. Susan Ackerman for their valuable suggestions and experimental support. We are grateful to Dr. Richard Goodman and Dr. Philip J. S. Stork for their support and guidance with the HYlight sensor experiments. We also thank the members of the University of California San Diego BPMSF and Center for Computational Biology and Bioinformatics Core for their technical contributions. This work was supported by a grant from NIH (R35GM128823) to G.P., NIH (R35GM147554) to S.A.M., NIH (2T32GM007240-39A1) to S.B.Y., University of California San Diego David V. Goeddel endowed graduate fellowship to S.B.Y., NIH (5T32GM133351) to A.A.A., NIH (5T32NS007220-40) to Z.W., NIH (5T32EB009380-15) to N.M.C, and San Diego IRACDA Scholars Program (K12GM068524) grant to R.S.
Footnotes
Publisher's Disclaimer: This is a PDF file of an unedited manuscript that has been accepted for publication. As a service to our customers we are providing this early version of the manuscript. The manuscript will undergo copyediting, typesetting, and review of the resulting proof before it is published in its final form. Please note that during the production process errors may be discovered which could affect the content, and all legal disclaimers that apply to the journal pertain.
DECLARATIONS OF INTERESTS
The authors declare no competing interests.
REFERENCES
- 1.Pekkurnaz G, and Wang X (2022). Mitochondrial heterogeneity and homeostasis through the lens of a neuron. Nat Metab 4, 802–812. 10.1038/s42255-022-00594-w. [DOI] [PMC free article] [PubMed] [Google Scholar]
- 2.Howarth C, Gleeson P, and Attwell D (2012). Updated energy budgets for neural computation in the neocortex and cerebellum. J Cereb Blood Flow Metab 32, 1222–1232. 10.1038/jcbfm.2012.35. [DOI] [PMC free article] [PubMed] [Google Scholar]
- 3.Rangaraju V, Calloway N, and Ryan TA (2014). Activity-driven local ATP synthesis is required for synaptic function. Cell 156, 825–835. 10.1016/j.cell.2013.12.042. [DOI] [PMC free article] [PubMed] [Google Scholar]
- 4.Diaz-Garcia CM, Mongeon R, Lahmann C, Koveal D, Zucker H, and Yellen G (2017). Neuronal Stimulation Triggers Neuronal Glycolysis and Not Lactate Uptake. Cell Metab 26, 361–374 e364. 10.1016/j.cmet.2017.06.021. [DOI] [PMC free article] [PubMed] [Google Scholar]
- 5.Diaz-Garcia CM, and Yellen G (2019). Neurons rely on glucose rather than astrocytic lactate during stimulation. J Neurosci Res 97, 883–889. 10.1002/jnr.24374. [DOI] [PMC free article] [PubMed] [Google Scholar]
- 6.Ashrafi G, Wu Z, Farrell RJ, and Ryan TA (2017). GLUT4 Mobilization Supports Energetic Demands of Active Synapses. Neuron 93, 606–615 e603. 10.1016/j.neuron.2016.12.020. [DOI] [PMC free article] [PubMed] [Google Scholar]
- 7.Akan I, Olivier-Van Stichelen S, Bond MR, and Hanover JA (2018). Nutrient-driven O-GlcNAc in proteostasis and neurodegeneration. J Neurochem 144, 7–34. 10.1111/jnc.14242. [DOI] [PMC free article] [PubMed] [Google Scholar]
- 8.Marshall S, Bacote V, and Traxinger RR (1991). Discovery of a metabolic pathway mediating glucose-induced desensitization of the glucose transport system. Role of hexosamine biosynthesis in the induction of insulin resistance. J Biol Chem 266, 4706–4712. [PubMed] [Google Scholar]
- 9.Pekkurnaz G, Trinidad JC, Wang X, Kong D, and Schwarz TL (2014). Glucose regulates mitochondrial motility via Milton modification by O-GlcNAc transferase. Cell 158, 54–68. 10.1016/j.cell.2014.06.007. [DOI] [PMC free article] [PubMed] [Google Scholar]
- 10.Zachara NE, Akimoto Y, Boyce M, and Hart GW (2022). The O-GlcNAc Modification. In Essentials of Glycobiology, th, Varki A, Cummings RD, Esko JD, Stanley P, Hart GW, Aebi M, Mohnen D, Kinoshita T, Packer NH, et al. , eds. pp. 251–264. 10.1101/glycobiology.4e.19. [DOI] [Google Scholar]
- 11.Fujiki R, Hashiba W, Sekine H, Yokoyama A, Chikanishi T, Ito S, Imai Y, Kim J, He HH, Igarashi K, et al. (2011). GlcNAcylation of histone H2B facilitates its monoubiquitination. Nature 480, 557–560. 10.1038/nature10656. [DOI] [PMC free article] [PubMed] [Google Scholar]
- 12.Lagerlof O, Slocomb JE, Hong I, Aponte Y, Blackshaw S, Hart GW, and Huganir RL (2016). The nutrient sensor OGT in PVN neurons regulates feeding. Science 351, 1293–1296. 10.1126/science.aad5494. [DOI] [PMC free article] [PubMed] [Google Scholar]
- 13.Basu H, Pekkurnaz G, Falk J, Wei W, Chin M, Steen J, and Schwarz TL (2021). FHL2 anchors mitochondria to actin and adapts mitochondrial dynamics to glucose supply. J Cell Biol 220. 10.1083/jcb.201912077. [DOI] [PMC free article] [PubMed] [Google Scholar]
- 14.Ben-Ari Y, and Cossart R (2000). Kainate, a double agent that generates seizures: two decades of progress. Trends Neurosci 23, 580–587. 10.1016/s0166-2236(00)01659-3. [DOI] [PubMed] [Google Scholar]
- 15.Bloss EB, and Hunter RG (2010). Hippocampal kainate receptors. Vitam Horm 82, 167–184. 10.1016/S0083-6729(10)82009-6. [DOI] [PubMed] [Google Scholar]
- 16.Levesque M, and Avoli M (2013). The kainic acid model of temporal lobe epilepsy. Neurosci Biobehav Rev 37, 2887–2899. 10.1016/j.neubiorev.2013.10.011. [DOI] [PMC free article] [PubMed] [Google Scholar]
- 17.Gusel’nikova VV, and Korzhevskiy DE (2015). NeuN As a Neuronal Nuclear Antigen and Neuron Differentiation Marker. Acta Naturae 7, 42–47. [PMC free article] [PubMed] [Google Scholar]
- 18.Liakath-Ali K, and Sudhof TC (2021). The Perils of Navigating Activity-Dependent Alternative Splicing of Neurexins. Front Mol Neurosci 14, 659681. 10.3389/fnmol.2021.659681. [DOI] [PMC free article] [PubMed] [Google Scholar]
- 19.Siebler M, Koller H, Stichel CC, Muller HW, and Freund HJ (1993). Spontaneous activity and recurrent inhibition in cultured hippocampal networks. Synapse 14, 206–213. 10.1002/syn.890140304. [DOI] [PubMed] [Google Scholar]
- 20.Boyer C, Schikorski T, and Stevens CF (1998). Comparison of hippocampal dendritic spines in culture and in brain. J Neurosci 18, 5294–5300. [DOI] [PMC free article] [PubMed] [Google Scholar]
- 21.Valor LM, Charlesworth P, Humphreys L, Anderson CN, and Grant SG (2007). Network activity-independent coordinated gene expression program for synapse assembly. Proc Natl Acad Sci U S A 104, 4658–4663. 10.1073/pnas.0609071104. [DOI] [PMC free article] [PubMed] [Google Scholar]
- 22.Lee WL, and Hablitz JJ (1989). Involvement of non-NMDA receptors in picrotoxin-induced epileptiform activity in the hippocampus. Neurosci Lett 107, 129–134. 10.1016/0304-3940(89)90804-5. [DOI] [PubMed] [Google Scholar]
- 23.Agrawal A, Pekkurnaz G, and Koslover EF (2018). Spatial control of neuronal metabolism through glucose-mediated mitochondrial transport regulation. Elife 7. 10.7554/eLife.40986. [DOI] [PMC free article] [PubMed] [Google Scholar]
- 24.Costes SV, Daelemans D, Cho EH, Dobbin Z, Pavlakis G, and Lockett S (2004). Automatic and quantitative measurement of protein-protein colocalization in live cells. Biophys J 86, 3993–4003. 10.1529/biophysj.103.038422. [DOI] [PMC free article] [PubMed] [Google Scholar]
- 25.Aaron JS, Taylor AB, and Chew TL (2018). Image co-localization - co-occurrence versus correlation. J Cell Sci 131. 10.1242/jcs.211847. [DOI] [PubMed] [Google Scholar]
- 26.Koberstein JN, Stewart ML, Smith CB, Tarasov AI, Ashcroft FM, Stork PJS, and Goodman RH (2022). Monitoring glycolytic dynamics in single cells using a fluorescent biosensor for fructose 1,6-bisphosphate. Proc Natl Acad Sci U S A 119, e2204407119. 10.1073/pnas.2204407119. [DOI] [PMC free article] [PubMed] [Google Scholar]
- 27.Khidekel N, Ficarro SB, Clark PM, Bryan MC, Swaney DL, Rexach JE, Sun YE, Coon JJ, Peters EC, and Hsieh-Wilson LC (2007). Probing the dynamics of O-GlcNAc glycosylation in the brain using quantitative proteomics. Nat Chem Biol 3, 339–348. 10.1038/nchembio881. [DOI] [PubMed] [Google Scholar]
- 28.Fecher C, Trovo L, Muller SA, Snaidero N, Wettmarshausen J, Heink S, Ortiz O, Wagner I, Kuhn R, Hartmann J, et al. (2019). Cell-type-specific profiling of brain mitochondria reveals functional and molecular diversity. Nat Neurosci 22, 1731–1742. 10.1038/s41593-019-0479-z. [DOI] [PubMed] [Google Scholar]
- 29.Rath S, Sharma R, Gupta R, Ast T, Chan C, Durham TJ, Goodman RP, Grabarek Z, Haas ME, Hung WHW, et al. (2021). MitoCarta3.0: an updated mitochondrial proteome now with sub-organelle localization and pathway annotations. Nucleic Acids Res 49, D1541–D1547. 10.1093/nar/gkaa1011. [DOI] [PMC free article] [PubMed] [Google Scholar]
- 30.Smith AC, and Robinson AJ (2019). MitoMiner v4.0: an updated database of mitochondrial localization evidence, phenotypes and diseases. Nucleic Acids Res 47, D1225–D1228. 10.1093/nar/gky1072. [DOI] [PMC free article] [PubMed] [Google Scholar]
- 31.Malard F, Wulff-Fuentes E, Berendt RR, Didier G, and Olivier-Van Stichelen S (2021). Automatization and self-maintenance of the O-GlcNAcome catalog: a smart scientific database. Database (Oxford) 2021. 10.1093/database/baab039. [DOI] [PMC free article] [PubMed] [Google Scholar]
- 32.Wang Z, Gucek M, and Hart GW (2008). Cross-talk between GlcNAcylation and phosphorylation: site-specific phosphorylation dynamics in response to globally elevated O-GlcNAc. Proc Natl Acad Sci U S A 105, 13793–13798. 10.1073/pnas.0806216105. [DOI] [PMC free article] [PubMed] [Google Scholar]
- 33.Kreppel LK, Blomberg MA, and Hart GW (1997). Dynamic glycosylation of nuclear and cytosolic proteins. Cloning and characterization of a unique O-GlcNAc transferase with multiple tetratricopeptide repeats. J Biol Chem 272, 9308–9315. 10.1074/jbc.272.14.9308. [DOI] [PubMed] [Google Scholar]
- 34.Trinidad JC, Barkan DT, Gulledge BF, Thalhammer A, Sali A, Schoepfer R, and Burlingame AL (2012). Global identification and characterization of both O-GlcNAcylation and phosphorylation at the murine synapse. Mol Cell Proteomics 11, 215–229. 10.1074/mcp.O112.018366. [DOI] [PMC free article] [PubMed] [Google Scholar]
- 35.O’Donnell N, Zachara NE, Hart GW, and Marth JD (2004). Ogt-dependent X-chromosome-linked protein glycosylation is a requisite modification in somatic cell function and embryo viability. Mol Cell Biol 24, 1680–1690. 10.1128/MCB.24.4.1680-1690.2004. [DOI] [PMC free article] [PubMed] [Google Scholar]
- 36.Tallent MK, Varghis N, Skorobogatko Y, Hernandez-Cuebas L, Whelan K, Vocadlo DJ, and Vosseller K (2009). In vivo modulation of O-GlcNAc levels regulates hippocampal synaptic plasticity through interplay with phosphorylation. J Biol Chem 284, 174–181. 10.1074/jbc.M807431200. [DOI] [PubMed] [Google Scholar]
- 37.Rexach JE, Clark PM, Mason DE, Neve RL, Peters EC, and Hsieh-Wilson LC (2012). Dynamic O-GlcNAc modification regulates CREB-mediated gene expression and memory formation. Nat Chem Biol 8, 253–261. 10.1038/nchembio.770. [DOI] [PMC free article] [PubMed] [Google Scholar]
- 38.Liu Y, Li X, Yu Y, Shi J, Liang Z, Run X, Li Y, Dai CL, Grundke-Iqbal I, Iqbal K, et al. (2012). Developmental regulation of protein O-GlcNAcylation, O-GlcNAc transferase, and O-GlcNAcase in mammalian brain. PLoS One 7, e43724. 10.1371/journal.pone.0043724. [DOI] [PMC free article] [PubMed] [Google Scholar]
- 39.Hwang H, and Rhim H (2019). Acutely elevated O-GlcNAcylation suppresses hippocampal activity by modulating both intrinsic and synaptic excitability factors. Sci Rep 9, 7287. 10.1038/s41598-019-43017-9. [DOI] [PMC free article] [PubMed] [Google Scholar]
- 40.Stewart LT, Khan AU, Wang K, Pizarro D, Pati S, Buckingham SC, Olsen ML, Chatham JC, and McMahon LL (2017). Acute Increases in Protein O-GlcNAcylation Dampen Epileptiform Activity in Hippocampus. J Neurosci 37, 8207–8215. 10.1523/JNEUROSCI.0173-16.2017. [DOI] [PMC free article] [PubMed] [Google Scholar]
- 41.Yang YR, Song S, Hwang H, Jung JH, Kim SJ, Yoon S, Hur JH, Park JI, Lee C, Nam D, et al. (2017). Memory and synaptic plasticity are impaired by dysregulated hippocampal O-GlcNAcylation. Sci Rep 7, 44921. 10.1038/srep44921. [DOI] [PMC free article] [PubMed] [Google Scholar]
- 42.Agostini M, Romeo F, Inoue S, Niklison-Chirou MV, Elia AJ, Dinsdale D, Morone N, Knight RA, Mak TW, and Melino G (2016). Metabolic reprogramming during neuronal differentiation. Cell Death Differ 23, 1502–1514. 10.1038/cdd.2016.36. [DOI] [PMC free article] [PubMed] [Google Scholar]
- 43.Zheng X, Boyer L, Jin M, Mertens J, Kim Y, Ma L, Ma L, Hamm M, Gage FH, and Hunter T (2016). Metabolic reprogramming during neuronal differentiation from aerobic glycolysis to neuronal oxidative phosphorylation. Elife 5. 10.7554/eLife.13374. [DOI] [PMC free article] [PubMed] [Google Scholar]
- 44.Bisnett BJ, Condon BM, Linhart NA, Lamb CH, Huynh DT, Bai J, Smith TJ, Hu J, Georgiou GR, and Boyce M (2021). Evidence for nutrient-dependent regulation of the COPII coat by O-GlcNAcylation. Glycobiology 31, 1102–1120. 10.1093/glycob/cwab055. [DOI] [PMC free article] [PubMed] [Google Scholar]
- 45.Cho HJ, and Mook-Jung I (2018). O-GlcNAcylation regulates endoplasmic reticulum exit sites through Sec31A modification in conventional secretory pathway. FASEB J 32, 4641–4657. 10.1096/fj.201701523R. [DOI] [PubMed] [Google Scholar]
- 46.Cox NJ, Unlu G, Bisnett BJ, Meister TR, Condon BM, Luo PM, Smith TJ, Hanna M, Chhetri A, Soderblom EJ, et al. (2018). Dynamic Glycosylation Governs the Vertebrate COPII Protein Trafficking Pathway. Biochemistry 57, 91–107. 10.1021/acs.biochem.7b00870. [DOI] [PMC free article] [PubMed] [Google Scholar]
- 47.Dudognon P, Maeder-Garavaglia C, Carpentier JL, and Paccaud JP (2004). Regulation of a COPII component by cytosolic O-glycosylation during mitosis. FEBS Lett 561, 44–50. 10.1016/S0014-5793(04)00109-7. [DOI] [PubMed] [Google Scholar]
- 48.Love DC, Kochan J, Cathey RL, Shin SH, and Hanover JA (2003). Mitochondrial and nucleocytoplasmic targeting of O-linked GlcNAc transferase. J Cell Sci 116, 647–654. 10.1242/jcs.00246. [DOI] [PubMed] [Google Scholar]
- 49.Sacoman JL, Dagda RY, Burnham-Marusich AR, Dagda RK, and Berninsone PM (2017). Mitochondrial O-GlcNAc Transferase (mOGT) Regulates Mitochondrial Structure, Function, and Survival in HeLa Cells. J Biol Chem 292, 4499–4518. 10.1074/jbc.M116.726752. [DOI] [PMC free article] [PubMed] [Google Scholar]
- 50.Trapannone R, Mariappa D, Ferenbach AT, and van Aalten DM (2016). Nucleocytoplasmic human O-GlcNAc transferase is sufficient for O-GlcNAcylation of mitochondrial proteins. Biochem J 473, 1693–1702. 10.1042/BCJ20160092. [DOI] [PMC free article] [PubMed] [Google Scholar]
- 51.Banerjee PS, Ma J, and Hart GW (2015). Diabetes-associated dysregulation of O-GlcNAcylation in rat cardiac mitochondria. Proc Natl Acad Sci U S A 112, 6050–6055. 10.1073/pnas.1424017112. [DOI] [PMC free article] [PubMed] [Google Scholar]
- 52.Pagesy P, Bouaboud A, Feng Z, Hulin P, and Issad T (2022). Short O-GlcNAcase Is Targeted to the Mitochondria and Regulates Mitochondrial Reactive Oxygen Species Level. Cells 11. 10.3390/cells11111827. [DOI] [PMC free article] [PubMed] [Google Scholar]
- 53.Dontaine J, Bouali A, Daussin F, Bultot L, Vertommen D, Martin M, Rathagirishnan R, Cuillerier A, Horman S, Beauloye C, et al. (2022). The intra-mitochondrial O-GlcNAcylation system rapidly modulates OXPHOS function and ROS release in the heart. Commun Biol 5, 349. 10.1038/s42003-022-03282-3. [DOI] [PMC free article] [PubMed] [Google Scholar]
- 54.Liesa M, and Shirihai OS (2013). Mitochondrial dynamics in the regulation of nutrient utilization and energy expenditure. Cell Metab 17, 491–506. 10.1016/j.cmet.2013.03.002. [DOI] [PMC free article] [PubMed] [Google Scholar]
- 55.Ashrafi G, de Juan-Sanz J, Farrell RJ, and Ryan TA (2020). Molecular Tuning of the Axonal Mitochondrial Ca(2+) Uniporter Ensures Metabolic Flexibility of Neurotransmission. Neuron 105, 678–687 e675. 10.1016/j.neuron.2019.11.020. [DOI] [PMC free article] [PubMed] [Google Scholar]
- 56.Zampese E, Wokosin DL, Gonzalez-Rodriguez P, Guzman JN, Tkatch T, Kondapalli J, Surmeier WC, D’Alessandro KB, De Stefani D, Rizzuto R, et al. (2022). Ca(2+) channels couple spiking to mitochondrial metabolism in substantia nigra dopaminergic neurons. Sci Adv 8, eabp8701. 10.1126/sciadv.abp8701. [DOI] [PMC free article] [PubMed] [Google Scholar]
- 57.Diaz-Garcia CM, Meyer DJ, Nathwani N, Rahman M, Martinez-Francois JR, and Yellen G (2021). The distinct roles of calcium in rapid control of neuronal glycolysis and the tricarboxylic acid cycle. Elife 10. 10.7554/eLife.64821. [DOI] [PMC free article] [PubMed] [Google Scholar]
- 58.Baeza-Lehnert F, Saab AS, Gutierrez R, Larenas V, Diaz E, Horn M, Vargas M, Hosli L, Stobart J, Hirrlinger J, et al. (2019). Non-Canonical Control of Neuronal Energy Status by the Na(+) Pump. Cell Metab 29, 668–680 e664. 10.1016/j.cmet.2018.11.005. [DOI] [PubMed] [Google Scholar]
- 59.Gimenez-Cassina A, Martinez-Francois JR, Fisher JK, Szlyk B, Polak K, Wiwczar J, Tanner GR, Lutas A, Yellen G, and Danial NN (2012). BAD-dependent regulation of fuel metabolism and K(ATP) channel activity confers resistance to epileptic seizures. Neuron 74, 719–730. 10.1016/j.neuron.2012.03.032. [DOI] [PMC free article] [PubMed] [Google Scholar]
- 60.Divakaruni AS, Wallace M, Buren C, Martyniuk K, Andreyev AY, Li E, Fields JA, Cordes T, Reynolds IJ, Bloodgood BL, et al. (2017). Inhibition of the mitochondrial pyruvate carrier protects from excitotoxic neuronal death. J Cell Biol 216, 1091–1105. 10.1083/jcb.201612067. [DOI] [PMC free article] [PubMed] [Google Scholar]
- 61.Tiwari A, Hashemiaghdam A, Laramie MA, Maschi D, Haddad T, Stunault MI, Bergom C, Javaheri A, Klyachko V, and Ashrafi G (2024). Sirtuin3 ensures the metabolic plasticity of neurotransmission during glucose deprivation. J Cell Biol 223. 10.1083/jcb.202305048. [DOI] [PMC free article] [PubMed] [Google Scholar]
- 62.Liu F, Shi J, Tanimukai H, Gu J, Gu J, Grundke-Iqbal I, Iqbal K, and Gong CX (2009). Reduced O-GlcNAcylation links lower brain glucose metabolism and tau pathology in Alzheimer’s disease. Brain 132, 1820–1832. 10.1093/brain/awp099. [DOI] [PMC free article] [PubMed] [Google Scholar]
- 63.Wang AC, Jensen EH, Rexach JE, Vinters HV, and Hsieh-Wilson LC (2016). Loss of O-GlcNAc glycosylation in forebrain excitatory neurons induces neurodegeneration. Proc Natl Acad Sci U S A 113, 15120–15125. 10.1073/pnas.1606899113. [DOI] [PMC free article] [PubMed] [Google Scholar]
- 64.Balana AT, and Pratt MR (2021). Mechanistic roles for altered O-GlcNAcylation in neurodegenerative disorders. Biochem J 478, 2733–2758. 10.1042/BCJ20200609. [DOI] [PMC free article] [PubMed] [Google Scholar]
- 65.Marotta NP, Lin YH, Lewis YE, Ambroso MR, Zaro BW, Roth MT, Arnold DB, Langen R, and Pratt MR (2015). O-GlcNAc modification blocks the aggregation and toxicity of the protein alpha-synuclein associated with Parkinson’s disease. Nat Chem 7, 913–920. 10.1038/nchem.2361. [DOI] [PMC free article] [PubMed] [Google Scholar]
- 66.Grima JC, Daigle JG, Arbez N, Cunningham KC, Zhang K, Ochaba J, Geater C, Morozko E, Stocksdale J, Glatzer JC, et al. (2017). Mutant Huntingtin Disrupts the Nuclear Pore Complex. Neuron 94, 93–107 e106. 10.1016/j.neuron.2017.03.023. [DOI] [PMC free article] [PubMed] [Google Scholar]
- 67.Park J, Ha HJ, Chung ES, Baek SH, Cho Y, Kim HK, Han J, Sul JH, Lee J, Kim E, et al. (2021). O-GlcNAcylation ameliorates the pathological manifestations of Alzheimer’s disease by inhibiting necroptosis. Sci Adv 7. 10.1126/sciadv.abd3207. [DOI] [PMC free article] [PubMed] [Google Scholar]
- 68.Sanchez RG, Parrish RR, Rich M, Webb WM, Lockhart RM, Nakao K, Ianov L, Buckingham SC, Broadwater DR, Jenkins A, et al. (2019). Human and rodent temporal lobe epilepsy is characterized by changes in O-GlcNAc homeostasis that can be reversed to dampen epileptiform activity. Neurobiol Dis 124, 531–543. 10.1016/j.nbd.2019.01.001. [DOI] [PMC free article] [PubMed] [Google Scholar]
- 69.Wheatley EG, Albarran E, White CW 3rd, Bieri G, Sanchez-Diaz C, Pratt K, Snethlage CE, Ding JB, and Villeda SA (2019). Neuronal O-GlcNAcylation Improves Cognitive Function in the Aged Mouse Brain. Curr Biol 29, 3359–3369 e3354. 10.1016/j.cub.2019.08.003. [DOI] [PMC free article] [PubMed] [Google Scholar]
- 70.Lagerlof O, Hart GW, and Huganir RL (2017). O-GlcNAc transferase regulates excitatory synapse maturity. Proc Natl Acad Sci U S A 114, 1684–1689. 10.1073/pnas.1621367114. [DOI] [PMC free article] [PubMed] [Google Scholar]
- 71.Nie D, and Sahin M (2012). A genetic model to dissect the role of Tsc-mTORC1 in neuronal cultures. Methods Mol Biol 821, 393–405. 10.1007/978-1-61779-430-8_25. [DOI] [PubMed] [Google Scholar]
- 72.Ashrafi G, Schlehe JS, LaVoie MJ, and Schwarz TL (2014). Mitophagy of damaged mitochondria occurs locally in distal neuronal axons and requires PINK1 and Parkin. J Cell Biol 206, 655–670. 10.1083/jcb.201401070. [DOI] [PMC free article] [PubMed] [Google Scholar]
- 73.Chen TW, Wardill TJ, Sun Y, Pulver SR, Renninger SL, Baohan A, Schreiter ER, Kerr RA, Orger MB, Jayaraman V, et al. (2013). Ultrasensitive fluorescent proteins for imaging neuronal activity. Nature 499, 295–300. 10.1038/nature12354. [DOI] [PMC free article] [PubMed] [Google Scholar]
- 74.Lobas MA, Tao R, Nagai J, Kronschlager MT, Borden PM, Marvin JS, Looger LL, and Khakh BS (2019). A genetically encoded single-wavelength sensor for imaging cytosolic and cell surface ATP. Nat Commun 10, 711. 10.1038/s41467-019-08441-5. [DOI] [PMC free article] [PubMed] [Google Scholar]
- 75.Levine ZG, Potter SC, Joiner CM, Fei GQ, Nabet B, Sonnett M, Zachara NE, Gray NS, Paulo JA, and Walker S (2021). Mammalian cell proliferation requires noncatalytic functions of O-GlcNAc transferase. Proc Natl Acad Sci U S A 118. 10.1073/pnas.2016778118. [DOI] [PMC free article] [PubMed] [Google Scholar]
- 76.Racine RJ (1972). Modification of seizure activity by electrical stimulation. II. Motor seizure. Electroencephalogr Clin Neurophysiol 32, 281–294. 10.1016/0013-4694(72)90177-0. [DOI] [PubMed] [Google Scholar]
- 77.Schindelin J, Arganda-Carreras I, Frise E, Kaynig V, Longair M, Pietzsch T, Preibisch S, Rueden C, Saalfeld S, Schmid B, et al. (2012). Fiji: an open-source platform for biological-image analysis. Nat Methods 9, 676–682. 10.1038/nmeth.2019. [DOI] [PMC free article] [PubMed] [Google Scholar]
- 78.Bateup HS, Johnson CA, Denefrio CL, Saulnier JL, Kornacker K, and Sabatini BL (2013). Excitatory/inhibitory synaptic imbalance leads to hippocampal hyperexcitability in mouse models of tuberous sclerosis. Neuron 78, 510–522. 10.1016/j.neuron.2013.03.017. [DOI] [PMC free article] [PubMed] [Google Scholar]
- 79.Stowers RS, Megeath LJ, Gorska-Andrzejak J, Meinertzhagen IA, and Schwarz TL (2002). Axonal transport of mitochondria to synapses depends on milton, a novel Drosophila protein. Neuron 36, 1063–1077. 10.1016/s0896-6273(02)01094-2. [DOI] [PubMed] [Google Scholar]
- 80.Lewis TL Jr., Kwon SK, Lee A, Shaw R, and Polleux F (2018). MFF-dependent mitochondrial fission regulates presynaptic release and axon branching by limiting axonal mitochondria size. Nat Commun 9, 5008. 10.1038/s41467-018-07416-2. [DOI] [PMC free article] [PubMed] [Google Scholar]
- 81.Beaudoin GM 3rd, Lee SH, Singh D, Yuan Y, Ng YG, Reichardt LF, and Arikkath J (2012). Culturing pyramidal neurons from the early postnatal mouse hippocampus and cortex. Nat Protoc 7, 1741–1754. 10.1038/nprot.2012.099. [DOI] [PubMed] [Google Scholar]
- 82.Marshall S, Okuyama R, and Rumberger JM (2005). Turnover and characterization of UDP-N-acetylglucosaminyl transferase in a stably transfected HeLa cell line. Biochem Biophys Res Commun 332, 263–270. 10.1016/j.bbrc.2005.04.122. [DOI] [PubMed] [Google Scholar]
- 83.Divakaruni AS, Paradyse A, Ferrick DA, Murphy AN, and Jastroch M (2014). Analysis and interpretation of microplate-based oxygen consumption and pH data. Methods Enzymol 547, 309–354. 10.1016/B978-0-12-801415-8.00016-3. [DOI] [PubMed] [Google Scholar]
- 84.Shevchenko A, Wilm M, Vorm O, and Mann M (1996). Mass spectrometric sequencing of proteins silver-stained polyacrylamide gels. Anal Chem 68, 850–858. 10.1021/ac950914h. [DOI] [PubMed] [Google Scholar]
- 85.Cox J, Hein MY, Luber CA, Paron I, Nagaraj N, and Mann M (2014). Accurate proteome-wide label-free quantification by delayed normalization and maximal peptide ratio extraction, termed MaxLFQ. Mol Cell Proteomics 13, 2513–2526. 10.1074/mcp.M113.031591. [DOI] [PMC free article] [PubMed] [Google Scholar]
- 86.Tyanova S, Temu T, Sinitcyn P, Carlson A, Hein MY, Geiger T, Mann M, and Cox J (2016). The Perseus computational platform for comprehensive analysis of (prote)omics data. Nat Methods 13, 731–740. 10.1038/nmeth.3901. [DOI] [PubMed] [Google Scholar]
- 87.Ritchie ME, Phipson B, Wu D, Hu Y, Law CW, Shi W, and Smyth GK (2015). limma powers differential expression analyses for RNA-sequencing and microarray studies. Nucleic Acids Res 43, e47. 10.1093/nar/gkv007. [DOI] [PMC free article] [PubMed] [Google Scholar]
- 88.Wickham H (2016). ggplot2: Elegant Graphics for Data Analysis. Use R! [Google Scholar]
- 89.Wulff-Fuentes E, Berendt RR, Massman L, Danner L, Malard F, Vora J, Kahsay R, and Olivier-Van Stichelen S (2021). The human O-GlcNAcome database and meta-analysis. Sci Data 8, 25. 10.1038/s41597-021-00810-4. [DOI] [PMC free article] [PubMed] [Google Scholar]
- 90.Kolberg L, Raudvere U, Kuzmin I, Vilo J, and Peterson H (2020). gprofiler2 -- an R package for gene list functional enrichment analysis and namespace conversion toolset g:Profiler. F1000Res 9. 10.12688/f1000research.24956.2. [DOI] [PMC free article] [PubMed] [Google Scholar]
- 91.Raudvere U, Kolberg L, Kuzmin I, Arak T, Adler P, Peterson H, and Vilo J (2019). g:Profiler: a web server for functional enrichment analysis and conversions of gene lists (2019 update). Nucleic Acids Res 47, W191–W198. 10.1093/nar/gkz369. [DOI] [PMC free article] [PubMed] [Google Scholar]
- 92.Szklarczyk D, Gable AL, Nastou KC, Lyon D, Kirsch R, Pyysalo S, Doncheva NT, Legeay M, Fang T, Bork P, et al. (2021). The STRING database in 2021: customizable protein-protein networks, and functional characterization of user-uploaded gene/measurement sets. Nucleic Acids Res 49, D605–D612. 10.1093/nar/gkaa1074. [DOI] [PMC free article] [PubMed] [Google Scholar]
- 93.Shannon P, Markiel A, Ozier O, Baliga NS, Wang JT, Ramage D, Amin N, Schwikowski B, and Ideker T (2003). Cytoscape: a software environment for integrated models of biomolecular interaction networks. Genome Res 13, 2498–2504. 10.1101/gr.1239303. [DOI] [PMC free article] [PubMed] [Google Scholar]
- 94.Mertins P, Tang LC, Krug K, Clark DJ, Gritsenko MA, Chen L, Clauser KR, Clauss TR, Shah P, Gillette MA, et al. (2018). Reproducible workflow for multiplexed deep-scale proteome and phosphoproteome analysis of tumor tissues by liquid chromatography-mass spectrometry. Nat Protoc 13, 1632–1661. 10.1038/s41596-018-0006-9. [DOI] [PMC free article] [PubMed] [Google Scholar]
- 95.Myers SA, Rhoads A, Cocco AR, Peckner R, Haber AL, Schweitzer LD, Krug K, Mani DR, Clauser KR, Rozenblatt-Rosen O, et al. (2019). Streamlined Protocol for Deep Proteomic Profiling of FAC-sorted Cells and Its Application to Freshly Isolated Murine Immune Cells. Mol Cell Proteomics 18, 995–1009. 10.1074/mcp.RA118.001259. [DOI] [PMC free article] [PubMed] [Google Scholar]
- 96.Szklarczyk D, Franceschini A, Wyder S, Forslund K, Heller D, Huerta-Cepas J, Simonovic M, Roth A, Santos A, Tsafou KP, et al. (2015). STRING v10: protein-protein interaction networks, integrated over the tree of life. Nucleic Acids Res 43, D447–452. 10.1093/nar/gku1003. [DOI] [PMC free article] [PubMed] [Google Scholar]
Associated Data
This section collects any data citations, data availability statements, or supplementary materials included in this article.
Supplementary Materials
Table S1. Mitochondrial Proteomics Data, Related to Figure 6.
Table S2. Total Proteomics Data, Related to Figure 6.
Data Availability Statement
Proteomics data are provided in Supplementary Tables S1 and S2. The data analysis code is available at DOI: 10.5281/zenodo.11111253. Agilent Seahorse XF96e Metabolic Flux Analyzer data normalization is performed via the custom-written macro “FluxNormalyzer”, available at DOI: 10.5281/zenodo.11111133. Any additional information required to reanalyze the data reported in this paper is available from the lead contact upon request.