

Abstract
The FRG1(FSHD region gene 1) gene has emerged as a pivotal tumor suppressor in both breast and prostate cancer. HPF1 (Histone PARylation Factor 1), a gene crucial in the base excision repair (BER) mechanism for single-stranded DNA (ssDNA) lesions, showcases a robust correlation with FRG1. This implies that FRG1 might have the capacity to influence BER via HPF1, potentially playing a role in tumorigenesis. Using a comprehensive approach that integrates in-silico analyses involving differential gene expression, KEGG (Kyoto Encyclopedia of Genes and Genomes), GO (Gene Ontology), and STRING (Search Tool for the Retrieval of Interacting Genes/Proteins) databases, we unravelled the intricate network of genes and pathways influenced by FRG1, which includes BER. Our linear regression analysis unveiled a positive relationship between FRG1 and key genes crucial for BER. Notably, breast cancer patients with low FRG1 expression exhibited a significantly higher frequency of mutation in TP53. To enhance the accuracy of our analysis, we conducted qRT-PCR assays, which demonstrated that FRG1 affects the transcription of DNA base excision repair genes, showing differential expression in breast cancer cells. Moreover, through the Alkaline Comet Assay, a technique that quantifies DNA damage at the single-cell level, we observed diminished DNA repair capabilities when FRG1 levels are low. Risk scores were calculated using the Cox regression coefficients, and we found notable differences in Overall Survival (OS) and mRNA expression of DEGs in the low and high-risk groups. In summary, our findings shed light on the pivotal role of FRG1 in maintaining DNA repair efficiency within breast cancer cells.
Subject terms: Cancer, Cell biology
Introduction
FSHD Region Gene 1 (FRG1) has been identified as a tumor suppressor due to its reduced expression in various cancer types, including colorectal, oral, prostate, breast, and gastric cancer1,2. The expression level of FRG1 has a significant impact on crucial cancer-related processes such as angiogenesis, cell proliferation, invasion, and migration in different cancer cell lines3,4. In MCF7, MDA-MB-231, DU145, and PC3 cells, a decrease in FRG1 expression led to an increase in cell migration and tumor progression1,5. In breast cancer cells, FRG1 has been established as a transcriptional repressor of GM-CSF, affecting the MEK-ERK pathway and downstream markers associated with epithelial-mesenchymal transition, including Snail, Slug, and Twist2.
Remarkably, a recent study spanning seven cancer types revealed that HPF1, RPL34, and EXOSC9 were the most commonly found genes in pathways associated with FRG16. Further analysis of TCGA datasets demonstrated that HPF1 exhibits the strongest correlation with FRG1 in various cancers, including breast, prostate, lung, liver, colorectal, stomach, cervix uteri, and many others (Table 1). This suggests the possibility of a direct or indirect regulatory relationship between FRG1 and HPF1. HPF1 plays a vital role in repairing single-stranded DNA lesions, and the absence of HPF1 sensitizes cells to DNA-damaging agents7–10. Both exogenous and endogenous damaging agents pose a threat to cellular DNA, causing single-stranded breaks that are recognized by the PARP1-HPF1 complex and other repair genes, ultimately corrected through the base excision repair pathway11–13. If damaged DNA is left unrepaired, the resulting genomic abnormalities can be passed on to subsequent generations, potentially leading to harmful mutations and the development of cancer14–17. Consequently, we hypothesized that changes in FRG1 expression might affect HPF1 and, by extension, the DNA single-strand repair pathway.
Table 1.
Correlation values of HPF1 with FRG1 among tissue types.
| Cancer types | Spearman’s correlation |
|---|---|
| Breast | 0.526 |
| CNS/Brain | 0.805 |
| Cervix Uteri | 0.689 |
| Lung | 0.683 |
| Liver | 0.605 |
| Kidney | 0.647 |
| Stomach | 0.637 |
| Prostate | 0.641 |
In this study, we have identified differentially expressed genes (DEGs) in groups with high and low FRG1 expression levels. Subsequently, we have conducted an in-depth analysis of the pathways in which these DEGs are involved. Our findings have been further checked in tissue samples from GTEx to find the correlation between FRG1 and DNA repair genes. To validate the findings of the in-silico analysis, we performed qRT-PCR and Chromatin immunoprecipitation (ChIP)-qRT-PCR experiments. Additionally, we evaluated the impact of FRG1 expression on DNA repair using the alkaline comet assay. In summary, our study has elucidated the critical role of FRG1 in the DNA repair pathway and has explored its influence on the transcript levels of repair genes in breast cancer cells.
Materials and methods
Plasmid constructs
The vectors for the knockdown of FRG1 (pLKO.1-FRG1sh) and its control (pLKO.1-FRG1-Sc) were purchased from Sigma, USA. The vector amount was amplified in E. coli-DH5α and isolated using Plasmid Mini Kit (Qiagen, USA) following the manufacturer’s protocol. The purity of plasmids was checked using NanoDrop one spectrophotometer (Thermo Fisher Scientific, USA).
Cell culture, cell lines, and transfection
MCF7 and T47D cell lines were procured from National Centre for Cell Science (NCCS), India. Cells were grown in DMEM and RPMI (Himedia, India), both with 10% Fetal Bovine Serum (Himedia, India) and 1X PSA (Penicillium-Streptomycin-Amphotericin) at 37 °C with 5% CO2. FRG1 knockdown vector and control vector were transfected into the MCF7 cells in a 12-well plate (Biofil, Canada) using Lipofectamine 3000 (Invitrogen, USA) to carry out transfection following the manufacturer’s guidelines. After 48 h of transfection, MCF7 cells were selected using 1 μg/ml puromycin antibiotic. Single cell-derived colonies were picked, and a reduction in FRG1 level was confirmed using Western blot and qRT-PCR18. T47D cells were seeded in a 6-well plate (Biofil, Canada) and transfected with FRG1 knockdown vector and control vectors using Lipofectamine 3000 (Invitrogen, USA) according to the manufacturer’s instructions. Seventy-two hours post-transfection, the cells were harvested for experimentation.
Acquisition of RNA-Seq data
The gene expression data for breast cancer were acquired from the Genomic Data Commons (GDC) Data Portal on 31-01-202319. Data sets were obtained using the following selection criteria; Primary site: Cancer Type (Breast), Program: TCGA, Data Category: Transcriptome Profiling, Experimental Strategy: RNA-Seq, Data type: Gene Expression Quantification, Workflow: STAR—Counts FPKM-Unstranded. Adjacent normal and tumor samples were separated and downloaded with clinical information for further analysis. The Genotype-Tissue Expression (GTEx) data portal was accessed on 25-07-23 and was used to obtain RNA-Seq data of multiple tissues in TPMs20.
Differential gene expression analysis
The gene expression data acquired from the GDC were segregated into tumor and adjacent normal tissue samples. Outliers were excluded from the dataset (Interquartile Range Method); subsequently, the samples were divided into two groups based on their levels of FRG1 expression. This division was achieved through percentile calculations, leading to the selection of samples in the top 5th percentile, which exhibited higher FRG1 levels (FRG1High), and those in the bottom 5th percentile, indicating lower FRG1 levels (FRG1Low). Henceforth, this cohort will be termed as FRG1High-FRG1Low TCGA BRCA dataset. These selected samples were then subjected to further analysis for Differentially Expressed Genes (DEGs). DEG analysis was performed using ‘‘limma’’ and “edgeR” package in R (R version 4.2.2, https://www.r-project. org/.)21–24. We used |log2FC| ≥ 0.5 and P < 0.05 as a cutoff to assign differentially expressed genes. Ebayes (Empirical Bayes Statistics for Differential Expression) was applied along with Benjamini & Hochberg (BH) correction method for the false discovery rate. Heatmap was generated using Morpheus web tool (https://software.broadinstitute.org/morpheus/)25.
Functional enrichment analysis and protein–protein interaction network
The Database for Annotation, Visualization, and Integrated Discovery (DAVID) was used to delineate the functional biological role of DEGs26. Enriched Gene Ontology (GO) and Kyoto Encyclopedia of Genes and Genomes (KEGG) pathway analysis was conducted and visualized using Metascape, and Microsoft Excel27,28,57,58. Pathways enriched by minimum n = 2 (genes) and p-value < 0.05 were selected. Metascape (http://metascape.org/) was used to plot GO-enriched pathways29. The search tool for the Retrieval of Interacting Genes/Proteins (STRING) was used to perform a protein–protein interaction network between genes involved in the base excision repair pathway30.
Acquisition of mutation profiles of TCGA-BRCA patient samples and survival analysis of a distinct set of genes in base excision repair pathway
The Catalogue of Somatic Mutations (COSMIC) database was used to list the most frequently mutated genes in breast cancer31. Mutation data for the selected cohort (FRG1High-FRG1Low TCGA BRCA, Firehose Legacy dataset) were acquired from cBioPortal on 26-07-2332,33.
A Kaplan–Meier plot was generated to compare the overall survival of patients with breast cancer in the TCGA-BRCA cohort. R package “DESeq2”, “survminer” and “survival” was used34. A log-rank test was used to calculate the statistical significance of the difference in survival between the two groups. KM plots were made using ggsurvplot() function. We used the surv_cutpoint() function and plotted using plot() to determine the optimal cut-off point of FRG1, HPF1, and other DNA repair gene expressions for the KM plot.
Alkaline comet assay
Bleomycin was used to induce DNA damage in MCF7 and T47D cells, respectively. Cells were washed and resuspended in phosphate-buffered saline and mixed with low melting agarose (LMPA). The cell suspension was placed above the microscope slides previously precoated with normal melting agarose. Lysis of cells was performed by the incubation of slides overnight in the lysis buffer (pH 10, 2.5 M NaCl, 100 mM EDTA, 10 mM Trizma base, and 1% sodium lauroyl sarcosnite). Alkaline denaturation was performed by dipping slides in alkaline electrophoresis buffer at 4 °C. Electrophoresis was done in 300 mM NaOH with 1 mM EDTA buffer at 25 V. A neutralization buffer (0.4 M Tris, pH 7.5) was used to neutralize the slides. Comet samples were stained with 2 μg/ml Ethidium Bromide (EtBr). Evaluation of comet slides was done using a fluorescence microscope (Olympus). Comets were analysed using OpenComet software and ImageJ35,36.
RNA isolation and quantitative real-time PCR
Total RNA from the cells was extracted following the manufacturer’s guidelines provided in RNeasy Mini Kit (Qiagen, USA). We measured the concentration using NanoDrop one spectrophotometer (Thermo Fisher Scientific, USA). Using Primer-BLAST, RT-PCR primers were designed for selected genes (supplementary table 1)37. cDNA was prepared with one µg of RNA using a Verso cDNA synthesis kit (Thermo Scientific, USA). qRT-PCR was performed using required primers with 20 ng of cDNA, and Fast Start Universal 2 × SYBR Green PCR Master Mix (Thermo Fisher Scientific, USA) in ABI 7500 system (Applied Biosystems, USA). GAPDH was used as an internal control, and ΔΔCt method was used to calculate the fold change.
Western blot
Cell lysates were prepared from MCF7 FRG1-KD and Control-Sc cell lines using RIPA buffer mixed with a protease-phosphatase inhibitor (Thermo Scientific, USA). We loaded and resolved 30 µg of protein on a 10% SDS-PAGE. The proteins were then transferred onto a PVDF membrane (Millipore, Germany) using a wet transfer electrophoresis system. Blocking was performed with 5% BSA (MP Biomedicals, India), followed by primary antibody incubation for 12 h. Detection was carried out using an HRP-conjugated anti-mouse IgG secondary antibody (Abgenex, India) and chemiluminescence with SuperSignal West Femto Maximum Sensitivity Substrate (Thermo Scientific, USA). The signals were visualized using a Chemidoc XRS + (Bio-Rad, USA).
Chromatin immunoprecipitation assay
Chromatin immunoprecipitation (ChIP) was performed using the ChIP kit (Abcam, USA) following the manufacturer’s protocol. MCF7 wild-type cells were plated in a 100 mm cell culture dish, and 3 million cells were harvested. The cells were resuspended in the provided BufferA/Formaldehyde/PBS mix. To halt the reaction, glycine was added, and the cell pellet was washed with ice-cold PBS. After washing, the cells were lysed with a solution containing PMSF and protease inhibitors to isolate the nuclei. The DNA was sheared to an optimal fragment size of 200–1000 bp using a sonicator. Following reverse cross-linking of the sonicated chromatin, an agarose gel was used to measure the DNA fragment sizes. The samples were then diluted with ChIP Dilution Buffer and incubated overnight at 4 °C with normal rabbit IgG (Cell Signaling Technology, USA) and FRG1 (Abcam, USA). After pelleting, the antibody/chromatin samples were incubated with protein A beads. Subsequently, the antibody, chromatin, and beads were washed, and the DNA was purified using the ChIP kit’s DNA purifying slurry. Finally, 2 μl of the purified DNA from MCF7 cells was used for qRT-PCR analysis with promoter-specific primers for BER genes.
Correlation and survival analysis
Differentially expressed genes of base excision repair pathways were selected to check their expression values from GTEx to perform Pearson’s correlation analysis using SPSS software38 and Microsoft Excel. The correlation between overall survival (OS) and gene expression was analyzed by using multivariate Cox regression in the TCGA BRCA dataset in SPSS. Risk score was calculated as reported previously6.
Results
FRG1 expression affects base excision repair pathway
We downloaded TCGA BRCA patient data from GDC and segregated them into two groups: high FRG1 expression (top 5th percentile) and low FRG1 expression (bottom 5th percentile). To conduct differential gene expression analysis, a comparison was made between FRG1High and FRG1Low groups. Figure 1A illustrates the volcano plot depicting the differentially expressed genes based on both their significance and the magnitude of change in their expressions. Analysis showed 5485 significantly altered genes, where 2295 genes were upregulated, and 3190 were downregulated.
Figure 1.

Identification of DEGs and pathway enrichment analysis. (A) Volcano plot of significantly altered genes, each dot represents a gene. Significantly altered genes are shown in blue dots arranged according to the |log2FC| values. Gene having |log2FC| > 0.5 are upregulated and those having |log2FC| < 0.5 are downregulated. (B) KEGG28,57,58 pathway analysis of DEGs between FRG1 High and low expression groups showing significantly enriched pathways. X-axis represents the number of genes in each of the altered pathways and Y-axis represents the significantly altered pathways. (C) Heatmap of differentially expressed genes (DEGs) in the base excision repair pathway, with Log2FC values indicated on the scale bar. (D) GO analysis of upregulated DEGs between FRG1 high and low expression groups shows enrichment of DNA repair pathway.
KEGG and GO enrichment analyses were conducted to gain insights into potential pathway and biological function alterations caused by changes in FRG1 expression. Figure 1B summarizes the KEGG pathways, revealing alterations in multiple pathways and biological functions, including the base excision repair pathway. The DEGs in the BER pathway (Fig. 1C) include several genes having roles in the critical steps of base excision repair, including PARP ADP ribosylation (HPF1) and DNA glycosylation (MPG, NTHL1, and NEIL2). APEX, PNKP, PCNA, NEIL2, and XRCC1 help in downstream steps associated with the short and long-patch BER13,39,40. Additionally, Metascape analysis of DEGs (Fig. 1D) revealed many GO biological terms for DNA repair or related processes (GO terms: DNA damage response, cellular response to chemical stress, regulation of intrinsic apoptotic signalling pathway, positive regulation of cell death), which strengthens the possibility of FRG1’s role in BER.
Base excision repair pathway genes show a positive correlation with FRG1 across tissue types
Our initial investigation revealed distinct changes in the expression of numerous genes associated with the BER pathway, including HPF1, when comparing high and low FRG1 groups. To substantiate our findings, we procured mRNA expression data for various tissue types in the GTEx database to investigate the relationship between FRG1 and the differentially expressed genes within the BER pathway. We have shown the levels of FRG1 expression in different tissue in the heatmap (Fig. 2A). Breast (33.00 TPM), colon (31.15 TPM), and ovary (35.09 TPM) showed elevated levels of FRG1 as compared to brain (13.16 TPM), heart (10.30 TPM), liver (9.38 TPM), lung (25.86 TPM), muscle (12.54 TPM), kidney (14.47 TPM), and prostate tissue (22.70 TPM). Figure 2B illustrates the results of correlation analysis across multiple tissues using a heatmap. The outcomes of this analysis revealed a substantial positive correlation between FRG1 and these genes across tissue types, which was strongest in the brain, heart, and kidney tissues. This finding provides strong support for our theory that FRG1 likely impacts multiple genes within the BER pathway. As a result, it is plausible that FRG1 plays a role in the repair of DNA single-stranded breaks.
Figure 2.
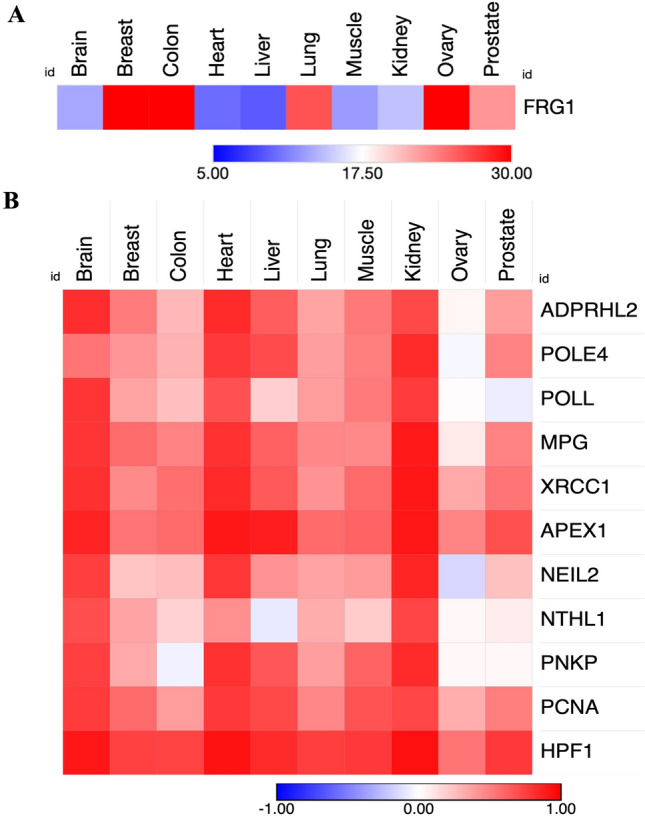
Levels of FRG1 expression in different tissue types and correlation of differentially expressed genes of BER pathway with FRG1 across these tissue types. (A) Heatmap shows the transcripts per million (TPM) values of FRG1 expression levels in different tissue types from GTEx. (B) Heatmap shows the Pearson’s correlation values between FRG1 and the DNA repair genes in various organs [brain (n = 252), breast (n = 252), colon (n = 373), lung (n = 578), liver (n = 226), kidney (n = 85), prostate (n = 245), ovary (n = 180)].
Decreased FRG1 expression reduces transcript levels of BER pathway genes
We employed qRT-PCR to validate our discoveries, aiming to assess how FRG1 influences the transcriptional control of DEGs identified in the BER pathway. To carry out the experiment, we established stable cell lines of MCF7 with reduced FRG1 levels. Subsequent qRT-PCR and Western blot analyses effectively verified the reduction in FRG1 levels (Supplementary Fig. 1).
Upon knocking down FRG1, we observed a significant decrease in transcript levels for the majority of genes (HPF1, PCNA, PARP4, PNKP, NTHL1) associated with the BER pathway (Fig. 3). However, the degree of reduction exhibited variation among these genes. A decrease in gene expression was also observed in other genes (ADPRS, MPG, POLL, NEIL2, APEX, XRCC1, POLE4), but it was not statistically significant. These observations collectively suggest the possibility of FRG1 functioning as a transcriptional regulator for these genes, potentially operating through either direct or indirect mechanisms.
Figure 3.

Validation of expression profiling data using qRT-PCR. qRT-PCR expression data of BER DEGs in MCF7 cells with FRG1 knockdown (FRG1_KD) versus control (Control_Sc). Here, Y-axis shows fold change, X-axis shows the genes. GAPDH was used as an internal control. The experiment was performed in triplicate. Results are presented as mean ± SD. Ns—nonsignificant, *, P ≤ 0.05.
Mutation analysis in the TCGA-BRCA cohort reveals a higher frequency of TP53 mutations in FRG1 low samples
If the expression of FRG1 has an impact on the transcription levels of genes involved in the BER pathway, it could potentially influence the efficiency of the repair process and subsequently affect the mutation rate. To substantiate this hypothesis, we conducted a comparative analysis of mutation frequencies in the top 20 genes that are commonly mutated in breast tissue carcinoma in FRG1Low and FRG1High groups. These mutated genes were PIK3CA (29%), TP53 (27%), CDH1 (12%), ESR1 (8%), GATA3 (11%), KMT2C (12%), MAP3K1 (9%), PTEN (6%), LRP1B (19%), ERBB4 (7%), ZFHX3 (12%), ERBB2 (5%), NF1 (6%), ARID1A (6%), PTPRT (9%), ALK (6%), AKT1 (4%), RUNX1 (5%), GRIN2A (8%), and NCOR1 (6%).
Further, we identified mutation frequency in these 20 genes in our study cohort. Breast cancer samples in the FRG1Low group had 54 mutations compared to 40 mutations in the FRG1High group. Notably, the FRG1Low group showed a strikingly high TP53 mutation frequency compared to the FRG1High group (Fig. 4). No mutations were present in ESR1, PTPRT, ALK, and AKT1 genes. These findings strongly suggest a potential association between FRG1 levels and mutation rates. However, further investigation is imperative to establish a more comprehensive understanding of these observed effects.
Figure 4.

Mutation frequency analysis in FRG1low and FRG1High breast cancer samples. The bar graph shows mutations in the top 20 mutated genes of breast cancer in the FRG1High-FRG1Low TCGA-BRCA dataset. X axis represents the genes, and y axis shows the number of mutations.
Protein–protein interaction network reveals multiple pathways associated with genes involved in the Base excision repair pathway
To find out the possible network by which FRG1 might be regulating transcript levels of BER DEGs, we used Search Tool for the Retrieval of Interacting Genes/Proteins (STRING) where all the BER DEGs along with FRG1 were used as input. To increase network size, we also manually included reported genes connected with FRG1(based on a literature search in PubMed using the terms “Breast cancer” and “FRG1”). A total of 30 genes were provided in the input. PPI network showed the connection of FRG1 with Base-excision repair (gap-filling, AP site formation), Regulation of protein ADP-ribosylation (HPF1, XRCC1, PNKP), Telomere maintenance via semi-conservative replication (UPF1, PCNA), Nuclear-transcribed mRNA catabolic process, nonsense-mediated decay (UPF1, UPF3B, CASC3), RNA localization and mRNA transport (YY1, RBM8A, CASC3, UPF1, UPF3B, MAGOHB), mRNA splicing, via spliceosome (PNN, RBM8A, CASC3, MAGOHB), and Regulation of protein and RNA metabolic processes (YY1, SP1, DUX4, HPF1, EXOSC9, XRCC1, UPF1) (Fig. 5). FRG1 showed direct physical connections with genes HPF1, EXOSC9, RBM8A, DUX4, YY1, and UFSP2, but all of these are not part of the same pathway, which shows as transcriptional regulator FRG1 might affect multiple pathways/cellular functions. Moreover, in BER, FRG1 was mainly connected with HPF1, and HPF1 was connected with other BER genes.
Figure 5.

The STRING PPI network analysis of the BER DEGs. (a) DEGs of the BER pathway and the genes previously found associated with FRG1 were given as input (b) DEGs of the BER pathway, the genes previously found associated with FRG1 along with the top 20 mutated genes in breast cancer were given as input. These diagrams are prepared by using the freely available STRING database, version 11.0 30.
In another set of STRING analyses, in addition to the above-mentioned genes, we also included the top 20 mutated genes (mentioned in the previous section) to figure out the connection of FRG1 leading to the gene mutation via BER genes. Notably, mutated genes TP53, PIK3CA, LRP1B, and KMT2C were directly connected with FRG1. GO terms displayed multiple enriched biological pathways, which included Positive regulation of the nucleobase-containing compound metabolic process, Positive regulation of RNA metabolic process, Regulation of DNA metabolic process, Base-excision repair, AP site formation, mRNA metabolic process, Phosphatidylinositol 3-kinase signaling, Nucleocytoplasmic transport, Response to endogenous stimulus, Response to stress, and Stem cell proliferation.
These results illustrate that FRG1 is associated with numerous biological pathways via transcriptional regulation of multiple genes. Moreover, it can affect mutation frequency by affecting the transcript levels of repair genes.
Alkaline comet assay unveils impaired DNA single-stranded break repair due to reduced FRG1 levels
To substantiate the potential influence of FRG1 on single-stranded DNA damage and repair processes, we conducted an Alkaline Comet Assay41–43. Our results show that MCF7 and T47D cells with FRG1 knock-down have significantly longer tail lengths compared to the control group, as illustrated in Fig. 6 (A,D). The data on tail length and tail moment for both FRG1 knock-down and control samples are presented in Figs. 6 (B,C,E,F). This elongated tail length is indicative of greater DNA damage and nicks within the cells, signifying a diminished capacity for single-stranded DNA repair when FRG1 levels are reduced. The impaired DNA repair could be due to a decrease in the transcriptional level of the genes involved in the pathway.
Figure 6.

Comet Assay showing DNA damage in samples with different FRG1 expression. (A) Fluorescent microscopy images show comets in MCF7 cell lines with FRG1 knock-down (FRG_KD) versus control (Control_Sc). (B) The bar graph compares comet tail lengths in both the sets, where the y-axis denotes length in pixels. (C) The bar graph shows the tail moment in both the groups. (D) Fluorescent microscopy images illustrating comet formations in T47D cell lines with transiently transfected FRG1 knockdown (FRG1_KD) versus the control group (Control_Sc). (E) Bar graph comparing comet tail lengths between the two groups, with the y-axis representing length in pixels. (F) Bar graph showing the tail moment for both groups. All the experiments were conducted in triplicate, and results are presented as mean ± SD. Statistical significance is indicated as follows: ns—non significant, *, P ≤ 0.05.
Direct binding of FRG1 to DNA repair gene promoters identified by ChIP-qRT-PCR
To investigate the direct binding of FRG1 to DNA repair gene promoters, we performed ChIP-qRT-PCR. Chromatin fragments were incubated with either an FRG1 antibody or an IgG antibody (as a negative control). We found that the FRG1 antibody significantly enriched the promoter fragment of the BER gene, indicating FRG1 binding, whereas the IgG antibody did not show such enrichment. Figure 7 illustrates that the genomic region around CTGGG was notably enriched for HPF1, XRCC1, and NTHL1. However, the enrichment for XRCC1 (X-ray repair cross-complementing protein 1) and NTHL1 (Nth Like DNA Glycosylase 1) was less pronounced compared to HPF1, suggesting that FRG1 has a higher binding specificity for HPF1. These results imply that FRG1 may bind to the promoters of several DNA repair genes, including HPF1, XRCC1, and NTHL1, indicating a role in the base excision repair pathway.
Figure 7.

FRG1 binds to the promoter of the DNA repair genes. The bar graph presents the results of a ChIP assay conducted in MCF7 cells, illustrating the enrichment levels (% input) for HPF1, XRCC1, and NTHL1. IgG served as a negative control.
FRG1 and BER gene expression is high in low risk in breast cancer patients
Previously, low FRG1 has been associated with poor prognosis in breast cancer6. Here, we aimed to predict if BER DEGs show a parallel effect on survival. Kaplan-Meir survival analysis was done for HPF1, PCNA, MPG, NTHL1, POLL, APEX1, NEIL2, PNKP, PARP4, XRCC1, POLE4, and ADPRS mRNA expression on the OS in selected TCGA-BRCA samples. We found a better survival probability in the breast cancer patient group having high levels of most of the above-mentioned genes, which is parallel to FRG1. But out of these genes, only ADPRS, NTHL1, PCNA, and XRCC1 showed statistically significant differences in survival. PNKP, POLE4, PARP4, and MPG showed opposite trends for the survival association (Supplementary Fig. 2).
To investigate the combined impact of FRG1 and the correlated BER genes on the OS, Cox regression analysis was performed on the entire TCGA-BRCA cohort (Table 2). Regression coefficients (B) were used to calculate the risk score for each breast cancer patient. The patients were divided into low-risk (n = 616) and high-risk (n = 615) groups based on the median risk score value (-4.45653). There was significantly higher FRG1 mRNA expression in the low-risk group compared to the high-risk group. Most of the BER pathway genes also showed parallel results (Fig. 8) except for HPF1, PARP4, and NEIL2. In sum this data suggests that FRG1 and some of the BER genes may affect breast cancer prognosis negatively.
Table 2.
Covariates present in multivariate Cox regression model in breast cancer patients.
| Genes | B | Sig | Exp(B), 95.0% CI for Exp(B) |
|---|---|---|---|
| HPF1 | 1.191 | 0.065 | 3.291 (0.928, 11.672) |
| ADPRS | − 0.754 | 0.132 | 0.471 (0.177, 1.254) |
| POLE4 | 0.104 | 0.799 | 1.110 (0.499, 2.470) |
| POLL | − 0.005 | 0.994 | 0.995 (0.329, 3.012) |
| MPG | − 0.551 | 0.332 | 0.577 (0.190, 1.752) |
| XRCC1 | − 1.147 | 0.068 | 0.318 (0.093, 1.086) |
| APEX1 | − 0.776 | 0.196 | 0.460 (0.142, 1.491) |
| NEIL2 | 0.131 | 0.739 | 1.140 (0.529, 2.457) |
| NTHL1 | 0.717 | 0.103 | 2.049 (0.865 , 4.855) |
| PNKP | -0.360 | 0.536 | 0.697 (0.223, 2.186) |
| PCNA | -0.366 | 0.314 | 0.694 (0.340, 1.414) |
| PARP4 | -0.178 | 0.647 | 0.837 (0.391, 1.793) |
| FRG1 | -0.922 | 0.210 | 0.398 (0.094, 1.679) |
Figure 8.

Expression levels of FRG1 and BER in breast cancer patients from low and high-risk groups. Risk scores were d Heatmap shows the transcripts per million (TPM) values of FRG1 expression levels in different tissue types from GTEx. derived from Cox regression coefficients (calculated in the TCGA-BRCA dataset) based on FRG1 and BER DEGs. The bar graph shows the log of gene expression levels in high and low-risk groups. The Y-axis represents the log of gene expression, and the X-axis shows the group and gene name. ns –nonsignificant, ****, P ≤ 0.00005.
Discussion
FRG1, originally associated with the muscle-related disease FSHD, has emerged as a significant player in cancer biology, particularly in breast cancer4,44–46. In this study, we delved into the multifaceted role of FRG1 in DNA repair pathways and its implications for breast cancer. Our previous research explored its impact on critical cancer-related processes, such as angiogenesis, invasion, migration, and cell proliferation, underscoring its significance in cancer progression3. Notably, the downregulation of FRG1 resulted in increased expression of GM-CSF, PLGF, CXCL1, PDGFA, and MMPs, crucial for cell migration and tumor advancement, and its role as a transcriptional repressor of GM-CSF in breast cancer cells was highlighted2. Our previous study revealed its strong correlation with HPF1, a nuclear-localized protein that interacts with PARP1 and is engaged in DNA single-stranded repair via controlling PARP1 activity8,47. In this study, we identified a substantial number of differentially expressed genes in response to varying levels of FRG1 expression. The enrichment of DNA repair-related biological processes and pathways among these DEGs underscores the significance of FRG1 in maintaining genomic integrity. The significant genes playing a role in BER pathways are PARP1, HPF1, PCNA, POLL, XRCC1, POLE4, etc.48,49. The altered expression of genes closely associated with critical steps in base excision repair, such as PARP ADP ribosylation (HPF1), DNA glycosylation (MPG, NTHL1, and NEIL2), short and long patch BER (XRCC1, PCNA) highlights the potential influence of FRG1 on the integrity of the genome50,51. Our final model shows role of FRG1 in BER pathway (Fig. 9).
Figure 9.
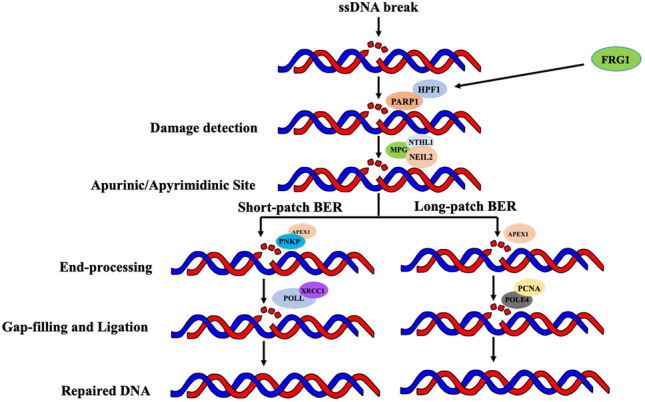
Hypothetical model showing the role of FRG1 in Base excision repair pathway.
Most of the BER pathway genes showed positive log2Fc values except PARP4 when analyzed in the TGCA BRCA dataset, but when we validated it by RT PCR, this gene also showed a positive effect of FRG1. This discrepancy may be attributed to various factors, including potential sequencing artefacts inherent in RNA sequencing, as well as the relatively modest size of the cohort. Overall, this study indicated the role of FRG1 in DNA damage responses (DDR) via transcription regulation of multiple genes associated with the repair pathway, which could be direct or indirect. Previous studies have identified the FRG1 binding site within the “CTGGG” motifs, corroborating FRG1’s role as an hnRNP18. Upon analysis of the promoter region, we observed the presence of FRG1 binding sites in the promoters of numerous (HPF1, XRCC1, PCNA, PNKP, NTHL1, ADPRS, MPG, POLL, NEIL2, APEX, POLE4) BER DEGs52. This suggests the potential for FRG1 to directly influence BER genes’ expression. Moreover, it is plausible that FRG1 may also exert its regulatory influence on other transcription factors such as ATF-1, STAT3, RFX1/EF-C, which are known to govern the expression of a significant portion of BER genes53,54. However, further experiments are warranted to ascertain whether the regulation of BER genes by FRG1 is of a direct or indirect nature.
The expression of FRG1 potentially impacts the mutation frequency in genes via BER. Upon examining mutation frequencies in the top 20 mutated genes associated with breast cancer, we observed a remarkably high mutation frequency in the low FRG1 group. In a prior study2, we elucidated how the reduction of FRG1 triggers the activation of MEK/ERK through GM-CSF, ultimately leading to the inhibition of apoptosis by downregulating TP53 in breast cancer. Furthermore, our research indicates that the FRG1Low group exhibits a higher incidence of mutations in TP53, suggesting a dual level effect of FRG1 on TP53.
In PPI analysis, most of the connections are based on co-expression of transcriptional regulation of FRG1. No alternative pathway for linking FRG1 to BER genes was identified, aside from its role as a transcriptional regulator. Previously, FRG1 has been shown to affect transcript levels of HPF16. HPF1 is an important player in the DDR as it facilitates the histone PARylation along with PARP1, thereby helping in the repair of damaged DNA along with other repair genes8. The catalytic activity of HPF1-PARP1/2 is counteracted by ADPRS (ARH2), which provides an additional layer of complexity to the ADP-ribosylation processes55. Also, HPF1-PARP1 activation promotes LIG3-XRCC1 mediated ligation of Okazaki fragments56. Literature suggests that HPF1 also regulates other repair genes in multiple biological processes, which implies that FRG1 is regulating HPF1, and HPF1 might be affecting others, but experimental validation is required.
The results of survival analysis revealed a less favourable prognosis among patients exhibiting low levels of FRG1 expression. This pattern was consistently observed across the majority of BER genes as well. An analysis employing a risk score approach, which reflects the cumulative impact of all genes incorporated in a Cox regression analysis, revealed that samples categorized as low-risk exhibited elevated mRNA expression levels of FRG1 and several other BER DEGs. This finding suggests a potential protective function of FRG1 in OS, aligning with its previously documented role as a tumor suppressor2. Interestingly, HPF1 levels were low in low-risk group. Our extensive data analysis reveals a consistent and robust positive correlation between FRG1 and HPF1 across various levels. We found a positive correlation between HPF1 and FRG1 across cancer types. Moreover, normal tissue samples from GTEx reflected higher HPF1 mRNA expression levels in samples with high FRG1 levels. qRT-PCR data performed on MCF7 cells with FRG1 knockdown showed a reduced level of HPF1 transcripts. These results, along with ChIP qRT-PCR data, collectively underscore the strong relationship between FRG1 and HPF1, both in healthy and cancer-related contexts. This contrast in outcomes may be attributed to the complex interactions involving FRG1, HPF1, and various other genes involved in BER. To date, the distinct influence of HPF1 in the development of tumors has not been thoroughly investigated. Consequently, additional research is needed to uncover its contribution to overall survival. Furthermore, there is limited knowledge regarding other factors that regulate HPF1 expression, which could provide valuable insights into its expression levels.
In conclusion, this study elucidated the role of FRG1 as a transcription factor, highlighting its significance in the positive regulation of various base excision repair genes. These findings imply that diminished levels of FRG1 may impact DNA repair mechanisms within breast cancer cells.
Supplementary Information
Acknowledgements
We thank Ms. Ananya Palo for helping in RNA isolation, and Mr. Saket Awadhesbhai Patel for helping in formatting of graphs.
Abbreviations
- FRG1
FSHD region gene 1
- SSB
Single-stranded break
- BER
Base excision repair
- HPF1
Histone PARylation factor 1
- KEGG
Kyoto Encyclopedia of genes and genomes
- GO
Gene ontology
- STRING
Search tool for retrieval of interacting genes/proteins
- DEG
Differentially expressed genes
- GDC
Genomic data commons
- TCGA BRCA
The cancer genome atlas breast invasive carcinoma
- COSMIC
Catalogue of somatic mutations in cancer
- DAVID
Database for annotation, visualization and integrated discovery
- KM plot
Kaplan–Meier plot
- ChIP
Chromatin immunoprecipitation
- OS
Overall survival
Author contributions
S.S. did data curation, software, formal analysis, visualisation, methodology, writing-original draft, editing, and performed qRT-PCR, ChIP qRT-PCR and comet assay. T.M. did chromatin immunoprecipitation and T47D comet assay experiment. R.K. guided in risk score calculations. M.D. conceptualized the study, provided resources, formal analysis, supervision, funding acquisition, methodology, project administration, and editing.
Funding
This work was supported by intramural funding from the National Institute of Science Education and Research (NISER), Department of Atomic Energy (DAE), Government of India (GOI). S.S. received fellowship from DISHA Scholarship by Department of Atomic Energy.
Data availability
The datasets used and/or analysed during the current study available are from the corresponding author on reasonable request.
Competing interests
The authors declare no competing interests.
Footnotes
Publisher's note
Springer Nature remains neutral with regard to jurisdictional claims in published maps and institutional affiliations.
Supplementary Information
The online version contains supplementary material available at 10.1038/s41598-024-70368-9.
References
- 1.Tiwari, A. et al. Reduced FRG1 expression promotes prostate cancer progression and affects prostate cancer cell migration and invasion. BMC Cancer19, 346 (2019). 10.1186/s12885-019-5509-4 [DOI] [PMC free article] [PubMed] [Google Scholar]
- 2.Mukherjee, B. et al. Reduced expression of FRG1 facilitates breast cancer progression via GM-CSF/MEK-ERK axis by abating FRG1 mediated transcriptional repression of GM-CSF. Cell Death Discov.8, 442 (2022). 10.1038/s41420-022-01240-w [DOI] [PMC free article] [PubMed] [Google Scholar]
- 3.Tiwari, A., Pattnaik, N., Mohanty Jaiswal, A. & Dixit, M. Increased FSHD region gene1 expression reduces in vitro cell migration, invasion, and angiogenesis, ex vivo supported by reduced expression in tumors. Biosci. Rep. 10.1042/BSR20171062 (2017). 10.1042/BSR20171062 [DOI] [PMC free article] [PubMed]
- 4.Hansda, A. K., Tiwari, A. & Dixit, M. Current status and future prospect of FSHD region gene 1. J. Biosci.42, 345–353 (2017). 10.1007/s12038-017-9681-x [DOI] [PubMed] [Google Scholar]
- 5.Mukherjee, B., Brahma, P., Mohapatra, T., Chawla, S. & Dixit, M. Reduced FRG1 expression promotes angiogenesis via activation of the FGF2 mediated ERK AKT pathway. FEBS Open Bio.13, 804–817 (2023). 10.1002/2211-5463.13582 [DOI] [PMC free article] [PubMed] [Google Scholar]
- 6.Khan, R., Palo, A. & Dixit, M. Role of FRG1 in predicting the overall survivability in cancers using multivariate based optimal model. Sci. Rep.11, 22505 (2021). 10.1038/s41598-021-01665-w [DOI] [PMC free article] [PubMed] [Google Scholar]
- 7.Gibbs-Seymour, I., Fontana, P., Rack, J. G. M. & Ahel, I. HPF1/C4orf27 Is a PARP-1-Interacting Protein that Regulates PARP-1 ADP-Ribosylation Activity. Mol. Cell62, 432–442 (2016). 10.1016/j.molcel.2016.03.008 [DOI] [PMC free article] [PubMed] [Google Scholar]
- 8.Rudolph, J., Roberts, G., Muthurajan, U. M. & Luger, K. HPF1 and nucleosomes mediate a dramatic switch in activity of PARP1 from polymerase to hydrolase. Elife10.7554/eLife.65773 (2021). [DOI] [PMC free article] [PubMed] [Google Scholar]
- 9.Gaullier, G. et al. Bridging of nucleosome-proximal DNA double-strand breaks by PARP2 enhances its interaction with HPF1. PLoS One15, e0240932 (2020). 10.1371/journal.pone.0240932 [DOI] [PMC free article] [PubMed] [Google Scholar]
- 10.Langelier, M.-F., Billur, R., Sverzhinsky, A., Black, B. E. & Pascal, J. M. HPF1 dynamically controls the PARP1/2 balance between initiating and elongating ADP-ribose modifications. Nat. Commun.12, 6675 (2021). 10.1038/s41467-021-27043-8 [DOI] [PMC free article] [PubMed] [Google Scholar]
- 11.Bilokapic, S., Suskiewicz, M. J., Ahel, I. & Halic, M. Bridging of DNA breaks activates PARP2–HPF1 to modify chromatin. Nature585, 609–613 (2020). 10.1038/s41586-020-2725-7 [DOI] [PMC free article] [PubMed] [Google Scholar]
- 12.Suskiewicz, M. J. et al. HPF1 completes the PARP active site for DNA damage-induced ADP-ribosylation. Nature579, 598–602 (2020). 10.1038/s41586-020-2013-6 [DOI] [PMC free article] [PubMed] [Google Scholar]
- 13.Bonfiglio, J. J. et al. Serine ADP-Ribosylation Depends on HPF1. Mol. Cell65, 932-940.e6 (2017). 10.1016/j.molcel.2017.01.003 [DOI] [PMC free article] [PubMed] [Google Scholar]
- 14.Harper, J. W. & Elledge, S. J. The DNA damage response: Ten years after. Mol. Cell28, 739–745 (2007). 10.1016/j.molcel.2007.11.015 [DOI] [PubMed] [Google Scholar]
- 15.Hanahan, D. & Weinberg, R. A. Hallmarks of cancer: The next generation. Cell144, 646–674 (2011). 10.1016/j.cell.2011.02.013 [DOI] [PubMed] [Google Scholar]
- 16.Alhmoud, J. F., Woolley, J. F., Al Moustafa, A.-E. & Malki, M. I. DNA damage/repair management in cancers. Cancers (Basel)12, 1050 (2020). 10.3390/cancers12041050 [DOI] [PMC free article] [PubMed] [Google Scholar]
- 17.Jackson, S. P. & Bartek, J. The DNA-damage response in human biology and disease. Nature461, 1071–1078 (2009). 10.1038/nature08467 [DOI] [PMC free article] [PubMed] [Google Scholar]
- 18.Palo, A., Patel, S. A., Sahoo, B., Chowdary, T. K. & Dixit, M. FRG1 is a direct transcriptional regulator of nonsense-mediated mRNA decay genes. Genomics115, 110539 (2023). 10.1016/j.ygeno.2022.110539 [DOI] [PubMed] [Google Scholar]
- 19.Grossman, R. L. et al. Toward a shared vision for cancer genomic data. N. Engl. J. Med.375, 1109–1112 (2016). 10.1056/NEJMp1607591 [DOI] [PMC free article] [PubMed] [Google Scholar]
- 20.Lonsdale, J. et al. The genotype-tissue expression (GTEx) project. Nat. Genet.45, 580–585 (2013). 10.1038/ng.2653 [DOI] [PMC free article] [PubMed] [Google Scholar]
- 21.Robinson, M. D., McCarthy, D. J. & Smyth, G. K. edgeR: A bioconductor package for differential expression analysis of digital gene expression data. Bioinformatics26, 139–140 (2010). 10.1093/bioinformatics/btp616 [DOI] [PMC free article] [PubMed] [Google Scholar]
- 22.Ritchie, M. E. et al. limma powers differential expression analyses for RNA-sequencing and microarray studies. Nucl. Acids Res.43, e47–e47 (2015). 10.1093/nar/gkv007 [DOI] [PMC free article] [PubMed] [Google Scholar]
- 23.R Core Team (2024). R: A Language and Environment for Statistical Computing. R Foundation for Statistical Computing, Vienna, Austria
- 24.Marini, F., Linke, J. & Binder, H. ideal: An R/Bioconductor package for interactive differential expression analysis. BMC Bioinf.21, 565 (2020). 10.1186/s12859-020-03819-5 [DOI] [PMC free article] [PubMed] [Google Scholar]
- 25.Morpheus, https://software.broadinstitute.org/morpheus/
- 26.Huang, D. W., Sherman, B. T. & Lempicki, R. A. Systematic and integrative analysis of large gene lists using DAVID bioinformatics resources. Nat. Protoc.4, 44–57 (2009). 10.1038/nprot.2008.211 [DOI] [PubMed] [Google Scholar]
- 27.Resource, T. G. O. 20 years and still GOing strong. Nucl. Acids Res.47, D330–D338 (2019). 10.1093/nar/gky1055 [DOI] [PMC free article] [PubMed] [Google Scholar]
- 28.Kanehisa, M. KEGG: Kyoto Encyclopedia of genes and genomes. Nucl. Acids Res.28, 27–30 (2000). 10.1093/nar/28.1.27 [DOI] [PMC free article] [PubMed] [Google Scholar]
- 29.Zhou, Y. et al. Metascape provides a biologist-oriented resource for the analysis of systems-level datasets. Nat. Commun.10, 1523 (2019). 10.1038/s41467-019-09234-6 [DOI] [PMC free article] [PubMed] [Google Scholar]
- 30.Szklarczyk, D. et al. STRING v11: protein–protein association networks with increased coverage, supporting functional discovery in genome-wide experimental datasets. Nucl. Acids Res.47, D607–D613 (2019). 10.1093/nar/gky1131 [DOI] [PMC free article] [PubMed] [Google Scholar]
- 31.Tate, J. G. et al. COSMIC: the catalogue of somatic mutations in cancer. Nucl. Acids Res.47, D941–D947 (2019). 10.1093/nar/gky1015 [DOI] [PMC free article] [PubMed] [Google Scholar]
- 32.Gao, J. et al. Integrative analysis of complex cancer genomics and clinical profiles using the cBioPortal. Sci. Signal10.1126/scisignal.2004088 (2013). [DOI] [PMC free article] [PubMed] [Google Scholar]
- 33.Cerami, E. et al. The cBio cancer genomics portal: an open platform for exploring multidimensional cancer genomics data. Cancer Discov.2, 401–404 (2012). 10.1158/2159-8290.CD-12-0095 [DOI] [PMC free article] [PubMed] [Google Scholar]
- 34.Love, M. I., Huber, W. & Anders, S. Moderated estimation of fold change and dispersion for RNA-seq data with DESeq2. Genome Biol.15, 550 (2014). 10.1186/s13059-014-0550-8 [DOI] [PMC free article] [PubMed] [Google Scholar]
- 35.Schneider, C. A., Rasband, W. S. & Eliceiri, K. W. NIH image to imageJ: 25 Years of image analysis. Nat. Methods9, 671–675 (2012). 10.1038/nmeth.2089 [DOI] [PMC free article] [PubMed] [Google Scholar]
- 36.Gyori, B. M., Venkatachalam, G., Thiagarajan, P. S., Hsu, D. & Clement, M.-V. OpenComet: An automated tool for comet assay image analysis. Redox Biol.2, 457–465 (2014). 10.1016/j.redox.2013.12.020 [DOI] [PMC free article] [PubMed] [Google Scholar]
- 37.Ye, J. et al. Primer-BLAST: A tool to design target-specific primers for polymerase chain reaction. BMC Bioinf.13, 134 (2012). 10.1186/1471-2105-13-134 [DOI] [PMC free article] [PubMed] [Google Scholar]
- 38.IBM Corp. Released 2019. IBM SPSS Statistics for Windows, Version 26.0. Armonk, NY: IBM Corp.
- 39.Polo, L. M. et al. Efficient single-strand break repair requires binding to both poly(ADP-Ribose) and DNA by the central BRCT domain of XRCC1. Cell Rep.26, 573-581.e5 (2019). 10.1016/j.celrep.2018.12.082 [DOI] [PMC free article] [PubMed] [Google Scholar]
- 40.Krokan, H. E. & Bjoras, M. Base excision repair. Cold Spring Harb. Perspect. Biol.5, a012583–a012583 (2013). 10.1101/cshperspect.a012583 [DOI] [PMC free article] [PubMed] [Google Scholar]
- 41.Lu, Y., Liu, Y. & Yang, C. Evaluating <em>In Vitro</em> DNA damage using comet assay. J. Vis. Exp.10.3791/56450 (2017). [DOI] [PMC free article] [PubMed] [Google Scholar]
- 42.Collins, A. Investigating oxidative DNA damage and its repair using the comet assay. Mutat. Res./Rev. Mutat. Res.681, 24–32 (2009). 10.1016/j.mrrev.2007.10.002 [DOI] [PubMed] [Google Scholar]
- 43.Collins, A. R. The comet assay for DNA damage and repair: Principles, applications, and limitations. Mol. Biotechnol.26, 249–261 (2004). 10.1385/MB:26:3:249 [DOI] [PubMed] [Google Scholar]
- 44.Grewal, P. K., Todd, L. C., van der Maarel, S., Frants, R. R. & Hewitt, J. E. FRG1, a gene in the FSH muscular dystrophy region on human chromosome 4q35, is highly conserved in vertebrates and invertebrates. Gene216(1), 13–9 (1998). 10.1016/S0378-1119(98)00334-5 [DOI] [PubMed] [Google Scholar]
- 45.van Deutekom, J. Identification of the first gene (FRG1) from the FSHD region on human chromosome 4q35. Hum. Mol. Genet.5, 581–590 (1996). 10.1093/hmg/5.5.581 [DOI] [PubMed] [Google Scholar]
- 46.Hanel, M. L., Wuebbles, R. D. & Jones, P. L. Muscular dystrophy candidate gene FRG1 is critical for muscle development. Dev. Dyn.238, 1502–1512 (2009). 10.1002/dvdy.21830 [DOI] [PMC free article] [PubMed] [Google Scholar]
- 47.D D’Amours, S Desnoyers, I D’Silva & G G Poirier. Poly(ADP-ribosyl)ation reactions in the regulation of nuclear functions. BIOCHEMICAL JOURNAL. [PMC free article] [PubMed]
- 48.Hegde, M. L., Hazra, T. K. & Mitra, S. Early steps in the DNA base excision/single-strand interruption repair pathway in mammalian cells. Cell Res.18, 27–47 (2008). 10.1038/cr.2008.8 [DOI] [PMC free article] [PubMed] [Google Scholar]
- 49.Sattler, U., Frit, P., Salles, B. & Calsou, P. Long-patch DNA repair synthesis during base excision repair in mammalian cells. EMBO Rep.4, 363–367 (2003). 10.1038/sj.embor.embor796 [DOI] [PMC free article] [PubMed] [Google Scholar]
- 50.Gartner, A. & Engebrecht, J. DNA repair, recombination, and damage signaling. Genetics10.1093/genetics/iyab178 (2022). [DOI] [PMC free article] [PubMed] [Google Scholar]
- 51.Robertson, A. B., Klungland, A., Rognes, T. & Leiros, I. DNA repair in mammalian cells. Cell. Mol. Life Sci.66, 981–993 (2009). 10.1007/s00018-009-8736-z [DOI] [PMC free article] [PubMed] [Google Scholar]
- 52.Kent, W. J. et al. The human genome browser at UCSC. Genome Res.12, 996–1006 (2002). 10.1101/gr.229102 [DOI] [PMC free article] [PubMed] [Google Scholar]
- 53.Labrie, C., Lee, B. H. & Mathews, M. B. Transcription factors RFX1/EF-C and ATF-1 associate with the adenovirus E1A-responsive element of the human proliferating cell nuclear antigen promoter. Nucl. Acids Res.23, 3732–3741 (1995). 10.1093/nar/23.18.3732 [DOI] [PMC free article] [PubMed] [Google Scholar]
- 54.Wright, G., Sonavane, M. & Gassman, N. R. Activated STAT3 Is a novel regulator of the XRCC1 promoter and selectively increases XRCC1 protein levels in triple negative breast cancer. Int. J. Mol. Sci.22, 5475 (2021). 10.3390/ijms22115475 [DOI] [PMC free article] [PubMed] [Google Scholar]
- 55.Hendriks, I. A. et al. The regulatory landscape of the human HPF1- and ARH3-dependent ADP-ribosylome. Nat. Commun.12, 5893 (2021). 10.1038/s41467-021-26172-4 [DOI] [PMC free article] [PubMed] [Google Scholar]
- 56.Kumamoto, S. et al. HPF1-dependent PARP activation promotes LIG3-XRCC1-mediated backup pathway of Okazaki fragment ligation. Nucl. Acids Res.49, 5003–5016 (2021). 10.1093/nar/gkab269 [DOI] [PMC free article] [PubMed] [Google Scholar]
- 57.Kanehisa, M., Furumichi, M., Sato, Y., Kawashima, M. & Ishiguro-Watanabe, M. KEGG for taxonomy-based analysis of pathways and genomes. Nucl. Acids Res.51, D587–D592 (2023). 10.1093/nar/gkac963 [DOI] [PMC free article] [PubMed] [Google Scholar]
- 58.Kanehisa, M. Toward understanding the origin and evolution of cellular organisms. Protein Sci.28, 1947–1951 (2019). 10.1002/pro.3715 [DOI] [PMC free article] [PubMed] [Google Scholar]
Associated Data
This section collects any data citations, data availability statements, or supplementary materials included in this article.
Data Citations
- Tiwari, A., Pattnaik, N., Mohanty Jaiswal, A. & Dixit, M. Increased FSHD region gene1 expression reduces in vitro cell migration, invasion, and angiogenesis, ex vivo supported by reduced expression in tumors. Biosci. Rep. 10.1042/BSR20171062 (2017). 10.1042/BSR20171062 [DOI] [PMC free article] [PubMed]
Supplementary Materials
Data Availability Statement
The datasets used and/or analysed during the current study available are from the corresponding author on reasonable request.