Abstract
Atrial fibrillation (A-fib) is the most common type of heart arrhythmia, typically treated with radiofrequency catheter ablation to isolate the heart from abnormal electrical signals. Monitoring the formation of ablation-induced lesions is crucial for preventing recurrences and complications arising from excessive or insufficient ablation. Existing imaging modalities lack real-time feedback, and their intraoperative usage is in its early stages. A critical need exists for an imaging-based lesion indexing (LSI) method that directly reflects tissue necrosis formation. Previous studies have indicated that spectroscopic photoacoustic (sPA) imaging can differentiate ablated tissues from their non-ablated counterparts based on PA spectrum variation. In this paper, we introduce a method for detecting ablation lesion boundaries using sPA imaging. This approach utilizes ablation LSI, which quantifies the ratio between the signal from ablated tissue and the total tissue signal. We enhance boundary detection accuracy by adapting a regression model-based compensation. Additionally, the method was cross-validated with clinically used intraoperative monitoring parameters. The proposed method was validated with ex vivo porcine cardiac tissues with necrotic lesions created by different ablation durations. The PA-measured lesion size was compared with gross pathology. Statistical analysis demonstrates a strong correlation (R > 0.90) between the PA-detected lesion size and gross pathology. The PA-detected lesion size also exhibits a moderate to strong correlation (R > 0.75) with local impedance changes recorded during procedures. These results suggest that the introduced PA imaging-based LSI has great potential to be incorporated into the clinical workflow, guiding ablation procedures intraoperatively.
Keywords: Radiofrequency ablation, Atrial fibrillation, Catheter, Photoacoustic imaging, Ablation lesion indexing, Image-guided intervention
Subject terms: Preclinical research, Interventional cardiology, Arrhythmias, Echocardiography, Interventional cardiology, Biomedical engineering
Introduction
Radiofrequency (RF) catheter ablation is increasingly performed to treat atrial fibrillation, which is the most common type of heart arrhythmia. The catheter generates alternating current from the tip electrode, leading to Joule heating (i.e., resistive heating) in the surrounding tissue1. This thermal damage triggers cellular death and isolates pulmonary veins for treatment. To prevent inadequate or excessive ablation, intraoperative monitoring of the ablated tissue is critical. Inadequate ablation can lead to recurrence 2, while excessive ablation may cause water vaporization (i.e., steam pop), a potentially severe complication3,4 associated with embolic strokes and cardiac perforations. Although imaging modalities like magnetic resonance imaging (MRI)5,6 and computed tomography (CT)7,8 are clinically used to evaluate ablation lesions, they do not provide real-time feedback, and their intraoperative usage is still in its early stages. Therefore, it is critical to monitor necrotic lesion formation quantitatively intraoperatively to prevent excessive or incomplete ablation.
Numerous technologies have been explored to provide quantitative ablation feedback. Tissue temperature has been widely used to assess tissue necrosis. It is commonly believed that temperatures exceeding 50–55 °C may cause irreversible thermal-induced tissue damage, resulting in an ablation-induced necrotic lesion9,10. However, the temperature sensor at the catheter tip only allows for the sensing of the surface temperature of the tissue, making it challenging to assess the depth of a lesion. Changes in tissue impedance have also been used to evaluate heat delivery based on the current flow circuit. The drop in local impedance has been demonstrated to correlate with the growth of ablation-induced lesions, with a 20 Ω change being associated with successful ablation10,11. Previous research suggests that ablation lesion dimensions increase with tissue-catheter contact force12,13, RF power14, and ablation duration13. Various models have been introduced to calculate the LSI based on a combination of these parameters for intraoperative feedback15–17. Although the aforementioned methods indicate a positive correlation with ablation lesion size, the feedback LSI index lacks sensitivity to patient differences. Furthermore, this feedback is only available when RF energy is delivered. Post-ablation lesion detection is not achievable with this method. None of these methods provide direct visualization of the tissue and the distribution of the necrosis within the ablation region. Without this information, there is a risk of local excessive ablation or the occurrence of a discontinuous lesion leading to electrical reconnection in atrial fibrillation treatment.
Photoacoustic (PA) imaging, an emerging technology relying on laser-generated ultrasound (US), reveals tissue optical absorption18–20. Different materials exhibit unique spectroscopic characteristics, enabling the characterization of different chromophores21,22. Previous studies reported the use of PA imaging to monitor RF ablation, observing differing PA spectra between ablated and non-ablated tissues23,24. Spectroscopic PA (sPA) imaging distinguishes ablated tissue contrast from the non-ablated counterparts. Iskander-Rizk et al. demonstrated real-time cardiac ablation monitoring using the intensity ratio of two-wavelength PA data in an ex vivo setting25–27. The ablation-induced lesion has also been mapped on the in vivo swine cardiac model using ratiometric sPA (rsPA) between the ablation tissue signal and total tissue signal28,29. Although the previous research has made significant contributions to the feasibility of PA imaging for detecting ablation-induced lesions, the quantitative accuracy of lesion boundary detection with PA imaging remains unexplored, and there has been no comparison between this imaging-based LSI index and established clinical standards for ablation monitoring. Understanding the accuracy of PA-based lesion detection is critical for intraoperative tissue characterization to prevent excessive and insufficient ablation.
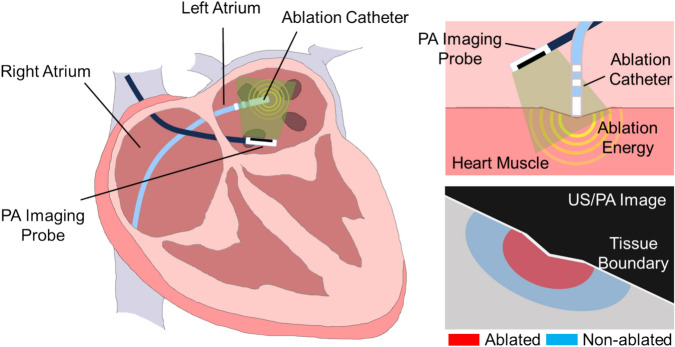
In this study, we used the rsPA technique to examine RF ablation lesions with varying ablation durations. We performed statistical quantification for PA-detected lesion boundary definition based on the gross pathology. Additionally, a depth estimation algorithm enhances the accurate estimation of lesion size. The contribution of this work folds in two aspects, (1) this paper introduced a precise lesion boundary mapping method based on rsPA imaging and statistically validated the method with gross pathology and (2) correlated the PA-based ablation lesion detection with the clinically accepted standard of impedance monitoring. Figure 1 illustrates the concept of our proposed PA ablation lesion indexing, highlighting the ablation-induced lesion boundary during catheter RF ablation procedures.
Figure 1.
The idea of photoacoustic (PA) ablation lesion indexing: detection ablation-induced lesion boundary during catheter RF ablation procedures.
Method
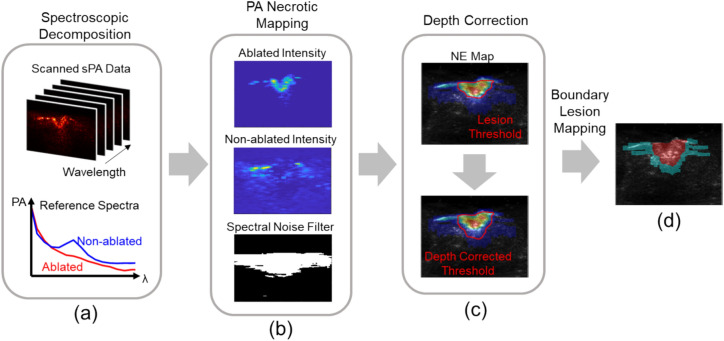
The proposed lesion boundary detection based on PA comprises three steps outlined in Fig. 2. Initially, necrotic mapping was computed using the PA spectrum obtained from multi-spectrum PA imaging. Subsequently, the depth of the thresholded lesion region was adjusted using a linear factor. Finally, the boundary of the depth-corrected lesion region was visualized. The methodology for each step is elaborated in this section.
Figure 2.
Photoacoustic (PA)-based ablation-induced lesion boundary detection pipeline. (a) Multi-wavelength PA images were unmixed based on the reference spectra of ablated and non-ablated tissue. (b) Necrotic mapping was computed from the ratio between ablated and non-ablated tissue intensity and filtered based on spectral noise. (c) Lesion area was thresholded, and linear depth compensation was applied. (d) Binary lesion map was displayed based on the depth-corrected PA image.
Photoacoustic necrotic mapping
This paper utilized a PA-based necrotic region mapping method to quantify the extent of ablation-induced necrosis with respect to non-necrotic tissues. The approach involves two main steps: spectroscopic decomposition and quantification of necrotic extent. Firstly, the method employs spectroscopic decomposition to distinguish the intensity distribution of ablated tissue from non-ablated tissue. This process involves decomposing the intensity distribution of two myocardium states using reference PA spectra of ablated and non-ablated tissue. Based on the assumption that the received PA spectrum consists of a linear combination of multiple chromophores, the contribution from each contrast source is estimated as Eq. (1) 30.
| 1 |
Here, p is the measured PA spectrum, i is the contrast source number, M is the number of absorbers, μa is the absorption spectrum of contrast source i at the wavelength w, and W presents the number of wavelengths used. m is the estimated composition of the contrast source that is ablated and non-ablated tissue in this scenario.
This approach has been commonly used in exploring blood-oxygenation mapping31, neurovascular mapping32,33, and contrast agent-enhanced imaging30,34. The collected PA spectra are decomposed to separate the contribution of ablated and non-ablated tissue types. Following spectroscopic decomposition, the necrotic extent is quantified based on the contribution of ablated tissue intensity (mAb) relative to the combined intensity of non-ablated tissue (mN-Ab) as described in Eq. (2). This quantification is represented by the Necrotic Extent (NE) metric, which calculates the ratio between ablated tissue intensity and the sum of ablated and non-ablated tissue intensities.
| 2 |
Additionally, it is essential to consider the potential for insufficient light illumination during scanning and the presence of background noise in some pixels. In such cases, the measured PA spectrum may include signals that are not specific to either ablated or non-ablated tissue spectra, potentially affecting the accuracy of estimating both ablated and non-ablated tissue intensities. Also, tissue spectra can exhibit minor variability due to oxygenation levels, leading to a higher residual spectrum after decomposition. The method addresses potential sources of signal noise by filtering out non-specific signal spectra from the measured PA spectrum, as shown in Eq. (3). The symbols used correspond exactly to those defined in Eq. (1). A residual spectral noise level was computed for each pixel, and a 2D mask was generated based on the thresholded noise level. This filtering process helps enhance tissue contrast in the scanned image by removing noise signals.
| 3 |
The rsPA-based necrotic mapping method offers an approach to quantifying tissue characteristics, allowing for non-binary characterization. This capability facilitates the visualization of tissue transitions during ablation, including the partially ablated regions resulting from heat penetration. Additionally, this method facilitates the visualization of lesion peripherals and provides precise delineation of the lesion boundary. By employing more wavelengths (n > 2) than the number of chromophores (n = 2), Eq. (1) becomes an overdetermined inverse problem. In contrast to methods using an equal number of wavelengths and chromophores, this overdetermined rsPA method is less susceptible to noise and adept at distinguishing between non-ablated tissue contrast and non-specific signals unrelated to tissue.
Depth estimation
While PA imaging has effectively demonstrated its capability in detecting ablation-induced lesions, previous studies consistently indicate an underestimation in lesion depth detection. Accurate estimation of lesion depth is crucial to mitigate ablation-related collateral damage, such as esophagus injury35. To address this challenge, a linear regression model-based compensation was implemented on the acquired PA images. The acquired PA imaging data was divided into calibration and evaluation groups. Acquired scanning data was randomly selected in each ablation group, and the PA-estimated depth was compared to the actual lesion size measured from gross pathology. A depth compensation factor was computed to minimize the error between PA scanning and pathology measurements, and this factor was then applied to the evaluation group, which contained the remaining scans from each group. The linear regression algorithm was chosen for its simplicity and effectiveness in modeling the relationship between PA-estimated depth and actual lesion size. The model parameters, including the slope and intercept, were determined based on the calibration group data. The depth-corrected lesion size was compared to the corresponding gross pathology measurement, and the root mean square error (RMSE) was computed.
PA-indexing correlation
The clinically accepted ablation parameters, including the duration of ablation and local impedance, were recorded during the procedure. Ablation duration and impedance changes were chosen for correlation analysis because they provide essential intraoperative feedback that can guide the ablation procedure. These two parameters are widely accepted clinical standards reflecting the status of the entire lesion. By understanding how PA imaging correlates with these established standards, the study aims to demonstrate the accuracy and reliability of PA imaging for real-time monitoring of RF ablation lesions. While other parameters such as temperature are also used for monitoring, temperature monitoring can only be performed at the tissue surface and without assessing heat penetration depth. Spearman’s rank correlation coefficient was computed to assess the relationship between the size of the lesions mapped by the PA imaging and these ablation parameters. This correlation was evaluated along the width and depth axes measured by the PA-based boundary detection method. By analyzing the correlation coefficient, we aimed to gain insight into the sensitivity of PA-based ablation indexing and correlate the PA indexing with the ablation LSI used in clinical practice, providing valuable information for further optimization of the ablation procedure. Additionally, procedures have been implemented to avoid confounding variables during correlation analysis. Samples were randomly assigned to study groups and processed and scanned using identical protocols to enhance the validity of the analysis.
Experiment setup
Sample preparation
The proposed ablation boundary detection method was evaluated using an ex vivo study. Ex vivo porcine cardiac tissue samples were ablated and scanned with sPA imaging. The PA-based boundary detection method was assessed under various ablation extent and lesion sizes to demonstrate its sensitivity and accuracy. In order to evaluate the accuracy of the quantitative PA indication, the samples were ablated under various conditions. The acquired sPA images were processed using the proposed rsPA method to identify ablated tissue.
A total number of 6 porcine hearts were acquired from a local grocery store in this study, and the tissue was dissected into 35 samples for ablation with similar surface size from ventricles and atriums. Samples were randomly separated into 5 groups with different ablation durations assigned with the same parameter settings. 10, 15, 20, 25, and 30 s of RF ablation were performed with each group of tissue samples. A typical cardiac ablation procedure takes less than 60 s, depending on the location of the heart and the ablation parameters selected. Based on our pilot study, a 30-s ablation in our ex vivo setup produces a sufficient to excessive lesion, with charring observed in the center and potential steam pop occurrence. Conversely, a 10-s ablation produces a non-visible to barely visible lesion. Therefore, we selected five ablation durations between 10 and 30 s.
The ablation was performed using an irrigated 4 mm-tip ablation catheter (Safire BLU Duo Irrigated Ablation Catheter, St Jude Medical, Saint Paul, MN) connected to a cardiac ablation generator (1500TR9-CP, St Jude Medical, Saint Paul, MN). The RF ablation was delivered at 35W with a temperature limit of 40 °C. The irrigation speed was 17 mL/min. The catheter tip sensing impedance parameter was recorded during the ablation procedure. Tissue samples were kept wrapped in PBS-soaked gauze when not being ablated or scanned to retain hydration and prevent tissue necrosis.
Sample scanning
The sPA scanning was performed on the tissue sample immediately following the ablation procedure. To ensure accurate imaging, the tissue sample was initially positioned under the imaging probe, and a preliminary US image was used to search for the ablation area. The probe was then manually adjusted to ensure the ablation spot was centered within the imaging field. Fine adjustments were made based on real-time feedback from the US images. The accuracy of the alignment was verified by comparing the location of the ablation spot in the US images with the known coordinates of the ablation area with respect to tissue shape. Tissue was manually aligned at a depth of 15 mm from the transducer surface, which is the light focal depth based on the probe design, to ensure consistent illumination between samples and maximize illumination efficiency. In order to facilitate effective sound transmission, the sample was immersed in a saline solution. The imaging process involved capturing both PA and US images at the ablation spot. A linear array ultrasound transducer (L12-5 50 mm Transducer, Philips, Netherlands) was used to acquire signals. A dual-head fiber bundle connected to a laser system (Phocus MOBILE, OPOTEK, USA) delivered light energy for PA excitation. A 3D-printed fiber housing aligned the light illumination field and imaging plane. The laser system emits wavelength-tunable light (690–950 nm) at maximum repetition rates of 20 Hz, serving as the PA excitation source. We used the Verasonics system (Vantage 128, Verasonics, USA) for data acquisition.
We utilized a selective wavelength range of 700–850 nm for PA imaging, with intermediate steps of 10 nm covering the spectral signatures of both ablated and non-ablated tissue. This choice of wavelengths enabled us to detect specific optical absorption characteristics of the ablated sample tissues. The energy spectrum of the laser was recorded to compensate for signal fluctuations in wavelength-dependent laser output energy. The scanning pipeline and setup are shown in Fig. 3.
Figure 3.
(a) Sample scanning protocol: ex vivo samples were first ablated and then scanned with ultrasound (US) and spectroscopic PA (sPA) from 700 to 850 nm. (b) Sample scanning setup diagram: ablated tissue samples were scanned with US and PA submerged in water for acoustic coupling.
To enhance the quality of the PA imaging and suppress random signal noise, an averaging filter was applied at each wavelength. This filter averages the acquired signals from 64 consecutive frames, resulting in a clearer representation of the tissue structure and properties. By reducing noise, the obtained images were more reliable and presented higher contrast and resolution. Delay-and-sum algorithm was used for signal beamforming36.
Gross pathology
A gross-pathology comparison was performed between the post-scanning sample and the necrotic region detected in rsPA to evaluate the accuracy of the detection. The cardiac tissue sample was stained with 2% 2,3,5-Triphenyltetrazolium chloride (TTC) in 0.9% saline solution for 20 min at 37 °C to enhance the visibility of the ablation lesion. TTC is a metabolic function marker and a reliable indicator of damaged areas in experimental models. It is a colorless, water-soluble dye that is reduced by the mitochondrial enzyme succinate dehydrogenase of living cells into a water-insoluble, light-sensitive compound (formazan) that turns normal (non-ablated) tissue deep red. In contrast, damaged (ablated) tissue remains white, showing the absence of living cells and thereby indicating the damaged region.
Results
PA necrotic mapping
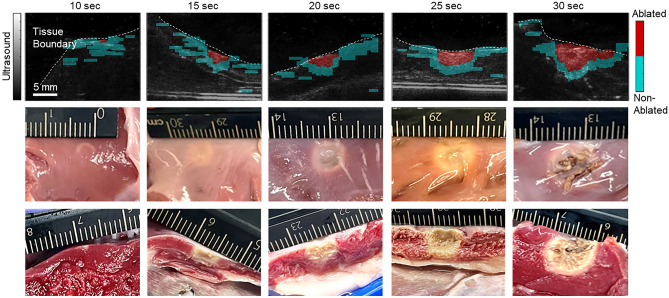
The porcine samples subjected to ablation were scanned using sPA imaging within a wavelength range of 700–850 nm. The average pulse energy was 6.1 ± 1.0 mJ measured from the fiber output. The sPA image was then analyzed by decomposing it based on the spectra of ablated and non-ablation tissues. This allowed the computation of the NE for each pixel, providing valuable information about tissue damage. Figure 4 displays the selected ablation lesion mapped by PA imaging for each condition group. The PA mapping was overlaid onto the US image, which was also scanned at the same location and revealed the tissue geometry. The results demonstrate that PA imaging successfully identifies the tissue boundary, corresponding to the scanned tissue geometry observed in the US image. The ablation lesion was consistently detected in all the scanned samples, represented by the highlighted red region, while blue pixels indicate non-ablated tissue. As anticipated, the ablated tissue was precisely mapped in the central region, aligning with the sample alignment. The surrounding tissue was identified as non-ablated, affirming the specificity of the rsPA-based ablation mapping technique.
Figure 4.
Necrotic mapping of the ablated tissue samples with tissue boundary illustrated under different ablation durations. The gross pathology from the ablation surface and imaging slice were displayed.
In addition to detecting ablation-induced lesions, we extracted the PA spectra from both ablated and non-ablated regions across all scanned samples. Figure 5 displays the normalized spectra of the ablated lesion and the non-ablated tissue within the 700–850 nm wavelength range. A local peak near 760 nm was observed in the spectrum of the non-ablated tissue, which aligns well with the deoxyhemoglobin spectra. This peak was absent after ablation. These results are consistent with the PA spectra reported in previous literature24,28.
Figure 5.
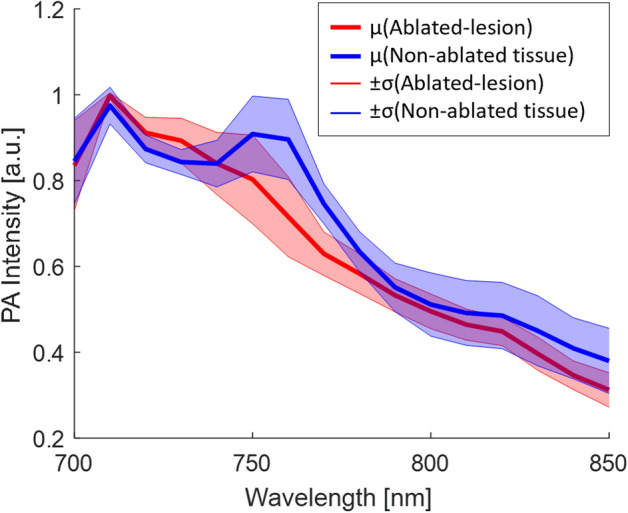
Average and standard deviation of tissue spectra (ablated lesion in red color, non-ablated tissue in blue color) extracted from 35 tissue samples.
Depth estimation
The lesion size of the ablated porcine sample was assessed using both PA imaging and gross pathology. The PA lesion map was binarized with a threshold NE value of 0.3, and the width and depth of the resulting lesion region were measured. The ablated sample was sliced along the imaging plane and stained with TTC solution to highlight tissue damage for pathological measurements. The lesion size was manually measured and recorded as the ground truth value. The comparison of the two measurements is presented in Fig. 6 below.
Figure 6.
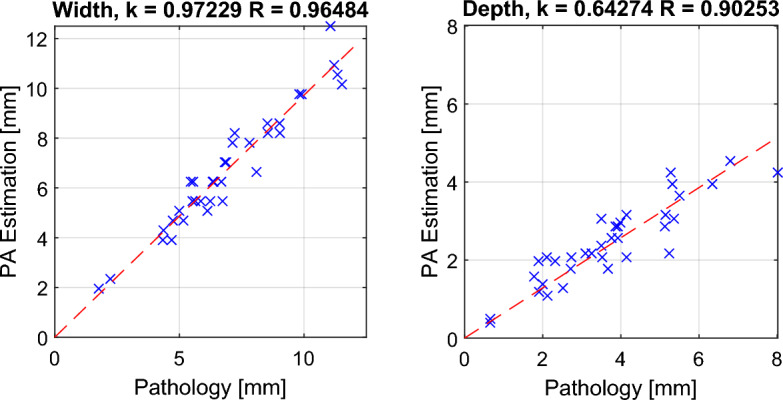
Comparison between PA-based ablation-induced lesion size and size measured by gross pathology.
The results illustrate the relationship between PA measurements and pathological measurements. Pearson’s linear correlation coefficients for width and depth axes were computed, yielding coefficients of R: 0.965 (width) and R: 0.903 (depth), respectively. These high correlation values affirm the accuracy of PA-based ablation lesion detection. The RMSE of the PA-based lesion width is 0.659 mm compared to the gross pathology measurement.
While the quantitative evaluation demonstrates a high sensitivity in rsPA-based lesion detection, the depth evaluation reveals a consistent underestimation trend, with a linear fitting line slope of 0.642. To address this issue, four measurements were randomly selected in each scanning group (total n = 20) to calculate the regression model-based compensation factor for depth estimation. The computed compensation factor, based on the calibration group, was 1.541. The depth estimation was then evaluated with the remaining three measurements in each group (total n = 15). The before-and-after depth correction measurements are depicted in Fig. 7. The slope of the linear fitting line improved from 0.633 to 0.975 in the evaluation group. The RMSE between PA and pathological measurements in the evaluation group was calculated and reported as 0.452 mm, and 0.813 mm across all 35 samples after depth correction.
Figure 7.
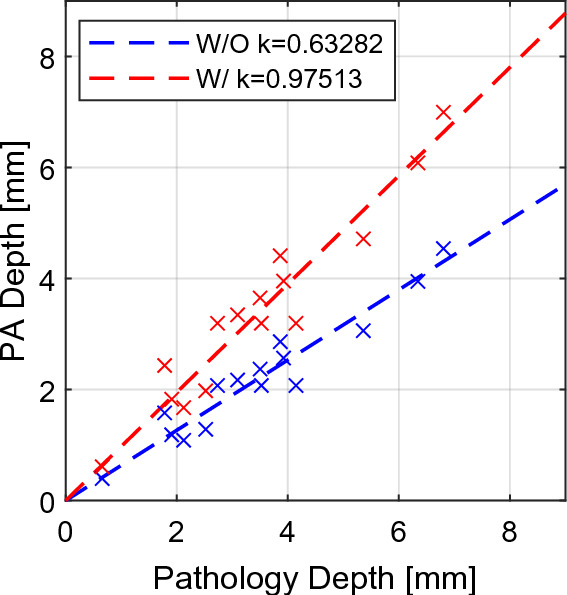
Depth estimation with (red, k = 0.975) and without (blue, k = 0.633) model-based compensation.
PA-indexing correlation with ablation duration and impedance changes
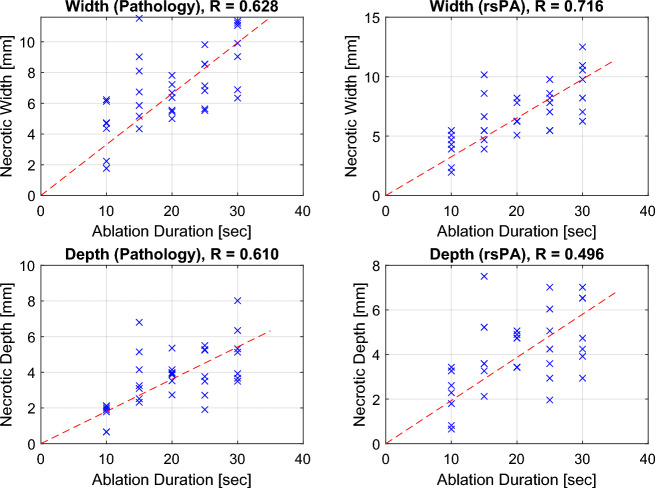
The measured ablation lesion size using PA was compared with ablation parameters, including ablation duration and local impedance changes, to further evaluate the sensitivity of PA-based ablation indexing. The lesion size was initially compared with the ablation duration in both width and depth axes, as illustrated in Fig. 8. In both axes, the lesion size increased with the ablation duration, a trend consistently observed in both PA imaging and pathological measurements. The Spearman’s rank correlation coefficient between lesion size and ablation duration was calculated, yielding correlation coefficients for pathology width (R: 0.628), rsPA width (R: 0.716), pathology depth (R: 0.610), and rsPA depth (R: 0.496), indicating a moderate to strong positive correlation.
Figure 8.
Pathology and PA-based ablation lesion size (width and depth) at various ablation durations.
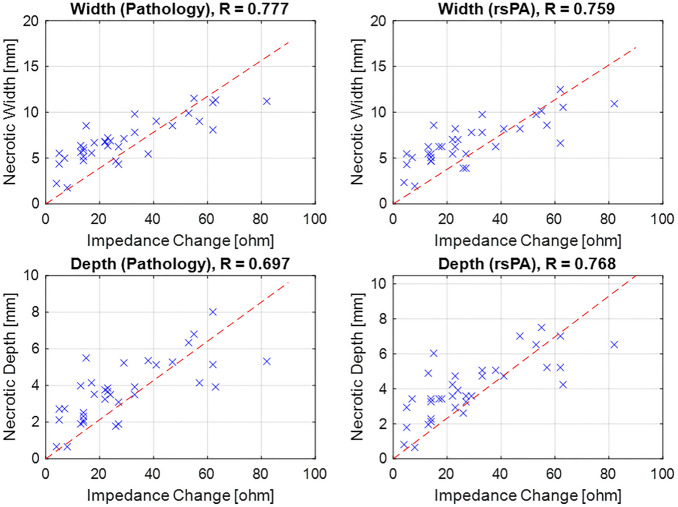
While ablation duration is a crucial parameter during the procedure, it may not fully consider tissue variability and catheter contact. Another parameter widely acknowledged by the community to reflect ablation extent is local impedance changes, with previous research suggesting that a 20-Ω impedance drop can be deemed as a sufficient indicator of ablation. Consequently, we proceeded to compare the lesion size with the recorded impedance changes during the ablation, and the results are depicted in Fig. 9.
Figure 9.
Comparison of ablation lesion size (width and depth) and impedance change during ablation.
The results reveal a moderate to strong correlation between lesion size and the local impedance drop, with correlation coefficients as follows: pathology width (R: 0.777), PA width (R: 0.759), pathology depth (R: 0.697), and PA depth (R: 0.768). This quantitative finding demonstrates that PA-based ablation indexing is sensitive to local tissue changes and aligns with existing clinical standards.
Discussion
This study introduced a rsPA-based lesion boundary detection method to map ablation-induced necrotic tissue during RF catheter ablation procedures. We developed an image-based method to map necrotic regions by quantifying the NE. This involves assessing the intensity of ablated tissue relative to non-ablated tissue. By distinguishing between the intensity distributions of ablated and non-ablated tissues, we estimate the extent of necrosis based on the ratio of ablated tissue intensity to the combined intensity of both tissues.
Our experimental evaluations using ex vivo porcine cardiac tissue samples confirmed the feasibility of rsPA-based ablation LSI. After ablating the samples with varying durations, the rsPA method effectively identified and mapped the ablation lesions, precisely delineating the boundaries of necrotic tissue. The PA-based estimation of lesion size demonstrated a strong correlation with the actual lesion size determined by gross pathology with coefficients of R: 0.965 (width) and R: 0.903 (depth). These findings suggest that PA imaging offers accurate size evaluation and visualization of ablation-induced lesions, with depth correction addressing the issue of underestimation.
The PA-based ablation indexing was compared to clinically accepted standard parameters, namely ablation duration and local impedance changes during the procedure. Literature suggests a positive association between both ablation duration and local impedance drop with lesion size growth. Ex vivo samples were subjected to ablation under various durations. Both PA and pathological measurements revealed a moderate positive correlation (R > 0.49) with ablation duration and a moderate to high correlation (R > 0.75) with recorded impedance changes. These findings further validate the viability of PA imaging for ablation indexing and bridge this imaging-based approach with existing parameter-based models.
While the study demonstrates the potential of rsPA-based ablation indexing, certain limitations exist in our presented results. Firstly, the research was conducted ex vivo using porcine cardiac tissue samples, which may not fully capture the complexity and variability of in vivo human cardiac ablation procedures, considering factors such as higher oxygen saturation levels and cardiac motion. We have addressed these limitations by demonstrating PA-based ablation-induced lesion detection with in vivo beating heart conditions29, highlighting its potential applicability in real-time clinical settings. Secondly, our depth estimation algorithm was introduced to address the consistent underestimation of lesion depth detection in PA imaging. While it enhanced depth estimation accuracy, further refinement and validation of this algorithm are necessary to investigate its reliability in determining lesion size and depth. Thirdly, there are potential discrepancies between the sample slice used for gross pathology and the corresponding slice in PA imaging. These differences can arise from challenges in aligning the images as well as tissue deformation occurring during incision and staining processes. Additionally, factors such as imaging resolution, and signal artifacts can be potential sources of error between PA and gross-pathology measurements. Finally, the ablation system used in this study did not record parameters such as catheter contact force, which is considered in some existing ablation lesion indexing models. However, the local impedance evaluated in this study can partially reflect catheter contact force.
Developing real-time monitoring and feedback systems based on PA imaging could have significant clinical implications. This would allow clinicians to assess the effectiveness of ablation in real-time, thereby preventing insufficient or excessive ablation and reducing the risk of complications. However, several critical aspects need to be addressed to fully integrate PA-based ablation indexing into intraoperative monitoring.
Firstly, rigorous validation through animal model studies and clinical trials is essential to evaluate the effectiveness and safety of PA imaging during cardiac ablation procedures. Intracardiac echocardiography imaging through a catheter is currently used in cardiac ablation procedures to image different locations of the heart to guide ablation catheter positioning37. Our proposed system does not deviate from the use of an imaging catheter during the ablation procedure. Nonetheless, a new clinical workflow may have to be developed to incorporate PA imaging into current cardiac ablation procedures. Secondly, the proposed regression model-based depth correction algorithm needs updating to align with human myocardial models and to account for patient diversity, including variations across different demographic groups. Achieving this requires multicenter clinical trials and leveraging publicly available medical imaging repositories, which are currently limited for PA imaging38. Additionally, the current correction factor is calibrated based on a well-controlled setup with the sample located at the same depth to avoid fluence variation. Future variations in the PA imaging setup and transducer proximity could influence the correction factor, particularly due to changes in illumination fluence and the resulting depth penetration of the light. We are planning to validate and adjust the depth-correction factor through rigorous in vivo testing, ensuring its reliability across different conditions. Given the data variability, advanced machine learning algorithms should be incorporated to handle multi-dimensional information more effectively than simple linear regression, enhancing the accuracy of lesion boundary detection. Thirdly, lesion detection should be integrated into the control framework of the ablation energy delivery system. Reinforcement learning algorithms could be employed to adaptively adjust ablation parameters in real-time based on continuous feedback from PA imaging this approach would optimize the ablation process, ensuring effective lesion creation while minimizing damage to surrounding tissues39. Lastly, a miniaturized catheter-based PA imaging device is required for intracardiac PA imaging. This necessitates the development of advanced signal beamforming for multiwavelength PA imaging and processing algorithms to achieve reliable high-contrast PA imaging. This is crucial given the dynamic environment of a beating heart and the potential for degraded imaging quality due to the miniaturization of the device. By addressing these aspects, the integration of PA imaging into real-time intraoperative monitoring could significantly enhance the precision and safety of cardiac ablation procedures.
Conclusion
This paper introduces a PA imaging-based method for detecting ablation lesions boundary and quantifying the extent of ablation-induced necrosis. The method utilizes spectroscopic decomposition to differentiate the intensity distribution of ablated tissue from non-ablated tissue. The necrotic extent is quantified by estimating the contribution of ablated tissue intensity relative to the combined intensity of ablated and non-ablated tissue. The study results demonstrate accurate mapping (R > 0.90) of lesion size with the proposed depth correction algorithm, compared with gross pathology with measured RMSE of 0.452 mm. Additionally, the PA-based indexing shows a positive correlation with clinically accepted parameters, including ablation duration (R > 0.49) and local impedance drops (R > 0.75). These findings underscore the potential of utilizing PA imaging in clinical practice to enhance cardiac ablation patient outcomes.
Acknowledgements
This work was supported by the National Institutes of Health under grants [R01DK133717, DP5OD028162, R01EB030539 and R01HL162741], and Sultan Qaboos Chair in Cardiology at the St. Luke’s Foundation.
Author contributions
S.G. and H.K.Z. conceived the study and determined the experiment designs. S.G. performed the experiments, conducted data analysis, and wrote the original draft. H.L. assisted with data acquisition. L.J., D.B., and M.J. assisted with data quantifications. A.P., E.C.-H, and M.R. provided guidance throughout the study. H.K.Z. supervised the study, provided financial support, and provided guidance and oversight throughout the study. All authors actively participated in the critical review of the data and critical review and editing of the manuscript, ensuring its accuracy and quality. All authors have given their approval for the submission of this work.
Data availability
The data that support the plots and other findings of this study are available from the corresponding authors upon reasonable request.
Competing interests
The authors declare no competing interests.
Footnotes
Publisher's note
Springer Nature remains neutral with regard to jurisdictional claims in published maps and institutional affiliations.
Contributor Information
Shang Gao, Email: sgao@wpi.edu.
Haichong K. Zhang, Email: hzhang10@wpi.edu
References
- 1.Sulkin, M. S. et al. Novel measure of local impedance predicts catheter-tissue contact and lesion formation. Circ. Arrhythm. Electrophysiol.11(4), e005831 (2018). [DOI] [PubMed] [Google Scholar]
- 2.Peters, D. C. et al. Recurrence of atrial fibrillation correlates with the extent of post-procedural late gadolinium enhancement. A pilot study. JACC Cardiovasc. Imaging2(3), 308–316 (2009). [DOI] [PMC free article] [PubMed] [Google Scholar]
- 3.Nakagawa, H. & Jackman, W. M. The role of contact force in atrial fibrillation ablation. J. Atr. Fibrillation7(1), 78–84 (2014). [DOI] [PMC free article] [PubMed] [Google Scholar]
- 4.Santoro, A., Romano, A. & Lamberti, F. Steam pop during cavo-tricuspid isthmus ablation shown by intracardiac echocardiography. J. Cardiol. Cases23(1), 13–15 (2021). [DOI] [PMC free article] [PubMed] [Google Scholar]
- 5.Tao, S. et al. Ablation lesion characterization in scarred substrate assessed using cardiac magnetic resonance. JACC Clin. Electrophysiol.5(1), 91–100 (2019). [DOI] [PMC free article] [PubMed] [Google Scholar]
- 6.Ranjan, R. et al. Gaps in the ablation line as a potential cause of recovery from electrical isolation and their visualization using mri. Circ. Arrhythm. Electrophysiol.4(3), 279–286 (2011). [DOI] [PMC free article] [PubMed] [Google Scholar]
- 7.Kolandaivelu, A. Role of cardiac imaging (CT/MRI) before and after RF catheter ablation in patients with atrial fibrillation. J. Atr. Fibrillation5(2), 523. 10.4022/jafib.523 (2012). [DOI] [PMC free article] [PubMed] [Google Scholar]
- 8.Lee, H. G. et al. Use of cardiac computed tomography and magnetic resonance imaging in case management of atrial fibrillation with catheter ablation. Korean J. Radiol.20(5), 695 (2019). [DOI] [PMC free article] [PubMed] [Google Scholar]
- 9.Ahmed, M., Brace, C. L., Lee, F. T. & Goldberg, S. N. Principles of and advances in percutaneous ablation. Radiology258(2), 351–369 (2011). [DOI] [PMC free article] [PubMed] [Google Scholar]
- 10.Barkagan, M. et al. Effect of baseline impedance on ablation lesion dimensions. Circ. Arrhythm. Electrophysiol.11(10), e006690 (2018). [DOI] [PubMed] [Google Scholar]
- 11.Szegedi, N. et al. The role of local impedance drop in the acute lesion efficacy during pulmonary vein isolation performed with a new contact force sensing catheter-A pilot study. PLoS One16(9), e0257050 (2021). [DOI] [PMC free article] [PubMed] [Google Scholar]
- 12.Stagegaard, N., Petersen, H. H., Chen, X. & Svendsen, J. H. Indication of the radiofrequency induced lesion size by pre-ablation measurements. Europace7(6), 525–534 (2005). [DOI] [PubMed] [Google Scholar]
- 13.Avitall, B., Mughal, K., Hare, J., Helms, R. & Krum, D. The effects of electrode-tissue contact on radiofrequency lesion generation. PACE Pacing Clin. Electrophys.20(12), 2899–2910 (1997). [DOI] [PubMed] [Google Scholar]
- 14.An, H., Saksena, S., Janssen, M. & Osypka, P. Radiofrequency ablation of ventricular myocardium using active fixation and passive contact catheter delivery systems. Am. Heart J.118(1), 69–77 (1989). [DOI] [PubMed] [Google Scholar]
- 15.Whitaker, J. et al. Lesion index-guided ablation facilitates continuous, transmural, and durable lesions in a porcine recovery model. Circ. Arrhythm. Electrophysiol.11(4), e005892 (2018). [DOI] [PubMed] [Google Scholar]
- 16.Hussein, A. et al. Use of ablation index-guided ablation results in high rates of durable pulmonary vein isolation and freedom from arrhythmia in persistent atrial fibrillation patients. Circ. Arrhythm. Electrophysiol.11(9), e006576 (2018). [DOI] [PubMed] [Google Scholar]
- 17.Chen, S. et al. Catheter ablation of atrial fibrillation using ablation index–guided high power (50 W) for pulmonary vein isolation with or without esophageal temperature probe (the AI-HP ESO II). Heart Rhythm17(11), 1833–1840 (2020). [DOI] [PubMed] [Google Scholar]
- 18.Kruger, R. A., Liu, P., Fang, Y. R. & Appledorn, C. R. Photoacoustic ultrasound (PAUS)—reconstruction tomography. Med. Phys.22(10), 1605–1609 (1995). [DOI] [PubMed] [Google Scholar]
- 19.Esenaliev, R. O., Karabutov, A. A., Tittel, F. K., Fornage, B. D., Thomsen, S. L., Stelling, C. & Oraevsky, A. A. Laser optoacoustic imaging for breast cancer diagnostics: limit of detection and comparison with x-ray and ultrasound imaging. In Optical Tomography and Spectroscopy of Tissue: Theory, Instrumentation, Model, and Human Studies II, (eds. Chance, B. & Alfano, R. R.) 2979(18), pp. 71–82 (SPIE, 1997).
- 20.Hoelen, C. G. A., de Mul, F. F. M., Pongers, R. & Dekker, A. Three-dimensional photoacoustic imaging of blood vessels in tissue. Opt. Lett.23(8), 648 (1998). [DOI] [PubMed] [Google Scholar]
- 21.Yao, J. & Wang, L. V. Photoacoustic microscopy. Laser Photon. Rev.7(5), 758–778 (2013). [DOI] [PMC free article] [PubMed] [Google Scholar]
- 22.Beard, P. Biomedical photoacoustic imaging review. Interface Focus1(4), 602–631 (2011). [DOI] [PMC free article] [PubMed] [Google Scholar]
- 23.Bouchard, R., Dana, N., Di Biase, L., Natale, A. & Emelianov, S. Photoacoustic characterization of radiofrequency ablation lesions. In Photons Plus Ultrasound: Imaging and Sensing 2012, 8223, 82233K (SPIE, 2012). [DOI] [PMC free article] [PubMed]
- 24.Dana, N., Di Biase, L., Natale, A., Emelianov, S. & Bouchard, R. In vitro photoacoustic visualization of myocardial ablation lesions. Heart Rhythm11(1), 150–157 (2014). [DOI] [PMC free article] [PubMed] [Google Scholar]
- 25.Iskander-Rizk, S., Kruizinga, P., van der Steen, A. F. W. & van Soest, G. Spectroscopic photoacoustic imaging of radiofrequency ablation in the left atrium. Biomed. Opt. Express9(3), 1309 (2018). [DOI] [PMC free article] [PubMed] [Google Scholar]
- 26.Iskander-Rizk, S., Springeling, G., Kruizinga, P., Beurskens, R. H. S. H., Van Der Steen, A. F. W. & Van Soest, G. Photoacoustic-enabled RF ablation catheters for lesion monitoring. In IEEE International Ultrasonics Symposium, IUS (IEEE Computer Society, 2018), 2018-October.
- 27.Iskander-Rizk, S. et al. Real-time photoacoustic assessment of radiofrequency ablation lesion formation in the left atrium. Photoacoustics16, 100150 (2019). [DOI] [PMC free article] [PubMed] [Google Scholar]
- 28.Gao, S., Ashikaga, H., Mansi, T., Halperin, H. R. & Zhang, H. K. Photoacoustic necrotic region mapping for radiofrequency ablation guidance. In IEEE International Ultrasonics Symposium, IUS (IEEE, 2021), pp. 1–4.
- 29.Gao, S. et al. Cardiac-gated spectroscopic photoacoustic imaging for ablation-induced necrotic lesion visualization. J. Biophoton. 10.1002/jbio.202400126 (2024). [DOI] [PubMed] [Google Scholar]
- 30.Zhang, H. K. et al. Prostate-specific membrane antigen-targeted photoacoustic imaging of prostate cancer in vivo. J. Biophoton.11(9), e201800021 (2018). [DOI] [PMC free article] [PubMed] [Google Scholar]
- 31.Li, M., Tang, Y. & Yao, J. Photoacoustic tomography of blood oxygenation: A mini review. Photoacoustics10, 65–73 (2018). [DOI] [PMC free article] [PubMed] [Google Scholar]
- 32.Gao, S. et al. Laparoscopic photoacoustic imaging system based on side-illumination diffusing fibers. IEEE Trans. Biomed. Eng.70, 3187–3196 (2023). [DOI] [PMC free article] [PubMed] [Google Scholar]
- 33.Gao, S. et al. Intraoperative laparoscopic photoacoustic image guidance system in the da Vinci surgical system. Biomed. Opt. Express14(9), 4914 (2023). [DOI] [PMC free article] [PubMed] [Google Scholar]
- 34.Serebrennikova, L., Gao, S., Murakami, R., Boinapally, S., Pomper, M., Al Liudmila, S., Pomper, M. G., Ray, S. & Zhang, H. K. Feasibility of spectra-based quantification algorithm for non-linear photoacoustic contrast agents.12379(9), 34–38. 10.1117/12.2650607 (2023).
- 35.Bhaskaran, A., Chik, W., Thomas, S., Kovoor, P. & Thiagalingam, A. A review of the safety aspects of radio frequency ablation. IJC Heart Vasculature8, 147–153 (2015). [DOI] [PMC free article] [PubMed] [Google Scholar]
- 36.Gao, S. et al. Acoustic-resolution photoacoustic microscope based on compact and low-cost delta configuration actuator. Ultrasonics118, 106549 (2021). [DOI] [PMC free article] [PubMed] [Google Scholar]
- 37.Enriquez, A. et al. Use of intracardiac echocardiography in interventional cardiology. Circulation137(21), 2278–2294 (2018). [DOI] [PubMed] [Google Scholar]
- 38.Vonk, J., Knieling, F. & Kruijff, S. Collection on clinical photoacoustic imaging. Eur. J. Nucl. Med. Mol. Imaging. 10.1007/s00259-024-06780-0 (2024). [DOI] [PubMed] [Google Scholar]
- 39.Murakami, R., Mori, S. & Zhang, H. K. Intraoperative ablation control based on real-time necrosis monitoring feedback: Numerical evaluation. bioRxiv. 10.1101/2023.12.31.573805 (2024). [DOI] [PubMed] [Google Scholar]
Associated Data
This section collects any data citations, data availability statements, or supplementary materials included in this article.
Data Availability Statement
The data that support the plots and other findings of this study are available from the corresponding authors upon reasonable request.


