Abstract
We examined the function of GFP-IP3R3 (green fluorescent protein-tagged inositol 1,4,5-trisphosphate receptor type 3) in Ca2+ release and entry using a mutant DT40 cell line (IP3R-KO) in which all three IP3R genes had been disrupted. GFP-IP3R3 fluorescence largely overlapped with the distribution of endoplasmic reticulum, whereas a portion of GFP-IP3R3 apparently co-localized with the plasma membrane. The application of IP3 to permeabilized WT (wild-type) DT40 cells induced Ca2+ release from internal stores. Although this did not occur in IP3R-KO cells it was restored by expression of GFP-IP3R3. In intact cells, application of anti-IgM, an activator of the BCR (B-cell receptor), or trypsin, a protease-activated receptor 2 agonist, did not cause any Ca2+ response in IP3R-KO cells, whereas these treatments induced oscillatory or transient Ca2+ responses in GFP-IP3R3-expressing IP3R-KO cells, as well as in WT cells. In addition, BCR activation elicited Ca2+ entry in WT and GFP-IP3R3-expressing IP3R-KO cells but not in IP3R-KO cells. This BCR-mediated Ca2+ entry was observed in the presence of La3+, which blocks capacitative Ca2+ entry. Thapsigargin depleted Ca2+ stores and led to Ca2+ entry in IP3R-KO cells irrespective of GFP-IP3R3 expression. In contrast with BCR stimulation, thapsigargin-induced Ca2+ entry was completely blocked by La3+, suggesting that the BCR-mediated Ca2+ entry pathway is distinct from the capacitative Ca2+ entry pathway. The present study demonstrates that GFP-IP3R3 could compensate for native IP3R in both IP3-induced Ca2+ release and BCR-mediated Ca2+ entry.
Keywords: Ca2+ entry; Ca2+ release; DT 40 cell; green fluorescent protein; imaging; inositol 1,4,5-trisphosphate receptor
Abbreviations: BCR, B-cell receptor; GFP, green fluorescent protein; EGFP, enhanced GFP; ER, endoplasmic reticulum; fura 2/AM, fura 2 acetoxymethyl ester; ICM, intracellular-like medium; IP3, inositol 1,4,5-trisphosphate; IP3R, IP3 receptor; PAR, protease-activated receptor; PLC, phospholipase C; ThG, thapsigargin; TR-DHPE, Texas Red-1,2-dihexadecanoyl-sn-glycero-3-phosphoethanolamine; WT, wild-type
INTRODUCTION
The IP3R (inositol 1,4,5-trisphosphate receptor) is an intracellular IP3-induced Ca2+ release channel composed of an N-terminal cytoplasmic IP3-binding domain and a C-terminal channel domain. In mammalian cells, there are at least three IP3R subtypes, type 1 (IP3R1), type 2 (IP3R2) and type 3 (IP3R3), which exhibit different tissue distributions [1,2].
Immunocytochemical and subcellular fractionation studies have demonstrated that IP3Rs are distributed to Ca2+ storage organelles such as the ER (endoplasmic reticulum) and nuclear envelope [2]. It has also been reported that IP3Rs localize to certain areas in some cell types. For example, in polarized epithelial cells, such as pancreatic acinar cells and salivary cells, the IP3R is mainly localized to the apical pole, which corresponds to the trigger zone from which apical-to-basal Ca2+ waves originate [3–5]. Thus the subcellular localization of the IP3R is considered to play an important part in determining the spatio-temporal characteristics of Ca2+ signals.
In addition to its distribution in intracellular organelles, there is also evidence indicating that a portion of the IP3R is localized to, or is in close proximity to, the plasma membrane in a variety of cell types [6–10]. These IP3Rs are considered to participate in Ca2+ entry across the plasma membrane [6,8,9,11]. Moreover, the results of several recent studies suggest that IP3Rs migrate during cell growth and maturation [12,13].
Recently, GFP (green fluorescent protein) has been used as an expression tag to study targeting and dynamics of intracellular molecules. In a previous study, we constructed an expression vector for a fusion protein of GFP and the full-length rat IP3R3 (GFP-IP3R3) [14]. This enabled us to visualize the distribution of IP3Rs in living cells, although we could not determine the function of GFP-IP3R3 since this was hampered by the existence of native IP3Rs. In the present study, we expressed GFP-IP3R3 in a mutant DT40 cell line (IP3R-KO), in which all three IP3R genes had been disrupted by a homologous recombination [15]. Our results demonstrate that GFP-IP3R3 acts as a functional IP3-induced Ca2+ release channel. In addition, we provide strong evidence that IP3Rs are required for BCR (B-cell receptor)-mediated Ca2+ entry in DT40 cells. Moreover, GFP-IP3R3 is also effective at compensating for native IP3R in BCR-mediated Ca2+ entry.
MATERIALS AND METHODS
Materials and media
Anti-chicken IgM (supernatant, M-4 clone) was from Southern Biotechnology Associates (Birmingham, AL, U.S.A.). Polyclonal anti-GFP was from Medical & Biological Laboratories (Nagoya, Japan). Peroxidase-conjugated goat anti-rabbit antibody was purchased from Pierce (Rockford, IL, U.S.A.). Rabbit polyclonal antibodies, termed ABsI, ABsII and ABsIII, were raised against the C-termini of human IP3R1, IP3R2 and IP3R3 respectively and were affinity-purified and shown to be type-specific [10].
Fura 2/AM (fura 2 acetoxymethyl ester) and mag-fura 2/AM were from Molecular Probes (Eugene, OR, U.S.A.). Poly(L-lysine) was from Sigma (St. Louis, MO, U.S.A.). Cellmatrix I-C was from Nitta Gelatin (Osaka, Japan). Tosyl-L-phenylalanylchloromethylketone (‘TPCK’) was obtained from Roche (Basel, Switzerland). Soya bean trypsin inhibitor was from Sigma. PMSF, pepstatin A, leupeptin and dithiothreitol were from Wako Pure Chemicals (Osaka, Japan). Tris/glycine SDS sample buffer and 3–8% NuPAGE Tris/acetate gels were from Novel Experimental Technology (San Diego, CA, U.S.A.). pEGFP-C3 plasmid (where EGFP stands for enhanced GFP) was purchased from Clontech Laboratories (Palo Alto, CA, U.S.A.).
Modified Hanks' balanced salt solution buffered with Hepes (HBSS-H) contained 137 mM NaCl, 5.4 mM KCl, 1.3 mM CaCl2, 0.41 mM MgSO4, 0.49 mM MgCl2, 0.34 mM Na2HPO4, 0.44 mM NaH2PO4, 5.5 mM glucose and 20 mM Hepes/NaOH (pH 7.4). Nominally, Ca2+-free HBSS-H was identical in composition except for the omission of added CaCl2. Na2HPO4 and NaH2PO4 were omitted in phosphate anion-free HBSS-H.
ICM (intracellular-like medium) contained 125 mM KCl, 19 mM NaCl, 10 mM Hepes (pH 7.3 with KOH), 330 μM CaCl2 and 1 mM O,O′-bis (2-aminoethyl) ethyleneglycol-N,N,N′-N′-tetraacetic acid (free Ca2+ concentration was 50 nM).
The homogenization buffer contained 93.5 mM trisodium citrate, 6.2 mM citrate, 200 μM PMSF, 10 μM pepstatin A, 100 μM tosyl-L-phenylalanylchloromethylketone, 1 mM dithiothreitol, 10 μM leupeptin and 0.1 mg/ml soya bean trypsin inhibitor.
Cell culture and transfections
The DT40 chicken B-cell line and triple IP3R-deficient cell line were cultured in RPMI 1640 (Sigma), supplemented with 10% (v/v) fetal bovine serum (Trace, Noble Park, Vic., Australia), 1% chicken serum (Gibco BRL, Rockville, MD, U.S.A.), 4 mM glutamine (Gibco BRL), 50 μM 2-mercaptoethanol (Nakarai Chemicals, Kyoto, Japan), 100 units/ml penicillin and 100 μg/ml streptomycin (Gibco BRL).
Transient transfections were performed using LIPOFECTAMINE™ 2000 reagent (Invitrogen, Carlsbad, CA, U.S.A.) with 1.6 μg/ml of plasmid according to the manufacturer's instructions.
Stable transfections of HSY-EA1 cells with the GFP-IP3R3 plasmid vector (pCB-EGFP:IP3R3) [14] were established using LIPOFECTAMINE™ 2000 reagent. G418 (Gibco BRL) selection (0.4 mg/ml) was initiated 24 h after the transfection. After 1 week, cells were expanded for an additional week without G418. Colonies of GFP-IP3R3-expressing cells were screened by fluorescence microscopy. Stably transfected HSY-EA1 cells of GFP-IP3R3 were cultured in Dulbecco's modified Eagle's medium Nutrient Mixture F-12 HAM (Sigma) supplemented with 10% (v/v) newborn calf serum (Gibco BRL), 100 units/ml penicillin and 100 μg/ml streptomycin. The A431 human carcinoma cell line was cultured in Dulbecco's modified Eagle's medium (Sigma) with high glucose (25 mM), supplemented with 10% fetal bovine serum, 4 mM glutamine, 1 mM sodium pyruvate, 100 units/ml penicillin and 100 μg/ml streptomycin.
Imaging of [Ca2+]i (cytosolic Ca2+ concentration) and [Ca2+]L (Ca2+ concentrations within Ca2+ stores)
For monitoring of [Ca2+]i, cells were attached to a small recording chamber consisting of a 10 mm ring and 22 mm glass coverslips coated with 0.5 mg/ml poly(L-lysine) and Cellmatrix (diluted 1/10). Attached cells were incubated with culture medium for 1 h at 37 °C and loaded with 2 μM fura 2/AM in HBSS-H containing 1% BSA for 30 min at room temperature (22±3 °C). The fura 2-loaded cells were washed with HBSS-H and rested for at least 15 min before Ca2+ measurements. Cells were alternately excited at 340 and 380 nm, with emission signals being recorded at 500–530 nm. Fluorescence images of GFP were captured at an excitation wavelength of 490 nm and emission wavelength of 500–530 nm using the Argus-HiSCA imaging system (Hamamatsu photonics, Shizuoka, Japan) attached to an inverted fluorescence microscope, equipped with a Nikon Fluor 40× objective.
For [Ca2+]L monitoring, cells were loaded with mag-fura 2 and permeabilized, essentially as described previously [16]. Briefly, cells were incubated with 8 μM mag-fura 2/AM in HBSS-H containing 1% BSA for 45 min at 37 °C in the dark. The mag-fura 2-loaded cells were washed with BSA-free HBSS-H and attached to Cell-Tak (BD Biosciences, Bedford, MA, U.S.A.) coated glass coverslips at the bottom of the recording chambers. Attached cells were washed with ICM, followed by exposure to ICM containing 100 μg/ml (w/v) saponin (ICN, Cleveland, OH, U.S.A.) for 1–2 min. The permeabilized cells were washed with ICM and then incubated in ICM containing 3 mM ATP and 1.4 mM MgCl2 for at least 5 min. Fluorescent images of mag-fura 2 were acquired with dual excitation at 343 and 380 nm and an emission wavelength of 500–530 nm using the Argus-HiSCA imaging system equipped with a Nikon UV-Fluor ×100 objective. All these experiments were performed at room temperature.
Evaluation of IP3R activity
Mag-fura 2-loaded cells were permeabilized and incubated in ICM containing 3 mM ATP and 1.4 mM MgCl2. The cells were then washed with Ca2+-releasing medium, consisting of ICM with 497 μM CaCl2 (free Ca2+ concentration was 100 nM), 5 mM ATP and no MgCl2. After exposure to various concentrations of IP3, 10 μM IP3 was added to deplete Ca2+ stores at the end of the experiment. The time course of Ca2+ release was monitored by following the change in the fluorescence ratio of mag-fura 2, and the time taken for the fluorescence ratio to decrease by half the value at the depleted level was noted. The average rate of fluorescence change was used as an index of IP3R activity.
Confocal microscopy
The employed multi-photon microscope system included a femtosecond, pulsed Ti:sapphire laser (Mai Tai from Spectra-Physics, Mountain View, CA, U.S.A.) and a confocal microscope (Radiance 2100; BioRad, Hemel Hempstead, Herts., U.K.) with a four-line argon-ion laser and a Green HeNe laser. The pulsed laser is optically pumped by a 5 W green diode laser and has an output wavelength tuning range from 780 to 920 nm, which provides the source for a two-photon excitation. A Nikon Plan Apo×60 H objective (NA=1.4) was used for imaging.
The GFP-IP3R3-expressing cells were attached to poly(L-lysine)/Cellmatrix-coated chambers and were incubated with culture medium for 1 h at 37 °C. Cells were then stained with 100 nM ER-Tracker Blue-White DPX (Molecular Probes) or 50 μM TR-DHPE (Texas Red-1,2-dihexadecanoyl-sn-glycero-3-phosphoethanolamine; Molecular Probes) in HBSS-H containing 1% BSA for 10–50 min at 37 °C.
GFP-IP3R3 and TR-DHPE fluorescence were visualized using dual-excitation beams in a line sequential mode with the argon-ion laser at 488 nm (GFP-IP3R3) and the Green HeNe laser at 542 nm (TR-DHPE) in combination with a 560DCLP dichroic mirror and two emission filters, 500LB and 570LP. ER-Tracker was excited by an 800 nm pulse laser and the emission signal was obtained using a 625SP blocking filter.
Preparation of protein extracts
DT40 cells grown in 100 mm culture dishes (Becton Dickinson, Franklin Lakes, NJ, U.S.A.) were washed with HBSS-H and were resuspended in 5 ml ice-cold homogenization buffer. These cells were disrupted with a Polytron homogenizer (2×20 s) and were centrifuged at 1500 g for 5 min. The supernatant was centrifuged (40000 g for 20 min at 4 °C), and the resulting microsomal pellet was resuspended in homogenization buffer and stored at −80 °C until use. Preparation of the membrane fraction from stably transfected HSY-EA1 GFP-IP3R3 cells was performed as described previously [14].
Western blotting
Samples were subjected to electrophoresis on 3–8% NuPAGE Tris/acetate gels and transferred on to nitrocellulose membranes. For detection of IP3Rs, transferred membranes were blocked with Block Ace (Dainippon Pharmaceuticals, Osaka, Japan) containing 10% (v/v) goat serum, and were then incubated for 2 h with either ABsI, ABsII or ABsIII in 10% Block Ace. For detection of GFP, transferred membranes were blocked with PBS containing 5% (w/v) skimmed milk, 10% goat serum and 0.05% Tween 20, and then incubated for 1 h with PBS containing 5% skimmed milk, 0.05% Tween 20 and anti-GFP polyclonal antibody. These membranes were incubated for 1 h with peroxidase-conjugated goat anti-rabbit antibody in the 10% Brock Ace containing 0.04% Tween 20. Immunoreactive bands were visualized using the SuperSignal West Dura substrate (Pierce) and the intensity of chemiluminescence was measured using a Bio/Chemi-Luminescence imaging system (Light Capture, Atto, Tokyo, Japan).
RESULTS
GFP-IP3R3 expression in IP3R-KO DT40 cells
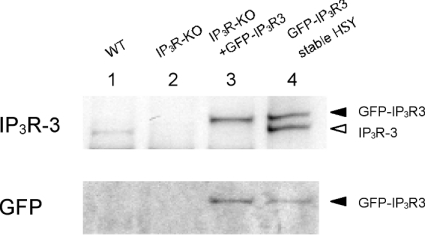
Figure 1 shows the expression of native type3 IP3R and GFP-IP3R3 in DT40 cells. In HSY-EA1 cells stably transfected with GFP-IP3R3 (lane 4), anti-IP3R3 recognized native IP3R3 at approx. 260 kDa and GFP-IP3R3 at approx. 275 kDa. Anti-GFP recognized only the approx. 275 kDa band, confirming that this upper band represents GFP-IP3R3 (lane 4). WT (wild-type) DT40 cells (lane 1) expressed IP3R3, whereas no signal was detected in IP3R-KO cells (lane 2). After transient transfection of IP3R-KO cells with the GFP-IP3R3 plasmid, GFP-IP3R3 expression was demonstrated with both anti-IP3R3 and anti-GFP (lane 3). Expression of IP3R1 and IP3R2 was also observed in WT DT40 cells, but not in IP3R-KO cells, confirming that no IP3R subtypes were expressed in IP3R-KO cells (results not shown).
Figure 1. Expression of native IP3R3 and GFP-IP3R3.
Microsomal fractions from WT DT40 cells (lane 1), IP3R-KO cells (lane 2) and pCB-EGFP:IP3R3-transfected IP3R-KO cells (lane 3) (15 μg of protein/lane) and the membrane fraction from pCB-EGFP:IP3R3 stably transfected HSY-EA1 cells (lane 4) (5 μg of protein/lane) were analysed by immunoblotting with ABsIII (upper panel) or anti-GFP (lower panel).
Subcellular localization of GFP-IP3R3 in DT40 cells
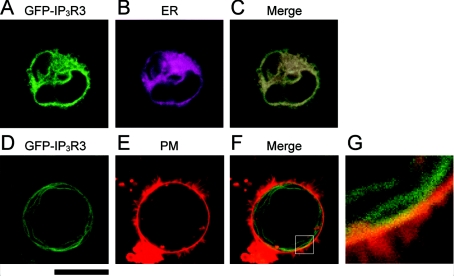
The subcellular distribution of GFP-IP3R3 was analysed by confocal microscopy (Figure 2). When GFP-IP3R3 was expressed in IP3R-KO cells, its fluorescence largely overlapped with the distribution of the ER (Figure 2C). However, a portion of GFP-IP3R3 appeared to be distinct from the ER distribution and apparently overlapped with the plasma membrane (Figures 2F and 2G). Thus we anticipate that GFP-IP3R3 serves as a Ca2+ channel not only on the ER but also on the plasma membrane.
Figure 2. Subcellular localization of the GFP-IP3R3 in IP3R-KO DT40 cells.
pCB-EGFP:IP3R3-transfected IP3R-KO cells were stained with ER-Tracker or TR-DHPE, and the fluorescence of GFP-IP3R3 (A, D), ER-Tracker (B) and TR-DHPE (E) was visualized with a multi-photon microscope. (C) A merged view of (A and B). (F) A merged view of (D and E). (G) A higher magnification of the area indicated in (F). Scale bar, 10 μm.
Luminal Ca2+ monitoring
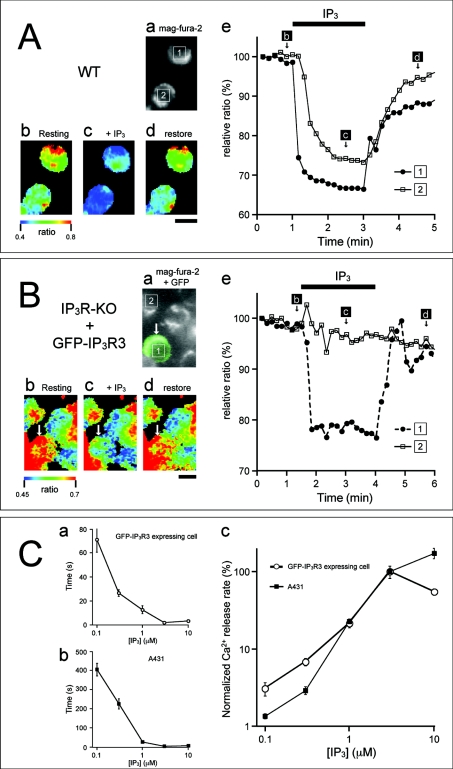
To determine whether GFP-IP3R3 serves as a functional Ca2+ channel on internal Ca2+ stores, we monitored IP3-induced changes in [Ca2+]L in permeabilized cells. As we have described previously [16], mag-fura 2 was compartmentalized within Ca2+ stores in saponin-permeabilized cells, and its fluorescence ratio (343/380 nm) rapidly decreased following the application of 1 μM IP3, reflecting the IP3-induced decrease in [Ca2+]L.
This decreased ratio recovered within 5 min of IP3 removal, reflecting the re-uptake of Ca2+ by sarcoplasmic/ER Ca2+-ATPase. IP3-dependent changes in fluorescence ratio were observed in most WT DT40 cells (21 of 27 cells), but not in IP3R-KO cells (n=49), confirming the lack of an IP3-mediated Ca2+ release pathway in IP3R-KO cells (Figures 3A and 3B). The expression of GFP-IP3R3 restored the IP3-induced Ca2+ release in IP3R-KO cells (10 of 15 cells, Figure 3B). These results clearly indicate that GFP-IP3R3 acts as an IP3-sensitive Ca2+ channel.
Figure 3. IP3-induced Ca2+ release in saponin-permeabilized cells.
WT DT40 (A) and GFP-IP3R3-expressing IP3R-KO DT40 (B) cells were loaded with mag-fura 2 and were permeabilized with saponin. Cells were then stimulated with IP3 (1 μM) in ICM containing ATP and Mg2+. (A) (a) Fluorescence image of mag-fura 2; (b–d) pseudocolour images of the mag-fura 2 ratio obtained at time points indicated in (e); (e) time-dependent changes as relative (%) fluorescence ratio in the cells depicted in the fluorescence image (a). (B) (a) Merged fluorescence image of GFP-IP3R3 and mag-fura 2; (b–d) pseudocolour images of the mag-fura 2 ratio obtained at time points indicated in (e); (e) time-dependent changes as relative (%) fluorescence ratio in the cells depicted in the fluorescence image (a). The GFP-IP3R3-expressing cell is indicated with an arrow. The horizontal bars at the top of the Figure indicate the presence of IP3 in ICM. The ratio is presented as relative fluorescence intensity (F343/F380). Scale bar, 10 μm. (C) IP3-concentration dependence of Ca2+ release for GFP-IP3R3 and WT IP3R3. Stable GFP-IP3R3-expressing cells (a) and A431 cells (b) were permeabilized and exposed to various concentrations of IP3 in ICM containing 100 nM free Ca2+, 5 mM ATP and no MgCl2. (a, b) Time taken for the fluorescence ratio to decrease by half the value at the depleted store level were plotted as a function of IP3 concentration. (c) Normalized Ca2+ release rates at various IP3 concentrations were compared between GFP-IP3R3-expressing cells and A431 cells. Results are means±S.E.M.
We then examined the concentration–response relationship for IP3 on Ca2+ release in permeabilized GFP-IP3R3-expressing cells, and compared it with that in A431 cells, which predominantly expressed IP3R3 [10]. The time taken for a 50% decrease in the fluorescence ratio became shorter as the IP3 concentration increased [Figures 3C(a) and 3C(b)]. The concentration–response curve for the estimated IP3R activity of GFP-IP3R3 was similar to that of WT IP3R3 [Figure 3C(c)].
GFP-IP3R3 function in intact cells
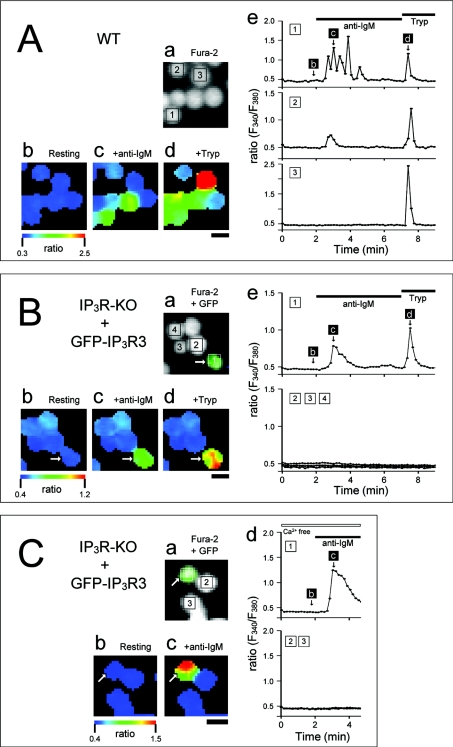
We next examined the function of GFP-IP3R3 in intact cells. The DT40 cell has an αIgM isotype BCR, which, through activation of PLC (phospholipase C)-γ, mediates an increase in [Ca2+]i [17,18]. Figure 4(A) shows typical responses of WT DT40 cells to activation of BCR by anti-chicken IgM (anti-IgM, 5 μg/ml). Activation of BCR induced Ca2+ responses in 75% of WT cells tested (n=95). The anti-IgM-induced Ca2+ responses observed included Ca2+ oscillations (48 cells) and monophasic Ca2+ transient (20 cells). We also found that trypsin (20 units/ml), an agonist of PAR2 (protease-activated receptor 2), induced transient or oscillatory Ca2+ increases in most WT DT40 cells (93 of 96 cells, Figure 4A).
Figure 4. Agonist-induced Ca2+ responses in DT40 cells.
WT (A) and GFP-IP3R3-transfected IP3R-KO (B, C) cells were stimulated with anti-IgM antibody (5 μg/ml) and trypsin (20 units/ml) in HBSS-H (A, B) or in nominally Ca2+-free HBSS-H (C). (A) (a) Fluorescence image of fura 2; (b–d) pseudocolour images of the fura 2 ratio obtained at time points indicated in (e); (e) time-dependent changes in the fluorescence ratio in the cells depicted in (a). (B) (a) Merged fluorescence image of GFP-IP3R3 and fura 2; (b–d) pseudocolour images of the fura 2 ratio obtained at time points indicated in (e); (e) time-dependent changes in the fluorescence ratio in the cells depicted in (a). GFP-IP3R3-expressing cell is indicated by an arrow. (C) (a) Merged fluorescence image of GFP-IP3R3 and fura 2; (b–c) pseudocolour images of the fura 2 ratio obtained at time points indicated in (d); (d) time-dependent changes in the fluorescence ratio in the cells depicted in (a). A GFP-IP3R3-expressing cell is indicated by arrow. The horizontal bars at the top of the Figure indicate the presence of anti-IgM and trypsin. The ratio is presented as relative fluorescence intensity (F340/F380). Scale bar, 10 μm.
In 17 of the GFP-IP3R3-expressing cells examined, anti-IgM induced oscillatory (6 cells), monophasic and transient (5 cells) or gradual (1 cell) increases in [Ca2+]i (Figure 4B). Trypsin also induced Ca2+ responses in most of these cells (16 of 17 cells, Figure 4B). When GFP-IP3R3 was not expressed in IP3R-KO cells, anti-IgM and trypsin did not induce Ca2+ responses (Figure 4B). Anti-IgM-induced Ca2+ responses in GFP-IP3R3-expressing DT40 cells were also observed in the absence of extracellular Ca2+, indicating that GFP-IP3R3 mediates Ca2+ release from internal stores (Figure 4C).
BCR-stimulated Ca2+ entry requires IP3R
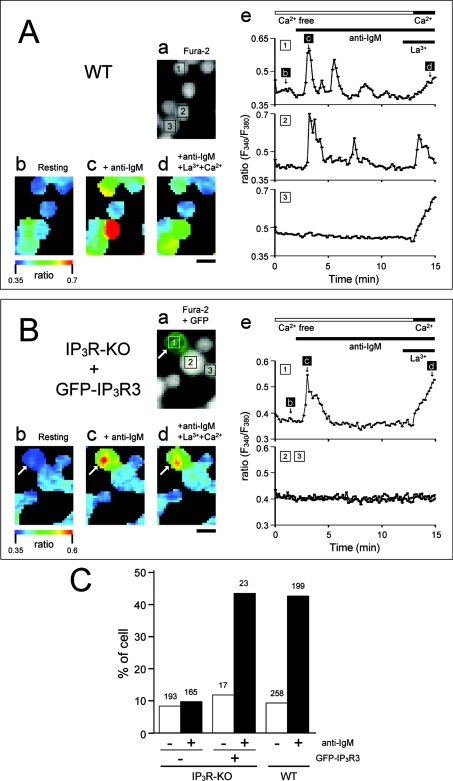
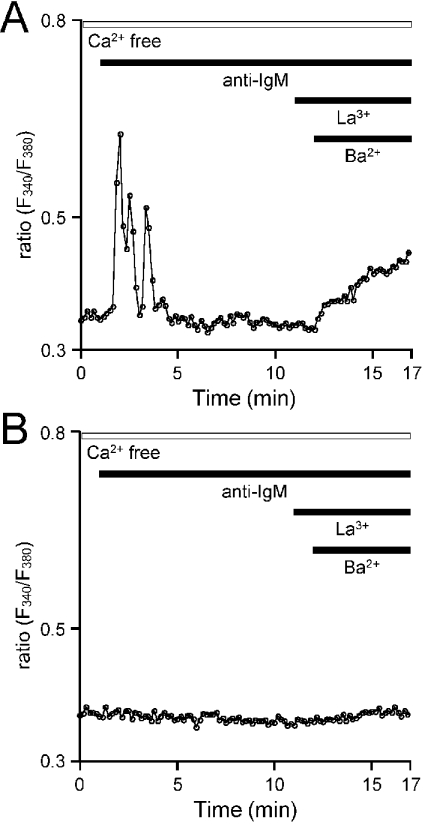
We next examined the involvement of IP3R and/or GFP-IP3R3 in Ca2+ entry. BCR-mediated Ca2+ responses in WT DT40 cells ceased within 10 min in the absence of extracellular Ca2+ (48 of 64 cells). Subsequent increases in external Ca2+ led to Ca2+ entry, and thus increased [Ca2+]i in approx. 50% of cells examined (Figures 5A and 5C). Note that this increase in Ca2+ concentration occurred in the presence of 0.3 μM La3+, the store-operated channel blocker. BCR-mediated Ca2+ entry was also observed in the presence of 1 μM La3+ or 1 μM Gd3+ (results not shown). In the absence of anti-IgM, La3+-insensitive Ca2+ entry was observed in <10% of cells examined (24 of 258 cells, Figure 5C). Thus it appears that the activation of BCR mediates Ca2+ entry in a manner that is distinct from the capacitative pathway, which is activated in response to the depletion of intracellular stores. BCR-mediated La3+-insensitive Ca2+ entry was not observed in IP3R-KO cells, and was restored in approx. 50% of GFP-IP3R3-expressing IP3R-KO cells (Figures 5B and 5C). Similarly, activation of BCR stimulated La3+-insensitive Ba2+ entry in GFP-IP3R3-expressing cells (Figure 6). These results indicate that IP3R or GFP-IP3R3 is required for BCR-mediated cation entry into DT40 cells.
Figure 5. BCR-mediated Ca2+ entry in DT40 cells.
WT (A) and GFP-IP3R3-transfected IP3R-KO (B) cells were stimulated with anti-IgM in nominally Ca2+-free medium, and La3+ (0.3 μM) and Ca2+ (1.3 mM) were subsequently added. (A) (a) Fluorescence image of fura 2; (b–d) pseudocolour images of fura 2 ratio obtained at time points indicated in (e); (e) time-dependent changes in the fluorescence ratio in the cells depicted in the fluorescence image (a). (B) (a) Merged fluorescence image of GFP-IP3R3 and fura 2; (b–d) pseudocolour images of fura 2 ratio obtained at time points indicated in (e); (e) time-dependent changes in the fluorescence ratio in the cells depicted in the fluorescence image (a). GFP-IP3R3-expressing cell is indicated by an arrow. The horizontal bars at the top of the Figure indicate the presence of anti-IgM, La3+ and Ca2+. The ratio is presented as relative fluorescence intensity (F340/F380). Scale bar, 10 μm. (C) La3+-insensitive Ca2+ entry was monitored in WT-DT40 cells and GFP-IP3R3-transfected IP3R-KO cells. The number of cells showing La3+-insensitive Ca2+ entry in the absence (−) and presence (+) of anti-IgM was quantified and plotted as a percentage of the total number of cells. Total number of cells counted is shown above each column.
Figure 6. BCR-mediated Ba2+ entry.
GFP-IP3R3-expressed IP3R-KO (A) and IP3R-KO (B) cells were stimulated with anti-IgM in nominally Ca2+-free medium and La3+ (0.3 μM) and Ba2+ (10 mM) were subsequently added. The horizontal bars at the top of the Figure indicate the presence of anti-IgM, La3+ and Ba2+. The ratio is presented as relative fluorescence intensity (F340/F380).
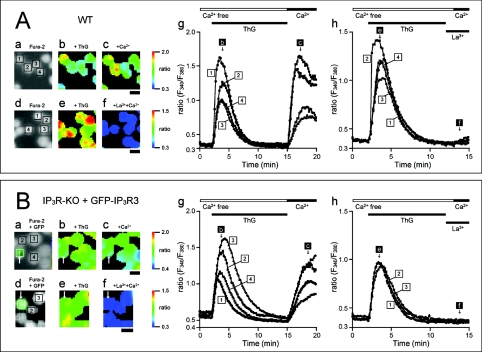
In contrast, ThG (thapsigargin) caused a transient increase in [Ca2+]i and depleted Ca2+ stores in the absence of extracellular Ca2+. Subsequent addition of extracellular Ca2+ increased [Ca2+]i through capacitative Ca2+ entry in WT-DT40 cells (Figure 7A). This capacitative Ca2+ entry was also observed in IP3R-KO cells, irrespective of their GFP-IP3R3 expression state, indicating that IP3Rs or GFP-IP3R3 are not essential for capacitative Ca2+ entry (Figure 7B). In contrast with BCR stimulation, ThG-induced Ca2+ entry was completely blocked by 0.3 μM La3+. These results support the idea that BCR-induced Ca2+ entry is not mediated by the depletion of Ca2+ stores.
Figure 7. Capacitative Ca2+ entry in DT40 cells.
WT (A) and GFP-IP3R3-transfected IP3R-KO (B) cells were stimulated with ThG (1 μM) in nominally Ca2+-free medium, and Ca2+ (1.3 mM) was subsequently added to the medium in the presence (d–f, h) or absence (a–c, g) of La3+. (A) (a, d) Fluorescence image of fura 2; (b, c, e, f) pseudocolour images of fura 2 ratio obtained at time points indicated in (g, h); (g, h) time-dependent changes in the fluorescence ratio in the cells depicted in the fluorescence image (a, d). (B) (a, d) Merged fluorescence image of GFP-IP3R3 and fura 2; (b, c, e, f) pseudocolour images of fura 2 ratio obtained at time points indicated in (g, h); (g, h) time-dependent changes in the fluorescence ratio in the cells depicted in the fluorescence image (a, d). A GFP-IP3R3-expressing cell is indicated by an arrow. The horizontal bars at the top of the Figure indicate the presence of ThG, La3+ and Ca2+. The ratio is presented in terms of relative fluorescence intensity (F340/F380). Scale bar, 10 μm.
DISCUSSION
We have demonstrated in the present study that the direct application of IP3 to saponin-permeabilized DT40 cells caused a rapid release of Ca2+. This IP3-induced Ca2+ release was not detected in IP3R-KO cells, but was restored by the expression of GFP-IP3R3. In addition, GFP-IP3R3 showed similar IP3 sensitivity to that of WT IP3R3.
The function of GFP-IP3R3 was also confirmed in intact cells. The M-4 clone of anti-chicken IgM (anti-IgM) is known to stimulate BCR and induce the production of IP3 via phosphorylation of PLC-γ [15,19]. In addition, trypsin is known to activate PAR2, which is coupled with Gq/11 and induces the production of IP3 via activation of PLC-β. Both these stimulatory treatments increased [Ca2+]i in WT, but not in IP3R-KO, cells. The expression of GFP-IP3R3 restored the Ca2+ response in IP3R-KO cells. Taken together, these results established that GFP-IP3R3 serves as a functional IP3-sensitive Ca2+ release channel.
Anti-IgM induced oscillatory Ca2+ responses in GFP-IP3R3-expressing IP3R-KO cells. A similar oscillatory response has been reported in IP3R-KO DT40 cells expressing native rat IP3R3 [20]. It is generally accepted that the oscillatory Ca2+ response requires biphasic feedback control by cytoplasmic Ca2+. The activity of IP3R1 is potentiated at low concentrations of Ca2+ (up to 300 nM) and is attenuated at higher concentrations [21]. Similar biphasic control has also been reported for IP3R3 [22], whereas previously it has been reported that IP3R3 is not inhibited by high concentrations of cytoplasmic Ca2+ [23,24]. Thus the mechanisms of Ca2+ oscillation and the role of Ca2+ in regulating the function of IP3R3 are still controversial. GFP-IP3R3 could become a useful tool for elucidating these issues.
In addition to the well-established role of IP3Rs as a Ca2+ release channel on intracellular organelles, there is also evidence suggesting the involvement of IP3Rs in Ca2+ entry into the cell. This hypothesis, termed the conformational-coupling model, proposes that a conformational change in IP3R, caused by store depletion, mediates store-operated channel opening [25]. However, the present study, as well as several other recent studies, demonstrated that capacitative Ca2+ entry occurs in IP3R-KO DT40 cells [15,19,26]. These results strongly indicate that IP3R is not required for capacitative Ca2+ entry, at least in DT40 cells.
In the present study, La3+, a blocker of capacitative Ca2+ entry, inhibited ThG-induced Ca2+ entry but did not affect BCR-mediated Ca2+ entry. This indicated that BCR mediates Ca2+ entry via mechanisms that are distinct from capacitative Ca2+ entry. In addition, this result is consistent with the observation that BCR mediates the activation of Ba2+-permeable channels [20]. It is considered that the Ba2+ entry pathway differs from capacitative Ca2+ entry in that Ba2+ entry is not caused by the depletion of stores. Both BCR-mediated Ca2+ entry and Ba2+ entry require IP3Rs, since they occur in WT DT40 cells but not in IP3R-KO cells. Moreover, GFP-IP3R3 was capable of compensating for native IP3R in BCR-mediated Ca2+ entry.
The role(s) of IP3Rs in controlling Ca2+ entry is not known. It is possible that IP3R and GFP-IP3R3 themselves are channels for cation entry or that they regulate other channels located on the plasma membrane. In the present study, a portion of GFP-IP3R3 fluorescence apparently overlapped with that of the plasma membrane, implying that some GFP-IP3R3 is localized to the plasma membrane. There is also evidence that IP3R is integrated to the plasma membrane [10]. In addition, several reports have demonstrated that functional IP3Rs are located on the plasma membrane [11,27]. These lines of evidence suggest that IP3Rs act as Ca2+ entry channels on the plasma membrane.
Several recent studies have suggested that IP3Rs may migrate. It is suggested in Madin–Darby canine kidney cells that IP3R1 and IP3R3 are translocated to the membrane from the cytoplasm during cell polarization [12,13]. Furthermore, in T-lymphocyte Jurkat cells, capping of the T-cell receptor–CD3 complex induces the accumulation of IP3R to the cap region, which leads to Ca2+ entry from that region [6]. Since the distribution of IP3Rs significantly affects Ca2+ signalling, it is predicted that GFP-IP3R3 will be a useful tool for elucidating the translocation of IP3R and associated Ca2+ responses in living cells.
Acknowledgments
This study was partially supported by the Academic Sciences Frontier Project and by the Grant-in-Aid for Scientific Research (13771101 to T.M., 14571770 to A.T. and 15591975 to Y.T.) from the Ministry of Education, Culture, Sports, Science and Technology of Japan.
References
- 1.Berridge M. J. Inositol trisphosphate and calcium signaling. Nature (London) 1993;361:315–325. doi: 10.1038/361315a0. [DOI] [PubMed] [Google Scholar]
- 2.Pozzan T., Rizzuto R., Volpe P., Meldolesi J. Molecular and cellular physiology of intracellular calcium stores. Physiol. Rev. 1994;74:595–636. doi: 10.1152/physrev.1994.74.3.595. [DOI] [PubMed] [Google Scholar]
- 3.Nathanson M. H., Fallon M. B., Padfield P. J., Maranto A. R. Localization of the type 3 inositol 1,4,5-trisphosphate receptor in the Ca2+ wave trigger zone of pancreatic acinar cells. J. Biol. Chem. 1994;269:4693–4696. [PubMed] [Google Scholar]
- 4.Lee M. G., Xu X., Zeng W., Diaz J., Wojcikiewicz R. J. H., Kuo T. H., Wuytack F., Racymaekers L., Muallem S. Polarized expression of Ca2+ channels in pancreatic and salivary gland cells: correlation with initiation and propagation of [Ca2+]i waves. J. Biol. Chem. 1997;272:15765–15770. doi: 10.1074/jbc.272.25.15765. [DOI] [PubMed] [Google Scholar]
- 5.Nezu A., Tanimura A., Morita T., Irie K., Yajima T., Tojyo Y. Evidence that zymogen granules do not function as an intracellular Ca2+ store for the generation of the Ca2+ signal in rat parotid acinar cells. Biochem. J. 2002;363:59–66. doi: 10.1042/0264-6021:3630059. [DOI] [PMC free article] [PubMed] [Google Scholar]
- 6.Khan A. A., Steiner J. P., Klein M. G., Schneider M. F., Snyder S. H. IP3 receptor: localization to plasma membrane of T cells and cocapping with the T cell receptor. Science. 1992;257:815–818. doi: 10.1126/science.1323146. [DOI] [PubMed] [Google Scholar]
- 7.Fadool D. A., Ache B. W. Inositol 1,3,4,5-tetrakisphosphate-gated channels interact with inositol 1,4,5-trisphosphate-gated channels in olfactory receptor neurons. Proc. Natl. Acad. Sci. U.S.A. 1994;91:9471–9475. doi: 10.1073/pnas.91.20.9471. [DOI] [PMC free article] [PubMed] [Google Scholar]
- 8.DeLisle S., Blondel O., Longo F. J., Schnabel W. E., Bell G. I., Welsh M. J. Expression of inositol 1,4,5-trisphosphate receptors changes the Ca2+ signal of Xenopus oocytes. Am. J. Physiol. 1996;270:C1255–C1261. doi: 10.1152/ajpcell.1996.270.4.C1255. [DOI] [PubMed] [Google Scholar]
- 9.Khan A. A., Soloski M. J., Sharp A. H., Schilling G., Sabatini D. M., Li S.-H., Ross C. A., Snyder S. H. Lymphocyte apoptosis: mediation by increased type 3 inositol 1,4,5-trisphosphate receptor. Science. 1996;273:503–507. doi: 10.1126/science.273.5274.503. [DOI] [PubMed] [Google Scholar]
- 10.Tanimura A., Tojyo Y., Turner R. J. Evidence that type I, II, and III inositol 1,4,5-trisphosphate receptors can occur as integral plasma membrane proteins. J. Biol. Chem. 2000;275:27488–27493. doi: 10.1074/jbc.M004495200. [DOI] [PubMed] [Google Scholar]
- 11.Kuno M., Gardner P. Ion channels activated by inositol 1,4,5-trisphosphate in plasma membrane of human T-lymphocytes. Nature (London) 1987;326:301–304. doi: 10.1038/326301a0. [DOI] [PubMed] [Google Scholar]
- 12.Colosetti P., Tunwell R. E. A., Cruttwell C., Arsanto J.-P., Mauger J.-P., Cassio D. The type 3 inositol 1,4,5-trisphosphate receptor is concentrated at the tight junction level in polarized MDCK cells. J. Cell Sci. 2003;116:2791–2803. doi: 10.1242/jcs.00482. [DOI] [PubMed] [Google Scholar]
- 13.Zhang S., Mizutani A., Hisatsune C., Higo T., Bannai H., Nakayama T., Hattori M., Mikoshiba K. Protein 4.1N is required for translocation of inositol 1,4,5-trisphosphate receptor type 1 to the basolateral membrane domain in polarized Madin–Darby Canine Kidney cells. J. Biol. Chem. 2003;278:4048–4056. doi: 10.1074/jbc.M209960200. [DOI] [PubMed] [Google Scholar]
- 14.Morita T., Tanimura A., Nezu A., Tojyo Y. Visualization of inositol 1,4,5-trisphosphate receptor type III with green fluorescent protein in living cells. Cell Calcium. 2002;31:59–64. doi: 10.1054/ceca.2001.0262. [DOI] [PubMed] [Google Scholar]
- 15.Sugawara H., Kurosaki M., Takata M., Kurosaki T. Genetic evidence for involvement of type 1, type 2 and type 3 inositol 1,4,5-trisphosphate receptors in signal transduction through the B-cell antigen receptor. EMBO J. 1997;16:3078–3088. doi: 10.1093/emboj/16.11.3078. [DOI] [PMC free article] [PubMed] [Google Scholar]
- 16.Tanimura A., Tojyo Y., Matsumoto Y. Imaging of quantal calcium release in the inositol 1,4,5-trisphosphate-sensitive organelles of permeabilized HSY cells. Cell Struct. Funct. 1998;23:129–135. doi: 10.1247/csf.23.129. [DOI] [PubMed] [Google Scholar]
- 17.Takata M., Sabe H., Hata A., Inazu T., Homma Y., Nukada T., Yamamura H., Kurosaki T. Tyrosine kinases Lyn and Syk regulate B cell receptor-coupled Ca2+ mobilization through distinct pathways. EMBO J. 1994;13:1341–1349. doi: 10.1002/j.1460-2075.1994.tb06387.x. [DOI] [PMC free article] [PubMed] [Google Scholar]
- 18.Takata M., Homma Y., Kurosaki T. Requirement of phospholipase C-γ2 activation in surface immunoglobulin M-induced B cell apoptosis. J. Exp. Med. 1995;182:907–914. doi: 10.1084/jem.182.4.907. [DOI] [PMC free article] [PubMed] [Google Scholar]
- 19.Venkatachalam K., Ma H.-T., Ford D. L., Gill D. L. Expression of functional receptor-coupled TRPC3 channels in DT40 triple receptor InsP3 knockout cells. J. Biol. Chem. 2001;276:33980–33985. doi: 10.1074/jbc.C100321200. [DOI] [PubMed] [Google Scholar]
- 20.Vazquez G., Wedel B. J., Bird G. St. J., Joseph S. K., Putney J. W., Jr An inositol 1,4,5-trisphosphate receptor-dependent cation entry pathway in DT40 B lymphocytes. EMBO J. 2002;21:4531–4538. doi: 10.1093/emboj/cdf467. [DOI] [PMC free article] [PubMed] [Google Scholar]
- 21.Bezprozvanny I., Watras J., Ehrlich B. E. Bell-shaped calcium-response curves of Ins(1,4,5)P3- and calcium-gated channels from endoplasmic reticulum of cerebellum. Nature (London) 1991;351:751–754. doi: 10.1038/351751a0. [DOI] [PubMed] [Google Scholar]
- 22.Cardy T. J. A., Traynor D., Taylor C. W. Differential regulation of types-1 and -3 inositol trisphosphate receptors by cytosolic Ca2+ Biochem. J. 1997;328:785–793. doi: 10.1042/bj3280785. [DOI] [PMC free article] [PubMed] [Google Scholar]
- 23.Yoneshima H., Miyawaki A., Michikawa T., Furuichi T., Mikoshiba K. Ca2+ differentially regulates the ligand-affinity states of type 1 and type 3 inositol 1,4,5-trisphosphate receptors. Biochem. J. 1997;322:591–596. doi: 10.1042/bj3220591. [DOI] [PMC free article] [PubMed] [Google Scholar]
- 24.Hagar R. E., Burgstahler A. D., Nathanson M. H., Ehrlich B. E. Type III InsP3 receptor channel stays open in the presence of increased calcium. Nature (London) 1998;396:81–84. doi: 10.1038/23954. [DOI] [PMC free article] [PubMed] [Google Scholar]
- 25.Ma H.-T., Patterson R. L., van Rossum D. B., Birnbaumer L., Mikoshiba K., Gill D. L. Requirement of the inositol trisphosphate receptor for activation of store-operated Ca2+ channels. Science. 2000;287:1647–1651. doi: 10.1126/science.287.5458.1647. [DOI] [PubMed] [Google Scholar]
- 26.Broad L. M., Braun F.-J., Lievremont J.-P., Bird G. St. J., Kurosaki T., Putney J. W., Jr Role of the phospholipase C-inositol 1,4,5-trisphosphate pathway in calcium release-activated calcium current and capacitative calcium entry. J. Biol. Chem. 2001;276:15945–15952. doi: 10.1074/jbc.M011571200. [DOI] [PubMed] [Google Scholar]
- 27.Lockwich T. P., Liu X., Singh B. B., Jadlowiec J., Weiland S., Ambudkar I. S. Assembly of trp1 in a signaling complex associated with caveolin-scaffolding lipid raft domains. J. Biol. Chem. 2000;275:11934–11942. doi: 10.1074/jbc.275.16.11934. [DOI] [PubMed] [Google Scholar]


