

Abstract
Computational free energy-based methods have the potential to significantly improve throughput and decrease costs of protein design efforts. Such methods must reach a high level of reliability, accuracy, and automation to be effectively deployed in practical industrial settings in a way that impacts protein design projects. Here, we present a benchmark study for the calculation of relative changes in protein-protein binding affinity for single point mutations across a variety of systems from the literature, using free energy perturbation (FEP+) calculations. We describe a method for robust treatment of alternate protonation states for titratable amino acids, which yields improved correlation with and reduced error compared to experimental binding free energies. Following careful analysis of the largest outlier cases in our dataset, we assess limitations of the default FEP+ protocols and introduce an automated script which identifies probable outlier cases that may require additional scrutiny and calculates an empirical correction for a subset of charge-related outliers. Through a series of three additional case study systems, we discuss how protein FEP+ can be applied to real-world protein design projects, and suggest areas of further study.
Keywords: Free energy methods, Binding affinity prediction, In silico mutational screening, Protein binding interface optimization, Protein-protein interactions
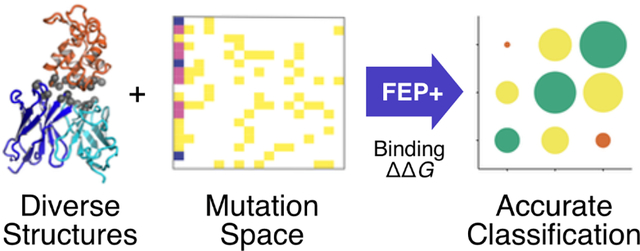
Graphical Abstract:
Introduction
Optimization of protein-protein binding interfaces is central to biologics design. Such interfaces can be altered by protein residue mutation to increase or decrease binding affinity, as well as other properties such as thermostability, hydrophobicity, immunogenicity, and pH sensitivity [1–5]. Traditionally, this has been done through a combination of chemical and structural intuition on the part of research scientists and large-scale experimentation, via such methods as brute-force saturation mutagenesis followed by a high-throughput assay; random or degenerate codon mutagenesis; or library screening using a display technology [6–9]. However, these methods can be expensive, in terms of both reagents and labor costs as well as time. In recent years, due in part to steady gains in computing power, and especially with the advent of GPU-based calculations, computational methods for predicting the effects of mutations on binding affinity and other physical properties have grown in popularity. At the same time, methodological improvements have resulted in improved accuracy across a wide range of methods, including empirical, machine learning-based, and physics-based methods [10–20].
Free energy perturbation (FEP), first introduced by Zwanzig in 1954 [21], is a physics-based method for calculating changes in free energy between closely related molecular systems using a series of molecular dynamics (MD) simulations. Modern implementations of FEP have been developed to incorporate substantial improvements in throughput and sampling efficiency [22–24], as well as the accuracy of molecular mechanics force fields used to calculate interatomic forces and system energy [25–29].
One such modern implementation which is widely used in structure-based drug design is FEP+ [30]. Over the past decade FEP+ has demonstrated a high level of accuracy and reliability in predicting the binding potencies of small molecules with their protein targets, both via relative binding FEP for congeneric ligands in lead optimization and via absolute binding FEP for diverse ligands in hit discovery [31,32]. Such calculations have generated positive impact on a large number of prospective studies in active drug discovery projects, leading to faster project progression through faster identification of novel potent chemical matter [33].
Initially developed for ligand perturbations in a protein receptor binding site, the FEP+ method has been adapted to a variety of different applications. We have previously published proof-of-concept studies for the application of FEP+ to predict the effects of neutral and charge-changing perturbations on protein-protein binding affinity [17,18], as well as protein thermostability calculations to predict melting temperatures (Tm) for mutant proteins [34–36]. FEP+ has been demonstrated to calculate both protein residue pKa values and free energies between different receptor conformations with high accuracy [37,38]. It has also been used recently to probe the effects of mutations on the interaction between the severe acute respiratory syndrome coronavirus 2 (SARS-CoV-2) viral spike protein and the human angiotensin converting enzyme 2 (ACE2) receptor, where it outperformed several other computational methods, as determined both by the agreement of its results with experiment and by its ability to identify stabilizing mutations [39]; and to elucidate the structural basis for the selectivity of α-conotoxin variants for different nicotinic acetylcholine receptor subtypes [40].
The aim of the current study is to benchmark the accuracy of FEP+ for protein-protein binding affinity, identify limitations of the current method that need further improvement, and demonstrate how the calculations might be utilized during a protein interface optimization project. We test FEP+ on a curated benchmark data set of binding free energies for single mutational variants of protein-protein binding systems collected from public sources and supplement it with several new experimental measurements from our own work. We apply default FEP+ protocols to assess the accuracy and reliability of the “out-of-the-box” calculations, and systematically investigate cases with large errors. We present an automated protocol for detecting probable outlier cases, to guide the user to more carefully examine the results of cases that satisfy certain chemical and structural criteria in prospective studies. (In this manuscript we use the term “outlier” to refer to cases with absolute errors in relative binding free energy, , larger than 2 kcal/mol relative to experiment.) For one class of outliers, consisting of cases which result in an unpaired buried charge, we introduce a single-parameter empirical correction to account for incomplete relaxation of those systems. Finally, we apply this automated protocol to data from three formerly active biologics design projects to demonstrate the potential value of the method in real-world interface optimization scenarios.
Results
Benchmark dataset curation
To assess the performance of protein FEP+ on a range of systems and protein types, we assembled a benchmark dataset of binding affinity measurements from publicly available sources. For each system, we included binding affinity data for the wild-type (wt) protein complex as well as for the complex with various single amino acid residue mutations. In total we collected binding data for 9 systems. Binding data for 6 systems were obtained from the SKEMPI 2.0 database [41], along with 3 systems from our own previous work [39,42,43], including several previously unpublished measurements (Supplemental Figure 1). To increase the reliability of the experimental values, we limited the dataset to include only measurements made by isothermal calorimetry (ITC) or surface plasmon resonance (SPR). The selected benchmark systems and a summary of the included mutations are presented in Figure 1.
Figure 1:
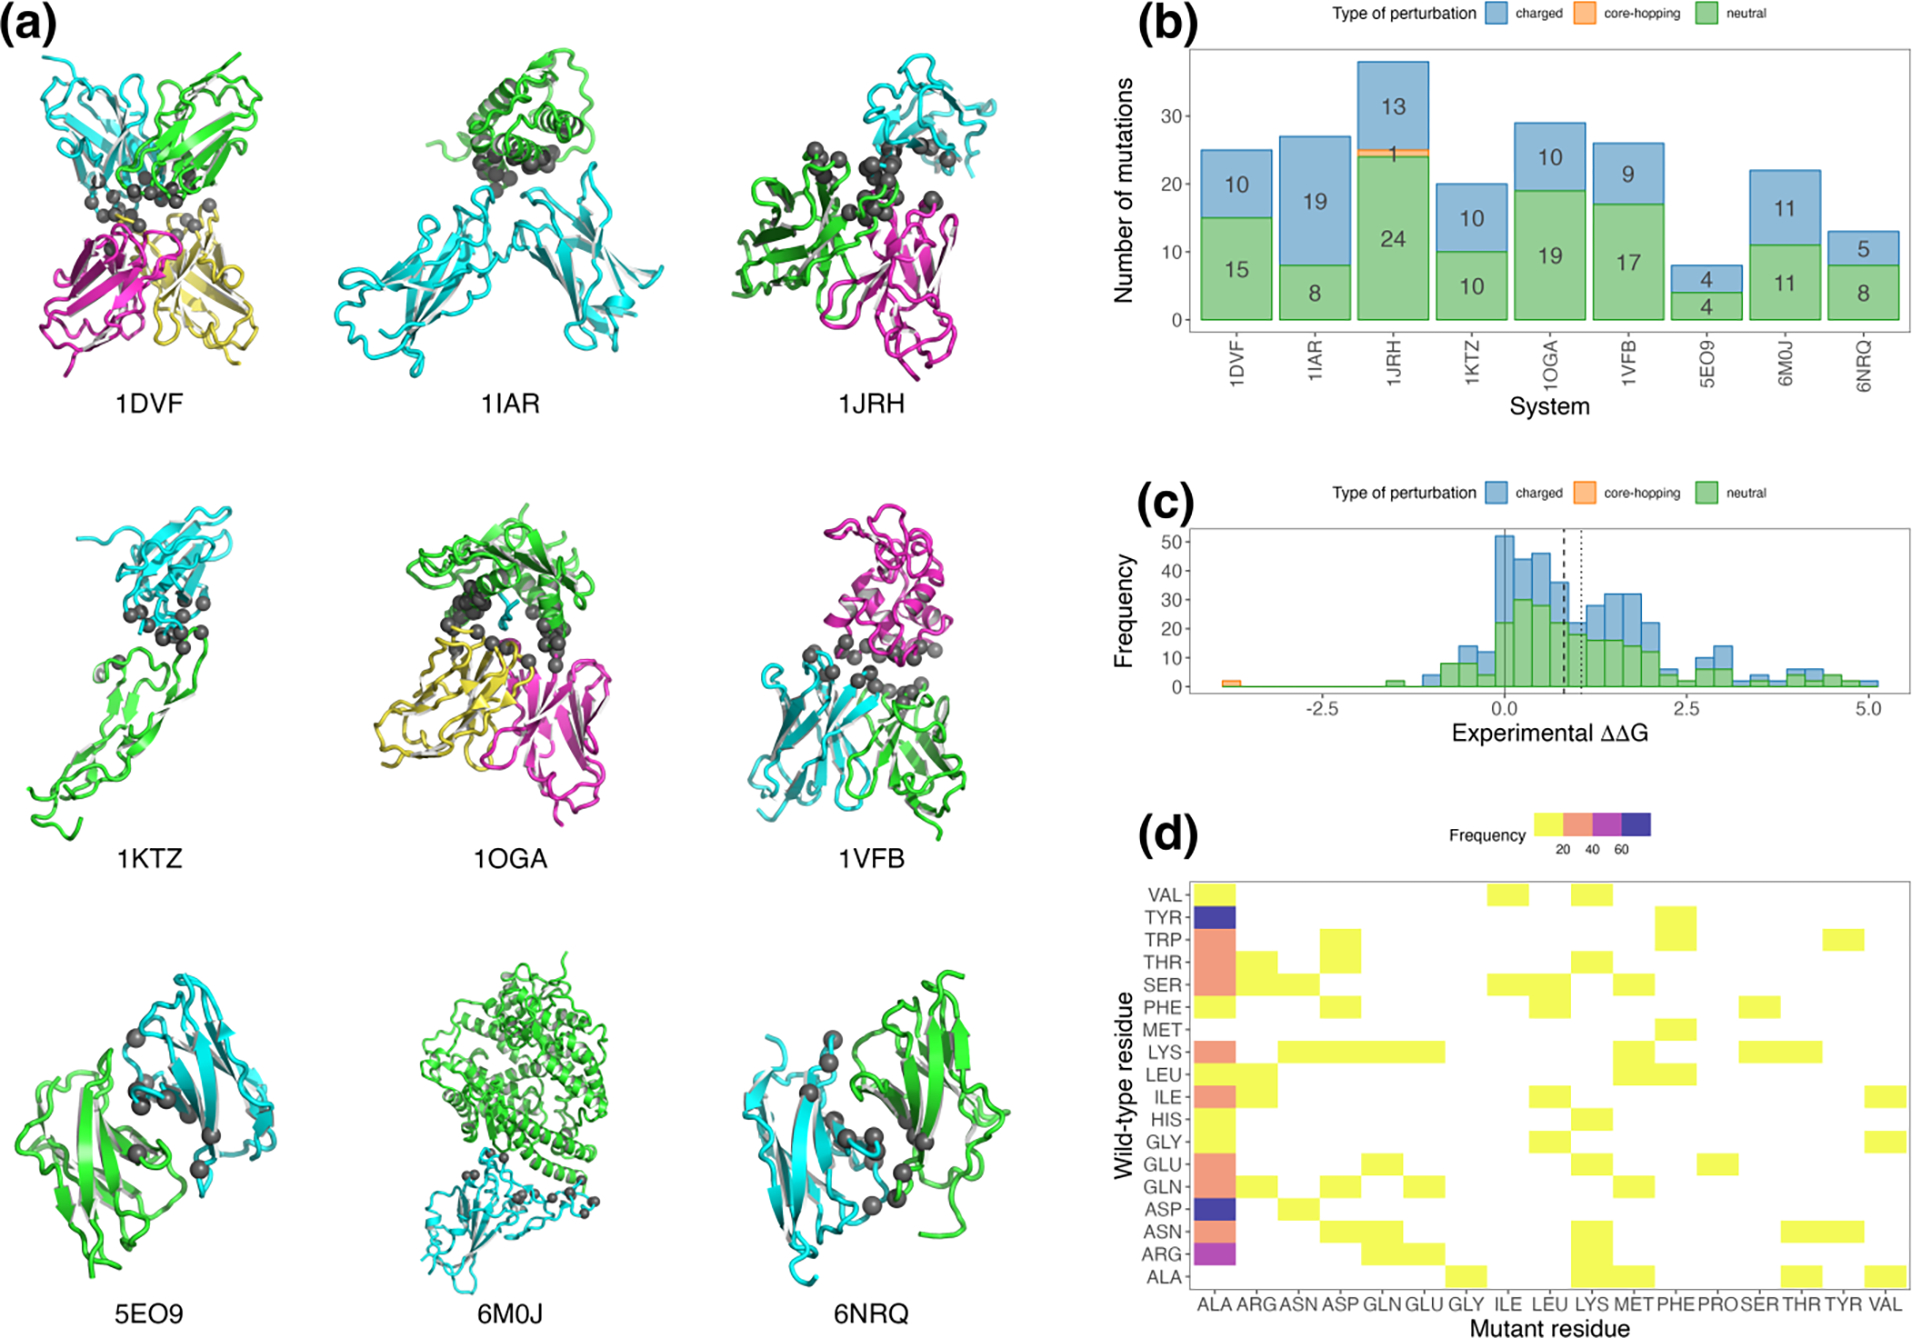
Overview of systems and mutations in the benchmark dataset. (a) Ribbon representation of each model in the benchmark dataset, colored by chain, with Cα positions of mutated residues shown as dark grey spheres. Original PDB accession codes are indicated. (b) Number of mutations per system, colored by FEP perturbation type. (c) Distribution of experimental binding values across all systems, also colored by perturbation type. Median and mean experimental values are shown as dashed and dotted vertical lines, respectively. (d) Heat map showing coverage of amino acid mutation space. Due to the distribution of mutations in the underlying experimental data, mutations to ALA are visibly over-represented.
The full benchmark dataset comprises 208 cases, with 116 neutral perturbation cases, which involve FEP mutation edges between neutral, non-titratable residues; 91 charged perturbation cases, which involve one or more residues with nonzero formal charge (for the current study, these are anionic forms of Asp and Glu; and the cationic forms of His, Lys, and Arg); and 1 “core-hopping” perturbation case, which involves proline and the corresponding change in protein backbone topology. The range of binding values relative to wt for the full dataset is −3.79 to +4.91 kcal/mol, with mean and median mutational binding values of +1.05 and +0.81 kcal/mol, respectively. Per-system statistics are presented in Table 1.
Table 1:
Summary of experimental data for each system in the benchmark dataset. Binding ΔΔG values are given in kcal/mol.
| Binding ΔΔG | Number of mutations | ||||||||
|---|---|---|---|---|---|---|---|---|---|
| System | Description | Min | Mean | Max | Range | Neutral | Charged | Core-hopping | Total |
| 1DVF | IgG1-κ D1.3 Fv / E5.2 Fv | 0.34 | 2.15 | 4.74 | 4.40 | 15 | 10 | 0 | 25 |
| 1IAR | Interleukin-4 / Interleukin-4 receptor | −0.58 | 0.88 | 3.75 | 4.33 | 8 | 19 | 0 | 27 |
| 1JRH | mAb A6 / Interferon-γ receptor | −3.79 | 1.39 | 4.91 | 8.70 | 24 | 13 | 1 | 38 |
| 1KTZ | TGF-β3 / TGF-β type II receptor | 0.22 | 1.56 | 4.04 | 3.82 | 10 | 10 | 0 | 20 |
| 1OGA | HLA-A2 + peptide / JM22 T-cell receptor | −0.46 | 0.53 | 1.93 | 2.39 | 19 | 10 | 0 | 29 |
| 1VFB | IgG1-κ D1.3 Fv / HEW Lysozyme | −0.21 | 0.95 | 3.04 | 3.25 | 17 | 9 | 0 | 26 |
| 5EO9 | Dpr6 / DIP-α | −0.91 | 0.75 | 2.15 | 3.06 | 4 | 4 | 0 | 8 |
| 6M0J | SARS-CoV-2 RBD / human ACE2 | −0.75 | 0.05 | 0.62 | 1.37 | 11 | 11 | 0 | 22 |
| 6NRQ | Dpr10/DIP-α | −1.39 | 0.80 | 2.18 | 3.57 | 8 | 5 | 0 | 13 |
| All | −3.79 | 1.05 | 4.91 | 8.7 | 116 | 91 | 1 | 208 | |
Retrospective FEP results
We ran retrospective protein FEP+ calculations for the systems in the benchmark dataset using all-atom structural models derived from the structures deposited with the RCSB Protein Data Bank (PDB), and prepared as described in the Methods section, including the addition of hydrogen atoms and assignment of protonation states expected to be dominant in the bound complex at the pH of the experimental measurements. For each system, a perturbation map was constructed as previously described [44], as a network graph with nodes representing unique variants and edges representing FEP+ perturbations (mutations) between node endpoints. We included perturbations from the starting model to all alternate protonation states of the perturbed residue for mutations to or from titratable amino acids Asp, Glu, His, and Lys. To investigate the convergence of the calculations, the FEP+ simulations were run for 100 ns, then post-processed to obtain the values for each perturbation edge at 10 ns. This post-processing was functionally equivalent to running initial 10 ns simulations followed by extension of each simulation to 100 ns.
The inclusion of alternate protonation states afforded us several options for analyzing binding values for mutations involving titratable residues. In an initial, simplistic treatment of these protonation states, we considered only the initial starting protonation state present in the prepared all-atom structural model, ignoring other possible protonation states for titratable wt residues, and reported the calculated value for the perturbation to a predefined protonation state of the mutant residue. Specifically, for this “naïve” treatment, for all mutations to the titratable residues indicated above, we used the binding values for mutations to negatively charged Asp (three-letter residue code ASP) and Glu (GLU); positively charged Lys (LYS); and the neutral tautomer of His that is protonated at the nitrogen (HIE). Binding values to other protonation states (neutral ASH, GLH, LYN, and HID; and positively charged HIP), and the states of titratable wt residues not represented by the prepared input model were not considered.
Results for 10 and 100 ns FEP+ calculations with naïve treatment of protonation states are shown in the upper panels of Figure 2. Overall root mean square error (RMSE) for these naïve calculated values compared to experimentally measured values are 1.65 and 1.42 kcal/mol, and coefficient of determination (R2) values are 0.29 and 0.27, for 10 and 100 ns results, respectively. A report of per-system dataset statistics can be found in Table 2.
Figure 2:
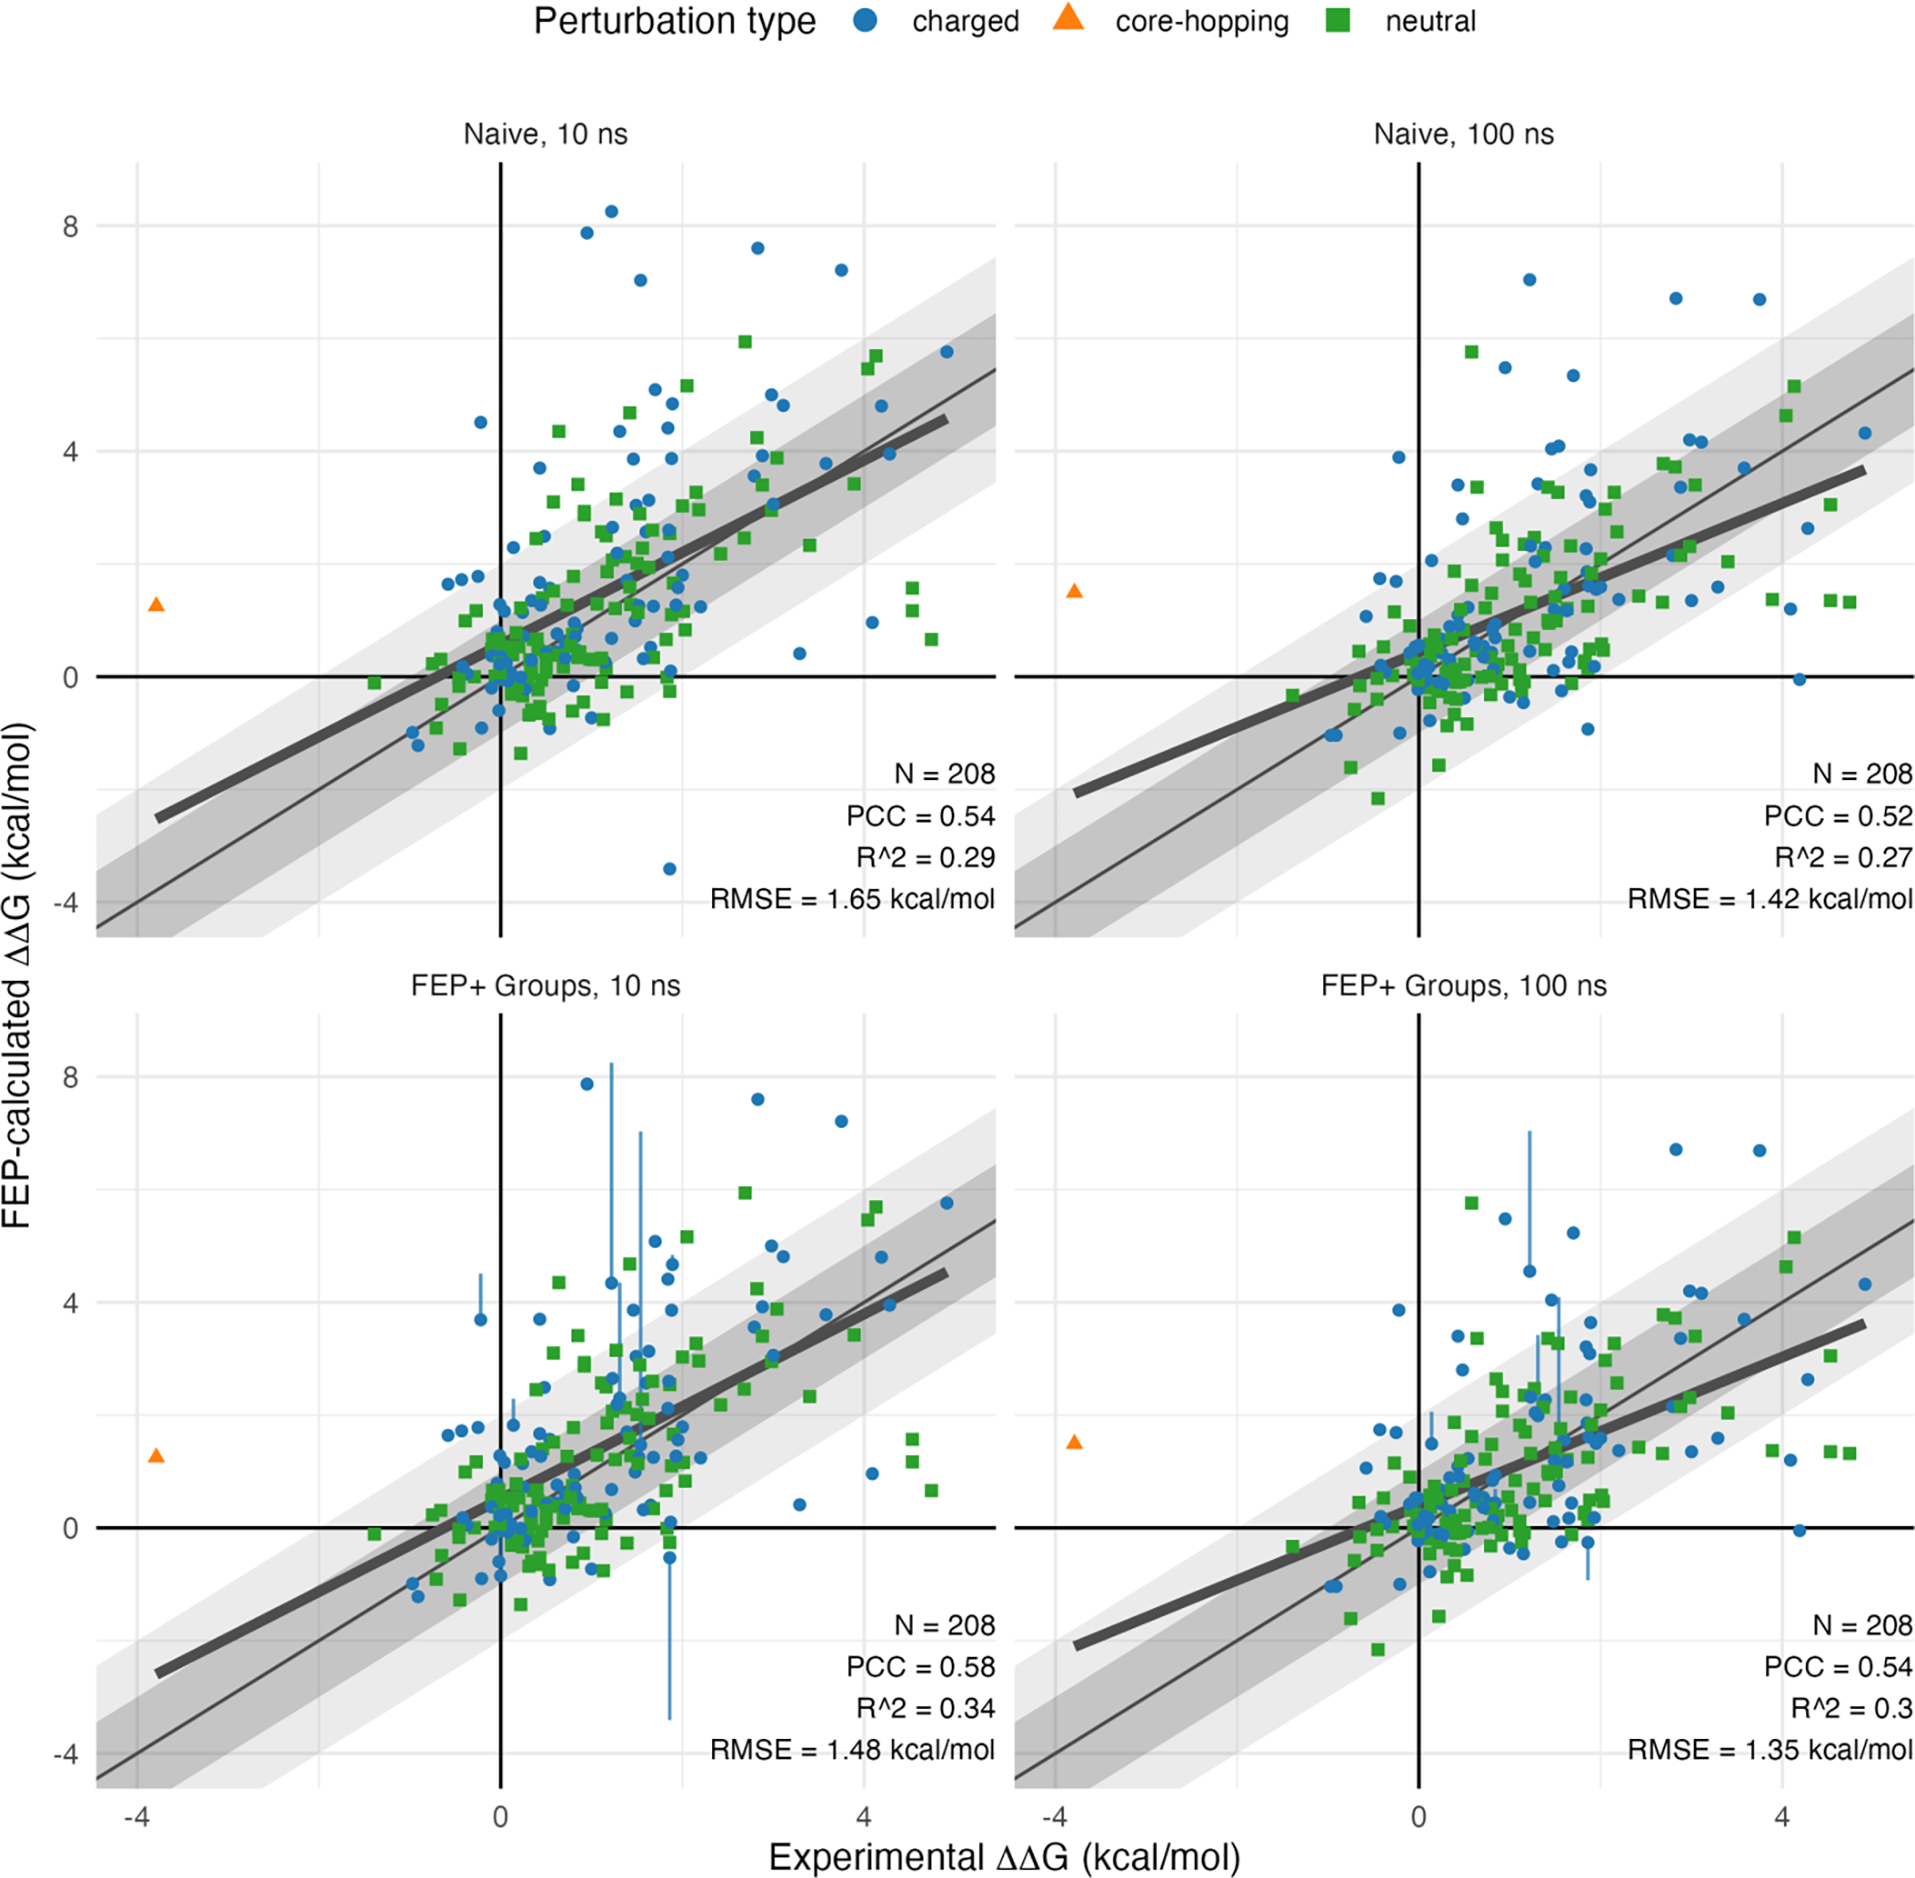
FEP+ results versus experiment. Correlation plots of FEP+ predicted binding vs. experimental binding relative to WT for the benchmark dataset mutations. Results are shown for 10 ns (left) and 100 ns (right) FEP+ calculations, with both naïve (top) and FEP+ Groups (bottom) treatment of protonation states. Grey and light grey diagonal shaded areas represent regions of absolute error less than 1 and 2 kcal/mol, respectively. A least squares best fit line (bold) and relevant correlation statistics are indicated for each plot.
Table 2:
Summary of retrospective FEP+ results compared to experimental data for each system in the benchmark dataset. Predicted binding ΔΔG error and correlation statistics are shown for 10 and 100 ns simulations, with naïve and FEP+ Groups treatment of protonation states for each. Root mean square error (RMSE) values are given in kcal/mol.
| 10 ns | 100 ns | |||||||
|---|---|---|---|---|---|---|---|---|
| Naïve | FEP+ Groups | Naïve | FEP+ Groups | |||||
| System | RMSE | R 2 | RMSE | R 2 | RMSE | R 2 | RMSE | R 2 |
| 1DVF | 1.83 | 0.30 | 1.57 | 0.36 | 1.74 | 0.26 | 1.70 | 0.27 |
| 1IAR | 2.45 | 0.44 | 1.97 | 0.57 | 2.04 | 0.50 | 1.76 | 0.57 |
| 1JRH | 1.83 | 0.26 | 1.82 | 0.26 | 1.78 | 0.20 | 1.77 | 0.21 |
| 1KTZ | 0.87 | 0.74 | 0.87 | 0.74 | 0.85 | 0.78 | 0.85 | 0.78 |
| 1OGA | 0.61 | 0.15 | 0.63 | 0.19 | 0.68 | 0.08 | 0.68 | 0.12 |
| 1VFB | 1.86 | 0.33 | 1.86 | 0.33 | 1.36 | 0.27 | 1.36 | 0.27 |
| 5EO9 | 1.55 | 0.61 | 1.55 | 0.61 | 1.02 | 0.78 | 1.02 | 0.77 |
| 6M0J | 0.66 | 0.31 | 0.66 | 0.31 | 0.67 | 0.47 | 0.67 | 0.47 |
| 6NRQ | 1.95 | 0.54 | 1.22 | 0.66 | 1.05 | 0.64 | 0.80 | 0.67 |
We found that on average the longer 100 ns simulations resulted in smaller overall errors, but similar correlation coefficients, compared to the more typical 10 ns simulations. This was not surprising, as the cases where initial configurations of the mutants were in high energy conformations were partially relaxed in the 100 ns simulations, but likely required even longer time for full relaxation. Notably, relatively few cases showed substantial change in predicted binding between the 10 ns and 100 ns timepoints, with median absolute shifts of 0.33 kcal/mol, as shown in Supplemental Figure 2.
Effect of Protein FEP+ Groups treatment
Several of the large outliers among the naïve treatment results involved mutation to or from titratable residues. The preferred protonation states of these titratable residues might differ between the relevant physical macrostates, namely the bound protein-protein complex and the unbound protein in solution. In the physical system, these alternate protonation microstates are able to interconvert freely, with the populations of the protonated or deprotonated microstate of each titratable residue at the experimental pH being determined by its pKa in the given physical macrostate. A more robust approach to analyzing such mutations requires considering all microstates as a single statistical mechanical ensemble, to better reflect the physical system that was tested experimentally. The method we developed to implement this robust treatment of alternate protonation states, called Protein FEP+ Groups, groups together nodes (mutational variants) in the FEP+ perturbation map that represent the same physical amino acid sequence but differ in modeled protonation state, and a single, population-based, Boltzmann-weighted predicted binding is calculated for the entire ensemble of protonation microstates in the node group. The pH-dependent per-site population of each protonation microstate is obtained via the calculated pKa of the specific amino acid residue at the given titratable site (residue position) in the given physical macrostate. The Protein FEP+ Groups treatment is described in more detail in the Methods section below.
Two examples of FEP+ Groups treatment are presented in Figure 3. As shown in Figure 3(a), 1IAR A:W91 was mutated to Asp, so we considered both the deprotonated ASP as well as protonated ASH forms for the mutant. Experimentally the Asp mutation yielded a binding of +1.31 kcal/mol, but the naïve prediction of +3.42 was overly unfavorable. When all protonation states were considered, the largely hydrophobic surrounding environment resulted in unfavorable binding s for both the charged and neutral forms, but the neutral ASH form was favored over ASP by nearly 3 kcal/mol in the binding interface, despite the presence of a nearby Arg side chain. FEP+ Groups-calculated pKas of the mutant Asp in the unbound protein and in the context of the protein-protein binding interface indicated a change in preferred protonation state upon binding at the experimental pH of 7.2. In the unbound state, the deprotonated ASP form was calculated to be dominant, with an A:D91 side chain pKa of 6.5; whereas in the bound state, a higher complex pKa of 8.5 indicated a preference for the neutral ASH form. Accounting for this change in dominant protonation state, the FEP+ Groups treatment yielded a more accurate predicted of +1.99 kcal/mol, corresponding to a decrease in absolute error from 2.11 to 0.68 kcal/mol.
Figure 3:

Protein FEP+ Groups treatment example cases. Ribbon representations of either the wt input structure or a representative mutant trajectory frame, with the chain(s) for the binding component that includes the mutation shown in light grey, the binding partner chain(s) in tan, and key polar interactions as dashed yellow lines. FEP-calculated 100 ns binding values for mutation edges are shown along solid arrows, and FEP-based calculated pKas for titration edges in the bound (complex) and unbound (solvent) forms are shown along the horizontal dashed arrows. Experimental, naïve, and FEP groups-treated values are listed in kcal/mol. (a) For 1IAR A:W91D the calculated pKas for the mutant Asp91 carboxylate indicated a change in dominant protonation state between the unbound and bound forms at experimental pH. FEP+ Groups treatment resulted in reduced absolute error compared to the naive result. (b) The 6NRQ C:Q138D mutant Asp138 carboxylate had elevated FEP-calculated pKa values in both unbound and bound states, reflecting the largely hydrophobic residue environment, limited solvent access, and the conformational change required to form a salt bridge with D:K81. FEP+ Groups treatment again increased accuracy with respect to the experimental value.
A second example, shown in Figure 3(b), is 6NRQ C:Q138D. This mutation was also unfavorable experimentally (+1.54 kcal/mol), but the naïve predicted value was again too highly destabilizing (+4.09). In the crystal structure, the wt C:Gln138 side chain acts both as an H-bond donor (to the C:Glu136 side chain as well as to the D:Lys81 backbone carbonyl) and as an H-bond acceptor (from D:Ile83 backbone N–H). Mutation to either Asp state was predicted to be unfavorable, due to the disruption of these interactions. FEP+ Groups treatment produced a predicted of +0.75, reducing the error from 2.55 to 0.79 kcal/mol. Due to hydrophobic contacts and the proximity of C:Glu136, FEP+ Groups-calculated pKas for both physical macrostates were significantly elevated compared to the pKa value of 3.67 for an isolated Asp in solution [45], with calculated pKa values of 8.4 (unbound) and 10.9 (bound), thus indicating the neutral ASH form was preferred in both unbound and bound states at the experimental pH of 7.2. Accordingly, in this case mutating to ASH alone would have provided a good estimate of the FEP+ Groups-treated value, due to the minimal contribution of the high-energy (and therefore low-prevalence) ASP state, though this would not necessarily have been apparent based on the input structure alone.
After applying the FEP+ Groups treatment to the retrospective calculations, we observed decreased RMSE and increased Pearson correlation coefficient (PCC) and R2 at both 10 and 100 ns time points. These results are presented in the lower plots of Figure 2. The number of cases where this groups treatment substantially affects the results is relatively small, with differences larger than 0.25 kcal/mol observed among the 100 mutations involving titratable residues for 8 and 6 cases, for the 10 and 100 ns results, respectively. Importantly, Protein FEP+ Groups treatment yielded calculated values with reduced absolute error compared to experiment on average: among these cases involving titratable residues, FEP+ Groups treatment resulted in decreased RMSE at both timepoints, from 2.33 to 1.48 kcal/mol at 10 ns, and from 1.83 to 1.35 kcal/mol at 100 ns.
Analysis of outliers
The FEP+ results from longer simulation time and rigorous treatment of titratable residues yielded accuracy consistent with results from previous studies, with RMSE in the range of about 1.0–1.5 kcal/mol [17,18]. However, a number of mutations exhibited absolute errors in binding larger than 2 kcal/mol compared to experiment, which would reduce the prediction accuracy in prospective studies. In an effort to investigate the limitations of the current default protein binding FEP+ methodology and guide future methods improvement, we systematically examined the cases from the 100 ns FEP+ Groups-treated results with the largest errors relative to experiment and identified common features for these outliers which might be useful for prospective application of the method. We initially focused on cases with absolute errors larger than 2 kcal/mol, which totaled 19 cases, or about 9% of the full dataset. Close inspection of the wt crystal structures, mutant FEP+ starting models, and FEP+ trajectories for these cases suggested several distinct sources of error, which are summarized in Table 3. These error sources can broadly be categorized as either sampling errors, where the system had not yet fully relaxed or failed to sample relevant areas of conformation space; or force field errors, where specific interaction types may not be handled properly by the current OPLS4 force field. Examples of the various outlier classes are shown in Figure 4.
Table 3:
Manual classification of outlier cases with absolute error > 2 kcal/mol relative to experiment. Cases within each outlier class are sorted by decreasing absolute error. All ΔΔG and error values are given in kcal/mol.
| Error type | Outlier class | System | Mutation | Exp. ΔΔG | Pred. ΔΔG | Error | Abs. Error |
|---|---|---|---|---|---|---|---|
| Sampling | Disrupted salt bridge (interfacial, trans) | 1IAR | A:R88Q | 2.83 | 6.71 | 3.88 | 3.88 |
| 1IAR | A:R85E | 1.22 | 4.55 | 3.33 | 3.33 | ||
| 1IAR | A:R85A | 0.43 | 3.40 | 2.97 | 2.97 | ||
| 1IAR | A:R88A | 3.75 | 6.69 | 2.94 | 2.94 | ||
| 1IAR | A:R81E | 1.46 | 4.04 | 2.58 | 2.58 | ||
| 1IAR | A:R81A | 0.48 | 2.80 | 2.32 | 2.32 | ||
| Disrupted salt bridge (interfacial, cis) | 1VFB | C:D119A | 0.95 | 5.48 | 4.53 | 4.53 | |
| Disrupted salt bridge (internal) | 1DVF | B:E98A | 4.19 | −0.05 | −4.24 | 4.24 | |
| Introduced charge | 1IAR | A:T13D | −0.22 | 3.86 | 4.08 | 4.08 | |
| Buried aromatic, large size change | 1JRH | L:Y91A | 0.58 | 5.76 | 5.18 | 5.18 | |
| 1JRH | H:H100BA | 1.70 | 5.23 | 3.53 | 3.53 | ||
| 1VFB | B:W52A | 0.64 | 3.36 | 2.72 | 2.72 | ||
| Problematic starting conformation | 1JRH | I:G50A | 4.53 | 1.35 | −3.18 | 3.18 | |
| 1JRH | I:E55A | −0.43 | 1.74 | 2.17 | 2.17 | ||
| 1DVF | D:H33A | 1.86 | −0.26 | −2.12 | 2.12 | ||
| Loop rearrangement | 1DVF | D:Y98A | 4.74 | 1.32 | −3.42 | 3.42 | |
| 1DVF | D:R100BA | 4.09 | 1.20 | −2.89 | 2.89 | ||
| Proline | 1JRH | I:E55P | −3.79 | 1.49 | 5.28 | 5.28 | |
| Force Field | Disrupted π interaction | 1JRH | I:N53A | 3.89 | 1.37 | −2.52 | 2.52 |
Figure 4:

Classes of outlier cases with absolute errors greater than 2 kcal/mol. Structural images in ribbon representation, with key wt sidechains shown as thin sticks, colored by chain and atom type. Mutations are indicated above each panel and mutated residues are shown in ball-and-stick representation. (a) Salt bridge-breaking cases include trans (left two panels) and cis (second from right panel) interface salt bridges, and an internal salt bridge between the heavy and light chains of an antibody Fv region (right panel). (b) Two outlier cases introduced a buried charge. (c) A variety of sampling related cases. (d) Outliers resulting from mutation of buried aromatic residues to much smaller alanine. (e) One force field-related case involved a disrupted -hydrogen bond interaction.
Outliers due to insufficient sampling and other conformational issues
The largest outlier class comprised 7 cases, one-third of the outlier cases, where mutation resulted in the elimination of a salt bridge present at the binding interface in the wt structure. These are depicted in Figure 4(a). All seven cases were unfavorable experimentally, with binding s ranging from +0.43 to +3.75 kcal/mol, but FEP+ consistently predicted them to be too unfavorable with signed errors ranging from +2.3 to +4.5 kcal/mol. Six of the cases (which were all mutations at one of three Arg positions in the 1IAR system: A:R81A/E, A:R85A/E, and A:R88A/Q) disrupted trans salt bridges, that is, salt bridges involving residues from both protein binding components, whereas one case (1VFB C:D119A) disrupted a cis salt bridge, between two residues from the same side of the interface. We observed that the mutated residues in these outlier cases were largely buried, such that upon mutation of one of the two residues forming a salt bridge, the remaining partner residue was left in an unstable configuration: a charged residue, buried at the interface with limited solvent accessibility. FEP+ correctly predicted unfavorable positive binding values for all 7 of these cases, but dramatically overestimated the magnitude: for the 6 trans salt bridge cases, FEP+ overpredicted the unfavorability of the mutations by approximately 3 kcal/mol.
Two related outlier classes also involved unstable charged configurations upon mutation. The first of these, shown in Figure 4(b), involved a single case where a salt bridge was disrupted upon mutation, but the mutated residue was entirely buried within the mutated protein. Specifically, for 1DVF B:E98A (expt. +4.19; pred. −0.05), in the wt structure residue B:Glu98 forms a salt bridge with A:Arg96 across the internal VH−VL heterodimerization interface, between the heavy and light chain variable domains of the antibody Fv region. Although close to the binding interface, this residue was buried in the unbound antibody and not in contact with the binding partner, and therefore not directly involved in binding. The mutation disrupting the salt bridge between the heavy and light chains of the antibody could significantly change the relative orientation between the VH and VL domains, thus disrupting the binding with binding partner. However, the relatively short timescale (100 ns) in FEP+ simulations was not sufficient to fully relax the conformations of and relative orientation between the mutant VH and VL domains in the unbound mutant structure, resulting in an underprediction of the unfavorability of the mutation and a large absolute error of 4.24 kcal/mol. The final charge-related outlier, shown in Figure 4(c) was 1IAR A:T13D (expt. −0.22; pred. +3.86) where a neutral residue was mutated to a charged amino acid at a largely buried position at the protein-protein complex interface. This sort of charge-introducing mutation is functionally similar to the salt bridge-breaking cases, in that the end result is an unpaired charge in an unfavorable configuration, which likely requires substantial relaxation to adopt a conformation not accessible on typical FEP+ timescales. We noted that there were also several charge-flipping cases in our dataset, whose mutations inverted the sign of the charge on the amino acid side chain, resulting in a net change in formal charge of ±2. Two of these (1IAR A:R85E and A:R81E) were among the salt bridge-breaking cases described above, but the other two (1IAR A:K12E and A:K84D), were also unfavorable experimentally and gave signed errors greater than +1 kcal/mol, suggesting that these types of buried (or mostly buried) unpaired charges resulting from charge flipping perturbations also tend to be undersampled.
Figure 4(d) depicts an outlier class consisting of three cases (1JRH L:Y91A and H:H100BA; and 1VFB B:W52A) which involved mutations of larger aromatic residues, buried in the complex structure, to much smaller side chains, namely alanine. All three were modestly unfavorable experimentally (+0.6 to +1.7 kcal/mol), but FEP+ overpredicted the unfavorability by 3–5 kcal/mol. Due to their large surface area and low solvent accessibility, the aromatic residue side chains at these positions made numerous interactions in their respective wt structures, including hydrophobic interactions, hydrogen bonds, and interactions. When such large side chains were eliminated from the structure entirely (rather than being replaced with a similarly sized amino acid), the 100 ns FEP+ simulations appeared not to have been sufficiently long to allow for full relaxation and rearrangement of the surrounding residues into the resulting void, thereby producing FEP+ predictions that were too highly unfavorable. This type of slow convergence behavior was previously observed for TRP->ALA mutations in a dataset with anti-HIV-1 antibodies in complex with HIV-1 gp120 spike proteins [17]. Notably, the wt residues for the two 1JRH cases here (L:Tyr91 and H:His100B) are adjacent and interact in the complex, suggesting a common mode of error for both.
An outlier class with errors derived from sampling issues related to starting model conformations, shown in Figure 4(e), included 1DVF D:H33A and three mutations on a loop in the 1JRH system, namely I:G50A, I:E55A, and I:E55P. In the 1DVF D:H33A case (expt. +1.86, pred. −0.26), which is presented in more detail in Supplemental Figure 3, the geometry of the wt D:His55 residue (modeled as HIP) from the crystal structure showed its Nε proton interacting with two side chain carboxylate groups, from D:Asp52 (in cis) and B:Asp100 (in trans). In the 100 ns FEP+ simulation, this initial geometry resulted in poorly defined, low-persistence interactions with the two carboxylate groups for approximately the first 50 ns of the simulation, after which a stable configuration appeared with the His55 ring flipped 180° and its and protons each forming hydrogen-bonding salt bridge interactions with one of the two Asp side chains. The lack of these interactions for much of the wt trajectory from the FEP+ calculations resulted in an underestimation of the unfavorability of the mutation. A subsequent standard MD simulation of the wt structure resulted in rapid adoption of the stable, dual-salt bridge configuration of the imidazole ring, which remained stable throughout the trajectory. Furthermore, running the D:H33A mutation by FEP+ using the final frame of this MD trajectory as the input model yielded an accurate binding prediction of +1.56 kcal/mol, within 0.30 kcal/mol of the experimentally determined value of +1.86 kcal/mol. This result suggests the starting conformation of D:His33 may be the result of a modeling error in the original crystal structure; unfortunately the 1DVF PDB entry has no associated experimental diffraction data, so it is not possible to ascertain the degree to which this FEP+ and MD-validated conformation of D:His33 might be more consistent with the experimental crystal context than the originally deposited conformation.
The 1JRH I:G50A (expt. +4.53, pred. +1.49), I:E55A (expt. −0.43, pred. +1.74), and I:E55P (expt. −3.79, pred +1.63) cases, which are also depicted in Supplemental Figure 4, each involve mutation of a residue on the flexible I:50–56 loop of the interferon receptor 1 (IFNγR1) antigen. The first of these, 1JRH I:G50, is located in a tight turn with geometry resembling a -turn, and backbone and angles that make it an outlier in the Ramachandran plot for the crystal structure (Supplemental Figure 4 a–b) This high-energy backbone conformation would require substantial relaxation to achieve the true lowest energy conformation. Indeed, two other crystal structures (1FYH chain B, and 6E3L chain D) show IFNγR1 adopting an alternative conformation of the I:50–56 loop, further suggesting that the conformation in the 1JRH crystal structure may be suboptimal. The second mutation site on this loop, 1JRH I:E55, has a side chain that is highly solvent exposed in the complex, making no direct contact with any antibody residue in the wt crystal structure. It is approximately 6 Å from two different primary amino groups—namely the solvent-exposed (and therefore flexible) H:Lys64 side chain and the N-terminal amino group from L:Ser1—and FEP+ and MD trajectories show it interacting with the charged N-terminus of chain L. Mutation to Ala eliminated this charged interaction, thus accounting for the unfavorable prediction by FEP+. In this case, where the starting structure is substantially unrelaxed, random variation in the direction and degree of relaxation among different simulations can lead to high levels of noise in predicted results as compared to experiment. In other words, the interaction with the charged chain L N-terminus may not be representative of the physical system. More generally, for mutation of any non-contact residue in a crystal structure to yield a binding significantly different from zero essentially requires some conformational rearrangement, either in the unbound form, the bound form, or both. Accurate simulation of such conformational changes would necessitate sampling beyond what is achievable in the standard protein binding FEP+ workflow, thus rendering cases of this type not typically suitable for protein binding FEP+ simulation using standard protocols. Notably mutations of 1JRH I:G50 to Ala; and I:E55 to Ala and Pro result in errors of similarly large magnitude, but opposite signs. Whereas we attribute the negative signed error of the I:G50A mutation to initial strain in the wt complex; the large positive signed errors for the I:E55 mutations to Ala and especially Pro in this flexible loop suggest that further relaxation of the mutant bound complex is required, and is more pronounced in the Pro case, likely due to a change in the loop backbone conformation required to compensate for the rigidity of the Pro backbone.
A final sampling-related outlier class, shown in Figure 4(f), involved mutations in the 1DVF antibody CDR H3 loop, D:Y98A (expt. +4.74, pred. +1.32) and D:R100BY (expt. +4.09, pred. +1.2). These outliers exhibited the negative signed FEP error common to cases involving unsampled rearrangement in the unbound mutant protein. Both cases were predicted to be modestly unfavorable, but experimentally were much more unfavorable. For each of these cases, we repredicted the conformation of the CDR H3 loop in the unbound free antibody, and in each case identified a different loop conformation with lower energy than the crystal structure-like conformation (Supplemental Figure 5). These results suggest the error in the FEP+ predictions may be at least partially due to this type of unsampled H3 loop rearrangement in the unbound mutant protein.
Outlier attributed to force field limitations
For one outlier case, we hypothesized that the deviation from the experimentally measured binding value resulted from a limitation of the fixed-charge force field used in FEP+ simulations. More specifically, the case in question, 1JRH I:N53A (expt. +3.89, pred. +1.37), involved mutation of a residue that participates in a well-defined interaction in the wt crystal structure. As depicted in Figure 4(g), the interaction in question, rather than a more typically discussed or -cation interaction, was instead a -hydrogen bond [46] between the wt Asn sidechain amide and the electron cloud of the 6-membered aromatic ring of I:Trp96. Due to the fixed-charge nature of the OPLS4 force field, it was not possible for the FEP+ calculation to account for the contribution of this interaction to the stability of the wt complex, which resulted in a predicted binding value that was too favorable by 2.5 kcal/mol.
We investigated this putative force field-related outlier via a 100 ns FEP+ calculations run with a developmental version of the OPLS force field which includes explicit polarization of aromatic residue sidechains. The FEP+ results with explicit polarization resulted in substantial improvement of the predicted binding , to +3.09 kcal/mol (an error of −0.8 compared to experiment). This preliminary result reflects an increased stabilization of the wt complex by more accurately modeling the energetics of the -hydrogen bond between the Asn and Trp sidechains, and suggests the inclusion of explicit polarization in future versions of the OPLS force field may yield improved results in similar cases.
Automated detection of probable outliers
Based on the above observations about the largest outliers in the benchmark dataset, we developed an automated method for detecting cases where a protein binding FEP+ calculation is likely not able to accurately predict the effect of mutations on the binding affinity. These probable outliers are identified based on information available in the output perturbation map (.fmp) file from the protein binding FEP+ job. This map file contains structural information for the starting models used in simulation for both wt and mutant nodes (protein variants), as well as free energy time series data and a summary report of interactions made by the wt and mutant residues at the mutated position for each perturbation edge (mutation).
The automated script uses two sets of empirical rules to flag probable outlier cases. The first set identifies cases that break salt bridges or otherwise introduce or flip charges at buried or mostly buried sites. A second set of rules identifies cases that involve either mutation of large aromatic residues to substantially smaller residues at buried sites; or mutation to Proline, which has unique backbone torsional characteristics among the amino acids. These rules use the features derived from the perturbation map as well as a set of five orthogonal, tunable parameters: 1) a fractional solvent-accessible surface area (fSASA) cutoff to classify buried residues; 2) a number of charged neighbors cutoff to identify interacting clusters of charged or titratable amino acids; 3) a residue size change cutoff to identify large changes in the number of heavy (non-hydrogen) atoms; 4) an interaction frequency cutoff as a threshold for defining trajectory-derived interactions; and 5) a predicted cutoff to identify highly destabilizing perturbations. For the results described in this manuscript, we used an fSASA cutoff of 0.1; charged neighbors cutoff of 6; residue size change cutoff of 5; interaction frequency cutoff of 0.5; and cutoff of 2.5 kcal/mol.
The automated outlier prediction script flagged 22 potentially problematic cases among a total of 208 mutations from the 100 ns FEP+ Groups-treated benchmark dataset. This included 12 out of 19 outlier cases with absolute errors > 2 kcal/mol (63%). Additionally we marked as probable outliers 7 cases out of 55 with absolute errors between 1–2 kcal/mol (13%). Of the 134 well predicted cases with absolute errors < 1 kcal/mol, only 3 (2%) were flagged as likely outliers. A summary of the flagged cases is presented in Table 4.
Table 4:
Summary of automatic flagging of probable outlier cases by magnitude of FEP+ predicted binding ΔΔG error vs. experiment.
| Error range | Flagged | Unflagged | % Flagged |
|---|---|---|---|
| >2 kcal/mol | 12 | 7 | 63 |
| 1–2 kcal/mol | 7 | 48 | 13 |
| 0–1 kcal/mol | 3 | 131 | 2 |
Empirical correction of charged outlier cases
We observed that the magnitudes of the errors for the automatically flagged charge-related outlier cases from the benchmark dataset were relatively consistent across the individual outlier categories, with a mean absolute error of 2.8 ± 1.0 kcal/mol. Indeed, when one considers that the source of the error in each of the categories is the same—namely, insufficient sampling after burial of a charge without an oppositely charged partner residue—this is not unexpected. Therefore, we sought to define an empirical correction term that could be applied generally to such automatically flagged charge-related cases.
In each case, the sign of the error relative to experiment depended only on the location of the offending charged residue, regardless of whether the charge was introduced with the mutation or left unpaired by mutation of a neighboring residue. Specifically, unpaired charges at the binding interface always exhibited a positive signed error in the FEP+ prediction relative to experiment, that is, the predicted binding values were too unfavorable. Whereas, leaving an unpaired charge internal to one of the proteins and not involved in binding, as described above for 1DVF B:E98A, resulted in a negative signed error. This was consistent with our interpretation that in the case of a positive signed error, the mutant bound complex was insufficiently relaxed in simulation, thereby causing the predicted to be too unfavorable. Conversely, for 1DVF B:E98A (which was the only example among these cases with a negative signed error), the antibody Fv must retain or adopt the binding-competent conformation observed in the crystal structure in order to bind the antigen, but in order to alleviate the buried charge at the VH−VL interface, the unbound antibody Fv region in the physical system would readily relax to a lower-energy conformation, which was unable to be sampled on the timescale of these calculations. The associated reorganization penalty in the unbound mutant state was missing from the FEP+ calculation, resulting in a predicted value that was too favorable compared to experiment. Given these well-defined criteria for determining the sign of the charged outlier correction term, starting with the predicted value for each case we either subtracted (all binding interface charged outlier cases) or added (1DVF B:E98A only) 2.8 kcal/mol to produce empirically corrected predicted values.
After applying the empirical correction to the charged outlier cases, and excluding the other automatically flagged cases, which we treat as lower confidence predictions more likely to require extensive investigation or non-default FEP+ protocols, or in some cases to be beyond the domain of applicability of FEP+, we observed improved overall error and correlation statistics for the benchmark dataset. These results are presented in Figure 5(a), and demonstrated a marked improvement in both RMSE (which decreased from 1.35 to 1.03) and R2 (which increased from 0.3 to 0.42) compared to the full 100 ns FEP+ Groups treated dataset as shown in the lower right panel of Figure 2.
Figure 5:

Automated classification and empirical correction of FEP+ outliers for the benchmark dataset. (a) Correlation plots 100 ns FEP+ Groups-treated results vs. experiment, before and after automated outlier flagging and empirical correction of charged outlier cases. Flagged outlier categories are indicated. The direction and magnitude of the applied correction for charged outlier cases is indicated by orange vertical tails. One case (1JRH I:N53A) which demonstrated substantial improvement in preliminary testing of a force field with explicit polarization is indicated by a green circle and a green vertical tail in the right plot. Diagonal shaded areas, least squares fit line, and statistics are shown as in Figure 2. (b) Three-class confusion matrices for the data from (a), with values classified as either favorable (), unfavorable (), or neutral .
Utility of FEP+ calculations for prospective design
For in silico free energy predictions to be generally useful in prospective design, they should be able to classify the relative binding values of mutations as favorable, unfavorable, or neutral with good accuracy. In Figure 5(b) we show a 3-class confusion matrix for the 100 ns FEP+ Groups-treated results after applying the empirical correction for charged outlier cases described above and excluding the other automatically flagged cases indicated in Figure 5(a). Mutations were classified as either favorable (binding ), neutral ( between −0.5 and 0.5 kcal/mol), or unfavorable (), using experimentally observed and FEP-predicted relative binding free energy changes. We found that the FEP+ predictions successfully classified cases from the benchmark dataset with an overall balanced accuracy (arithmetic mean of sensitivity and specificity) of 0.69. Additionally, only 3 outlier cases remained with a classification error larger than 1 class, indicating that the automatic flagging procedure successfully identified for removal from the high confidence dataset many of the predictions with the largest errors.
Computational results are often used as a “pre-filter” step in the molecular design process, to narrow the scope and cost of a project by limiting the number of designs taken forward into the experimental validation stage of the process. For the typical goal of identifying experimentally favorable “active” mutations, if we were to take the full benchmark set as a hypothetical example and consider the most restrictive application of these classification results with only cases having calculated of −0.5 kcal/mol or less (using the unflagged 100 ns cases after FEP+ Groups treatment of protonation states and automated outlier flagging and empirical correction) to be tested by experiment, this would result in the experimental testing of only 13 variants, with a positive hit rate of 31%, and a recovery of 4 out of 8 actives, or 50%. If we were to use a less stringent approach and include neutral mutations—that is, proceeding with experimental testing of all cases with calculated of +0.5 kcal/mol or less, this would result in experimental measurement of 100 variants, a positive hit rate of 7%, and recovery of 88%, with 7 out of 8 true actives in the experimental dataset classified as neutral or favorable in FEP+ predictions, and leaving only 1 false negative (experimentally active but predicted unfavorable by FEP+), while reducing the number of experimental mutations by 50%, potentially providing significant speedup and cost savings.
Case studies for application of protein binding FEP+ calculations
We also sought to validate the automated outlier classification scheme above using “real-world” test data. In Figure 6(a), we present the results of running 100 ns protein binding FEP+ calculations with FEP+ Groups treatment of alternate protonation states and automated probable outlier classification and empirical correction, as described above, on a dataset of three case studies from previously active protein biologics design projects. The experimental dataset included SPR measurements for wt and single-residue mutation variants for two antibody-antigen systems and one peptide-target system. The antibody-antigen systems included PDB 3SKJ, a complex between the Fab region of the 1C1 antibody and EphA2, with SPR binding affinity measurements for the wt complex and 18 Fab 1C1 mutations (presented in Supplemental Table 1); and PDB 5L6Y, a complex between the Fab region of tralokinumab and IL-13 antigen, with measurements for wt plus 6 tralokinumab variants (Supplemental Table 2). The cyclic peptide-target complex, presented in Supplemental Table 3, were based on PDB structure 6SBA, a complex between VGL4-mimetic cyclic peptide 4E and mouse TEAD, and included the wt complex and 18 peptide variants, including several measurements from a previous study [47]. The experimental binding data, including kinetics measurements for the two antibody systems, are also available in machine-readable form in the GitHub repository accompanying this study (see Data Availability).
Figure 6:

Application of automated outlier flagging and correction to the case studies dataset. (a) Correlation plots and (b) three-class confusion matrices for the 100 ns FEP+ Groups-treated results vs. experiment, before and after automated outlier flagging and empirical correction of charged outlier cases as in Figure 5. The magnitude of the empirical correction applied to the flagged charged outlier cases in (a) was determined using the flagged cases from the benchmark dataset only.
The results for the case studies dataset were similar to those from the benchmark set, with initial RMSE of 1.32, though due to a large proline mutation outlier, a relatively low initial R2 of 0.15 for the full FEP+ Groups-treated 100 ns dataset. The effect of the automated outlier flagging and empirical correction procedure was also similar, with 4 out of 5 outlier cases being automatically flagged and 3 of those empirically corrected. After empirical correction of the charged outlier cases and exclusion of the flagged proline mutation case, RMSE was improved to 0.79 kcal/mol, and R2 increased substantially to 0.46.
After applying the empirical correction for the charged outlier (using the value fit to the benchmark dataset only) and excluding other automatically flagged cases, only 1 outlier case remained. This remaining outlier, 6SBA B:T20A (expt. 2.88, pred. 0.05), was located at a position on the 6SBA cyclic peptide which, like 1JRH I:E55A in the benchmark dataset, did not interact directly with the target protein in the crystal structure. The large unfavorable experimental binding , in this case, suggests that—as previously hypothesized [47]—a substantial rearrangement occurs for the unbound mutant peptide in the physical system, which was not sampled in simulation, and which would incur a reorganization penalty to adopt the binding-competent conformation present in the complex structure and FEP+ calculations. This is another instance where for mutation of a non-contact residue to have non-negligible effect on binding affinity there must necessarily be a substantive change in conformation. This sort of conformational change can be generally thought to be beyond the domain of applicability of FEP.
As with the benchmark dataset, we achieve good accuracy in three-class classification of the case studies results, as depicted in Figure 6(b). Across classification results for the three systems, overall balanced accuracy was 0.70, and after outlier flagging and empirical correction, no cases resulted in a classification error larger than 1 class. Treated collectively as a hypothetical design project, using the same strict cutoff criteria as described in the previous section, this classification would result in the experimental testing of only 8 variants, with a positive hit rate of 50%, and a recovery of 4 out of 7 actives, or 57%. Using the less stringent approach and including neutral mutations would result in experimental measurement of 28 variants, a positive hit rate of 25%, and recovery of 100%, with 7 out of 7 true actives in the experimental subset corresponding to neutral or favorable FEP+ predictions, and leaving no false negatives, while reducing the number of experimental mutations by 32%.
Discussion
Here, we have presented results from protein binding FEP+ calculations for a benchmark dataset with a variety of systems. We demonstrated how the overall results were improved using FEP+ Groups treatment to account for the effect of pH and alternate protonation states on binding, and how potentially problematic results were identified, and in some cases empirically corrected, based on chemical, structural, and energetic features from the FEP+ simulations. After the automated flagging and empirical correction, and removal of the flagged probable outlier cases (for which FEP+ results using default protocols were identified as likely to yield results with large errors), for the remaining high-confidence set of 186 cases FEP+ predictions agreed well with experiment, with an RMSE of 1.03 kcal/mol and R2 of 0.4. These results are consistent with previous protein FEP+ results where accuracy has been at or near the 1 kcal/mol level[17,18,35,36,39,40]. This level of accuracy is approaching the intrinsic uncertainty expected from experimental results, which has been proposed to be in the range of 0.4–0.9 kcal/mol for protein-protein and protein-ligand SPR binding measurements [34,39,48].
Some of the largest errors in the full benchmark dataset arose for cases where conformational rearrangement was either observed (as seen with the change in conformation of 1DVF wt residue D:H33) or expected (e.g. when mutating to or from proline in a surface loop, or when mutating a solvent-exposed polar residue to hydrophobic Ala in a small cyclic peptide). Cases where substantial rearrangement is required in the physical system may be considered beyond the domain of applicability for protein binding FEP+ calculations run with default protocol. However, we note that if such cases—including the relevant conformations involved—can be identified, potential solutions exist to account for the energetics of well-defined conformational changes. Specifically, protein reorganization FEP has been applied successfully to account for changes in loop conformation in absolute binding FEP calculations with protein-ligand complexes [38]. While the application of protein reorganization FEP to the outlier cases in the benchmark and case studies datasets is beyond the scope of the current study, further investigation of the potential combination of protein binding and protein reorganization FEP may prove valuable.
Perturbations involving proline in particular warrant additional discussion. Proline mutations have been treated before in protein stability FEP+ with reasonable success [35]. However, we have found (both in the current work and in our previous experience with other systems not discussed here) that protein binding FEP+ predictions for proline are significantly more challenging. One reason may be that the solvent and complex legs of binding FEP calculations necessitate two different protein contexts, whereas stability calculations have a linear peptide in the unbound solvent leg with far fewer degrees of freedom and therefore a greater likelihood of achieving adequate sampling of conformational space, similarly to the unbound ligand in a small molecule FEP calculation. Proline perturbations in flexible loops are particularly challenging, as they are prone to adopting different conformations from those preferred by other less torsionally constrained residues. We note that both proline cases in the datasets considered here (one each in the benchmark and case studies sets) were mutations to or from proline in flexible loops at the binding interface.
In addition to sampling errors, we found disruption of a interaction likely contributed to at least one outlier case in the benchmark set. The current default OPLS4 force field used in FEP+ calculations uses fixed charges only. This leaves it unable to account for -based interactions, which result from induced polarization upon movement of electronic negative charge relative to the atomic nuclei. The effect here is twofold: first, the energetics of the interactions do not contribute to the energies reported by FEP+ calculations; and second, the lack of explicit stabilization of these interactions in simulation could lead to increased sampling of less relevant conformations, thereby adding energetic noise to the results. Our analysis of the 1JRH I:N53A outlier case, which disrupts a well-defined -hydrogen bond (Figure 4(e)), demonstrated marked improvement with a developmental force field with explicit polarization. Rigorous validation of a force field with explicit polarization for aromatic and other residue types with delocalized electrons may help to eliminate some of these kinds of errors, by better accounting for the energetics of interactions.
The ultimate goal for FEP+ calculations in many use cases is to help guide and ideally streamline and accelerate the experimental component of a molecular design project. While it is possible retrospectively to modify protocols and perform extensive investigations of sampling, starting conformations, and other factors that may affect the accuracy of an FEP-predicted binding result, these sorts of analyses are far more difficult to justify in the absence of data showing some deviation from experiment in the initial prediction. The automatic probable outlier flagging and empirical correction script may serve as a means of prioritizing FEP+ results, such that unflagged or corrected cases may be treated as higher confidence and used more directly as input to a downstream experimental validation pipeline.
It is also prudent to consider that although applying the empirical correction for charged cases does improve accuracy, in most practical biologics optimization use cases, it would be undesirable to leave an unpaired charge buried at the binding interface, and from a design standpoint, there is little difference between an unfavorable predicted of, say, +5 kcal/mol and the corresponding empirically corrected of approximately +2 kcal/mol—neither value would be likely to be pursued experimentally. Finally, we acknowledge that the current probable outlier flagging mechanism, and ongoing development of the method in general, would benefit from a larger dataset with a distribution of mutations less skewed toward alanine, and enough outlier cases of each error class available to allow for a statistically rigorous test/train process, complete with cross-validation, though this is also beyond the scope of the current study.
In summary, the results presented here demonstrate that, for a majority of mutations from a variety of systems, protein binding FEP+ calculations are able to produce accurate results and may provide insight suitable for guiding the experimental component of biologics design projects.
Methods
Benchmark dataset curation
Systems were selected from the SKEMPI database to use for FEP+ benchmarking which had a minimum of 20 mutations available for study with ITC or SPR experimental binding measurements; resolution of 2.8 Å or better; and no missing residues or disordered loops in the structure near the experimental mutation sites. Three additional systems from the authors’ previous work were added to the dataset, each with more than 10 mutations with SPR binding measurements and similarly reliable structural coordinates.
For comparison to FEP-calculated binding free energies, experimental binding affinities were converted to values (in kcal/mol) via the standard relation
| (1) |
where is the gas constant, is experimental temperature, and is the standard reference concentration of 1 M; and values were determined relative to the complexes after averaging all available values for each variant.
Model preparation
Initial structures were obtained from the Protein Data Bank using the accession numbers listed in Table 1. All-atom models were produced using the Protein Preparation Workflow in Maestro (Schrödinger, Inc.), assigning initial protonation states at the experimental pH for each set of measurements using PROPKA [49]. Protein chain termini where the model was truncated compared to the experimental system were capped using acetyl (ACE) and N-methylamide (NMA) monomers, for the amino- and carboxyl-termini, respectively. Alternate conformations were removed, keeping the highest-occupancy conformation, or the first conformation listed when two conformers were tied for highest occupancy; and any atom clashes were resolved by local minimization. Models were exported to Maestro format (.mae) and are available in the GitHub repository associated with this manuscript (see Data Availability).
Free energy perturbation calculations
FEP calculations were performed using FEP+ (Schrödinger Suites, 2022–2 release), and run with a production stage of 100 ns for each mutation in the assembled dataset, including all possible alternate protonation states for both wt and mutant residues using default protocols. Briefly, a graph of mutations was prepared to include all possible direct mutations from the WT node (direct perturbations between proline and charged residues are not supported) as well as connecting edges to allow cycle-closure analysis as described previously [44]. For each perturbation edge, complex (bound) and solvent (unbound) simulation legs were run, the former comprising the full prepared complex, and the latter only the component which contained the mutated residue, which in some cases included more than one protein chain. For each leg, the model was placed into an orthorhombic SPC water box with either a 5 Å buffer for neutral and core-hopping (proline) perturbations, or 10 Å buffer for charged perturbations. Sodium or chloride ions were added to neutralize the system, plus additional NaCl ions to 150 mM total concentration for charged perturbations.
Each perturbation leg was run using 12, 16, or 24 lambda windows for neutral, core-hopping, or charged mutations, respectively. Charged perturbations utilized an alchemical ion procedure to maintain system neutrality across all lambda windows, as previously described [18]. Replicas were initialized with the default series of minimization and restrained relaxation steps including a Grand Canonical Monte Carlo (GCMC) solvation protocol in the region around the mutating residue [24], followed by a 100 ns lambda-hopping production stage using the replica exchange with solute tempering (REST) protocol described previously to enhance sampling [23]. All FEP+ calculations used the default OPLS4 force field, except in the analysis of one outlier case, as described in the Results, where a developmental version of a force field with explicit polarization was used. A final analysis stage for each leg included relative calculations using the multistate Bennett acceptance ratio (MBAR) method [50] along with other automated tasks such as trajectory alignment and parching.
FEP+ Groups treatment of alternate protonation states
To account for the potential shift in pKa of titratable residues upon protein-protein binding, we developed a protocol to be applied to the output FEP+ results for each system. We have adapted the method from [51] for protein systems, using literature micro pKas for titratable residues, along with values between the physical states. Initially, FEP perturbations between NMA- and ACE-capped single amino acid residues, which represent the “model” physical state, were run in triplicate for all possible amino acid permutations permitted by FEP+, including those not involving titratable residues, and in both directions for each pair of residues (e.g. ALA->ASP as well as ASP->ALA). We manually compiled these results into CSV format with 4 columns: the protonation state-specific start and end 3-letter residue codes, mean model for the perturbation, and standard deviation among the 3 independent calculations. Typical standard deviations were on the order of 0.02–0.03 kcal/mol, indicating good convergence among the replicates.
To apply the FEP+ Groups treatment to each system, the output FEP+ perturbation map (.fmp) file, the pH value of the experimental measurements, and the aforementioned CSV file with precalculated model leg values were provided as input to the protein_fep_groups.py script available in the Schrödinger Suites 2024–2 release, and the resulting grouped and pKa values were written to CSV output file. Briefly, this script reads the FEP+ graph; loads the applicable model from the CSV into each perturbation edge; and applies a cycle closure correction to minimize hysteresis around closed thermodynamic cycles. The script aggregates nodes that differ only by protonation or tautomeric state into node groups and reports an FEP+ Groups predicted binding value for each node, which is the same for each node in the node group.
We calculate fractional populations for each node in each physical state for the node group using the following equation:
| (2) |
where is the physical ensemble of states represented by the nodes of the node group (including represents a known starting population, and is the FEP-calculated between each pair of nodes in the node group for the specified physical transition, namely either the model-to-solvent , or solvent-to-complex (binding) . Initial model values for each node in the node group are calculated via the Henderson-Hasselbalch equation:
| (3) |
in combination with the differences between precalculated model and solvent leg values for each node pair from the protein binding FEP+ calculation, are used to calculate solvent leg populations . The process is repeated using the same formula to calculate complex leg populations (), using the solvent leg populations and binding values. After calculating the fractional populations for each node , the group predicted binding is calculated by applying state penalties for the complex (2) and solvent (1) states to the original FEP+ predicted value via:
After this FEP groups treatment, all nodes belonging to the same node group—that is, representing the same protein variant—reported identical predicted values, and mutational binding values were calculated for each node group (variant) by subtracting the Protein FEP+ Groups-predicted binding value for the wt node group for each system.
Classification of outliers
To identify limitations in the default protein FEP+ protocol, we individually analyzed cases with calculated binding that deviated from the experimentally determined by more than 2 kcal/mol. We identified several classes of mutations that appeared to be problematic. These were broadly classified as either related to insufficient conformational sampling or due to limitations in the OPLS4 force field, and more specifically into the outlier classes presented in Table 3 and Figure 4.
As an automated solution to identify lower-confidence cases that may require additional attention or potentially be beyond the domain of applicability of FEP+ calculations, we developed two scripts that, based on an output perturbation map file from an FEP+ job, report a list of individual mutations that meet the criteria for one of the outlier categories. The first script extracts a set of chemical and structural features from the models in the perturbation map file. The second script uses the features to identify probable outliers based on empirical observations from the Protein FEP Benchmark dataset, and reports and applies an (optionally user-supplied) empirical correction to charged outlier cases. The source code for both scripts is available in the GitHub repository accompanying this manuscript (see Data Availability).
Loop prediction
Prediction of loop conformations for two cases on the 1DVF antibody H3 loop were done for the unbound antibody (chains D and E) using the loop_predictor.py script available in the Schrödinger Suite, 2024–1 release. For each mutant loop, residues D:94–102, the crystal structure conformation was optimized in-place using the -repredict_input command-line flag to allow meaningful comparison of energies. Subsequent conformational searches for each loop were performed with Cα distance constraints of 4, 6, and 8 Å from the crystal structure conformation, and restricting nearby sidechain sampling to include only the residue sidechains sampled in the initial repredict-input calculation. The Prime Energy and loop backbone RMSD were reported for the lowest-energy loop model from among the three conformational searches and compared to those of the lowest-energy loop from the optimized crystal structure conformation.
Data analysis and figure preparation
Raw FEP data and structural features were extracted and compiled using Python [52] and the Schrödinger Python API, and downstream analyses were done using either Python or R and RStudio [53]. Plots were made using ggplot2 R package [54]. Structural figures were created using PyMOL [55]. The manuscript was prepared using Quarto and RStudio [56,57].
Supplementary Material
Highlights.
Reliable calculation of relative binding free energy changes for most protein mutations to within ~1 kcal/mol.
Automated Protein FEP+ Groups treatment of alternate protonation states for titratable residues.
Application of FEP+ methodology to “real-world” protein design projects.
Acknowledgements
The authors thank Gregory A. Ross for helpful discussions about group corrections; Addison Schile for assistance in implementing the Protein FEP+ Groups script; Edward Miller for providing guidance with outlier classification code and loop modeling; and Delaram Ghoreishi, Wolfgang Damm, and Edward Harder for assistance running preliminary calculations with explicit polarization.
The work was supported by the Bill and Melinda Gates Foundation, INV-016167 (B.H., L.S., and R.A.F.) and the NIH grant R35-GM139585 (B.H.).
Footnotes
Declaration of competing interest
J.M.S., D.A.C., J.C.K.E., and L.W. are employees of Schrödinger; B.H. is a board member for Schrödinger and a consultant; R.A.F. is a co-founder of Schrödinger, Inc. and a consultant. H.A., S.M.G., R.G., S.G., L.D.M., J.C.M., R.B.D., D.G.R., A.S., T.W., and A.B. are employees of AstraZeneca.
Declaration of interests
The authors declare the following financial interests/personal relationships which may be considered as potential competing interests:
CRediT authorship contribution statement
Jared M. Sampson: Conceptualization, Methodology, Software, Formal analysis, Investigation, Data Curation, Writing - Original Draft, Writing - Editing & Review, Visualization. Daniel A. Cannon: Methodology, Investigation, Data Curation, Writing - Editing & Review. Jianxin Duan: Methodology, Investigation, Data Curation, Writing - Editing & Review. Alina P. Sergeeva: Investigation, Data Curation, Writing - Editing & Review. Jordan C. K. Epstein: Software, Writing - Editing & Review. Phinikoula Katsamba: Investigation, Writing - Editing & Review, Visualization. Seetha M. Mannepalli: Investigation, Writing - Editing & Review. Fabiana A. Bahna: Investigation, Writing - Editing & Review. Hélène Adihou: Conceptualization, Methodology, Validation, Formal analysis, Writing - Editing & Review. Stéphanie M. Guéret: Conceptualization, Methodology, Validation, Formal analysis, Writing - Editing & Review. Ranganath Gopalakrishnan: Conceptualization, Methodology, Validation, Formal analysis, Writing - Editing & Review. Stefan Geschwindner: Methodology, Validation, Formal analysis, Resources, Writing - Editing & Review. Leonardo De Maria: Conceptualization, Resources, Data Curation, Writing - Editing & Review, Project administration. Juan Carlos Mobarec: Validation, Investigation, Writing - Editing & Review, Supervision, Project administration. Roger B. Dodd: Formal analysis, Investigation, Writing - Editing & Review, Supervision. D. Gareth Rees: Formal analysis, Investigation, Writing - Editing & Review, Visualization. Anna Sigurdardottir: Formal analysis, Investigation, Writing - Editing & Review, Visualization. Trevor Wilkinson: Validation, Investigation, Resources, Writing - Editing & Review. Andrew Buchanan: Conceptualization, Investigation, Resources, Data Curation, Writing - Editing & Review, Supervision, Project administration, Funding acquisition. Lawrence Shapiro: Conceptualization, Resources, Writing - Editing & Review, Supervision, Project administration, Funding acquisition. Barry Honig: Conceptualization, Methodology, Resources, Writing - Editing & Review, Supervision, Project administration, Funding acquisition. Richard A. Friesner: Conceptualization, Methodology, Investigation, Resources, Writing - Editing & Review, Supervision, Project administration, Funding acquisition. Lingle Wang: Conceptualization, Methodology, Investigation, Resources, Writing - Editing & Review, Supervision, Project administration, Funding acquisition.
Publisher's Disclaimer: This is a PDF file of an unedited manuscript that has been accepted for publication. As a service to our customers we are providing this early version of the manuscript. The manuscript will undergo copyediting, typesetting, and review of the resulting proof before it is published in its final form. Please note that during the production process errors may be discovered which could affect the content, and all legal disclaimers that apply to the journal pertain.
Data availability
Experimental data, prepared all-atom structural models, and all code needed to run the probable outlier flagging protocol are available in the GitHub repository accompanying this manuscript (https://github.com/schrodinger/protein_fep_benchmark).
References
- [1].Warszawski S, Katz AB, Lipsh R, Khmelnitsky L, Nissan GB, Javitt G, Dym O, Unger T, Knop O, Albeck S, Diskin R, Fass D, Sharon M, Fleishman SJ, Optimizing antibody affinity and stability by the automated design of the variable light-heavy chain interfaces, PLoS Computational Biology 15 (2019) e1007207. 10.1371/journal.pcbi.1007207. [DOI] [PMC free article] [PubMed] [Google Scholar]
- [2].Chong S, Ham S, Site-directed analysis on protein hydrophobicity, Journal of Computational Chemistry 35 (2014) 1364–1370. 10.1002/jcc.23631. [DOI] [PubMed] [Google Scholar]
- [3].Griswold KE, Bailey-Kellogg C, Design and engineering of deimmunized biotherapeutics, Current Opinion in Structural Biology 39 (2016) 79–88. 10.1016/j.sbi.2016.06.003. [DOI] [PMC free article] [PubMed] [Google Scholar]
- [4].Zou W, Huang C, Sun Q, Zhao K, Gao H, Su R, Li Y, A stepwise mutagenesis approach using histidine and acidic amino acid to engineer highly pH-dependent protein switches, 3 Biotech 12 (2022) 21. 10.1007/s13205-021-03079-x. [DOI] [PMC free article] [PubMed] [Google Scholar]
- [5].Pyzik M, Kozicky LK, Gandhi AK, Blumberg RS, The therapeutic age of the neonatal Fc receptor, Nature Reviews Immunology (2023) 1–18. 10.1038/s41577-022-00821-1. [DOI] [PMC free article] [PubMed] [Google Scholar]
- [6].Mackness BC, Jaworski JA, Boudanova E, Park A, Valente D, Mauriac C, Pasquier O, Schmidt T, Kabiri M, Kandira A, Radošević K, Qiu H, Antibody Fc engineering for enhanced neonatal Fc receptor binding and prolonged circulation half-life, mAbs (2019). 10.1080/19420862.2019.1633883. [DOI] [PMC free article] [PubMed] [Google Scholar]
- [7].Wang Y, Xue P, Cao M, Yu T, Lane ST, Zhao H, Directed Evolution: Methodologies and Applications, Chemical Reviews 121 (2021) 12384–12444. 10.1021/acs.chemrev.1c00260. [DOI] [PubMed] [Google Scholar]
- [8].Zhang Y, Evolution of phage display libraries for therapeutic antibody discovery, mAbs 15 (2023) 2213793. 10.1080/19420862.2023.2213793. [DOI] [PMC free article] [PubMed] [Google Scholar]
- [9].Zorniak M, Clark PA, Umlauf BJ, Cho Y, Shusta EV, Kuo JS, Yeast display biopanning identifies human antibodies targeting glioblastoma stem-like cells, Scientific Reports 7 (2017) 15840. 10.1038/s41598-017-16066-1. [DOI] [PMC free article] [PubMed] [Google Scholar]
- [10].Dehouck Y, Kwasigroch JM, Rooman M, Gilis D, BeAtMuSiC: prediction of changes in protein–protein binding affinity on mutations, Nucleic Acids Research 41 (2013) W333–W339. 10.1093/nar/gkt450. [DOI] [PMC free article] [PubMed] [Google Scholar]
- [11].Pahari S, Li G, Murthy AK, Liang S, Fragoza R, Yu H, Alexov E, SAAMBE-3D: Predicting Effect of Mutations on Protein–Protein Interactions, International Journal of Molecular Sciences 21 (2020) 2563. 10.3390/ijms21072563. [DOI] [PMC free article] [PubMed] [Google Scholar]
- [12].Pires DEV, Ascher DB, Blundell TL, mCSM: predicting the effects of mutations in proteins using graph-based signatures, Bioinformatics 30 (2014) 335–342. 10.1093/bioinformatics/btt691. [DOI] [PMC free article] [PubMed] [Google Scholar]
- [13].Rodrigues CHM, Myung Y, Pires DEV, Ascher DB, mCSM-PPI2: predicting the effects of mutations on protein–protein interactions, Nucleic Acids Research 47 (2019) W338–W344. 10.1093/nar/gkz383. [DOI] [PMC free article] [PubMed] [Google Scholar]
- [14].Li M, Simonetti FL, Goncearenco A, Panchenko AR, MutaBind estimates and interprets the effects of sequence variants on protein–protein interactions, Nucleic Acids Research 44 (2016) W494–W501. 10.1093/nar/gkw374. [DOI] [PMC free article] [PubMed] [Google Scholar]
- [15].Zhang N, Chen Y, Lu H, Zhao F, Alvarez RV, Goncearenco A, Panchenko AR, Li M, MutaBind2: Predicting the Impacts of Single and Multiple Mutations on Protein-Protein Interactions, iScience 23 (2020) 100939. 10.1016/j.isci.2020.100939. [DOI] [PMC free article] [PubMed] [Google Scholar]
- [16].Barlow KA, Conchúir SO, Thompson S, Suresh P, Lucas JE, Heinonen M, Kortemme T, Flex ddG: Rosetta Ensemble-Based Estimation of Changes in Protein–Protein Binding Affinity upon Mutation, The Journal of Physical Chemistry B 122 (2018) 5389–5399. 10.1021/acs.jpcb.7b11367. [DOI] [PMC free article] [PubMed] [Google Scholar]
- [17].Clark AJ, Gindin T, Zhang B, Wang L, Abel R, Murret CS, Xu F, Bao A, Lu NJ, Zhou T, Kwong PD, Shapiro L, Honig B, Friesner RA, Free Energy Perturbation Calculation of Relative Binding Free Energy between Broadly Neutralizing Antibodies and the gp120 Glycoprotein of HIV-1, Journal of Molecular Biology 429 (2017) 930 947. 10.1016/j.jmb.2016.11.021. [DOI] [PMC free article] [PubMed] [Google Scholar]
- [18].Clark AJ, Negron C, Hauser K, Sun M, Wang L, Abel R, Friesner RA, Relative Binding Affinity Prediction of Charge-Changing Sequence Mutations with FEP in Protein–Protein Interfaces, Journal of Molecular Biology 431 (2019) 1481–1493. 10.1016/j.jmb.2019.02.003. [DOI] [PMC free article] [PubMed] [Google Scholar]
- [19].Guerois R, Nielsen JE, Serrano L, Predicting changes in the stability of proteins and protein complexes: a study of more than 1000 mutations, Journal of Molecular Biology (2002). 10.1016/s0022-2836(02)00442-4. [DOI] [PubMed] [Google Scholar]
- [20].Schymkowitz J, Borg J, Stricher F, Nys R, Rousseau F, Serrano L, The FoldX web server: an online force field, Nucleic Acids Research 33 (2005) W382–W388. 10.1093/nar/gki387. [DOI] [PMC free article] [PubMed] [Google Scholar]
- [21].Zwanzig RW, High-Temperature Equation of State by a Perturbation Method. I. Nonpolar Gases, The Journal of Chemical Physics 22 (1954) 1420–1426. 10.1063/1.1740409. [DOI] [Google Scholar]
- [22].Feenstra KA, Hess B, Berendsen HJC, Improving efficiency of large time-scale molecular dynamics simulations of hydrogen-rich systems, Journal of Computational Chemistry 20 (1999) 786–798. . [DOI] [PubMed] [Google Scholar]
- [23].Wang L, Berne BJ, Friesner RA, On achieving high accuracy and reliability in the calculation of relative protein–ligand binding affinities, Proceedings of the National Academy of Sciences 109 (2012) 1937–1942. 10.1073/pnas.1114017109. [DOI] [PMC free article] [PubMed] [Google Scholar]
- [24].Ross GA, Russell E, Deng Y, Lu C, Harder ED, Abel R, Wang L, Enhancing Water Sampling in Free Energy Calculations with Grand Canonical Monte Carlo., Journal of Chemical Theory and Computation 16 (2020) 6061–6076. 10.1021/acs.jctc.0c00660. [DOI] [PubMed] [Google Scholar]
- [25].Best RB, Zhu X, Shim J, Lopes PEM, Mittal J, Feig M, MacKerell AD, Optimization of the Additive CHARMM All-Atom Protein Force Field Targeting Improved Sampling of the Backbone and Side-Chain 1 and 2 Dihedral Angles, Journal of Chemical Theory and Computation 8 (2012) 3257–3273. 10.1021/ct300400x. [DOI] [PMC free article] [PubMed] [Google Scholar]
- [26].Maier JA, Martinez C, Kasavajhala K, Wickstrom L, Hauser KE, Simmerling C, ff14SB: Improving the Accuracy of Protein Side Chain and Backbone Parameters from ff99SB, Journal of Chemical Theory and Computation 11 (2015) 3696–3713. 10.1021/acs.jctc.5b00255. [DOI] [PMC free article] [PubMed] [Google Scholar]
- [27].Harder E, Damm W, Maple J, Wu C, Reboul M, Xiang JY, Wang L, Lupyan D, Dahlgren MK, Knight JL, Kaus JW, Cerutti DS, Krilov G, Jorgensen WL, Abel R, Friesner RA, OPLS3: A Force Field Providing Broad Coverage of Drug-like Small Molecules and Proteins., Journal of Chemical Theory and Computation 12 (2016) 281 296. 10.1021/acs.jctc.5b00864. [DOI] [PubMed] [Google Scholar]
- [28].Roos K, Wu C, Damm W, Reboul M, Stevenson JM, Lu C, Dahlgren MK, Mondal S, Chen W, Wang L, Abel R, Friesner RA, Harder ED, OPLS3e: Extending Force Field Coverage for Drug-Like Small Molecules, Journal of Chemical Theory and Computation 15 (2019) 1863–1874. 10.1021/acs.jctc.8b01026. [DOI] [PubMed] [Google Scholar]
- [29].Lu C, Wu C, Ghoreishi D, Chen W, Wang L, Damm W, Ross GA, Dahlgren MK, Russell E, Bargen CDV, Abel R, Friesner RA, Harder ED, OPLS4: Improving Force Field Accuracy on Challenging Regimes of Chemical Space, Journal of Chemical Theory and Computation 17 (2021) 4291–4300. 10.1021/acs.jctc.1c00302. [DOI] [PubMed] [Google Scholar]
- [30].Wang L, Wu Y, Deng Y, Kim B, Pierce L, Krilov G, Lupyan D, Robinson S, Dahlgren MK, Greenwood J, Romero DL, Masse C, Knight JL, Steinbrecher T, Beuming T, Damm W, Harder E, Sherman W, Brewer M, Wester R, Murcko M, Frye L, Farid R, Lin T, Mobley DL, Jorgensen WL, Berne BJ, Friesner RA, Abel R, Accurate and reliable prediction of relative ligand binding potency in prospective drug discovery by way of a modern free-energy calculation protocol and force field., Journal of the American Chemical Society 137 (2015) 2695 2703. 10.1021/ja512751q. [DOI] [PubMed] [Google Scholar]
- [31].Abel R, Wang L, Mobley DL, Friesner RA, A Critical Review of Validation, Blind Testing, and Real-World Use of Alchemical Protein-Ligand Binding Free Energy Calculations, Current Topics in Medicinal Chemistry 17 (2017) 1–1. 10.2174/1568026617666170414142131. [DOI] [PubMed] [Google Scholar]
- [32].Chen W, Cui D, Jerome SV, Michino M, Lenselink EB, Huggins DJ, Beautrait A, Vendome J, Abel R, Friesner RA, Wang L, Enhancing Hit Discovery in Virtual Screening through Absolute Protein–Ligand Binding Free-Energy Calculations, Journal of Chemical Information and Modeling (2023). 10.1021/acs.jcim.3c00013. [DOI] [PubMed] [Google Scholar]
- [33].Schindler CEM, Baumann H, Blum A, Böse D, Buchstaller H-P, Burgdorf L, Cappel D, Chekler E, Czodrowski P, Dorsch D, Eguida MKI, Follows B, Fuchß T, Grädler U, Gunera J, Johnson T, Lebrun CJ, Karra S, Klein M, Knehans T, Koetzner L, Krier M, Leiendecker M, Leuthner B, Li L, Mochalkin I, Musil D, Neagu C, Rippmann F, Schiemann K, Schulz R, Steinbrecher T, Tanzer E-M, Lopez AU, Follis AV, Wegener A, Kuhn D, Large-Scale Assessment of Binding Free Energy Calculations in Active Drug Discovery Projects, Journal of Chemical Information and Modeling 60 (2020) 5457–5474. 10.1021/acs.jcim.0c00900. [DOI] [PubMed] [Google Scholar]
- [34].Steinbrecher T, Abel R, Clark A, Friesner R, Free Energy Perturbation Calculations of the Thermodynamics of Protein Side-Chain Mutations, Journal of Molecular Biology 429 (2017) 923–929. 10.1016/j.jmb.2017.03.002. [DOI] [PubMed] [Google Scholar]
- [35].Duan J, Lupyan D, Wang L, Improving the accuracy of protein thermostability predictions for single point mutations - Effects of unfolded states and methods for proline mutations, Biophysical Journal 119 (2020) 115–127. 10.1016/j.bpj.2020.05.020. [DOI] [PMC free article] [PubMed] [Google Scholar]
- [36].Scarabelli G, Oloo EO, Maier JKX, Rodriguez-Granillo A, Accurate Prediction of Protein Thermodynamic Stability Changes upon Residue Mutation using Free Energy Perturbation, Journal of Molecular Biology 434 (2022) 167375. 10.1016/j.jmb.2021.167375. [DOI] [PubMed] [Google Scholar]
- [37].Coskun D, Chen W, Clark AJ, Lu C, Harder ED, Wang L, Friesner RA, Miller EB, Reliable and Accurate Prediction of Single-Residue pKa Values through Free Energy Perturbation Calculations, Journal of Chemical Theory and Computation (2022). 10.1021/acs.jctc.2c00954. [DOI] [PubMed] [Google Scholar]
- [38].Fajer M, Borrelli K, Abel R, Wang L, Quantitatively Accounting for Protein Reorganization in Computer-Aided Drug Design, Journal of Chemical Theory and Computation 19 (2023) 3080–3090. 10.1021/acs.jctc.3c00009. [DOI] [PubMed] [Google Scholar]
- [39].Sergeeva AP, Katsamba PS, Liao J, Sampson JM, Bahna F, Mannepalli S, Morano NC, Shapiro L, Friesner RA, Honig B, Free Energy Perturbation Calculations of Mutation Effects on SARS-CoV-2 RBD::ACE2 Binding Affinity, Journal of Molecular Biology 435 (2023) 168187. 10.1016/j.jmb.2023.168187. [DOI] [PMC free article] [PubMed] [Google Scholar]
- [40].Haufe Y, Kuruva V, Samanani Z, Lokaj G, Kamnesky G, Shadamarshan P, Shahoei R, Katz D, Sampson JM, Pusch M, Brik A, Nicke A, Leffler AE, Basic Residues at Position 11 of α‑Conotoxin LvIA Influence Subtype Selectivity between α3β2 and α3β4 Nicotinic Receptors via an Electrostatic Mechanism, ACS Chemical Neuroscience (2023). 10.1021/acschemneuro.3c00506. [DOI] [PubMed] [Google Scholar]
- [41].Jankauskaitė J, Jiménez-García B, Dapkūnas J, Fernández-Recio J, Moal IH, SKEMPI 2.0: an updated benchmark of changes in protein–protein binding energy, kinetics and thermodynamics upon mutation, Bioinformatics 35 (2018) 462–469. 10.1093/bioinformatics/bty635. [DOI] [PMC free article] [PubMed] [Google Scholar]
- [42].Cosmanescu F, Katsamba PS, Sergeeva AP, Ahlsen G, Patel SD, Brewer JJ, Tan L, Xu S, Xiao Q, Nagarkar-Jaiswal S, Nern A, Bellen HJ, Zipursky SL, Honig B, Shapiro L, Neuron-Subtype-Specific Expression, Interaction Affinities, and Specificity Determinants of DIP/Dpr Cell Recognition Proteins, Neuron 100 (2018) 1385–1400.e6. 10.1016/j.neuron.2018.10.046. [DOI] [PMC free article] [PubMed] [Google Scholar]
- [43].Sergeeva AP, Katsamba PS, Cosmanescu F, Brewer JJ, Ahlsen G, Mannepalli S, Shapiro L, Honig B, DIP/Dpr interactions and the evolutionary design of specificity in protein families, Nature Communications 11 (2020) 2125. 10.1038/s41467-020-15981-8. [DOI] [PMC free article] [PubMed] [Google Scholar]
- [44].Wang L, Deng Y, Knight JL, Wu Y, Kim B, Sherman W, Shelley JC, Lin T, Abel R, Modeling Local Structural Rearrangements Using FEP/REST: Application to Relative Binding Affinity Predictions of CDK2 Inhibitors, Journal of Chemical Theory and Computation 9 (2013) 1282–1293. 10.1021/ct300911a. [DOI] [PubMed] [Google Scholar]
- [45].Thurlkill RL, Grimsley GR, Scholtz JM, Pace CN, pK values of the ionizable groups of proteins, Protein Science 15 (2006) 1214–1218. 10.1110/ps.051840806. [DOI] [PMC free article] [PubMed] [Google Scholar]
- [46].Steiner T, Koellner G, Hydrogen bonds with -acceptors in proteins: frequencies and role in stabilizing local 3D structures11Edited by R. Huber, Journal of Molecular Biology 305 (2001) 535–557. 10.1006/jmbi.2000.4301. [DOI] [PubMed] [Google Scholar]
- [47].Adihou H, Gopalakrishnan R, Förster T, Guéret SM, Gasper R, Geschwindner S, García CC, Karatas H, Pobbati AV, Vazquez-Chantada M, Davey P, Wassvik CM, Pang JKS, Soh BS, Hong W, Chiarparin E, Schade D, Plowright AT, Valeur E, Lemurell M, Grossmann TN, Waldmann H, A protein tertiary structure mimetic modulator of the Hippo signalling pathway, Nature Communications 11 (2020) 5425. 10.1038/s41467-020-19224-8. [DOI] [PMC free article] [PubMed] [Google Scholar]
- [48].Ross GA, Lu C, Scarabelli G, Albanese SK, Houang E, Abel R, Harder ED, Wang L, The maximal and current accuracy of rigorous protein-ligand binding free energy calculations, Communications Chemistry 6 (2023) 222. 10.1038/s42004-023-01019-9. [DOI] [PMC free article] [PubMed] [Google Scholar]
- [49].Olsson MHM, Søndergaard CR, Rostkowski M, Jensen JH, PROPKA3: Consistent Treatment of Internal and Surface Residues in Empirical p K a Predictions, Journal of Chemical Theory and Computation 7 (2011) 525–537. 10.1021/ct100578z. [DOI] [PubMed] [Google Scholar]
- [50].Shirts MR, Chodera JD, Statistically optimal analysis of samples from multiple equilibrium states, The Journal of Chemical Physics 129 (2008) 124105. 10.1063/1.2978177. [DOI] [PMC free article] [PubMed] [Google Scholar]
- [51].de Oliveira C, Yu HS, Chen W, Abel R, Wang L, A Rigorous Free Energy Perturbation Approach to Estimating Relative Binding Affinities between Ligands with Multiple Protonation and Tautomeric States, Journal of Chemical Theory and Computation (2018). 10.1021/acs.jctc.8b00826. [DOI] [PubMed] [Google Scholar]
- [52].Python, Python: A dynamic, open source programming language, (2020). http://www.python.org/. [Google Scholar]
- [53].R, R: A Language and Environment for Statistical Computing, (2023). https://www.R-project.org/. [Google Scholar]
- [54].Wickham H, ggplot2: Elegant Graphics for Data Analysis, Springer-Verlag New York, 2016. https://ggplot2.tidyverse.org. [Google Scholar]
- [55].PyMOL, The PyMOL Molecular Graphics System, Version 2.5, (2023). [Google Scholar]
- [56].Allaire JJ, Teague C, Scheidegger C, Xie Y, Dervieux C, Quarto, (2022). 10.5281/zenodo.5960048. [DOI] [Google Scholar]
- [57].RStudio, RStudio: Integrated Development Environment for R, (2023). http://www.posit.co/. [Google Scholar]
- [58].Peng L, Oganesyan V, Damschroder MM, Wu H, Dall’Acqua WF, Structural and Functional Characterization of an Agonistic Anti-Human EphA2 Monoclonal Antibody, Journal of Molecular Biology 413 (2011) 390–405. 10.1016/j.jmb.2011.08.018. [DOI] [PubMed] [Google Scholar]
- [59].Jackson D, Gooya J, Mao S, Kinneer K, Xu L, Camara M, Fazenbaker C, Fleming R, Swamynathan S, Meyer D, Senter PD, Gao C, Wu H, Kinch M, Coats S, Kiener PA, Tice DA, A Human Antibody–Drug Conjugate Targeting EphA2 Inhibits Tumor Growth In vivo, Cancer Research 68 (2008) 9367–9374. 10.1158/0008-5472.can-08-1933. [DOI] [PubMed] [Google Scholar]
- [60].Spooner J, Keen J, Nayyar K, Birkett N, Bond N, Bannister D, Tigue N, Higazi D, Kemp B, Vaughan T, Kippen A, Buchanan A, Evaluation of strategies to control Fab light chain dimer during mammalian expression and purification: A universal one-step process for purification of correctly assembled Fab, Biotechnology and Bioengineering 112 (2015) 1472–1477. 10.1002/bit.25550. [DOI] [PubMed] [Google Scholar]
- [61].Popovic B, Breed J, Rees DG, Gardener MJ, Vinall LMK, Kemp B, Spooner J, Keen J, Minter R, Uddin F, Colice G, Wilkinson T, Vaughan T, May RD, Structural Characterisation Reveals Mechanism of IL-13-Neutralising Monoclonal Antibody Tralokinumab as Inhibition of Binding to IL-13Rα1 and IL-13Rα2, Journal of Molecular Biology 429 (2017) 208–219. 10.1016/j.jmb.2016.12.005. [DOI] [PubMed] [Google Scholar]
Associated Data
This section collects any data citations, data availability statements, or supplementary materials included in this article.
Supplementary Materials
Data Availability Statement
Experimental data, prepared all-atom structural models, and all code needed to run the probable outlier flagging protocol are available in the GitHub repository accompanying this manuscript (https://github.com/schrodinger/protein_fep_benchmark).