

Abstract
MRI and MRCP play an essential role in diagnosing CP by imaging pancreatic parenchyma and ducts. Quantitative and semi-quantitative MR imaging offers potential advantages over conventional MR imaging, including simplicity of analysis, quantitative and population-based comparisons, and more direct interpretation of disease progression or response to drug therapy. Using parenchymal imaging techniques may provide quantitative metrics for determining the presence and severity of acinar cell loss and aid in diagnosing CP. Given that the parenchymal changes of CP precede the ductal involvement, there would be a significant benefit from developing a new MRI/MRCP based, more robust diagnostic criteria combining ductal and parenchymal findings.
Keywords: Chronic Pancreatitis, Diagnosis, MRI, MRCP, Quantitative MRI
Introduction
Chronic pancreatitis (CP) is a fibroinflammatory syndrome resulting in chronic abdominal pain, exocrine and endocrine pancreatic insufficiency, reduced quality of life, and shorter life expectancy1. CP is a low-prevalence disease; however, the incidence and prevalence of this debilitating disease are rising1. Clinical features of CP are highly variable and include minimal or no symptoms of debilitating pain, repeated episodes of acute pancreatitis, pancreatic exocrine and endocrine insufficiency.
While diagnosing severe CP is often straightforward, establishing a diagnosis at an early stage remains elusive2–5. Patients often undergo an exhaustive array of costly examinations since a biopsy of the pancreas is not a favored clinical practice as it entails a risk of biopsy-related pancreatitis. MRI and MRCP play an essential role in diagnosing chronic pancreatitis (CP) by imaging pancreatic parenchyma and ducts. MRI/MRCP is more widely used than computed tomography (CT) for early or progressing CP due to its increased sensitivity for pancreatic ductal and gland changes; however, it does not detect parenchymal calcifications seen in advanced CP. Quantitative MR imaging offers potential advantages over conventional qualitative imaging, including simplicity of analysis, quantitative and population-based comparisons, and more direct interpretation of detected changes. These techniques may provide quantitative metrics for determining the presence and severity of acinar cell loss and aid in diagnosing chronic pancreatitis. Given that the parenchymal changes of CP precede the ductal involvement, there would be a significant benefit from developing an MRI/MRCP based, more robust diagnostic criteria combining ductal and parenchymal findings. This review article will discuss advances in pancreatic imaging techniques by MRI.
Discussion
T1-Weighted Signal Intensity Ratio (SIR)
The pancreas is an essential exocrine gland of the digestive system, secreting more than a liter of proteinaceous fluid per day6,7. This abundance of proteinaceous material in the acinar cells is the reason the normal pancreas exhibits a relatively higher T1W signal intensity than other solid organs8,9. A recent multicenter study reported the average T1W signal in CP to be 1.11 vs. controls 1.29, as seen in Figure 110. This association is supported by studies that included surgical histopathology8,11–13 and reported a correlation of parenchymal MRI features (T1 SIR, T1 relaxation time, diffusion-weighted imaging, enhancement ratio, and MR elastography) with the degree of fibrosis. In addition to fibrosis, some studies have reported lower T1W signal in patients with exocrine pancreatic dysfunction14–16. One of these studies included 60 surgical specimens and showed that the T1 score had a higher correlation for pancreatic fibrosis than the Cambridge score13. Another study found a significant positive correlation (r=0.70) between pancreatic fluid bicarbonate level and T1 SIR of the pancreas to the spleen. A pancreas-to-splenic SIR threshold of less than 1.2 had a sensitivity of 77% and specificity of 76% for detecting low pancreatic fluid bicarbonate, i.e., pancreatic exocrine dysfunction15. These results concurred with the previously reported poor sensitivity of the Cambridge classification for detecting early CP17. They suggested that T1W SIR can be useful for detecting early chronic pancreatitis even when the ductal imaging is normal.
Figure 1.

T1-weighted signal of the normal pancreas. This is an axial fat-suppressed T1W image with no contrast showing the pancreas (arrow) in a 19-year-old female with no known pancreatic disease. The pancreas shows a significantly higher signal than the other solid organs in the upper abdomen. The T1W signal is typically assessed by comparing it to a reference organ, most commonly the spleen. This ratio is called T1 SIR (or T1 Score as the name given by the PROCEED study).
Prospective Evaluation of Chronic Pancreatitis for Epidemiologic and Translational Studies (PROCEED) is an ongoing, longitudinal cohort study of CP in adult participants in the US (NCT# 03099850)18. It is one of the four major studies conducted by the Consortium for the Study of Chronic Pancreatitis, Diabetes, and Pancreatic Cancer, established by the National Cancer Institute and the National Institute of Diabetes and Digestive and Kidney Diseases19,20. PROCEED analyzed MRI on 820 of its participants and reported that T1 SIR of the pancreas can be used as an imaging biomarker for staging chronic pancreatitis21. PROCEED study called T1 SIR of the pancreas-to-spleen “T1 score” and reported a negative linear correlation between the signal intensity and progression of CP. T1 score appears to be a practical imaging biomarker in evaluating disease severity in clinical research and practice, and longitudinal analysis should be available from the PROCEED study in the near future. PROCEED published a new classification of CP severity named mechanistic stages of chronic pancreatitis (MSCP) based on their clinical history (i.e., abdominal pain suspected of pancreatic origin, AP or RAP), the Cambridge grade on MRCP, and the presence of parenchymal and/or ductal calcifications on the CT scan as seen on Table 121.
Table 1.
Mechanistic stages of chronic pancreatitis (MSCP). Defined by the PROCEED study.
| MSCP | PROCEED cohort | Cambridge grade by MRCP | Calcification by CT | Sample size (n) |
|---|---|---|---|---|
| 0 | Chronic abdominal pain or indeterminate CP | 0 | − | 56 |
| 1 | Acute or recurrent AP | 0 | − | 179 |
| 2 | Chronic abdominal pain or indeterminate CP | 1 or 2 | − | 38 |
| 3 | Acute or recurrent AP | 1 or 2 | − | 169 |
| 4 | Definite CP | 0, 1, or 2 | + | 49 |
| 5 | Definite CP | 3 or 4 | − | 116 |
| 6 | Definite CP | 3 or 4 | + | 213 |
Limitations exist in conventional T1-weighted imaging in which the tissue contrast depends on multiple factors, including acquisition parameters, receiver coil geometry sensitivity and signal amplifier gains. Variation in signal intensity is commonly observed through the choice of pulse sequence and manipulation of acquisition parameters (e.g., flip angle, echo time, repetition time, inversion time, etc.).
Quantitative MRI Imaging
T1 mapping may be a more reliable method than traditional T1-weighted images since quantitative data allows ready comparison across longitudinal time points, potentially more accurate interpretation of intensity changes22. With this idea in mind, the Magnetic Resonance Imaging as a Non-invasive Method for the Assessment of Pancreatic Fibrosis (MINIMAP) study evaluated multiple MRI and MRCP features in a multi-institutional, multi-vendor setting to explore potential imaging biomarkers for CP23. MINIMAP reported that quantitative MR parameters are helpful in the diagnosis of CP24 and generated a multi-parametric score (Q-MRI) that combines three MR parameters (T1, ECV fraction, and fat fraction). Further studies are warranted in this new field using larger study populations and longitudinal follow-ups.
T1 mapping
T1 mapping is a quantitative MR imaging technique that allows us to measure the tissue specific T1 relaxation time of the tissues (Figure 2). Utilizing recently introduced fast 3D pulse sequences, T1 mapping takes less time than other imaging techniques such as T2 mapping, DWI or S-MRCP. Multiple T1 mapping pulse sequences are available either as a product version or prototype sequence under development by the manufacturers. There is no consensus about which T1 mapping pulse sequence is ideal for abdominal imaging. A study compared four different pulse sequences for the imaging of the pancreas: variable flip angle (VFA), modified look-locker inversion recovery (MOLLI), a prototype inversion recovery (IR-SNAPSHOT), and a prototype saturation recovery single-shot acquisition (SASHA)25. The principle of variable flip angle (VFA) pulse sequence is to calculate T1 by acquiring voxel signals at a steady state using multiple flip angles26. Inversion recovery (IR-SNAPSHOT) is based on the relaxation of longitudinal magnetization after an inversion radio frequency (RF) pulse is applied. A series of quick acquisitions are collected at different delay times following the inversion RF pulse, and signals at different delays are fitted using the relaxation model27. MOLLI is a commercially available sequence developed for myocardial imaging and uses a similar but modified IR-SNAPSHOT principle. The series of acquisitions following the inversion RF are segmented and synchronized using an ECG signal so that the data acquisition only occurs during the diastolic period of a cardiac cycle28. SASHA is also similar to IR-SNAPSHOT, except it utilizes a saturation RF pulse instead of an inversion RF pulse29. This study reported that MOLLI, SASHA, and IR-SNAPSHOT provided the highest precision, while VFA had substantial precision. MOLLI and SASHA were designed initially for myocardial imaging and provided only one image in one breath hold time, while IR-SNAPSHOT can acquire three images. The advantage of the VFA sequence is fast 3D acquisition, generating 64 slices in one breath hold. The disadvantage of VFA is the inherent sensitivity to pulsatile flow within the aortic blood. This study concluded that more refinement of pulse sequences is necessary to provide a large spatial coverage in one breath hold together with high precision in abdominal imaging. Further improving these MRI sequences will expand the use of these techniques, probably allowing them to be introduced into clinical practice to enable reliable quantitative diagnosis and follow-up of CP.
Figure 2.
This is an axial T1 map obtained without IV contrast in a 36-year-old male with no pancreas disease. Each pixel of this quantitative MR image depicts the T1 relation time (ms) of any tissue, including the pancreas (arrows).
T1 mapping has been investigated in quantifying short-term and mid-term autoimmune pancreatitis (AIP) responses to corticosteroid treatment30. The T1 relaxation time is reported to be prolonged in AIP. However, after four weeks of corticosteroid therapy, T1 relaxation time was shortened significantly, further shortening towards normalization in 12 weeks. In AIP patients with elevated serum IgG4 at baseline, T1 relaxation time demonstrated a significant positive correlation with serum IgG4 level; in patients with normal serum IgG4, T1 relaxation time shortening preceded or was in accordance with symptom relief, suggesting a promising role of T1-mapping as a treatment outcome measure30,31.
Challenges associated with conventional sequences also exist for quantitative MRI techniques: motion, spatial resolution, field non-uniformity, magnetization transfer, and partial volume32.
Extracellular Volume Imaging (ECV)
ECV is a radiomics method that exploits changes to the extracellular matrix. Utilizing gadolinium’s tissue and blood plasma concentration, the ECV technique dichotomizes the tissues into intra- and interstitial spaces. ECV fraction calculates the interstitial fraction, which increases following replacement of the normal cells with fibrosis. ECV fraction can be either measured as a value or depicted as pixels on an image (Figure 3). In the case of CP, ECV interrogates increased interstitial space seen with tissue fibrosis. T1 relaxation times obtained from the pancreas and the blood pool (typically aortic lumen) in unenhanced and post-contrast equilibrium phases are entered into this formula to calculate the ECV fraction:
where ΔR1pancreas and ΔR1blood are defined as the change of 1/T1 relaxation rate in pancreas and blood pool relaxivity before and after contrast administration23.
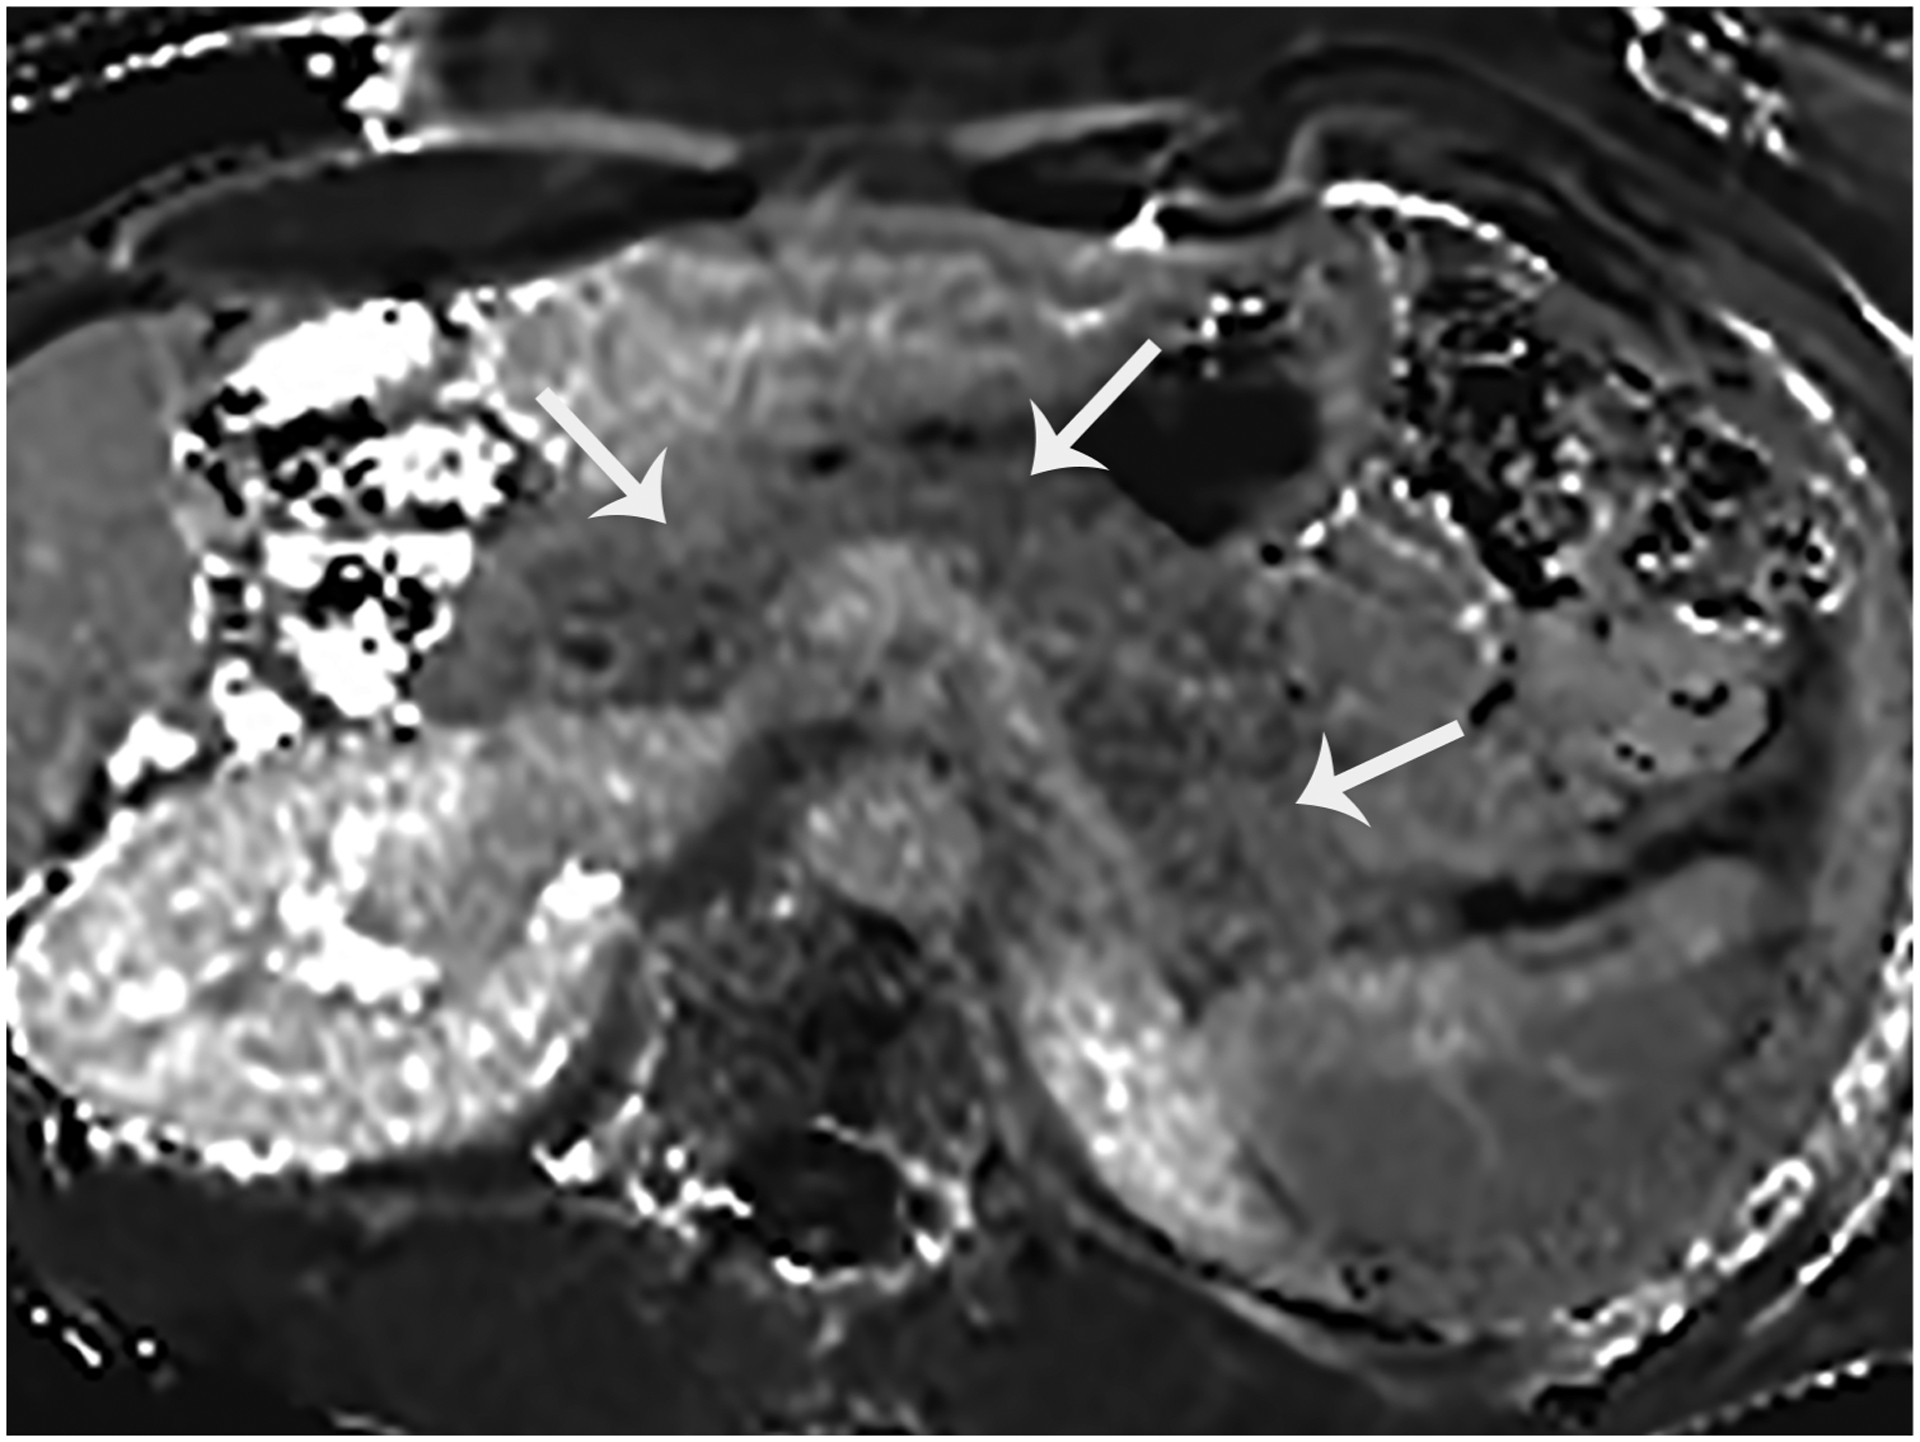
Figure 3.

Extracellular volume (ECV) fraction map. This is an axial color scale ECV image of the abdomen at the level of the pancreas (arrows) in a patient with no pancreas disease.
A recent study on patients with no pancreatic disease reported median T1 on 1.5T as 654 ms, median T1 on 3T as 717 ms, median ECV on 1.5T as 0.28 and median ECV on 3T as 0.2533. T1 (r =0.24) had a mild positive correlation with rising age. Despite the well-known differences in T1 relaxation times between 1.5T and 3T, the ECV fraction does not show variations when using different magnet strengths34.
Alterations of tissue T1 have been observed in the presence of various pathologic conditions in the abdomen, including CP35,36. A retrospective study performed using 3T showed that T1 >950 ms had 64% sensitivity and 88% specificity, while ECV >0.27 had 92% sensitivity and 77% specificity36 for the diagnosis of CP. Combining ECV and T1 yielded a sensitivity of 85% and specificity of 92% (AUC: 0.94)36. Another study using 3T showed the T1 >900 ms threshold to be 80% sensitive and 69% specific for diagnosing mild CP (AUC: 0.81)35.
Diffusion-Weighted Imaging (DWI)
Diffusion-weighted MRI measures the restriction of free water molecules in the gland. The more fibrosis there is, the more likely there will be less diffusion of water molecules, measured as apparent diffusion coefficient (ADC). The ADC is expected to be higher in patients with no pancreas disease than chronic pancreatitis with fibrosis Figure 4. Exploiting this idea, diffusion MRI was used after IV secretin stimulation, and enhancing the sensitivity to depict subtle abnormalities in diffusion restriction has been reported37. However, the MINIMAP study, which was performed in a multi-institutional and multi-vendor setting, showed no difference in ADC of the pancreas between the control, suspected and definite CP participants24.
Figure 4.

Diffusion-weighted imaging of the pancreas. This is an apparent diffusion coefficient (ADC) map of the pancreas (arrows) in a 19-year-old patient with no pancreas disease. ADC is a quantitative map, and measurements reflect the diffusion properties of the tissues. The ADC is expected to be lower in patients with tissue fibrosis.
MR Elastography (MRE)
MRE is a reliable marker of hepatic fibrosis in patients with chronic liver disease. While there are no controlled data evaluating this technique in patients with CP, there is room for optimism as recent data demonstrated the feasibility of using MRE to determine pancreatic stiffness in healthy volunteers38. Reproducible stiffness measurements were noted throughout the pancreas, with imaging parameters and equipment different than those used for liver imaging. Preliminary data suggest that pancreatic MRE can provide promising and reproducible stiffness measurements throughout the pancreas, potentially allowing for assessing pancreatic fibrosis39.
Correlation of MRI Features with Histopathology
The two most common histologic features of CP are the loss of acinar tissue (atrophy) and fibrosis. The fibrosis may surround the lobules (perilobular or interlobular fibrosis) or extend into the lobules of acinar tissue (intralobular fibrosis)40. Chronic inflammatory infiltration may be present in the developmental stages, but this feature is highly variable and disappears late during CP. Chronic pancreatitis can be a patchy or localized process with regional involvement. This feature is best understood by considering the mechanisms of pathogenesis, particularly the necrosis-fibrosis hypothesis, which posits that CP develops as a result of multiple episodes of AP with necrosis and scarring. This process may be patchy initially, progressing to a diffuse pattern after multiple episodes. This is commonly considered to be the mechanism in alcoholic CP, para-duodenal CP, and likely hereditary pancreatitis41.
Several studies reported that MRI parenchymal signal changes reflect the histopathological changes seen in CP42–44. T1 SIR (T1 Score), T1 relaxation time, ECV fraction, DWI, arterio-venous enhancement ratio (AVR), and MR elastography have been shown to correlate with CP8,11–13. One of the best examples of these studies analyzed 60 surgical specimens and reported that the MRI parameters correlated with pancreatic fibrosis better than the Cambridge score13. Some studies reported that MRI features can show changes in the parenchyma in participants with suspected CP while the Cambridge score remains normal or equivocal. In a study comparing 24 participants with suspected CP to 20 controls, AVR was significantly lower in the suspected CP cohort45. In another study with 29 suspected CP participants and 22 controls, T1 SIR was significantly lower in those with exocrine dysfunction, as determined by an endoscopic pancreatic function test15. These studies point out the potential of parenchymal changes in detecting CP before the appearance of ductal morphologic changes. These suggestions are probably valid, considering that the ductal system is only 4% of the pancreas, while the remainder of the gland comprises acinar cells, the extracellular matrix, and islet cells46.
Revised Classification System
Cambridge classification, designed for ERCP, has been used for over four decades47. This classification system is based on ERCP findings; however, it has been adapted to MRCP and has remained the de facto diagnostic standard, primarily due to the familiarity of referring physicians. The role of MRI/MRCP in diagnosing CP has been acknowledged by recent guidelines of the American Pancreatic Association, and a modified Cambridge classification for MR/MRCP and CT has been proposed (Table 2)48.
Table 2.
Cambridge classification adapted for findings seen on MRCP, CT, and US. American Pancreatic Association Practice Guidelines, 2014.
| Cambridge Classification | MRCP/ERCP findings | US/CT/MR findings |
|---|---|---|
| 0 Normal |
Normal | no abnormal signs |
| I Equivocal CP |
< 3 dilated side branches | one of the following:
|
| II Mild CP |
Three or more dilated side branches | Two or more of the following:
|
| III Moderate CP |
>3 dilated side branches and dilated main duct | Same as above |
| IV Severe CP |
all above and one or more of
|
Above changes and one or more of the:
|
The value of parenchymal MRI features has been reported by retrospective studies and touted by expert panel reviews and consensus statements42–44. Ductal imaging reflects periductal fibrosis but cannot capture other histopathological triad elements, including parenchymal fibrosis, loss of acinar tissue, and parenchymal fat deposition41. Over the years, several limitations of the Cambridge classification have been reported. There is significant variability in the interpretation of Cambridge classification by MRCP49, resulting in moderate interobserver variation among expert radiologists50,51. Recent studies showed that MRCP findings alone provide a limited evaluation of CP since MRCP images do not reflect the changes in the pancreatic parenchyma46,52,53. The value of parenchymal MRI features has been reported by retrospective studies and touted by expert panel reviews and consensus statements42–44. To this date, radiologists have not established a classification for CP based on MRI/MRCP, CT or US-specific features. New criteria for CP, incorporating ductal and parenchymal MRI features, are needed to improve the clinical practice.
Reporting Guidelines for Chronic Pancreatitis
New cross-sectional imaging definitions and standardized reporting recommendations for CP would allow for a more standardized approach to diagnosis and assessment of disease severity for clinical trials. As therapeutic drugs emerge for clinical trials, definitions of disease and severity are needed for longitudinal markers and therapeutic targets. Precise and standardized communication between the radiologist and clinicians is essential for the quality and safety of clinical practice. With this idea in mind, the CPDPC proposed standardized definitions and reporting recommendations based on available evidence and expert consensus. CT, MRI or MRCP data points described in this manuscript can potentially be imaging biomarkers for disease progression43. The guidelines included definitions for pancreatic calcifications, thickness, T1W signal, arterio-venous enhancement ratio, several ductal features and distribution of findings. Future use of these standardized metrics in well-controlled clinical trials will help to validate them and potentially allow for clinical adoption.
Summary
Several new MRI parameters of the pancreas have significant potential to be practical, accurate and cost-efficient imaging biomarkers of CP. These biomarkers can be useful to exclude chronic pancreatitis with high certainty, to reliably rule in early-stage disease, to help predict disease progression in these patients, and to monitor their effects to slow or reverse disease progression.
Key Points.
Parenchymal MRI features can objectively identify different histopathologic changes seen with chronic pancreatitis.
T1-weighted MR imaging can be a biomarker for decreased pancreatic exocrine function and chronic pancreatitis.
Pancreatic T1 relaxation time, ECV fraction, and fat signal fraction are higher in patients with CP.
Standardized definitions and reporting of chronic pancreatitis on imaging studies will facilitate the classification of disease severity and longitudinal assessment in clinical trials.
Clinical Care Points.
MRI and MRCP play an essential role in diagnosing CP by imaging pancreatic parenchyma and ducts. Quantitative and semi-quantitative MR imaging offers potential advantages over conventional MR imaging, including simplicity of analysis, quantitative and population-based comparisons, and more direct interpretation of disease progression or response to drug therapy.
Using parenchymal imaging techniques may provide quantitative metrics for determining the presence and severity of acinar cell loss and aid in diagnosing CP.
Given that the parenchymal changes of CP precede the ductal involvement, there would be a significant benefit from developing a new MRI/MRCP based, more robust diagnostic criteria combining ductal and parenchymal findings.
Source of Funding
Research reported in this publication was supported by the National Cancer Institute and National Institute of Diabetes and Digestive and Kidney Diseases of the National Institutes of Health under award numbers related to the MINIMAP study (R01DK116963) and The Consortium for the Study of Chronic Pancreatitis, Diabetes, and Pancreatic Cancer (CPDPC) under award number U01DK108323.
Footnotes
Publisher's Disclaimer: This is a PDF file of an unedited manuscript that has been accepted for publication. As a service to our customers we are providing this early version of the manuscript. The manuscript will undergo copyediting, typesetting, and review of the resulting proof before it is published in its final form. Please note that during the production process errors may be discovered which could affect the content, and all legal disclaimers that apply to the journal pertain.
Disclosure Statement: None
References
- 1.Beyer G, Habtezion A, Werner J, Lerch MM, Mayerle J. Chronic pancreatitis. Lancet. Aug 15 2020;396(10249):499–512. doi: 10.1016/S0140-6736(20)31318-0 [DOI] [PubMed] [Google Scholar]
- 2.Lowenfels AB, Sullivan T, Fiorianti J, Maisonneuve P. The epidemiology and impact of pancreatic diseases in the United States. Curr Gastroenterol Rep. May 2005;7(2):90–5. doi: 10.1007/s11894-005-0045-6 [DOI] [PubMed] [Google Scholar]
- 3.Manes G, Kahl S, Glasbrenner B, Malfertheiner P. Chronic pancreatitis: diagnosis and staging. Ann Ital Chir. Jan-Feb 2000;71(1):23–32. [PubMed] [Google Scholar]
- 4.Nichols MT, Russ PD, Chen YK. Pancreatic imaging: current and emerging technologies. Pancreas. Oct 2006;33(3):211–20. doi: 10.1097/01.mpa.0000227912.71202.2c [DOI] [PubMed] [Google Scholar]
- 5.Toskes PP. Update on diagnosis and management of chronic pancreatitis. Curr Gastroenterol Rep. Apr 1999;1(2):145–53. doi: 10.1007/s11894-996-0014-8 [DOI] [PubMed] [Google Scholar]
- 6.Ishiguro H, Yamamoto A, Nakakuki M, et al. Physiology and pathophysiology of bicarbonate secretion by pancreatic duct epithelium. Nagoya J Med Sci. Feb 2012;74(1–2):1–18. [PMC free article] [PubMed] [Google Scholar]
- 7.Pandol SJ. Water and Ion Secretion from the Pancreatic Ductal System. The Exocrine Pancreas. Morgan & Claypool Life Sciences; 2010. [PubMed] [Google Scholar]
- 8.Watanabe H, Kanematsu M, Tanaka K, et al. Fibrosis and postoperative fistula of the pancreas: correlation with MR imaging findings--preliminary results. Radiology. Mar 2014;270(3):791–9. doi: 10.1148/radiol.13131194 [DOI] [PubMed] [Google Scholar]
- 9.Winston CB, Mitchell DG, Outwater EK, Ehrlich SM. Pancreatic signal intensity on T1-weighted fat saturation MR images: clinical correlation. J Magn Reson Imaging. May-Jun 1995;5(3):267–71. doi: 10.1002/jmri.1880050307 [DOI] [PubMed] [Google Scholar]
- 10.Tirkes T, Yadav D, Conwell DL, et al. Diagnosis of chronic pancreatitis using semi-quantitative MRI features of the pancreatic parenchyma: results from the multi-institutional MINIMAP study. Abdom Radiol (NY). Oct 2023;48(10):3162–3173. doi: 10.1007/s00261-023-04000-1 [DOI] [PMC free article] [PubMed] [Google Scholar]
- 11.Trikudanathan G, Walker SP, Munigala S, et al. Diagnostic Performance of Contrast-Enhanced MRI With Secretin-Stimulated MRCP for Non-Calcific Chronic Pancreatitis: A Comparison With Histopathology. Am J Gastroenterol. Nov 2015;110(11):1598–606. doi: 10.1038/ajg.2015.297 [DOI] [PubMed] [Google Scholar]
- 12.Liu C, Shi Y, Lan G, Xu Y, Yang F. Evaluation of Pancreatic Fibrosis Grading by Multi-parametric Quantitative Magnetic Resonance Imaging. J Magn Reson Imaging. Nov 2021;54(5):1417–1429. doi: 10.1002/jmri.27626 [DOI] [PubMed] [Google Scholar]
- 13.Tirkes T, Saeed OA, Osuji VC, et al. Histopathologic correlation of pancreatic fibrosis with pancreatic magnetic resonance imaging quantitative metrics and Cambridge classification. Abdom Radiol (NY). Jul 2022;47(7):2371–2380. doi: 10.1007/s00261-022-03532-2 [DOI] [PMC free article] [PubMed] [Google Scholar]
- 14.Balci NC, Smith A, Momtahen AJ, et al. MRI and S-MRCP findings in patients with suspected chronic pancreatitis: correlation with endoscopic pancreatic function testing (ePFT). Comparative Study Evaluation Studies. J Magn Reson Imaging. Mar 2010;31(3):601–6. doi: 10.1002/jmri.22085 [DOI] [PubMed] [Google Scholar]
- 15.Tirkes T, Fogel EL, Sherman S, et al. Detection of exocrine dysfunction by MRI in patients with early chronic pancreatitis. Abdom Radiol (NY). Feb 2017;42(2):544–551. doi: 10.1007/s00261-016-0917-2 [DOI] [PMC free article] [PubMed] [Google Scholar]
- 16.Balci NC, Alkaade S, Magas L, Momtahen AJ, Burton FR. Suspected chronic pancreatitis with normal MRCP: findings on MRI in correlation with secretin MRCP. J Magn Reson Imaging. Jan 2008;27(1):125–31. doi: 10.1002/jmri.21241 [DOI] [PubMed] [Google Scholar]
- 17.Chowdhury RS, Forsmark CE. Review article: Pancreatic function testing. Review. Aliment Pharmacol Ther. Mar 15 2003;17(6):733–50. doi: 10.1046/j.1365-2036.2003.01495.x [DOI] [PubMed] [Google Scholar]
- 18.Yadav D, Park WG, Fogel EL, et al. PROspective Evaluation of Chronic Pancreatitis for EpidEmiologic and Translational StuDies: Rationale and Study Design for PROCEED From the Consortium for the Study of Chronic Pancreatitis, Diabetes, and Pancreatic Cancer. Pancreas. Nov/Dec 2018;47(10):1229–1238. doi: 10.1097/MPA.0000000000001170 [DOI] [PMC free article] [PubMed] [Google Scholar]
- 19.The Consortium for the Study of Chronic Pancreatitis, Diabetes and Pancreatic Cancer (CPDPC) NIDDK and NCI. https://cpdpc.mdanderson.org
- 20.Serrano J, Andersen DK, Forsmark CE, et al. Consortium for the Study of Chronic Pancreatitis, Diabetes, and Pancreatic Cancer: From Concept to Reality. Pancreas. Nov/Dec 2018;47(10):1208–1212. doi: 10.1097/MPA.0000000000001167 [DOI] [PMC free article] [PubMed] [Google Scholar]
- 21.Tirkes T, Dasyam AK, Shah ZK, et al. T1 signal intensity ratio of the pancreas as an imaging biomarker for the staging of chronic pancreatitis. Abdom Radiol (NY). Oct 2022;47(10):3507–3519. doi: 10.1007/s00261-022-03611-4 [DOI] [PMC free article] [PubMed] [Google Scholar]
- 22.Parakh A, Tirkes T. Advanced imaging techniques for chronic pancreatitis. Abdom Radiol (NY). May 2020;45(5):1420–1438. doi: 10.1007/s00261-019-02191-0 [DOI] [PMC free article] [PubMed] [Google Scholar]
- 23.Tirkes T, Yadav D, Conwell DL, et al. Magnetic resonance imaging as a non-invasive method for the assessment of pancreatic fibrosis (MINIMAP): a comprehensive study design from the consortium for the study of chronic pancreatitis, diabetes, and pancreatic cancer. Abdom Radiol (NY). Aug 2019;44(8):2809–2821. doi: 10.1007/s00261-019-02049-5 [DOI] [PMC free article] [PubMed] [Google Scholar]
- 24.Tirkes T, Yadav D, Conwell DL, et al. Quantitative MRI of chronic pancreatitis: results from a multi-institutional prospective study, magnetic resonance imaging as a non-invasive method for assessment of pancreatic fibrosis (MINIMAP). Abdom Radiol (NY). Nov 2022;47(11):3792–3805. doi: 10.1007/s00261-022-03654-7 [DOI] [PMC free article] [PubMed] [Google Scholar]
- 25.Tirkes T, Zhao X, Lin C, et al. Evaluation of variable flip angle, MOLLI, SASHA, and IR-SNAPSHOT pulse sequences for T(1) relaxometry and extracellular volume imaging of the pancreas and liver. MAGMA. Oct 2019;32(5):559–566. doi: 10.1007/s10334-019-00762-2 [DOI] [PMC free article] [PubMed] [Google Scholar]
- 26.Cheng HL, Wright GA. Rapid high-resolution T(1) mapping by variable flip angles: accurate and precise measurements in the presence of radiofrequency field inhomogeneity. Magn Reson Med. Mar 2006;55(3):566–74. doi: 10.1002/mrm.20791 [DOI] [PubMed] [Google Scholar]
- 27.Nekolla S, Gneiting T, Syha J, Deichmann R, Haase A. T1 maps by K-space reduced snapshot-FLASH MRI. J Comput Assist Tomogr. Mar-Apr 1992;16(2):327–32. doi: 10.1097/00004728-199203000-00031 [DOI] [PubMed] [Google Scholar]
- 28.Messroghli DR, Radjenovic A, Kozerke S, Higgins DM, Sivananthan MU, Ridgway JP. Modified Look-Locker inversion recovery (MOLLI) for high-resolution T1 mapping of the heart. Magn Reson Med. Jul 2004;52(1):141–6. doi: 10.1002/mrm.20110 [DOI] [PubMed] [Google Scholar]
- 29.Chow K, Flewitt JA, Green JD, Pagano JJ, Friedrich MG, Thompson RB. Saturation recovery single-shot acquisition (SASHA) for myocardial T(1) mapping. Magn Reson Med. Jun 2014;71(6):2082–95. doi: 10.1002/mrm.24878 [DOI] [PubMed] [Google Scholar]
- 30.Zhu L, Lai Y, Makowski M, et al. Native T1 mapping of autoimmune pancreatitis as a quantitative outcome surrogate. Eur Radiol. Aug 2019;29(8):4436–4446. doi: 10.1007/s00330-018-5987-9 [DOI] [PubMed] [Google Scholar]
- 31.Chouhan MD, Firmin L, Read S, Amin Z, Taylor SA. Quantitative pancreatic MRI: a pathology-based review. Br J Radiol. Jul 2019;92(1099):20180941. doi: 10.1259/bjr.20180941 [DOI] [PMC free article] [PubMed] [Google Scholar]
- 32.Serrao EM, Kessler DA, Carmo B, et al. Magnetic resonance fingerprinting of the pancreas at 1.5 T and 3.0 T. Sci Rep. Oct 16 2020;10(1):17563. doi: 10.1038/s41598-020-74462-6 [DOI] [PMC free article] [PubMed] [Google Scholar]
- 33.Tirkes T, Mitchell JR, Li L, Zhao X, Lin C. Normal T(1) relaxometry and extracellular volume of the pancreas in subjects with no pancreas disease: correlation with age and gender. Abdom Radiol (NY). Sep 2019;44(9):3133–3138. doi: 10.1007/s00261-019-02071-7 [DOI] [PMC free article] [PubMed] [Google Scholar]
- 34.Hill DV, Tirkes T. Advanced MR Imaging of the Pancreas. Magn Reson Imaging Clin N Am. Aug 2020;28(3):353–367. doi: 10.1016/j.mric.2020.03.003 [DOI] [PMC free article] [PubMed] [Google Scholar]
- 35.Tirkes T, Lin C, Fogel EL, Sherman SS, Wang Q, Sandrasegaran K. T(1) mapping for diagnosis of mild chronic pancreatitis. J Magn Reson Imaging. Apr 2017;45(4):1171–1176. doi: 10.1002/jmri.25428 [DOI] [PMC free article] [PubMed] [Google Scholar]
- 36.Tirkes T, Lin C, Cui E, et al. Quantitative MR Evaluation of Chronic Pancreatitis: Extracellular Volume Fraction and MR Relaxometry. AJR Am J Roentgenol. Mar 2018;210(3):533–542. doi: 10.2214/AJR.17.18606 [DOI] [PMC free article] [PubMed] [Google Scholar]
- 37.Akisik MF, Aisen AM, Sandrasegaran K, et al. Assessment of chronic pancreatitis: utility of diffusion-weighted MR imaging with secretin enhancement. Radiology. Jan 2009;250(1):103–9. doi: 10.1148/radiol.2493080160 [DOI] [PubMed] [Google Scholar]
- 38.Kolipaka A, Schroeder S, Mo X, Shah Z, Hart PA, Conwell DL. Magnetic resonance elastography of the pancreas: Measurement reproducibility and relationship with age. Magn Reson Imaging. Oct 2017;42:1–7. doi: 10.1016/j.mri.2017.04.015 [DOI] [PMC free article] [PubMed] [Google Scholar]
- 39.Shi Y, Glaser KJ, Venkatesh SK, Ben-Abraham EI, Ehman RL. Feasibility of using 3D MR elastography to determine pancreatic stiffness in healthy volunteers. J Magn Reson Imaging. Feb 2015;41(2):369–75. doi: 10.1002/jmri.24572 [DOI] [PMC free article] [PubMed] [Google Scholar]
- 40.Kloppel G Chronic pancreatitis, pseudotumors and other tumor-like lesions. Mod Pathol. Feb 2007;20 Suppl 1:S113–31. doi: 10.1038/modpathol.3800690 [DOI] [PubMed] [Google Scholar]
- 41.Esposito I, Hruban RH, Verbeke C, et al. Guidelines on the histopathology of chronic pancreatitis. Recommendations from the working group for the international consensus guidelines for chronic pancreatitis in collaboration with the International Association of Pancreatology, the American Pancreatic Association, the Japan Pancreas Society, and the European Pancreatic Club. Pancreatology. Jun 2020;20(4):586–593. doi: 10.1016/j.pan.2020.04.009 [DOI] [PubMed] [Google Scholar]
- 42.Steinkohl E, Olesen SS, Mark EB, et al. Progression of parenchymal and ductal findings in patients with chronic pancreatitis: A 4-year follow-up MRI study. Eur J Radiol. Apr 2020;125:108868. doi: 10.1016/j.ejrad.2020.108868 [DOI] [PubMed] [Google Scholar]
- 43.Tirkes T, Shah ZK, Takahashi N, et al. Reporting Standards for Chronic Pancreatitis by Using CT, MRI, and MR Cholangiopancreatography: The Consortium for the Study of Chronic Pancreatitis, Diabetes, and Pancreatic Cancer. Radiology. Jan 2019;290(1):207–215. doi: 10.1148/radiol.2018181353 [DOI] [PMC free article] [PubMed] [Google Scholar]
- 44.Frokjaer JB, Akisik F, Farooq A, et al. Guidelines for the Diagnostic Cross Sectional Imaging and Severity Scoring of Chronic Pancreatitis. Pancreatology. Oct 2018;18(7):764–773. doi: 10.1016/j.pan.2018.08.012 [DOI] [PubMed] [Google Scholar]
- 45.Zhang XM, Shi H, Parker L, Dohke M, Holland GA, Mitchell DG. Suspected early or mild chronic pancreatitis: enhancement patterns on gadolinium chelate dynamic MRI. Magnetic resonance imaging. J Magn Reson Imaging. Jan 2003;17(1):86–94. doi: 10.1002/jmri.10218 [DOI] [PubMed] [Google Scholar]
- 46.Atkinson MA, Campbell-Thompson M, Kusmartseva I, Kaestner KH. Organisation of the human pancreas in health and in diabetes. Diabetologia. Oct 2020;63(10):1966–1973. doi: 10.1007/s00125-020-05203-7 [DOI] [PMC free article] [PubMed] [Google Scholar]
- 47.Sarner M, Cotton PB. Classification of pancreatitis. Gut. Jul 1984;25(7):756–9. doi: 10.1136/gut.25.7.756 [DOI] [PMC free article] [PubMed] [Google Scholar]
- 48.Conwell DL, Lee LS, Yadav D, et al. American Pancreatic Association Practice Guidelines in Chronic Pancreatitis: evidence-based report on diagnostic guidelines. Pancreas. Nov 2014;43(8):1143–62. doi: 10.1097/MPA.0000000000000237 [DOI] [PMC free article] [PubMed] [Google Scholar]
- 49.Swensson J, Akisik F, Collins D, Olesen SS, Drewes AM, Frokjaer JB. Is Cambridge scoring in chronic pancreatitis the same using ERCP and MRCP?: A need for revision of standards. Abdom Radiol (NY). Feb 2021;46(2):647–654. doi: 10.1007/s00261-020-02685-2 [DOI] [PubMed] [Google Scholar]
- 50.Tirkes T, Shah ZK, Takahashi N, et al. Inter-observer variability of radiologists for Cambridge classification of chronic pancreatitis using CT and MRCP: results from a large multicenter study. Abdom Radiol (NY). May 2020;45(5):1481–1487. doi: 10.1007/s00261-020-02521-7 [DOI] [PMC free article] [PubMed] [Google Scholar]
- 51.Trout AT, Abu-El-Haija M, Anupindi SA, et al. Interobserver Agreement for CT and MRI Findings of Chronic Pancreatitis in Children: A Multicenter Ancillary Study Under the INSPPIRE Consortium. AJR Am J Roentgenol. Aug 2022;219(2):303–313. doi: 10.2214/AJR.21.27234 [DOI] [PMC free article] [PubMed] [Google Scholar]
- 52.Barreto SG, Carati CJ, Toouli J, Saccone GT. The islet-acinar axis of the pancreas: more than just insulin. Am J Physiol Gastrointest Liver Physiol. Jul 2010;299(1):G10–22. doi: 10.1152/ajpgi.00077.2010 [DOI] [PubMed] [Google Scholar]
- 53.Tang X, Kusmartseva I, Kulkarni S, et al. Image-Based Machine Learning Algorithms for Disease Characterization in the Human Type 1 Diabetes Pancreas. Am J Pathol. Mar 2021;191(3):454–462. doi: 10.1016/j.ajpath.2020.11.010 [DOI] [PMC free article] [PubMed] [Google Scholar]