

Abstract

Colorectal cancer (CRC) remains a significant health burden globally, necessitating a deeper understanding of its molecular intricacies for effective therapeutic interventions. Elevated monoamine oxidase-A (MAO-A) expression has been consistently observed in CRC tissues, correlating with advanced disease stages and a poorer prognosis. This research explores the systems biology effects of MAO-A inhibition with small molecule inhibitor clorgyline regarding CRC. The applied systems biology approach starts with a chemocentric informatics approach to derive high-confidence hypotheses regarding the antiproliferative effects of MAO-A inhibitors and ends with experimental validation. Our computational results emphasized the anticancer effects of MAO-A inhibition and the chemogenomics similarities between clorgyline and structurally diverse groups of apoptosis inducers in addition to highlighting apoptotic, DNA-damage, and microRNAs in cancer pathways. Experimental validation results revealed that MAO inhibition results in antiproliferative antimigratory activities in addition to synergistic effects with doxorubicin. Moreover, the results demonstrated a putative role of MAO-A inhibition in commencing CRC cellular death by potentially mediating the induction of apoptosis.
1. Introduction
Colorectal cancer stands as one of the most prevalent malignancies globally, with an estimated 1.9 million new cases reported in 2020 alone.1 Despite advancements in treatment modalities, its survival rates vary widely, highlighting the need for continued investigation into factors influencing prognosis and therapeutic efficacy.2
Reactive oxygen species (ROS) play a pivotal role in the complex landscape of cancer development.3 The relationship between Monoamine Oxidase (MAO) and ROS highlights a vital connection within the complex world of cell functions, where MAO’s actions modulate ROS levels, potentially impacting our well-being and diseases, such as cancer.3
Monoamine oxidase MAO enzyme is located within the outer membrane of the mitochondria with two isoforms, MAO-A isoenzyme and MAO-B isoenzyme, both of which are encoded in the X chromosome genes (Xp11.23–11.4).4,5 The MAO enzymes have a flavin adenine dinucleotide (FAD) that is covalently attached to a cysteine residue through an 8α-(S-cysteinyl)-riboflavin bond,6 hence, their roles as oxygen oxidoreductase (deaminating). MAO isoforms differ in specificity for substrates, sensitivity to inhibitors, tissue distribution, and immunological properties.7 MAO-A, in the human body, is abundant in the intestine, heart, and placenta, while MAO-B is abundant in platelets, liver cells, and brain glial cells.8−11
Surprisingly, in addition to the numerous studies discussing the brain functions affected by MAO-A and MAO-B, recent studies emphasized that MAO enzyme contributes important roles in tumorigenesis, obesity, diabetes, and cardiovascular diseases.12−15 Interestingly, evidence is emerging to support the role of MAO-A isoenzyme in the progression and metastasis of many cancer types including prostate cancer, hepatocellular carcinoma, and lung cancer.16−18
On the other hand, other studies suggested that MAO-A may promote apoptosis in different types of cancer such as neuroblastoma,19 hepatocellular carcinoma,20 and differentiated prostate tumorigenesis.16 Earlier studies demonstrated that MAO-A-induced ROS participates in suppressing cancer progression.21,22 Besides, MAO-A-induced ROS stimulates mitochondrial dysfunction via the activation of mitophagy through p53 and p21 induction.23 The activity of MAO-A in HCT116 was explored by investigating how IL-13 and 13(S)HpODE contribute to cancer cell apoptosis.21 It was concluded that 13(S)HpODE stimulates HCT116 apoptosis by upregulation of p53 and p21 expression. An in vivo colon cancer tumorigenic study was used to validate the observations. The results confirmed that 13(S)HpODE significantly decreases solid tumor growth by triggering apoptosis.21
Several studies have investigated MAOIs for their potential anticancer activity, however, their effects against cancer are discrete24 with more emphasis on the nonclinical irreversible MAO-A inhibitor, clorgyline.25,26 Indeed, the inhibition of MAO-A was demonstrated to be essential for chemotherapeutics to achieve their substantial benefits in prostate cancer, glioma, breast cancer, and classical Hodgkin lymphoma.26−28 In addition, dual MMP-9/MAO-A inhibitors were designed and evaluated in HCT116 colorectal cancer cells.22 Their anticancer activities were reported as potent antiproliferative agents against HCT116 (IC50; 6–9 nM).22
Considering the collective evidence of the critical role of MAO-A in the human body, it is expected to affect the biology of cancer; and as limited data are available regarding the MAO-A enzyme-specific role in CRC proliferation, tumorigenesis, metastasis, and prognosis, this research aims to establish such relationships and provide a mechanistic insight into the anticancer activity of MAO-A inhibitors by applying a comprehensive integrative informatics approach backed by both theoretical and experimental evidence.
2. Materials and Methods
2.1. Computational Methods
2.1.1. Integrative Chemical Biology Informatics Workflow
We applied an integrative informatics workflow to study the network pharmacology of MAO inhibitors based on the methods developed by Hajjo et al.29−32 to formulate testable hypotheses regarding the putative anticancer mechanisms of MAO inhibitors in general and for clorgyline in particular. This workflow incorporates three major components: (1) a module for deriving gene signatures representative of the chemical compound’s biological action; (2) a network-mining module to identify genetic perturbations that result in gene expression profiles resembling the compound’s gene signature; and (3) a pathway enrichment module to elucidate the biological processes involved in the mechanism of action of the chemical compound in a specific condition.
2.1.2. Gene Signatures for Clorgyline and Other MAO Inhibitors
We examined the gene expression omnibus (GEO) for transcriptional studies conducted in response to treatment with MAO inhibitors and identified GSE1716733 transcriptomics data for clorgyline. Clorgyline gene expression profiles obtained from GSE17167 were derived in response to treating the primary cultures of human prostatic cancer cells E-CA-88 and E-CA-90 with clorgyline and all raw data files are deposited in the Gene Expression Omnibus (GEO)34 of the National Center for Biotechnology Information (NCBI). The prioritized gene signature GS for clorgyline consisted of differentially expressed genes (DEGs) that passed our selection thresholds for fold changes and false discovery rates (FDRs). All DEGs in the gene signature had log2FC of ≥2 or ≤−2, and FDR of ≤0.05.
2.1.3. Connectivity Map (CMap)
The CMap is a computational tool and a chemogenomics database that constitutes a cornerstone of the chemocentric informatics workflow developed by Hajjo et al.29,30 It lists 1.3 million profiles of transcriptional responses of human cells to chemical and genetic perturbations. Now, there are 27927 perturbagens (19911 small molecules, and 7494 genetic perturbagens) generating 476251 expression signatures in 9 human cell lines: PC3, VCAP, A375, A459, HA1E, HCC515, HT29, MCF7, and HEPG2. This database uses the L1000 platform,35 which is a high-throughput gene expression assay that assesses the mRNA transcript abundance of 978 “landmark” genes from human cells. The CMap approach enables researchers to identify biological similarities based on chemogenomic effects (i.e., the gene expression profiles in response to the treatment of cancer cell lines with chemical compounds). The CMap was searched using a gene signature for clorgyline prioritized from GSE17167 described in the previous section.
2.1.4. Enrichment Analysis
Pathway enrichment analyses were conducted in the Key Pathway Advisor36 to interpret the consequences of vaccine-induced differential gene expression on biological processes. The significance of the enrichment was assessed by calculating hypergeometric p-values 110. All ontology terms were ranked according to their calculated p-values. Terms with p-values below the threshold of 0.05 were classified as statistically significant and relevant to the gene list under investigation.
2.1.5. Causal Reasoning
Causal Reasoning37 was used to identify upstream regulators (transcription factors, RNA molecules, kinases, phosphatases, and other proteins) that could explain the observed gene expression changes in transcriptomics experiments in response to treatment with clorgyline. We relied on MetaCore’s37 database (MetaBase) as an interactions database, and the causal reasoning algorithm implemented in Clarivate’s Key Pathway Advisor. Further details about this method were published previously.38
2.1.6. Signaling Pathway Impact Analysis (SPIA)
The SPIA39 was carried out to analyze the impact of DEGs in clorgyline’s gene signature on the activity of the enriched pathways. This method helps in identifying the most biologically relevant pathways and candidate causal genes. In this study, we identified perturbed pathways in response to clorgyline treatment by conducting enrichment analyses on DEGs and the union gene list consisting of the experimentally derived DEGs and predicted key hubs (e.g., activated or inhibited proteins) using causal reasoning.
2.1.7. Protein–Protein Interactions
A systematic search for MAO-A nearest neighbor (NN) genes/proteins was conducted in Cytoscape,40 version 3.10.1, using the STRING41 protein query application. All retrieved protein–protein interactions (PPIs), including both physical and functional interactions, were retrieved, and then the Network building tools in Cytoscape were used to generate MAO-A’s PPI network.
2.2. Experimental Methods
2.2.1. Cell Lines and Cell Maintenance
Colorectal cancer cell lines HCT116, Caco2, SW480, SW620, and HT-29 cells were all supplied by the American Type Culture Collection (ATCC, USA). Fibroblast cells (dermal origin) were used as models for normal human tissue, also purchased from ATCC. Cells were all well maintained in DMEM high glucose culture medium with supplemented 10% FBS, 2 mM l-glutamine, 100 U/mL penicillin, and 0.1 mg/mL streptomycin. Cells were routinely cultured in 75 cm2 flasks and incubated into a humidified controlled temperature incubator set at 37 °C, 95% humidity, and 5% CO2.
2.2.2. Cell Viability Assay
3-(4,5-Dimethylthiazol-2-yl)-2,5-diphenyltetrazolium bromide (MTT) assay was implied to evaluate cell proliferation as previously noted.42 All experiments were run in triplicate wells and were repeated at least two times independently. The percentage of the relative cell viability of treated cells versus the untreated cells (negative controls) was calculated using the following formula in eq 1 (cell viability calculation):
| 1 |
Optical density data is retrieved using the MTT assay.
2.2.3. Drug Combination Assay with Doxorubicin
CRC cell lines were seeded duplicates per group in 96-well plates, in accordance with factors explained in a previous table considering three time points 24, 48, and 72 h. To investigate the combined effect of MAOIs on doxorubicin, cells were treated with various concentrations of Clorgyline and doxorubicin, alone and in combination. The ratio of GI50 for each drug alone guided the selection of the appropriate combination ratio. The combination ratio of Doxorubicin with Clorgyline was 1:100 with a doubling increment in concentrations (range from 0.0625:6.25 μM - 4:400 μM). After treatment time elapsed, an MTT assay was conducted to assess cell viability, as previously explained. The combination index (CI) was then calculated using CompuSyn software, which is based on Chou-Talalay’s Combination Index Theorem, explained in eq 2.
| 2 |
where (Dx)1 = dose of drug 1 to produce 50% cell kill alone and (D)1 = dose of drug 1 to produce 50% cell kill in combination with (D)2. (Dx)2 = dose of drug 2 to produce 50% cell kill alone and (D)2 = dose of drug 2 to produce 50% cell kill in combination with (D)1.
2.2.4. Migration Assay
Human CRC cells (HCT116, and HT29) were seeded in inserts on a 24-well plate at a concentration of 20000 cells per insert side for HCT116 and 30000 cells per insert side for HT29 cells, each in 75 μL of fresh complete medium and incubated at room temperature to reach 85–90% confluency for almost 24 h. Afterward, inserts were removed, and cells were incubated for 1 h with 10 μg/mL of mitomycin C to pause cell proliferation, the medium was discarded and cells were washed with fresh media three times before treatment with around GI50 concentrations of clorgyline. Images were captured at zero, and 24 h using an EVOS XL Core imaging system at 4× magnification. Digital images were analyzed for wound area using ImageJ software, ver. 1.53e.43
2.2.5. Annexin V-FITC/Propidium Iodide Apoptosis Assay
Colorectal cancer cells were plated in 6-well plates at a seeding density of 3 × 10⁵ cells per well for HCT116 and 4 × 10⁵ cells per well for Caco2 cell lines, both in duplicates and to a final volume of 5 mL of media per well. Then it was allowed to attach for 24 h in the humidified controlled temperature incubator set at 37 °C, 95% humidity, and 5% CO2. Afterward, cells were then treated with double GI50 concentration of clorgyline for 24 h, while doxorubicin was used as a positive control. Wells with only fresh full medium were used as the negative control. After 24 h of incubation with treatment, floating cells were collected in 5 mL flow tubes, and the adherent cells were harvested using 500 μL of trypsin, both floating and adherent cells were collected in the 5 mL flow tube and centrifuged according to the manufacturer protocol at 1400 rpm, 4 °C for 10 min. The supernatant was discarded, and resuspension of the cell pellet was conducted in 500 μL cold PBS and again centrifuged for washing any residual media. The pellets were resuspended in 200 μL of 1× binding buffer per tube. Cells then were stained with 5 μL Annexin V-FITC and allowed 5 min of incubation at room temperature, followed by the addition of propidium iodide (50 μg/mL) to each tube and analyzed immediately using BD FACSCanto II flow cytometer (BD Biosciences, USA). The analysis was performed using BD FACSDiva software.
2.2.6. Real-Time Polymerase Chain Reaction
Human CRC cells (HCT116) were seeded in a Petri dish at a density of 3 × 10⁵ cells per dish, while fibroblasts were seeded in a Petri dish at a density of 1 × 10⁶ cells per dish, and both allowed for incubation overnight to ensure adherence to confluency. HCT116 cells were treated around GI50 of clorgyline for 24, and 48 h: both in duplicates. Fibroblasts were not treated and only used as a baseline for normal cells, while as well an untreated HCT116 control was accounted for. After each treatment time elapsed, the total RNA of cells was extracted and purified using Direct-zol RNA Miniprep Plus kit according to manufacturer protocol, moreover, nanodrop was used to assess the purity and concentration of RNA produced. Afterward, the reverse-transcription reaction solution was carried out on ice by adding 2 μL of 5× PrimeScript RT Master Mix, 500 ng of total RNA, and completed with RNase Free dH2O up to 10 μL. Afterward, a reverse-transcription reaction was performed at 37 °C for 15 min, followed by 85 °C for 5 s for reverse transcriptase heat inactivation and then at 4 °C to allow first-strand cDNA synthesis, which was also confirmed for purity and quantity using nanodrop. Quantitative real-time PCR was conducted using SYBR Green Real-time PCR Master Mix through a 7900 real-time PCR detection system (Applied Biosystems, USA). Primer sequences and their optimized annealing temperatures (Ta) are shown in Table 1
Table 1. Primers’ Forward and Reverse Sequences with Their Optimized Annealing Temperaturea.
| primer | primer sequence | Ta (°C) |
|---|---|---|
| MAOA | forward: 5-GCCAAGATTCACTTCAGACCAGAG-3 | 59 |
| reverse: 5-TGCTCCTCACACCAGTTCTTCTC-3 | ||
| Bcl-2 | forward: 5-TTGTGGCCTTCTTTGAGTTCGGTG-3 | 59 |
| reverse: 5-GGTGCCGGTTCAGGTACTCAGTCA-3 | ||
| VEGF | forward: 5-CTACCTCCACCATGCCAAGT-3 | 59 |
| reverse: 5-GCAGTAGCTGCGCTGATAGA-3 | ||
| GAPDH | forward: 5-ACAACTTTGGTATCGTGGAAGG-3 | 58 |
| reverse: 5-GCCATCACGCCACAGTTTC-3 |
Ta: annealing temperature; MAOA: gene for monoamine oxidase-A enzyme; Bcl-2: gene for B-cell lymphoma 2; VEGF: gene for vascular endothelial growth factor; GAPDH: gene for glyceraldehyde 3-phosphate dehydrogenase.
Using 20 μL of sample volume per reaction, recommended thermal cycling included one initial denaturation cycle at 95 °C for 15 min, followed by 45 cycles of 95 °C for 15 s, Ta °C for 30 s, and 72 °C for 30 s. The MAO elongation step was carried out at 72 °C for 55 s. Changes of expression were normalized against the GAPDH housekeeping gene using ΔΔCt method described in eq 3 (ΔΔCt method to assess relative fold difference in gene expression).44
| 3 |
where TE is gene being tested experimental, TC is gene being tested control, HE is housekeeping gene experimental, and HC is housekeeping gene control. ΔCt values for the experimental (ΔCTE) and control (ΔCTC) conditions, respectively. 2(−ΔΔCt) is the expression fold change.
2.3. Statistical Methods to Analyze Experimental Data
Data analysis was performed using GraphPad Prism software (GraphPad Prism version 9.0.0 for Windows, GraphPad Software, San Diego, California USA) and a statistical package for the social sciences software (IBM Corp. Released 2016. IBM SPSS Statistics for Windows, Version 24.0. Armonk, NY, IBM Corp.). Differences between treatment groups were analyzed using independent sample t tests, one-way ANOVA, or two-way ANOVA as appropriate. Paired sample t tests were employed to evaluate cell viability at different time points. Data are presented as mean ± SD, with p < 0.05 considered statistically significant. A nonlinear regression analysis was used to calculate GI50 values. The combination index (CI) was calculated using CompuSyn software (Combosyn Inc., Paramus, NJ, USA), which is based on Chou-Talalay’s Combination Index Theorem. The wound area was measured using ImageJ software, Ver 1.53e.43
3. Results
3.1. Computational Results
In this work, we relied on an informatics systems biology workflow to formulate testable hypotheses regarding the putative anticancer effects of MAO-A inhibitor clorgyline. This workflow relied on the methods developed by Hajjo et al.29−32 and tweaked to study the systems biology effects of MAO-A inhibitors considering available transcriptomics data for MAO-A inhibitors, in general, and clorgyline, in particular, as shown in Figure 1.
Figure 1.

Workflow for studying the systems biology effects of MAO-A inhibitor clorgyline. GS is the gene signature; CMap is the connectivity map.
3.1.1. Clorgyline Gene Signature (GS)
The process of deriving a transcriptional gene signature (GS) for clorgyline was described in the Materials and Methods section. The derived GS consisted of 304 DEGs (263 upregulated genes and 41 downregulated genes) that passed the filtration criteria of log2FC of ≥2 or ≤−2 and FDR ≤ 0.05. This gene signature was then used to query chemogenomics and systems biology databases to identify chemical compounds and genetic perturbations that resemble the effects of chlorogene on gene transcription. Clorgyline’s gene signature can be found in Supporting Information, Table 1.
3.1.2. Similar Chemical and Genetic Perturbations Predicted from the CMap
Clorgyline GS consisting of 307 DEGs was used to query the CMap to identify chemical compounds and genetic perturbations capable of inducing transcriptomic effects similar to those induced by clorgyline in treated cancer cell lines. Our results indicated that there is 41 positive connectivity (i.e., transcriptionally similar) compound hits to clorgyline with CMap scores ≥90%. The top ten scoring compound hits are shown in Table 2 and six of them are apoptotic simulants. Mining the biomedical literature for potential links between compound hits and apoptosis indicated that all top 10 compound hits, with a positive connectivity score, are linked to apoptosis.
Table 2. Chemical Perturbagens with the Top Positive CMap Connectivity Scores to Clorgyline.

Score refers to the CMap score. It represents the level of similarity between transcriptional effects induced by clorgyline and each of the compound perturbagens shown in the table.
Validation refers to the presence of any supporting evidence from the biomedical literature that the predicted clorgyline mimics have anticancer effects.
The CMap analysis also revealed genes that upon overexpression (oe) or knockdown (kd) led to transcriptional effects similar to those of clorgyline. The top 10 genetic positive connectivity perturbagens to clorgyline are shown in Table 3. Further analysis indicated that all top 10 genetic perturbagens are implicated in apoptosis and/or cancer according to experimental evidence published in the biomedical literature.
Table 3. Genetic Perturbagens with the Top Positive CMap Connectivity Scores to Clorgyline.
| No. | gene | scorea | type | description | validationb |
|---|---|---|---|---|---|
| 1 | GAMT | 99.82 | kd | methyltransferase | apoptosis61 |
| 2 | PDX1 | 99.49 | kd | homeoboxes/ANTP class; HOXL subclass | regulates pancreatic ductal adenocarcinoma initiation and maintenance62 |
| 3 | ATG12 | 99.45 | kd | autophagy-related 12 | cancer prognosis63 |
| 4 | G6PD | 99.42 | kd | glucose-6-phosphate dehydrogenase | cancer growth64 |
| 5 | FYN | 99.37 | kd | Src family | cancer growth, metastasis, apoptosis, migration, chemotherapy resistance65 |
| 6 | ANXA1 | 99.26 | kd | annexins | tumorigenesis biomarker66 |
| 7 | NRBP2 | 99.08 | kd | NRBP family | tumor suppressor67 |
| 8 | TSPAN8 | 98.89 | kd | tetraspanins | cancer cell stemness, chemotherapy resistance68 |
| 9 | CDX1 | 98.89 | kd | homeoboxes/ANTP class: HOXL subclass | tumor suppressors69 |
| 10 | FST | 98.79 | kd | follistatin (FST) is a secretory glycoprotein | tumorigenesis, metastasis, angiogenesis of solid tumors70 |
Score refer to the CMap score. It represents the level of similarity between transcriptional effects induced by clorgyline and each of the compound perturbagens shown in the table.
Validation refers to the presence of any supporting evidence from the biomedical literature that the predicted positive gene connections to clorgyline have anticancer effects.
3.1.3. Upstream Causal Reasoning Hubs
Upstream analysis was performed using the DEGs in clorgyline’s GS. About 675 activated and 544 inactivated upstream regulators including transcription factors, kinases, phosphatases, and microRNAs (Supporting Information, Table 2) were successfully predicted. All prioritized upstream regulators have prediction activities with p-values ≤ 0.05 and a calculation distance = 1–3. The prioritized upstream regulators have rank scores based on the number of differentially expressed genes that can be reached via the shortest paths and the correctness of the regulation. The accuracy of activity predictions is evaluated based on the activation and inhibition edges along the pathways and the alignment between the expected and observed directionality of fold changes in the DEGs. It is important to note that the calculation distance is a crucial parameter for distinguishing direct regulatory effects from indirect ones. For instance, a calculation distance of 1 indicates that the upstream regulator is directly one step from the transcriptional event, signifying that the regulation is direct. Table 4 shows the top 10 causal reasoning hubs for clorgyline’s DEGs.
Table 4. Top 10 Causal Reasoning Hubs for Clorgyline’s GS.
| No. | molecular entity | gene | predicted activity | activity prediction p-value | distance | validation |
|---|---|---|---|---|---|---|
| 1 | OTUD1 | OTUD1 | – | 6.64 × 10⁻¹² | 3 | Exacerbates colon cancer progression.71 |
| 2 | GHET1 | GHET1 | + | 8.48 × 10⁻¹² | 3 | Knockdown of long noncoding RNA GHET1 inhibits cell proliferation and invasion of colorectal cancer.72 |
| 3 | miR-24-3p | MIR24-1 | – | 8.89 × 10⁻¹² | 2 | miR-24-3p promotes colon cancer progression by targeting ING1.73 |
| MIR24-2 | ||||||
| 4 | RNF12 | RLIM | – | 8.89 × 10⁻¹² | 3 | Ring finger protein 2 promotes colorectal cancer progression by suppressing early growth response 1.74 |
| 5 | PSMA3 | PSMA3 | + | 2.09 × 10⁻¹¹ | 3 | PSMA3-AS1, is an antisense RNA molecule that is transcribed from the opposite DNA strand of the PSMA3 gene, and it regulates PSMA3. PSMA3-AS1 promotes colorectal cancer cell migration and invasion via regulating miR-4429.75 |
| 6 | MALAT1 | MALAT1 | + | 2.58 × 10⁻¹¹ | 2 | MALAT1 expression is associated with CRC cell proliferation, tumorigenicity, and metastasis.76 |
| 7 | tubulin alpha-1B | TUBA1B | – | 2.74 × 10⁻¹¹ | 3 | Has oncogenic role in some human cancers. |
| 8 | endophilin A2 | SH3GL1 | + | 2.87 × 10⁻¹¹ | 3 | Has oncogenic role in some human cancers. |
| 9 | miR-24-3p | MIR24-1 | – | 3.00 × 10⁻¹¹ | 3 | miR-24-3p promotes colon cancer progression by targeting ING1.73 |
| MIR24-2 | ||||||
| 10 | miR-572 | MIR572 | + | 4.48 × 10⁻¹¹ | 3 | Contributes to CRC progression.77 |
3.1.4. Downstream Pathway Enrichment
Downstream enrichment analysis was performed using clorgyline’s GS (i.e., DEGs) as a query to MetaCore and employing the enrichment analysis workflow. The top 10 highest confidence enriched pathways are shown in Table 5. Each pathway has three p-values: (1) the p-value resulting from genes in clorgyline’s GS (i.e., DEGs that passed the default setting for gene expression and p-value), (2) the p-value resulting from predicted causal hubs, and (3) the union p-value resulting from genes in the GS plus causal hubs. Hypotheses are ranked based on their union p-values (Table 5).
Table 5. Top 10 Pathway Maps Enriched with Clorgyline’s DEGs.
| No. | pathway map | union p-value | DEG p-value | key hubs p-value | direction |
|---|---|---|---|---|---|
| 1 | ligand-independent activation of androgen receptor in prostate cancer | 4.91 × 10⁻¹⁰ | 5.68 × 10–04 | 4.34 × 10–07 | NA |
| 2 | role of microRNAs in cell proliferation in colorectal cancer | 1.37 × 10–08 | 3.66 × 10–02 | 2.06 × 10–07 | NA |
| 3 | development_androgen receptor in reproductive system development | 4.67 × 10–08 | 7.75 × 10–03 | 3.02 × 10–06 | – |
| 4 | WNT signaling in the progression of lung cancer | 5.89 × 10–08 | 8.11 × 10–03 | 3.59 × 10–06 | NA |
| 5 | DNA damage_double-strand break repair via homologous recombination | 6.40 × 10–08 | 2.37 × 10–04 | 1.30 × 10–05 | + |
| 6 | TGF-beta signaling via kinase cascades in breast cancer | 1.50 × 10–07 | 2.26 × 10–02 | 5.85 × 10–07 | NA |
| 7 | regulation of GSK3 beta in bipolar disorder | 1.74 × 10–07 | 1.14 × 10–02 | 8.40 × 10–06 | NA |
| 8 | signal transduction_S1P1 receptor signaling | 3.27 × 10–07 | 2.71 × 10–02 | 5.72 × 10–06 | NA |
| 9 | DNA damage_ATM activation by DNA damage | 3.69 × 10–07 | 7.48 × 10–04 | 1.24 × 10–04 | NA |
| 10 | role of inhibition of WNT signaling in the progression of lung cancer | 8.35 × 10–07 | 4.13 × 10–02 | 1.24 × 10–05 | NA |
Furthermore, we explored MAO-A’s nearest neighbor protein–protein interactions network which was generated using Cytoscape40 based on STRING interactions. The derived interaction network was then used as a query to perform enrichment analysis of network genes/proteins in Cytoscape. Results indicated that the genes/proteins in MAO-A’s nearest neighbor network are enriched in several cancer pathways including prostate cancer and proteoglycans in cancer. Furthermore, several pathways pivotal to tumorigenesis and cancer progression were involved including MAPK signaling, TNF signaling and RAS signaling pathways with different levels of alterations (Figure 2A,B).
Figure 2.

Pathway enrichment and genomic alterations for MAO-A and five colon cancer cell lines. (A) Pathways analysis for the MAO-A protein–protein interaction network. (B) MAO-A genomic alterations in cancer were determined using cBioPortal. (C) Affected cancer pathways were across five different colon cancer cell lines. The affected cancer pathways are shown on the x-axis. The number of affected genes in each pathway is shown on the y-axis. The NRF2 pathway is not shown because it was not perturbed in any of the analyzed colon cancer cell lines.
3.1.6. Comparison of Colon Cancer Cell Lines
Five colon cancer cell lines maintained in our lab were compared based on the affected genes across 10 cancer pathways monitored by the cBioPortal project:78 cell cycle, HIPPO, MYC, NOTCH, NRF2, PI3K, RTK-RAS, TGF-Beta, TP53, and WNT. The results of this analysis are shown in Figure 2C.
3.1.7. Integrating Results and Hypothesis Generation
CMap compound hits highlight apoptosis and cancer pathways. CMap gene hits highlighted cancer involvement. Causal reasoning gene/protein hits hubs involved in cancer and microRNAs in cancer. Enriched pathway maps highlighted microRNAs in CRC, WNT, DNA-damage, TGF-beta, WNT, ATM signaling, and GSK3-beta. MAO-A network biology highlighted MAPK, TNF, AGE-RAGE, toll-like receptor, C-type lectin receptor, proteoglycans, cAMP signaling, neurotrophen, and RAS signaling.
3.3. Experimental Results
3.3.1. Effects of MAO-A Inhibitor on the Viability of CRC Cell Lines
Five human cancer cell lines (HCT116, Caco2, SW480, SW620, and HT-29) representing different molecular subtypes of CRC were used to investigate the effects of MAO-A inhibition by clorgyline on cellular viability and proliferation by using the MTT assay. Normal dermal fibroblasts were used as a control. All cells were exposed to increasing concentrations of clorgyline for 24, 48, and 72 h. Clorgyline has shown antiproliferative activity, as treated CRC cells had reduced cellular viability compared to untreated CRC cells. GI50 values, which describe 50% inhibitory concentration, for MAO-A inhibitors treatment against tested human CRC cell lines ranged from 66.9–256.6 μM (Table 6). The analysis of the statistical significance is shown in Figure 3A. Moreover, clorgyline did not affect the viability of normal dermal fibroblasts at the same range of concentrations used against the human CRC cell lines.
Table 6. Micromolar (μM) GI50 Values for MAO-A Inhibitor Clorgyline in Five CRC Cell Lines at Three Incubation Times.
| time (h) | HCT116 | Caco2 | SW480 | SW620 | HT29 |
|---|---|---|---|---|---|
| 24 | 230.1 ± 3.2 | 237.8 ± 0.7 | 256.6 ± 0.8 | 248.8 ± 1.0 | 212.3 ± 0.9 |
| 48 | 84.5 ± 6.1 | 150.3 ± 6.2 | 132.7 ± 6.7 | 118.5 ± 1.7 | 132.6 ± 5.2 |
| 72 | 66.9 ± 7.1 | 108.1 ± 4.0 | 85.8 ± 4.0 | 103.1 ± 1.9 | 83.1 ± 4.4 |
Figure 3.

(A) Time-dependent inhibition of HCT116, Caco2, SW480, SW620, and HT-29 colorectal cancer cells at 24, 48, and 72 h treatment duration with clorgyline. The data shown represent the GI50 ± SD. GI50 was calculated by using Prism software. Each experiment was performed in triplicate and repeated at least twice independently. P-value < 0.05 indicates statistical significance in comparison to GI50 at 24 h treatment, while asterisk: ns (not significant) P > 0.05; *P ≤ 0.05; **P ≤ 0.01; ***P ≤ 0.001; ****P ≤ 0.0001 (according to GraphPad prism 9). μM: micromolar. (B) Effects of doxorubicin alone and in combination with MAO-A inhibitor clorgyline treatment in HCT116, Caco2, SW620, and HT-29 colorectal cancer cells. The data shown represent mean percentages of cell viability ± SD. Each experiment was performed in duplicate in three independent trials (n = 6). P-value < 0.05 expresses significantly different from respective doxorubicin treatment; asterisk: ns (not significant) P > 0.05; *P ≤ 0.05; **P ≤ 0.01; ***P ≤ 0.001; ****P ≤ 0.0001 (according to GraphPad prism 9). μM: micromolar.
Clorgyline’s micromolar GI50 is reported in the table as (mean ± SD). Experiments were conducted for treatment durations of 24, 48, and 72 h. All experiments were run in triplicate for at least three independent trials (n = 6). SD: standard deviation; h: hour.
3.3.2. Effects of MAO-A Inhibitor and Doxorubicin Combination on the Viability of CRC Cell Lines
The anticancer effects of combining MAO-A inhibitor clorgyline and doxorubicin on CRC cancer cell lines were determined by treating HCT116, Caco2, SW480, SW620, and HT-29 cells with doxorubicin and clorgyline at a combination ratio of 1:100 (doxorubicin: clorgyline) for 24, 48, and 72 h. Results shown in Figure 3B indicated that this combination significantly decreased cell survival (i.e., in terms of GI50 fold reduction) when compared with the respective doxorubicin single treatments. The combination doxorubicin-clorgyline has significantly reduced the GI50 of doxorubicin at 24 h for HCT116 (3.8 folds), Caco2 (110.4 folds), SW620 (8.5 folds), and HT29 (1.9-fold), as shown in Table 7. The combination index (CI) values for doxorubicin-clorgyline are listed in Table 8. Treatment with a combination of MAO-A inhibitor clorgyline with doxorubicin resulted in a synergistic effect (i.e., CI < 1) in all treated cell lines and at most tested times, as shown in Table 8.
Table 7. Micromolar (μM) GI50 Values for Doxorubicin Alone and in Combination with a MAO-A Inhibitor Clorgyline Treatment in Colorectal Cancer Cell Linesa.
| HCT116 |
Caco2 |
SW480 |
SW620 |
HT29 |
||||||
|---|---|---|---|---|---|---|---|---|---|---|
| time (h) | Doxo | Comb | Doxo | Comb | Doxo | Comb | Doxo | Comb | Doxo | Comb |
| 24 | 4.92 | 1.29 | 352.26 | 3.19 | NA | NA | 17.37 | 2.04 | 2.80 | 1.50 |
| 48 | 0.15 | 0.15 | 42.77 | 2.29 | NA | NA | 0.28 | 0.27 | 0.43 | 0.41 |
| 72 | 0.14 | 0.12 | 1.79 | 0.65 | NA | NA | 0.11 | 0.07 | 0.28 | 0.27 |
SD is not reported here since none exceeded 5%. h: hour; Doxo: doxorubicin; Comb: combination of doxorubicin and clorgyline [1:100] GI50 (μM).
Table 8. Combination Indices for Doxorubicin and MAO-A Inhibitor Clorgyline in CRC Cell Linesa.
| time (h) | HCT116 | Caco2 | SW620 | HT29 |
|---|---|---|---|---|
| 24 | 0.73 | 0.86 | 0.80 | 0.94 |
| 48 | 0.94 | 0.51 | 0.98 | 0.91 |
| 72 | 0.89 | 0.68 | 0.67 | 1.05 |
The data shown represent the combination index for different colorectal cancer cell lines and their respective mean ± SD. Cells were cultured and allowed to attach overnight. The next day, cells were treated with different concentrations of Doxorubicin alone and in combination with clorgyline at a constant combination ratio (1:100) for 24, 48, and 72 h. After that, the cell viability was determined using the MTT assay. All experiments were performed in duplicates, in three independent trials (n = 6). h: hour.
3.3.3. Effects of MAO-A Inhibition on the Migration of CRC Cell Lines
To assess the effects of MAO-A inhibition on the 2D migration of CRC cell lines, a wound healing assay was conducted using sub-GI50 clorgyline treatments on HCT116 and HT29 cells, which showed the best combination indices at all three tested times (24, 48, and 72 h). Complete or almost complete closure of wounds (i.e., total or partial closure) in the untreated samples was observed after 24 h as shown in Figure 4A. In contrast, clorgyline treatment for 24 h led to inhibition of cell migration. Treatment with clorgyline resulted in approximately 70% inhibition of wound closure at sub-GI50 concentrations for both cell lines used (HCT116 and HT29), as shown in Figure 4B.
Figure 4.
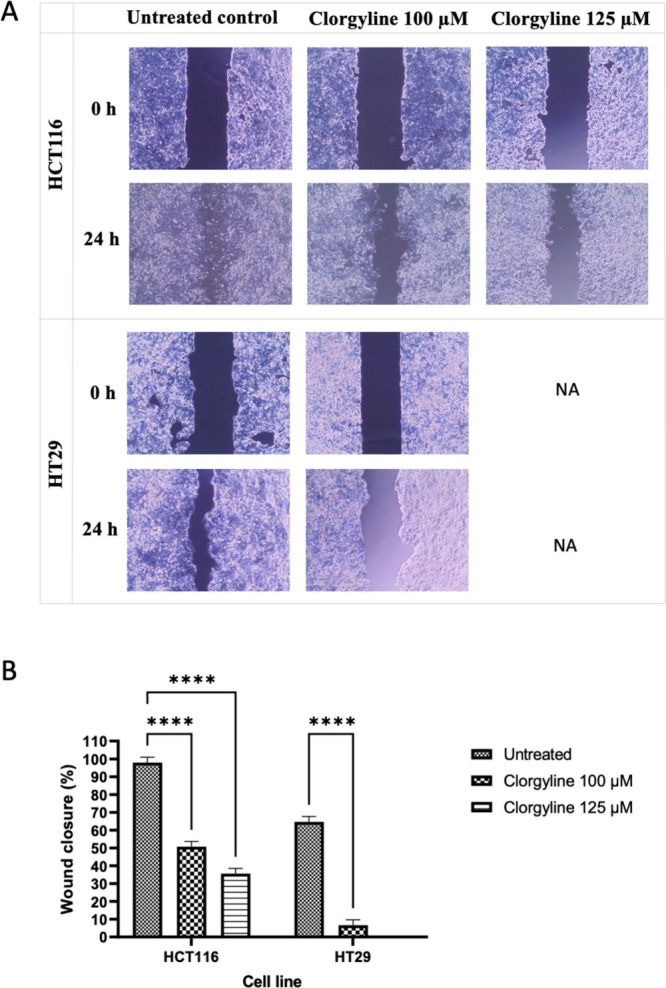
Effects of MAO-A inhibitor clorgyline on cellular migration of HCT116 and HT29. (A) Wound pictures at 0 time and 24 h post-treatment captured at 10× magnification using EVOS XL Core imaging system. NA: not applicable; h: hour; μM: micromolar. (B) Quantitative comparison of HCT116 and HT29 cells. Each experiment was performed in duplicate in three independent trials (n = 6). P-value < 0.05 express significantly different from respective untreated condition; while asterisk: ns (not significant) P > 0.05; *P ≤ 0.05; **P ≤ 0.01; ***P ≤ 0.001; ****P ≤ 0.0001 (according to GraphPad prism 9). μM: micromolar.
3.3.4. Effects of MAO-A Inhibition on Apoptosis of CRC Cell Lines
The annexin V-FITC/PI double staining assay was performed to examine whether the cellular viability effects of clorgyline were mediated through apoptosis and/or necrosis. Our results indicated that treatment of HCT116 and Caco2 cells with clorgyline at double GI50 concentrations led to a significant increase in early (Q4) and late (Q2) apoptosis in CRC cell lines as indicated by the Q2 + Q4 regions of the dot plots shown in Figure 5A. Clorgyline had significantly induced apoptosis in HCT116 (52.9%) and Caco2 (55%) cells compared to untreated controls of both cell lines (7.8% and 4.2%), respectively. A quantitative comparison of each cell phase (healthy, apoptotic, and necrotic) was performed and is shown in Figure 5B.
Figure 5.

Apoptotic and necrotic effects of clorgyline on HCT116 and Caco2. (A) Dot plot for annexin V-FITC/PI staining expressing the effect of MAO-A inhibitor, clorgyline 400 μM for 24 h (double GI50) treatment on apoptosis of colorectal cancer cell lines, HCT116 and Caco2. Q3 shows healthy viable cells, Q1 necrotic cells, Q2 late apoptotic, and Q4 early apoptotic cells. The experiment was performed in duplicate and repeated in two independent trials (n = 4). h: hour; μM: micromolar. (B) Percentages of healthy, apoptotic, and necrotic cells expressed as mean ± SD expressing the effect of MAO-A inhibitor, clorgyline 400 μM for 24 h (double GI50) treatment on apoptosis of colorectal cancer cell lines, HCT116 and Caco2. The experiment was performed in duplicate and repeated in two independent trials (n = 4). P-value < 0.05 express significantly different from respective untreated cells’ status; while asterisk: ns (not-significant) P > 0.05; *P ≤ 0.05; **P ≤ 0.01; ***P ≤ 0.001; ****P ≤ 0.0001 (according to GraphPad prism 9).
3.3.7. Clorgyline’s Effects on Gene Expression in CRC Cell Lines
The gene expression levels of MAO-A, Bcl-2, and VEGF (i.e., the most sensitive cell line after 48 h) were determined using qPCR in HCT116 and fibroblasts (i.e., control) with and without MAO-A inhibitor treatment. Our results indicated that MAO-A, Bcl-2, and VEGF were overexpressed in HCT116 relative to fibroblasts as shown in Figure 6A,B corresponding to untreated cells and clorgyline-treated, respectively. Sub-GI50 concentrations of clorgyline were used to determine the changes in gene expression in clorgyline-treated HCT116 cells, at 24 and 48 h, in comparison to untreated HCT116. Figure 6B shows that clorgyline treatment resulted in slightly increased RNA levels of MAO-A and VEGF over time, while the expression level of Bcl-2 was reduced.
Figure 6.

(A) Baseline gene expression variation between HCT116 colorectal cancer cell line and normal human dermal fibroblast cell line. MAOA: gene for monoamine oxidase-A enzyme; Bcl-2: gene for Bcl-2; VEGF: gene for Vascular endothelial growth factor. Fold difference was expressed as mean ± SD and was measured using ΔΔ the Ct method explained in eq 3. All experiments were run in duplicates and with two independent experiments. P-value <0.05 express significantly different from respective normal cells’ status; while asterisk: ns (not-significant) P > 0.05; *P ≤ 0.05; **P ≤ 0.01; ***P ≤ 0.001; ****P ≤ 0.0001 (according to GraphPad prism 9). (B) Effect of MAO-A inhibitor, Clorgyline, on multiple RNA expression of specific genes in the HCT116 colorectal cancer cell line. MAOA: the gene for monoamine oxidase-A enzyme; Bcl-2: the gene for Bcl-2; VEGF: the gene for Vascular endothelial growth factor; Fold difference expressed as mean ± SD and was measured using ΔΔCt method explained in eq 3. All experiments were run in duplicates and with two independent experiments. P-value <0.05 express significantly different from respective untreated cells’ status; while asterisk: ns (not-significant) P > 0.05; *P ≤ 0.05; **P ≤ 0.01; ***P ≤ 0.001; ****P ≤ 0.0001 (according to GraphPad prism 9). h: hour; μM: micromolar.
4. Discussion
The integration of computational results has brought to light several biological processes and pathways implicated in the mechanism of action of MAO-A inhibitors in cancer. An informatics approach centered on ligands, employing CMap, causal reasoning, and pathway enrichments, emphasized apoptosis and other cancer pathways. The top 10 CMap positive compound connections with clorgyline’s GS primarily comprised apoptosis stimulators, underscoring the significance of apoptosis in the analysis. Upstream causal reasoning hubs, for clorgyline’s GS, highlighted important proteins and microRNAs involved in cancer progression with validated roles in colorectal cancers. Downstream analysis results indicated that clorgyline’s GS is enriched in several cancer pathways including microRNAs in colorectal cancer, WNT signaling, DNA damage, and TGF-beta.
Furthermore, a protein/gene-based informatics approach focusing on the MAO-A nearest-neighbor protein–protein interactions network highlighted MAPK, TNF, IL-17, cMAP, and RAS signaling pathways. Additionally, proteoglycans in cancer were highlighted in this analysis. The integration of these computational results pointed to an anticancer therapeutic potential of MAO-A inhibition using small molecule inhibitors such as clorgyline.
Few reports have demonstrated the overexpression of MAO-A in cancer. Herein, we report an increased relative expression of MAO-A isoenzyme in the human CRC cell line, HCT116, compared to that of normal dermal fibroblasts. About a 3-fold increased expression was detected using RT-PCR in the HCT116 cell line. Our experimental results validated the predicted antiproliferative and apoptotic activities of clorgyline in colorectal cancer cell lines (HCT116, Caco2, SW480, SW620, and HT-29). Treatment of CRC cell lines with the MAO-A inhibitor clorgyline inhibited the growth of colorectal cancer cell lines in a time- and concentration-dependent manner in comparison to untreated cells. Furthermore, our results indicated that HCT116 cells exhibited the highest responsiveness to clorgyline among all tested CRC cell lines, while Caco2 cells were the least responsive.
The results have also demonstrated synergistic effects for the combination of MAO-A inhibitor clorgyline with doxorubicin in most cell lines. Doxorubicin is a cytotoxic drug that acts primarily through the inhibition of topoisomerase II and the generation of free radicals. Despite its limited use in colorectal cancer (CRC) treatments, due to reduced organ selectivity and/or increased tumor resistance,79 doxorubicin remains a universally effective chemotherapeutic agent, extensively employed across various cancers, including lung, multiple myeloma, and thyroid cancers. Herein, we highlighted the advantage of combining MAO-A inhibitor with doxorubicin by amplifying the antiproliferative effects, thus enabling the administration of lower drug doses while preserving or enhancing therapeutic effectiveness. The combination index for clorgyline-doxorubicin, despite being majorly synergistic, fluctuated and was dependent on treatment duration, cell line type, combination ratio, and concentration range. These results suggest that the effects of combining MAO-A inhibitors with other anticancer drugs such as doxorubicin could be variable and may be affected by the cancer microenvironment and the combined anticancer agents and their mechanisms of action and/or resistance.
Interestingly, the results of the two-dimension model (wound healing, or scratch assay demonstrated that clorgyline inhibits wound closure in HCT116, and HT29 cell lines at sub-GI50 concentrations due to inhibiting cell migration. In HCT116 cells, clorgyline exhibited a pronounced antimigratory effect, indicating a probable concentration dependence, as evidenced by noticeable differences in migration inhibition between treatments of 100 μM and 125 μM under identical conditions. Interestingly, our antimigratory results of clorgyline against HCT116 cells are consistent with other cancer types previously reported such as the study of Satram-Maharaj, T. et al. using MDA-MB-231 breast cancer cell line revealing how Clorgyline could inhibit the cancer cell proliferation and growth in anchorage-independent.27
In contrast, clorgyline has significantly induced apoptosis in HCT116, and Caco2 CRC cell lines when compared with the respective untreated control cells, whereas necrosis was not affected. This result validated the computational hypothesis regarding the apoptotic effects of clorgyline.
The Wnt/β-catenin pathway can upregulate Bcl-2 expression by stabilizing β-catenin, which then translocates to the nucleus and acts as a transcriptional coactivator for TCF/LEF transcription factors that promote Bcl-2 gene expression.80 In addition, β-catenin, when stabilized and translocated to the nucleus, can also promote VEGF expression by binding to the promoter regions of VEGF genes. This contributes to angiogenesis, a key process in tumor growth and metastasis.81 On the other hand, activation of RTK leads to downstream signaling through the RAS-RAF-MEK-ERK pathway, which can enhance the transcription of Bcl-2 and VEGF. Additionally, the PI3K-Akt pathway, activated by RTKs, promotes Bcl-2 expression, by inhibiting pro-apoptotic factors and supporting cell survival, and increases VEGF expression by promoting the transcription and stability of HIF-1α, a key regulator of VEGF under hypoxic conditions.82,83
This study involved an evaluation of the concentration- and time-dependent effects of the MAO-A inhibitor, clorgyline, on the expression of MAOA, Bcl-2, and VEGF genes using the HCT116 cell line. Clorgyline did not significantly affect MAOA gene expression at sub-GI50 concentrations for both 24 and 48 h; however, a slight increase in MAOA expression was noted after 48 h of treatment, possibly due to positive feedback resulting from the irreversible inhibition of MAO-A enzyme activity by clorgyline. Additionally, there was a significant increase in VEGF gene expression over time, likely associated with the hypoxic stress environment of the cells and their stimulation of angiogenesis.84,85 This finding is consistent with a previous study where clorgyline-mediated suppression of MAO-A promoted tumor angiogenesis and invasion in a hypoxic breast cancer environment.86
The Bcl-2 gene, widely recognized as a key regulator of apoptosis, exhibited a consistent decrease in gene expression over time following exposure to sub-GI50 concentrations of clorgyline for 24 and 48 h. This decline in Bcl-2 expression aligns with its established role as an antiapoptotic oncogene, acting through various mechanisms.87,88 On the other hand, increased expression of the VEGF gene was observed over time following exposure to sub-GI50 concentrations of clorgyline for 24 and 48 h. Further experimentation is warranted to understand the role of MAO-A inhibition in the regulation of VGEF expression in cancer.
5. Conclusions
This study applied an integrative informatics approach to prioritize a high-confidence hypothesis regarding the anticancer effects of MAO-A inhibition using the small molecule inhibitor clorgyline through inducing apoptosis in CRC cell lines. Our computational findings were then validated by in vitro experimental assays, which revealed the antiproliferative and antimigratory activities in addition to synergistic effects with other anticancer agents such as doxorubicin. Experimental validation results also revealed that clorgyline is an apoptosis inducer; pointing to a putative role of MAO-A inhibitors in commencing human colorectal cancer death by potentially mediating the induction of apoptosis, tumor hypoxia, and oxidative stress. Additionally, this study provides robust evidence of several relative gene expressions in human colorectal cancer compared with normal cells. Remarkably, this study offers compelling and consistent evidence highlighting the time-, concentration-, and cell-line-dependent activity of MAO-A inhibitors in colorectal cancer.
Acknowledgments
We gratefully acknowledge the L’Oréal-UNESCO For Women in Science Fellowship granted to S.B. in 2023, which provided crucial support for this research.
Supporting Information Available
The Supporting Information is available free of charge at https://pubs.acs.org/doi/10.1021/acsomega.4c04100.
Clorgyline’s gene signature: Supplementary Table 1; Prediction of the upstream regulators including transcription factors, kinases, phosphatases, and microRNAs: Supplementary Table 2 (XLSX)
Author Contributions
Conceptualization: S.B. and R.H.; Data curation: H.A. and S.A.; Formal analysis: S.B. and H.A.; Funding acquisition: S.B. and R.H.; Investigation: H.A. and D.S.; Methodology: H.A. and D.S.; Project administration: S.B.; Resources: S.B., D.S., and R.H.; Software: R.H.; Supervision: S.B.; Validation: S.B.; Writing - review and editing: S.B., R.H., D.S., S.A.
This work was supported by a grant from the Deanship of Scientific Research at the University of Jordan Grant Number 2566. The computational studies were supported by a grant from the Deanship of Scientific Research at Al-Zaytoonah University of Jordan (Grant Number 2023-2022/17/50).
The authors declare no competing financial interest.
Supplementary Material
References
- International, W. C. R. F. Colorectal cancer statistics. 2022. (accessed 20–03–2024); Available from https://www.wcrf.org/cancer-trends/colorectal-cancer-statistics/.
- Siegel R. L.; et al. Colorectal cancer in the young: epidemiology, prevention, management. Am Soc Clin Oncol Educ Book 2020, 40, e75–e88. 10.1200/EDBK_279901. [DOI] [PubMed] [Google Scholar]
- Datta C.; Dhabal S.; Bhattacharjee A.. Monoamine Oxidase A (MAO-A): A Therapeutic Target in Lung Cancer. Oxidoreductase; IntechOpen, 2021. [Google Scholar]
- Garpenstrand H.; et al. Platelet monoamine oxidase activity is related to MAOB intron 13 genotype. J. Neural Transm (Vienna) 2000, 107 (5), 523–30. 10.1007/s007020070075. [DOI] [PubMed] [Google Scholar]
- Kochersperger L. M.; et al. Assignment of genes for human monoamine oxidases A and B to the X chromosome. J. Neurosci Res. 1986, 16 (4), 601–16. 10.1002/jnr.490160403. [DOI] [PubMed] [Google Scholar]
- Walker W. H.; et al. The Covalently-Bound Flavin of Hepatic Monoamine Oxidase: 2. Identification and Properties of Cysteinyl Riboflavin. European journal of biochemistry 1971, 24 (2), 328–331. 10.1111/j.1432-1033.1971.tb19690.x. [DOI] [PubMed] [Google Scholar]
- Billett E. E. Monoamine oxidase (MAO) in human peripheral tissues. Neurotoxicology (Park Forest South) 2004, 25 (1–2), 139–148. 10.1016/S0161-813X(03)00094-9. [DOI] [PubMed] [Google Scholar]
- Ramsay R. R. Monoamine oxidases: the biochemistry of the proteins as targets in medicinal chemistry and drug discovery. Curr. Top Med. Chem. 2012, 12 (20), 2189–2209. 10.2174/156802612805219978. [DOI] [PubMed] [Google Scholar]
- Marti J. S.; et al. Molecular neuroanatomy of MAO-A and MAO-B. Amine Oxidases and Their Impact on Neurobiology; Springer; 1990, pp 49–53. [Google Scholar]
- Shulman K. I.; Herrmann N.; Walker S. E. Current place of monoamine oxidase inhibitors in the treatment of depression. CNS drugs 2013, 27 (10), 789–797. 10.1007/s40263-013-0097-3. [DOI] [PubMed] [Google Scholar]
- Campbell I. C.; et al. Localization of monoamine oxidases A and B in primate brains relative to neuron-specific and non-neuronal enolases. Neurochem. Res. 1982, 7 (6), 657–666. 10.1007/BF00965519. [DOI] [PubMed] [Google Scholar]
- Song M.-S.; et al. An update on amine oxidase inhibitors: multifaceted drugs. Progress in neuro-psychopharmacology and biological psychiatry 2013, 44, 118–124. 10.1016/j.pnpbp.2013.02.001. [DOI] [PubMed] [Google Scholar]
- Kaludercic N.; et al. Monoamine oxidases as sources of oxidants in the heart. Journal of molecular and cellular cardiology 2014, 73, 34–42. 10.1016/j.yjmcc.2013.12.032. [DOI] [PMC free article] [PubMed] [Google Scholar]
- Deshwal S.; et al. Emerging role of monoamine oxidase as a therapeutic target for cardiovascular disease. Current opinion in pharmacology 2017, 33, 64–69. 10.1016/j.coph.2017.04.003. [DOI] [PubMed] [Google Scholar]
- Camell C. D.; et al. Inflammasome-driven catecholamine catabolism in macrophages blunts lipolysis during ageing. Nature 2017, 550 (7674), 119. 10.1038/nature24022. [DOI] [PMC free article] [PubMed] [Google Scholar]
- Wu J. B.; et al. Monoamine oxidase A mediates prostate tumorigenesis and cancer metastasis. J. Clin. Invest. 2014, 124 (7), 2891–2908. 10.1172/JCI70982. [DOI] [PMC free article] [PubMed] [Google Scholar]
- Liao C.-P.; et al. Loss of MAOA in epithelia inhibits adenocarcinoma development, cell proliferation and cancer stem cells in prostate. Oncogene 2018, 37 (38), 5175. 10.1038/s41388-018-0325-x. [DOI] [PMC free article] [PubMed] [Google Scholar]
- Liu F.; et al. Increased expression of monoamine oxidase A is associated with epithelial to mesenchymal transition and clinicopathological features in non-small cell lung cancer. Oncology letters 2018, 15 (3), 3245–3251. 10.3892/ol.2017.7683. [DOI] [PMC free article] [PubMed] [Google Scholar]
- Ugun-Klusek A.; et al. Monoamine oxidase-A promotes protective autophagy in human SH-SY5Y neuroblastoma cells through Bcl-2 phosphorylation. Redox Biology 2019, 20, 167–181. 10.1016/j.redox.2018.10.003. [DOI] [PMC free article] [PubMed] [Google Scholar]
- Biswas P.; et al. Fatty acids and their lipid mediators in the induction of cellular apoptosis in cancer cells. Prostaglandins & Other Lipid Mediators 2022, 160, 106637 10.1016/j.prostaglandins.2022.106637. [DOI] [PubMed] [Google Scholar]
- Biswas P.; et al. IL-13 and the hydroperoxy fatty acid 13 (S) HpODE play crucial role in inducing an apoptotic pathway in cancer cells involving MAO-A/ROS/p53/p21 signaling axis. Free Radical Biol. Med. 2023, 195, 309–328. 10.1016/j.freeradbiomed.2022.12.103. [DOI] [PubMed] [Google Scholar]
- Ayoup M. S.; et al. Halting colorectal cancer metastasis via novel dual nanomolar MMP-9/MAO-A quinoxaline-based inhibitors; design, synthesis, and evaluation. Eur. J. Med. Chem. 2021, 222, 113558 10.1016/j.ejmech.2021.113558. [DOI] [PubMed] [Google Scholar]
- Martini H.; Passos J. F. Cellular senescence: all roads lead to mitochondria. FEBS Journal 2023, 290 (5), 1186–1202. 10.1111/febs.16361. [DOI] [PMC free article] [PubMed] [Google Scholar]
- Lin Y.-C.; et al. MAOA-a novel decision maker of apoptosis and autophagy in hormone refractory neuroendocrine prostate cancer cells. Sci. Rep. 2017, 7, 46338. 10.1038/srep46338. [DOI] [PMC free article] [PubMed] [Google Scholar]
- Zhao H.; et al. Inhibition of monoamine oxidase A promotes secretory differentiation in basal prostatic epithelial cells. Differentiation 2008, 76 (7), 820–830. 10.1111/j.1432-0436.2007.00263.x. [DOI] [PMC free article] [PubMed] [Google Scholar]
- Shih J. C. Monoamine oxidase isoenzymes: genes, functions and targets for behavior and cancer therapy. Journal of Neural Transmission 2018, 125 (11), 1553–1566. 10.1007/s00702-018-1927-8. [DOI] [PMC free article] [PubMed] [Google Scholar]
- Satram-Maharaj T.; et al. The monoamine oxidase-A inhibitor clorgyline promotes a mesenchymal-to-epithelial transition in the MDA-MB-231 breast cancer cell line. Cellular signalling 2014, 26 (12), 2621–2632. 10.1016/j.cellsig.2014.08.005. [DOI] [PubMed] [Google Scholar]
- Li P. C.; et al. Monoamine oxidase A is highly expressed in classical Hodgkin lymphoma. Journal of pathology 2017, 243 (2), 220–229. 10.1002/path.4944. [DOI] [PMC free article] [PubMed] [Google Scholar]
- Hajjo R.; et al. Chemocentric informatics approach to drug discovery: identification and experimental validation of selective estrogen receptor modulators as ligands of 5-hydroxytryptamine-6 receptors and as potential cognition enhancers. Journal of medicinal chemistry 2012, 55 (12), 5704–5719. 10.1021/jm2011657. [DOI] [PMC free article] [PubMed] [Google Scholar]
- Hajjo R.; Sabbah D. A.; Bardaweel S. K. Chemocentric informatics analysis: Dexamethasone versus combination therapy for COVID-19. ACS omega 2020, 5 (46), 29765–29779. 10.1021/acsomega.0c03597. [DOI] [PMC free article] [PubMed] [Google Scholar]
- Hajjo R.; Sabbah D. A.; Tropsha A. Analyzing the systems biology effects of COVID-19 mRNA vaccines to assess their safety and putative side effects. Pathogens 2022, 11 (7), 743. 10.3390/pathogens11070743. [DOI] [PMC free article] [PubMed] [Google Scholar]
- Hajjo R.; Tropsha A. A Systems Biology Workflow for Drug and Vaccine Repurposing: Identifying Small-molecule BCG Mimics to Prevent COVID-19 Mortality. Pharm. Res. 2020, 37, 212. 10.1007/s11095-020-02930-9. [DOI] [PMC free article] [PubMed] [Google Scholar]
- Zhao H.; Flamand V.; Peehl D. M. Anti-oncogenic and pro-differentiation effects of clorgyline, a monoamine oxidase A inhibitor, on high grade prostate cancer cells. BMC medical genomics 2009, 2, 1–15. 10.1186/1755-8794-2-55. [DOI] [PMC free article] [PubMed] [Google Scholar]
- Edgar R.; Domrachev M.; Lash A. E. Gene Expression Omnibus: NCBI gene expression and hybridization array data repository. Nucleic acids research 2002, 30 (1), 207–210. 10.1093/nar/30.1.207. [DOI] [PMC free article] [PubMed] [Google Scholar]
- Subramanian A.; et al. A next generation connectivity map: L1000 platform and the first 1,000,000 profiles. Cell 2017, 171 (6), 1437–1452. 10.1016/j.cell.2017.10.049. [DOI] [PMC free article] [PubMed] [Google Scholar]
- Website accessed 08–03–2024; Available from: https://apps.clarivate.com/kpa/login.
- Chindelevitch L.; et al. Causal reasoning on biological networks: interpreting transcriptional changes. Bioinformatics 2012, 28 (8), 1114–1121. 10.1093/bioinformatics/bts090. [DOI] [PubMed] [Google Scholar]
- Hajjo R.; et al. Identifying a causal link between prolactin signaling pathways and COVID-19 vaccine-induced menstrual changes. npj Vaccines 2023, 8 (1), 129. 10.1038/s41541-023-00719-6. [DOI] [PMC free article] [PubMed] [Google Scholar]
- Tarca A. L.; et al. A novel signaling pathway impact analysis. Bioinformatics 2009, 25 (1), 75–82. 10.1093/bioinformatics/btn577. [DOI] [PMC free article] [PubMed] [Google Scholar]
- Shannon P.; et al. Cytoscape: a software environment for integrated models of biomolecular interaction networks. Genome research 2003, 13 (11), 2498–2504. 10.1101/gr.1239303. [DOI] [PMC free article] [PubMed] [Google Scholar]
- Franceschini A.; et al. STRING v9. 1: protein-protein interaction networks, with increased coverage and integration. Nucleic acids research 2012, 41 (D1), D808–D815. 10.1093/nar/gks1094. [DOI] [PMC free article] [PubMed] [Google Scholar]
- Bardaweel S. K.; Tawaha K. A.; Hudaib M. M. Antioxidant, antimicrobial and antiproliferative activities of Anthemis palestina essential oil. BMC complementary and alternative medicine 2014, 14 (1), 297. 10.1186/1472-6882-14-297. [DOI] [PMC free article] [PubMed] [Google Scholar]
- Rasband W. S.ImageJ. 1997, Bethesda, MD.
- Livak K. J.; Schmittgen T. D. Analysis of relative gene expression data using real-time quantitative PCR and the 2– ΔΔCT method. methods 2001, 25 (4), 402–408. 10.1006/meth.2001.1262. [DOI] [PubMed] [Google Scholar]
- Tanaka H.; et al. Calyculin A induces apoptosis and stimulates phosphorylation of p65NF-kappaB in human osteoblastic osteosarcoma MG63 cells. Int. J. Oncol. 2007, 31 (2), 389–96. 10.3892/ijo.31.2.389. [DOI] [PubMed] [Google Scholar]
- Furuya S.; et al. Calyculin A, protein phosphatase inhibitor, enhances capacitation of human sperm. Fertil. Steril. 1993, 59 (1), 216–22. 10.1016/S0015-0282(16)55642-8. [DOI] [PubMed] [Google Scholar]
- Martina M.; et al. Zinc modulation of bicuculline-sensitive and -insensitive GABA receptors in the developing rat hippocampus. Eur. J. Neurosci 1996, 8 (10), 2168–76. 10.1111/j.1460-9568.1996.tb00738.x. [DOI] [PubMed] [Google Scholar]
- Bello N. T.; et al. High-fat diet-induced alterations in the feeding suppression of low-dose nisoxetine, a selective norepinephrine reuptake inhibitor. J. Obes. 2013, 2013, 1 10.1155/2013/457047. [DOI] [PMC free article] [PubMed] [Google Scholar]
- Lakatos P.; et al. The PARP inhibitor PJ-34 sensitizes cells to UVA-induced phototoxicity by a PARP independent mechanism. Mutat. Res. 2016, 790, 31–40. 10.1016/j.mrfmmm.2016.07.001. [DOI] [PubMed] [Google Scholar]
- Bai X. T.; et al. Small PARP inhibitor PJ-34 induces cell cycle arrest and apoptosis of adult T-cell leukemia cells. J. Hematol. Oncol. 2015, 8, 117. 10.1186/s13045-015-0217-2. [DOI] [PMC free article] [PubMed] [Google Scholar]
- Champney W. S.; Burdine R. Azithromycin and clarithromycin inhibition of 50S ribosomal subunit formation in Staphylococcus aureus cells. Curr. Microbiol. 1998, 36 (2), 119–23. 10.1007/s002849900290. [DOI] [PubMed] [Google Scholar]
- Hodge S.; et al. Azithromycin increases phagocytosis of apoptotic bronchial epithelial cells by alveolar macrophages. Eur. Respir. J. 2006, 28 (3), 486–95. 10.1183/09031936.06.00001506. [DOI] [PubMed] [Google Scholar]
- Abernethy W. B.; et al. Calcium entry attenuates adenylyl cyclase activity. A possible mechanism for calcium-induced catecholamine resistance. Chest 1995, 107 (5), 1420–5. 10.1378/chest.107.5.1420. [DOI] [PubMed] [Google Scholar]
- Aedo S. J.; Orman M. A.; Brynildsen M. P. Stationary phase persister formation in Escherichia coli can be suppressed by piperacillin and PBP3 inhibition. BMC Microbiol. 2019, 19 (1), 140. 10.1186/s12866-019-1506-7. [DOI] [PMC free article] [PubMed] [Google Scholar]
- Jiang S.; et al. Antibiotic drug piperacillin induces neuron cell death through mitochondrial dysfunction and oxidative damage. Can. J. Physiol. Pharmacol. 2018, 96 (6), 562–568. 10.1139/cjpp-2016-0679. [DOI] [PubMed] [Google Scholar]
- Oliveira R. S.; et al. Chemical and Pharmacological Screening of Rhinella icterica (Spix 1824) Toad Parotoid Secretion in Avian Preparations. Toxins (Basel) 2020, 12 (6), 396. 10.3390/toxins12060396. [DOI] [PMC free article] [PubMed] [Google Scholar]
- Reddy D.; et al. Anticancer and Antiviral Properties of Cardiac Glycosides: A Review to Explore the Mechanism of Actions. Molecules 2020, 25 (16), 3596. 10.3390/molecules25163596. [DOI] [PMC free article] [PubMed] [Google Scholar]
- Epe B.; Woolley P. The binding of 6-demethylchlortetracycline to 70S, 50S and 30S ribosomal particles: a quantitative study by fluorescence anisotropy. EMBO J. 1984, 3 (1), 121–126. 10.1002/j.1460-2075.1984.tb01771.x. [DOI] [PMC free article] [PubMed] [Google Scholar]
- Lefranc F.; et al. Narciclasine, a plant growth modulator, activates Rho and stress fibers in glioblastoma cells. Mol. Cancer Ther. 2009, 8 (7), 1739–1750. 10.1158/1535-7163.MCT-08-0932. [DOI] [PubMed] [Google Scholar]
- Yuan Y.; et al. Narciclasine induces autophagy-mediated apoptosis in gastric cancer cells through the Akt/mTOR signaling pathway. BMC Pharmacol. Toxicol. 2021, 22 (1), 1–11. 10.1186/s40360-021-00537-3. [DOI] [PMC free article] [PubMed] [Google Scholar]
- Ide T.; et al. GAMT, a p53-inducible modulator of apoptosis, is critical for the adaptive response to nutrient stress. Mol. Cell 2009, 36 (3), 379–92. 10.1016/j.molcel.2009.09.031. [DOI] [PMC free article] [PubMed] [Google Scholar] [Retracted]
- Roy N.; et al. PDX1 dynamically regulates pancreatic ductal adenocarcinoma initiation and maintenance. Genes Dev. 2016, 30 (24), 2669–2683. 10.1101/gad.291021.116. [DOI] [PMC free article] [PubMed] [Google Scholar]
- Keulers T. G.; et al. ATG12 deficiency results in intracellular glutamine depletion, abrogation of tumor hypoxia and a favorable prognosis in cancer. Autophagy 2022, 18 (8), 1898–1914. 10.1080/15548627.2021.2008690. [DOI] [PMC free article] [PubMed] [Google Scholar]
- Yang H. C.; et al. The Redox Role of G6PD in Cell Growth, Cell Death, and Cancer. Cells 2019, 8 (9), 1055. 10.3390/cells8091055. [DOI] [PMC free article] [PubMed] [Google Scholar]
- Elias D.; Ditzel H. J. Fyn is an important molecule in cancer pathogenesis and drug resistance. Pharmacol. Res. 2015, 100, 250–4. 10.1016/j.phrs.2015.08.010. [DOI] [PubMed] [Google Scholar]
- Chen R.; et al. Annexin-1 is an oncogene in glioblastoma and causes tumour immune escape through the indirect upregulation of interleukin-8. J. Cell. Mol. Med., 2022, 26 (15), 4343–4356. 10.1111/jcmm.17458. [DOI] [PMC free article] [PubMed] [Google Scholar]
- Li Z.; et al. NRBP2 Functions as a Tumor Suppressor and Inhibits Epithelial-to-Mesenchymal Transition in Breast Cancer. Front. Oncol. 2021, 11, 634026 10.3389/fonc.2021.634026. [DOI] [PMC free article] [PubMed] [Google Scholar]
- Zhu R.; et al. TSPAN8 promotes cancer cell stemness via activation of sonic Hedgehog signaling. Nat. Commun. 2019, 10 (1), 2863. 10.1038/s41467-019-10739-3. [DOI] [PMC free article] [PubMed] [Google Scholar]
- Hryniuk A.; et al. Cdx1 and Cdx2 function as tumor suppressors. J. Biol. Chem. 2014, 289 (48), 33343–54. 10.1074/jbc.M114.583823. [DOI] [PMC free article] [PubMed] [Google Scholar]
- Shi L.; et al. Clinical and Therapeutic Implications of Follistatin in Solid Tumours. Cancer Genomics Proteomics 2016, 13 (6), 425–435. 10.21873/cgp.20005. [DOI] [PMC free article] [PubMed] [Google Scholar]
- Song J.; et al. The deubiquitinase OTUD1 enhances iron transport and potentiates host antitumor immunity. EMBO reports 2021, 22 (2), e51162 10.15252/embr.202051162. [DOI] [PMC free article] [PubMed] [Google Scholar]
- Zhou J.; et al. Knockdown of long noncoding RNA GHET1 inhibits cell proliferation and invasion of colorectal cancer. Oncology research 2016, 23 (6), 303. 10.3727/096504016X14567549091305. [DOI] [PMC free article] [PubMed] [Google Scholar]
- Gao Z.; et al. miR-24–3p promotes colon cancer progression by targeting ING1. Signal transduction and targeted therapy 2020, 5 (1), 171. 10.1038/s41392-020-0206-y. [DOI] [PMC free article] [PubMed] [Google Scholar]
- Wei F.; et al. Ring finger protein 2 promotes colorectal cancer progression by suppressing early growth response 1. Aging (Albany NY) 2020, 12 (24), 26199. 10.18632/aging.202396. [DOI] [PMC free article] [PubMed] [Google Scholar]
- Peng P. LncRNA PSMA3-AS1 promotes colorectal cancer cell migration and invasion via regulating miR-4429. European Review for Medical & Pharmacological Sciences 2020, 24 (22), na. [DOI] [PubMed] [Google Scholar]
- Ji Q.; et al. MALAT1 regulates the transcriptional and translational levels of proto-oncogene RUNX2 in colorectal cancer metastasis. Cell death & disease 2019, 10 (6), 378. 10.1038/s41419-019-1598-x. [DOI] [PMC free article] [PubMed] [Google Scholar] [Retracted]
- Wang N.; et al. STAT3 induces colorectal carcinoma progression through a novel miR-572-MOAP-1 pathway. OncoTargets and therapy 2018, Volume 11, 3475–3484. 10.2147/OTT.S158764. [DOI] [PMC free article] [PubMed] [Google Scholar]
- Gao J.; et al. Integrative analysis of complex cancer genomics and clinical profiles using the cBioPortal. Science signaling 2013, 6 (269), pl1–pl1. 10.1126/scisignal.2004088. [DOI] [PMC free article] [PubMed] [Google Scholar]
- Carvalho C.; et al. Doxorubicin: the good, the bad and the ugly effect. Curr. Med. Chem. 2009, 16 (25), 3267–3285. 10.2174/092986709788803312. [DOI] [PubMed] [Google Scholar]
- Clevers H. Wnt/β-catenin signaling in development and disease. Cell 2006, 127 (3), 469–480. 10.1016/j.cell.2006.10.018. [DOI] [PubMed] [Google Scholar]
- Polakis P. Wnt signaling in cancer. Cold Spring Harbor perspectives in biology 2012, 4 (5), a008052 10.1101/cshperspect.a008052. [DOI] [PMC free article] [PubMed] [Google Scholar]
- Semenza G. L. Targeting HIF-1 for cancer therapy. Nature reviews cancer 2003, 3 (10), 721–732. 10.1038/nrc1187. [DOI] [PubMed] [Google Scholar]
- Downward J. Targeting RAS signalling pathways in cancer therapy. Nature reviews cancer 2003, 3 (1), 11–22. 10.1038/nrc969. [DOI] [PubMed] [Google Scholar]
- Ferrara N. VEGF and the quest for tumour angiogenesis factors. Nature Reviews Cancer 2002, 2 (10), 795–803. 10.1038/nrc909. [DOI] [PubMed] [Google Scholar]
- Carmeliet P. VEGF as a key mediator of angiogenesis in cancer. Oncology 2005, 69 (Suppl. 3), 4–10. 10.1159/000088478. [DOI] [PubMed] [Google Scholar]
- Bharti R.; et al. Differential expression of IL-6/IL-6R and MAO-A regulates invasion/angiogenesis in breast cancer. British journal of cancer 2018, 118 (11), 1442–1452. 10.1038/s41416-018-0078-x. [DOI] [PMC free article] [PubMed] [Google Scholar]
- Jiang M.; Milner J. Bcl-2 constitutively suppresses p53-dependent apoptosis in colorectal cancer cells. Genes & development 2003, 17 (7), 832–837. 10.1101/gad.252603. [DOI] [PMC free article] [PubMed] [Google Scholar]
- Tzifi F.; et al. The role of BCL2 family of apoptosis regulator proteins in acute and chronic leukemias. Advances in hematology 2012, 2012, 1. 10.1155/2012/524308. [DOI] [PMC free article] [PubMed] [Google Scholar]
Associated Data
This section collects any data citations, data availability statements, or supplementary materials included in this article.