

SUMMARY
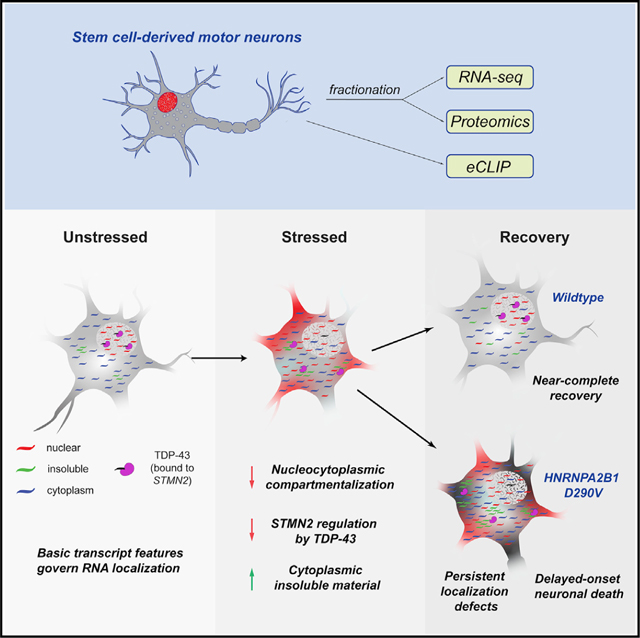
Persistent cytoplasmic aggregates containing RNA binding proteins (RBPs) are central to the pathogenesis of late-onset neurodegenerative disorders such as amyotrophic lateral sclerosis (ALS). These aggregates share components, molecular mechanisms, and cellular protein quality control pathways with stress-induced RNA granules (SGs). Here, we assess the impact of stress on the global mRNA localization landscape of human pluripotent stem cell-derived motor neurons (PSC-MNs) using subcellular fractionation with RNA sequencing and proteomics. Transient stress disrupts subcellular RNA and protein distributions, alters the RNA binding profile of SG- and ALS-relevant RBPs and recapitulates disease-associated molecular changes such as aberrant splicing of STMN2. Although neurotypical PSC-MNs re-establish a normal subcellular localization landscape upon recovery from stress, cells harboring ALS-linked mutations are intransigent and display a delayed-onset increase in neuronal cell death. Our results highlight subcellular molecular distributions as predictive features and underscore the utility of cellular stress as a paradigm to study ALS-relevant mechanisms.
In brief
Markmiller et al. show that transient stress disrupts subcellular RNA and protein distributions in stem cell-derived motor neurons, recapitulating ALS-associated changes. Neurotypical motor neurons recover subcellular patterns after stress. However, motor neurons harboring ALS-linked mutations exhibit persistent RNA localization changes and eventual cell death.
Graphical abstract
INTRODUCTION
Amyotrophic lateral sclerosis (ALS) primarily affects motor neurons, manifests late in life (Mejzini et al., 2019), and is almost universally fatal within 3–5 years of disease onset. No truly effective treatments currently exist. A deeper understanding of the molecular and cellular basis for the cell-type-selective vulnerability and the late-onset nature of the disease is crucial to devise effective therapies. Although modeling of ALS has been revolutionized by the ability to generate mostly pure motor neurons from pluripotent stem cells (PSCs) in a scalable manner (Chambers et al., 2009; Du et al., 2015), there is still a need to develop models that robustly recapitulate key features of the molecular and cellular phenotypes of the disease. In recent years, the study of cytoplasmic stress granules (SGs) has proved tremendously useful, because many ALS-linked mutations affect SG biology in various ways, such as SG dynamics (Boeynaems et al., 2017; Lee et al., 2016; Lin et al., 2016; Mackenzie et al., 2017; Martinez et al., 2016; Murakami et al., 2015; Patel et al., 2015), composition, and subcellular localization (Markmiller et al., 2018). In addition, cellular stress induces molecular phenotypes that are also observed in ALS mutant cells, including aberrant nucleocytoplasmic and axonal transport, both of which are increasingly implicated in ALS pathogenesis (Alami et al., 2014; Chou et al., 2018; Fallini et al., 2020; Zhang et al., 2015, 2018).
We recently demonstrated that transient, non-lethal cellular stress followed by a recovery period can induce the formation of persistent cytoplasmic TDP-43 aggregates in ALS patient-derived PSC-motor neurons (MNs) (Fang et al., 2019). These persistent aggregates do not contain canonical SG markers such as G3BP1 and do not frequently occur in unstressed PSC-MNs, demonstrating that transient stress can be used to robustly induce an aging-dependent phenotype in an ALS mutant-specific context. Here, we use the transient stress paradigm in combination with a global mRNA localization profiling approach to measure subcellular mRNA distribution landscapes across different cell types and in response to cellular stress in the absence or presence of ALS-associated mutations. We show that the global mRNA localization landscape is shaped by a set of cell-type-independent rules based on basic transcript architecture and sequence features and are profoundly disrupted by cellular stress. Remarkably, although stress-induced mRNA localization changes are transitory in wild-type PSC-MNs, HNRNPA2B1 mutant PSC-MNs retain a drastically reshaped mRNA localization profile and display elevated cell death 72 h post-stress, underscoring the value of the transient stress paradigm in eliciting robust, disease-relevant molecular and cellular phenotypes in iPSC models of ALS.
RESULTS
Defining the subcellular localization landscape of stem cell-derived motor neurons
Defects in nucleocytoplasmic transport and the accumulation of TDP-43 and other nuclear RBPs in cytoplasmic inclusions are both central hallmarks of ALS/FTD (Neumann et al., 2006) and the consequence of cellular stress (Hochberg-Laufer et al., 2019; Zhang et al., 2018). Despite the prominent RBP mislocalization in these settings, few systematic attempts have been made to characterize the impact of both stress and ALS-linked mutations on global RNA localization in disease-relevant cell types. To enable such insights, we adapted a subcellular fractionation and RNA sequencing approach (CeFra-seq) (Benoit Bouvrette et al., 2018; Lefebvre et al., 2017) and applied it to PSCs and selected PSC-MN lines generated by direct differentiation (Chambers et al., 2009; Du et al., 2015; Markmiller et al., 2018; Martinez et al., 2016) (Figure S1A). We generated duplicate sets of total input, nuclear, cytoplasmic, and insoluble fractions from three PSC and two PSC-MN lines that were differentiated independently in duplicate from motor neuron progenitors (MNPs) and extracted both RNA and protein for downstream analyses (Figure 1A). We confirmed efficient fractionation and reproducibility across cell types by analyzing the subcellular distribution of proteins and transcripts known to be enriched in specific fractions by western blot and qRT-PCR (Figures S1B and S1C). Next, we generated polyA-selected, strand-specific RNA sequencing (RNA-seq) libraries and sequenced these to ~18 million reads per library, of which 81% mapped uniquely to 28,000 genes. Principal component analysis (PCA) of gene expression values (reads per kilobase of transcript, per million mapped reads [RPKM]) of protein coding transcripts (19,221) revealed that samples were distinguished by cell type and subcellular fraction (Figure 1B).
Figure 1. ceFRA-seq defines mRNA localization in pluripotent stem cells (PSCs) and pluripotent stem cell-derived motor neurons (PSC-MNs).

(A) Schematic of the cell fractionation and sample generation protocol.
(B) Principal component analysis of ceFRA-seq data from PSCs and PSC-MNs.
(C) Triangle plots visualizing the relative expression level of individual transcripts across the cytoplasmic, nuclear and insoluble fractions. Transcripts highlighted in blue (cyto), red (nuc), and green (ins) in the top panel are defined as fraction-enriched in PSCs. Transcripts highlighted in the bottom panel are defined as fraction-enriched in PSC-MNs.
(D) Venn diagrams showing fraction-enriched transcripts in PSCs, PSC-MNs, or both.
(E) Violin plots showing expression levels of transcripts that are fraction-enriched in PSCs only (left), in both PSCs and PSC-MNs (center), or in PSC-MNs only
(F) Boxplots comparing the lengths of 30UTRs (top) and CDS (bottom) in fraction-enriched transcripts across PSCs and PSC-MNs. Error bars represent the 95% confidence interval, the bottom and top of the box represent the 25th and 75th percentiles, the line inside the box is the 50th percentile (median), and any outliers are shown as closed diamonds.
(G) Scatterplots comparing enrichment of 6-mer sequence elements between PSCs and PSC-MNs across fractions. A/U/G/C-rich 6-mers are defined as containing 4 or more of the respective nucleotides within the 6-mer sequence.
To define fraction-enriched transcripts, we developed a metric based on pairwise differential expression analysis between all fractions using DESeq2 (Love et al., 2014), with all samples from the same cell type and fraction treated as replicates. A transcript is called fraction-specific if it is significantly enriched (fold change ≥2, p ≤ 0.05) in one fraction over the other two fractions. To visualize global localization profiles, we adapted a method to project the distribution of all RNAs according to their normalized fraction expression values onto a two-dimensional space (Wang et al., 2012a). The coordinates of each transcript are derived from normalized DESeq2 expression values in each fraction, again representing the combined output of all individual cell lines subjected to duplicate CeFra-seq experiments. The resulting triangle plots allow both a global visualization of cell-type-specific RNA localization landscapes as well as the highlighting of individual transcript localization differences between cell types (Figure 1C). For example, ferritin light chain (FTL) and Y-box binding protein 1 (YBX1) mRNAs were strongly enriched in the cytoplasm as shown by their position in the triangle plots (Figure 1C) and supported by their read coverage across fractions (Figure S1D). By contrast, the serine protease 53 (PRSS53) mRNA was enriched in the nucleus in PSC-MNs, but less highly expressed and more diffusely distributed in PSCs (Figures 1C and S1D).
Overall, 1,676 transcripts share enrichment in the cytoplasmic fraction in both PSCs and PSC-MNs, comprising 47% (1,676/3,590) and 84% (1,676/2,007) of cytoplasm-enriched transcripts in PSCs and PSC-MNs, respectively (Figure 1D). 920 transcripts shared enrichment in the nuclear fraction across both cell types, representing 56% (920/1,637) and 29% (920/3,132) of nuclear transcripts in PSCs and PSC-MNs, respectively. In both cell types, we found the fewest transcripts enriched in the insoluble fractions. The 32 shared transcripts represent 31% (32/104) and 9% (32/355) of the insoluble-enriched RNAs in PSCs and PSC-MNs, respectively (Figure 1D). Most transcripts with a cell-type-dependent fraction enrichment were expressed at comparable levels in the other cell type, suggesting that differential localization is not primarily due to cell-type-specific expression (Figure 1E). In summary, despite differences in subcellular mRNA distribution, our results reveal a remarkable similarity in the global mRNA localization landscape of PSCs and PSC-MNs and validate the application of CeFra-seq to neuronal cells.
Subcellular mRNA localization in neurons is governed by basic transcript architecture and sequence motifs in a cell-type-independent manner
To examine whether this stability of the subcellular mRNA localization landscape is directly encoded in basic transcript architecture, we analyzed transcript features, including GC content, the lengths of coding sequence (CDS), and untranslated regions (UTRs), as well as the number and length of introns. Among these, the CDS and 3′UTR lengths stood out as notably different among subcellular fractions, with cytoplasmic mRNAs characterized by significantly shorter CDS and 3′UTRs compared to nuclear- and insoluble-enriched transcripts (Figure 1F). By contrast, the insoluble fraction is distinguished by a significant enrichment of A- and U-rich 6-mer sequence motifs (Figure 1G). To quantify the degree to which localization information is encoded in basic transcript architecture, we constructed a random forest classifier (RFC) based on the above transcript features as well as k-mer enrichment of all nuclear and cytoplasmic transcripts in PSCs (Figure S1E). Using this approach, we were able to predict nuclear versus cytoplasmic localization with nearly 90% accuracy (Figures S1F and S1G). Remarkably, a classifier trained on PSCs was highly accurate across a range of cell types derived from different tissues and maintained under different culture conditions (PSC-MNs, HepG2 hepatocellular carcinoma cells, and non-adherent K562 myelogenous leukemia cells) (Benoit Bouvrette et al., 2018; Lefebvre et al., 2017) (Figure S1F). This result concurs with previous findings in human cancer cell lines (Solnestam et al., 2012) and Drosophila oocytes (Jambor et al., 2015), as well as recent reports describing an enrichment of AU-rich sequences in transcripts found within insoluble SG-associated material (Namkoong et al., 2018). Importantly, these findings highlight a conserved framework underlying global mRNA localization, with a surprising amount of RNA localization information encoded in basic transcript architecture.
Cellular stress drastically reshapes the mRNA localization landscape
To characterize stress-induced changes in the global mRNA localization landscape, we used a transient, non-lethal, 24 h puromycin stress paradigm, which robustly drives SG localization of nuclear ALS-associated RBPs like TDP-43 and hnRNP A2/B1, and is non-lethal to post-mitotic PSC-MNs (Figure 2A) (Fang et al., 2019; Markmiller et al., 2018; Martinez et al., 2016). We generated CeFra-seq data from unstressed and puromycin-stressed PSC-MNs and defined fraction-enriched transcripts for both conditions. Inspection of individual transcripts of interest revealed widespread and often complex changes to both mRNA processing and localization, as exemplified by HNRNPA2B1, which shows both changes in alternative 3′UTR usage and subcellular distribution of the transcript (Figure S2A). Transcriptome-wide comparison of mRNA localization across conditions revealed widespread stress-induced changes to subcellular RNA distribution (Figures 2B and 2C). Notably, almost half of nuclear mRNAs (1,533/3,132) lost their specific nuclear localization upon treatment with puromycin (Figures 2B and 2C). However, this loss of nuclear transcripts upon stress was compensated by a set of transcripts that were enriched in the nucleus only following puromycin treatment. Many of these transcripts were expressed at low levels in untreated cells but increased upon stress, (Figure 2D), suggesting a pool of newly transcribed RNAs that were not efficiently exported from the nucleus in response to stress.
Figure 2. Cellular stress induces widespread changes in subcellular mRNA and protein localization.

(A) Immunofluorescence staining of PSC-MNs that were left untreated, treated with NaAsO2 (250 mM) for 90 min, treated with puromycin (10 μg/mL) for 24 h, or treated with puromycin followed by washout and recovery in puromycin-free medium for 72 h. Cells were stained with antibodies against G3BP1 and TDP-43. G3BP1-positive SGs are indicated by red arrows. TDP-43-positive SGs are indicated by solid yellow arrowheads. Nuclei were stained using DAPI. Scale bars, 20 μm in all panels.
(B) Triangle plots visualizing the relative expression level of individual transcripts across the cytoplasmic, nuclear and insoluble fractions. Transcripts highlighted in blue (cyto), red (nuc), and green (ins) in the top panel are defined as fraction-enriched in unstressed PSC-MNs. Transcripts highlighted in the bottom panel are defined as fraction-enriched in puromycin-stressed PSC-MNs.
(C) Venn diagrams showing fraction-enriched transcripts in unstressed PSC-MNs, puromycin-stressed PSC-MNs, or both.
(D) Violin plots showing expression levels of transcripts that are fraction-enriched in unstressed PSC-MNs only (left), in unstressed and puromycin-stressed PSC-MNs (center), or in puromycin-stressed PSC-MNs only.
(E) Volcano plots showing statistically significant puromycin-induced changes in the enrichment of detected proteins in the cytoplasmic, nuclear, and insoluble fractions, respectively. Selected protein categories are highlighted in color as indicated. Statistically significant changes were identified using multiple unpaired t-test with an FDR cutoff of 0.05.
See also Figures S2 and S3 and Tables S1 and S2.
The net loss of nuclear mRNA localization was accompanied by an 80% increase in the number of cytoplasm-enriched transcripts (Figures 2B and 2C). Of the 1,970 mRNAs that show cytoplasmic enrichment specific to stress, the vast majority (1,798/1,970, 92%) were previously non-localized, with a smaller fraction (66/1,970, 3%) switching from nuclear to cytoplasmic enrichment. Unlike puromycin-specific nuclear transcripts, puromycin-specific cytoplasmic transcripts did not show significant differences in total expression levels (Figure 2D). Besides the dramatic changes to normal nucleo-cytoplasmic mRNA distribution, we also observed an approximate doubling of the number of transcripts enriched in the insoluble fraction (Figures 2B and 2C). These newly insoluble-enriched transcripts include RNAs that were previously non-localized but also consist of RNAs that were strongly enriched in the nuclear or cytoplasmic fraction in unstressed cells (Figure S2B).
Unlike other sedimentation-based fractionation protocols (Jain et al., 2016), our subcellular fractionation protocol was not designed to capture SGs, but it is likely that the increase in insoluble transcripts is a result of aggregation-prone RBPs transitioning into detergent-insoluble aggregates upon prolonged stress. In summary, stress induced by 24 h puromycin treatment drastically reshapes the nucleocytoplasmic distribution of cellular mRNA in PSC-MNs and increases the load of insoluble material present in the cytoplasm.
SG-associated RBPs, molecular chaperones, and cytoskeleton-associated proteins shift localization in response to stress
We also employed a quantitative proteomics approach to capture a global profile of shifting protein localization in response to puromycin treatment, applying stable isotope labeling with amino acids in cell culture (SILAC) on quadruplicate sets of PSC-MNs that were differentiated simultaneously from heavy and light labeled MNPs and left untreated or treated with puromycin for 24 h. Equal amounts of untreated (light) and puromycin-treated (heavy) cells were combined prior to fractionation, and relative protein abundance in each fraction was determined by mass spectrometry (Figure S3A). Notably, this approach only measures changes in relative protein abundance for each fraction and not whether any given protein is specifically enriched in one particular fraction over another.
Puromycin globally inhibits translation and, as a result, total protein levels were significantly reduced (Figure S3B). To assess changes in subcellular distribution, heavy/light protein ratios in each fraction were normalized by changes in the total lysate. We observed statistically significant differences in subcellular protein distribution in all fractions, with relatively minor changes in the cytoplasm and more pronounced changes in the nuclear and insoluble fraction (Figure 2E). This is consistent with our mRNA localization data and the notion that stress both impairs nucleocytoplasmic transport and induces the transition of IDR-containing proteins toward more insoluble states.
In the nuclear fraction, we saw an unexpected and significant stress-induced decrease in nuclear enrichment of several chromatin-associated factors, including CBX3 and TRIM28 (Figure 2E). These were of particular interest because our previous work had identified CBX3 as a functional regulator of neurodegeneration in vivo (Markmiller et al., 2018), whereas TRIM28 has recently been described to interact with the key SG protein FMRP (Taha et al., 2021) and may ameliorate the aggregation and toxicity of both tau and a-synuclein in vitro and in vivo (Rousseaux et al., 2016, 2018). Both CBX3 and TRIM28 are associated with heterochromatin domains, the formation of which involves the same liquid-liquid phase separation (LLPS) mechanisms that contribute to SG formation (Strom et al., 2017). Intriguingly, immunofluorescence imaging revealed a dissociation of TRIM28 from heterochromatin foci in PSC-MNs upon puromycin stress, whereas the heterochromatin domains themselves remained intact (Figure S3D). This suggests that cellular stress can alter the composition of other phase separation-dependent molecular assemblies in cells and affect the subcellular distribution of proteins with a demonstrated capacity to regulate neurodegeneration in vivo. In addition, we also observe a decrease in nuclear enrichment for several primarily nuclear RBPs, including CELF1, DAZAP1, and members of the ELAV-like family of RBPs (Figures 2E and S3E). Among the proteins with a relative increase in nuclear enrichment upon stress, we noted several components of both HSP70 and HSP90 chaperone complexes (Figure 2E). Although this could result from co-purification of some insoluble material with the nuclear fraction in puromycin-treated cells, it is also possible that this is a specific response to the accumulation of improperly folded proteins in the nucleus in response to stress.
The most pronounced localization changes were in the insoluble fraction, with a marked drop in enrichment of a set of ribosomal proteins and other ribosome-associated proteins, including the SG-associated RBPs CAPRIN1, G3BP2, and FXR1 (Figure 2E), indicating that the insoluble fraction in unstressed cells is highly enriched for polysomes. By contrast, among the proteins that increased in enrichment in the insoluble fraction upon stress were several normally nuclear RBPs with known roles in a range of neuromuscular diseases, including TDP-43 and several HNRNP family proteins (Figure 2E). Interestingly, we also found numerous proteins associated with axon guidance and the cytoskeleton to be significantly more enriched in the insoluble fraction upon stress, including the Alzheimer’s disease-associated protein DPYSL2 and other members of the collapsin response mediator family (Figure 2E). These findings further underscore the utility of the transient stress framework to highlight important disease-associated proteins and provide another tangible link between cellular stress and neurodegeneration-relevant cellular phenotypes.
Stress induces global changes in RBP-RNA interactions
To characterize whether the observed stress-induced localization changes of SG-associated RBPs alter their RNA interaction profiles, we performed enhanced crosslinking and immunoprecipitation followed by sequencing (eCLIP) (Van Nostrand et al., 2016) for TDP-43 and two canonical SG proteins, G3BP1 and TIA1, in untreated and puromycin-stressed PSC-MNs. Cellular stress significantly altered the binding profiles of SG-associated RBPs by altering both their target transcripts and the transcript regions they preferentially bind (Figures 3A–3C). For all three RBPs, we observed an increase in the fraction of peaks that fall within 3′UTRs (Figure 3B), consistent with previous studies that identified elongated 3′UTRs and 3′UTR-resident sequence elements as enriched in insoluble fractions and upon stress (Namkoong et al., 2018). Furthermore, each RBP displayed additional changes to their binding profile that appeared directly related to their functions in mRNA metabolism (e.g., translation regulation and pre-mRNA splicing).
Figure 3. eCLIP reveals both common and distinct stress-induced changes in target binding across SG-associated RNA binding proteins.

(a) Bar graphs showing both the number of peaks and total transcripts bound by G3BP1 (left), TDP-43 (center), and TIA1 (right) in untreated and puromycin-stressed PSC-MNs, respectively.
(B) Venn diagrams showing the proportions of binding peaks falling within distinct transcript regions for G3BP1, TDP-43, and TIA1 in untreated and puromycin-stressed PSC-MNs, respectively.
(C) Metagene plots showing distribution of binding peak density across transcripts for G3BP1, TDP-43, and TIA1 in untreated and puromycin-stressed PSC-MNs, respectively.
(D) Genome browser tracks illustrating changes in TDP-43 binding to exon 2a of the STMN2 mRNA in untreated and puromycin-stressed PSC-MNs, respectively. See also Table S3.
For G3BP1, ~80% of binding sites in unstressed cells resided within the CDS of target transcripts (Figure 3A). Upon stress, the number of G3BP1 binding events dropped by more than 85% (36,243 to 4,902 peaks) (Figure 3B), and binding became primarily distributed to a distinct peak around the translation initiation site, with an increase in the relative fraction of peaks overlapping the 5′UTR (Figure 3C). These findings are consistent with the cytoplasmic localization of G3BP1, its reported RGG-mediated interaction with 40S ribosomal subunits (Kedersha et al., 2016), and a scenario in which assembly of G3BP1-containing translation initiation complexes on mRNAs accompanies, and potentially drives, SG formation (Buchan and Parker, 2009). This dramatic decrease in CDS binding was specific to G3BP1, underscoring its critical role in coupling translation and SG formation. By contrast, TDP-43 showed a notable increase in CDS binding, likely a result of reduced TDP-43 displacement by translating ribosomes due to translation inhibition. Overall, binding changes for TDP-43 and TIA1 were generally more subtle, with notable decreases in intronic and 5′ splice site binding, respectively, reflecting the fact that both proteins act at least in part as nuclear splicing regulators (Figure 3A-C).
Transient stress recapitulates aspects of the molecular pathology of ALS
A TDP-43-dependent splicing event in the Stathmin 2 (STMN2) gene has recently been implicated in ALS (Klim et al., 2019; Melamed et al., 2019). Intriguingly, our proteomics analysis had identified STMN2 as one of the most significantly reduced proteins upon puromycin stress (Figure S3B) and this decrease was notably accompanied by an equally sharp drop in mRNA level (Figure S3C). To determine whether the stress-induced loss of STMN2 might be a result of altered TDP-43 binding to STMN2, we analyzed our eCLIP data for exon 2a, which is only included in the mature mRNA upon loss of TDP-43-mediated splicing repression and results in degradation of the STMN2 mRNA by premature polyadenylation and decay (Klim et al., 2019; Melamed et al., 2019). We observed a striking loss of TDP-43 binding at exon 2a of STMN2 during stress (Figure 3D), supporting a stress-induced impairment of TDP-43 nuclear splicing function in PSC-MNs.
Stress-induced disruption of RNA localization persists in ALS mutant neurons
We have previously shown that transient stress can result in persistent protein aggregation in the presence of ALS-associated mutations (Fang et al., 2019). To test whether the presence of a neurodegeneration-linked mutation affects global RNA localization prior to, during, or after transient puromycin stress, we performed CeFra-seq on two different patient-derived PSC-MN lines harboring the HNRNPA2B1 D290V mutation, which is known to cause severe neurodegenerative disorders, including ALS and multisystem proteinopathy (Kim et al., 2013). Cells were harvested prior to stress, after exposure to puromycin for 24 h, and after a 72 h recovery period following puromycin stress. In previous work, we found that HNRNPA2B1 D290V mutant cells show transcriptome-wide changes in alternative splicing and an altered stress response, but D290V iPSC-MNs cultured under ideal conditions do not show spontaneous protein aggregation and only a slightly increased risk of cell death compared to wild-type cells (Markmiller et al., 2018; Martinez et al., 2016). Accordingly, we found that the global RNA localization landscape in unstressed HNRNPA2B1 mutant cells was largely similar to that of unstressed wild-type cells, with the exception of an increased number of insoluble-enriched transcripts in the presence of HNRNPA2B1 mutation (Figures 4A, 4B, and S4A). Upon exposure to puromycin for 24 h, localization changes in HNRNPA2B1 mutant cells closely resembled those of wild-type cells, including a substantial movement of transcripts out of the nucleus and a significant increase in insoluble transcripts (Figures 4A, 4B, and S4A). Again, mutant PSC-MNs displayed a significantly larger number of insoluble transcripts than wild-type cells. In accordance with the observed return of TDP-43 to its normal nuclear localization upon recovery (Figure 2A), wild-type cells to a large extent recovered their global localization pattern following a 72 h washout after puromycin treatment (Figures 4AB and S4A). However, no such recovery occurred in the HNRNPA2B1 mutant cells, which retained a profoundly aberrant global RNA localization profile.
Figure 4. Stress-induced localization changes persist in the context of ALS-associated mutations.

(A) Triangle plots visualizing the relative expression level of individual transcripts across the cytoplasmic, nuclear and insoluble fractions in wild-type PSC-MNs (top panel) and PSC-MNs derived from two individual cell lines harboring the HNRNPA2B1 C290V mutation (middle and bottom panel). Transcripts highlighted in blue (cyto), red (nuc), and green (ins) in the top panel are defined as fraction-enriched in unstressed wild-type PSC-MNs. Transcripts highlighted in the middle and bottom panels are defined as fraction-enriched in unstressed HNRNPA2B1 mutant PSC-MNs.
(B) Bar graphs showing the distribution of fraction-enriched and non-localized transcripts in untreated (left), puromycin-stressed (center), and recovery (right) conditions in wild-type PSC-MNs (top panel) and PSC-MNs derived from two individual cell lines harboring the HNRNPA2B1 C290V mutation (middle and bottom panel).
(C) Cumulative distribution plots showing relative entropies for all detected transcripts in the indicated comparisons between two conditions.
(D) Bar graphs showing the sum of relative entropies for all detected transcripts when comparing untreated condition to puromycin stress (blue) or recovery (orange) condition in wild-type (left) or HNRNPA2B1 mutant (right) PSC-MNs.
(E) Cumulative risk of death plots showing Cox proportional hazard analysis for control (red lines) and HNRNPA2B1 mutant (green lines) that were left unstressed (solid lines) or treated with puromycin for 24 h and then allowed to recover (broken lines). A hazard ratio above 1.0 indicates increased risk of death as compared to the untreated control lines from healthy individuals.
To quantify how much the RNA localization landscape changes and then recovers following puromycin stress in control and HNRNPA2B1 mutant PSC-MNs, we developed a measure based on calculating the distribution and cumulative sum of relative entropies between unstressed, stressed, and recovery conditions for each cell line (Figures 4C and 4D). Puromycin stress induced a significant increase in relative entropy values that was similar in control and HNRNPA2B1 mutant PSC-MNs, showing widespread changes in subcellular RNA distribution. In control PSC-MNs, relative entropy values were significantly reduced upon recovery from stress, indicating a highly similar localization landscape between unstressed and recovered cells (Figures 4C and 4D). However, in the presence of HNRNPA2B1 mutations, relative entropies remained significantly elevated upon recovery, confirming a persistent and quantifiable misregulation of global subcellular RNA distribution (Figures 4C and 4D).
To evaluate whether persistently disrupted RNA localization affects neuronal vulnerability, we sparsely labeled PSC-MNs with the fluorescent marker mApple and treated with puromycin for 24 h to induce stress. After 24 h, puromycin was washed out and the cells were longitudinally imaged daily for 7 days on a custom-built robotic microscope (RM) to track neuronal survival post-stress. Cumulative hazard analysis of individually tracked neurons indicates that the hazard ratio (HR) for wild-type control PSC-MNs increased modestly to 1.29 after a 24-h period of stress (Cox proportional hazard, p < 0.05, n = 278 unstressed, n = 197 stressed). As we previously reported, unstressed HNRNPA2B1 mutant PSC-MNs had a higher hazard ratio of 1.68 (p < 0.0001, n = 193) compared with unstressed controls (Martinez et al., 2016), but unlike in control PSC-MNs, the HR in HNRNPA2B1 mutant PSC-MNs rose significantly to 2.17 (p < 0.0001, n = 228) upon transient exposure to stress. Cumulative risk of death curves shows that HNRNPA2B1 mutant PSC-MNs continued to succumb over the course of the imaging experiment (Figure 4E).
In summary, these results demonstrate that transient exposure of PSC-MNs to stress induces detrimental cellular effects that can persist in the context of ALS-associated mutations. Our observation of a drastically altered RNA localization landscape following recovery from stress represents a pronounced and robust molecular phenotype that recapitulates key molecular disease features in a stem cell-based model of late onset neurodegeneration.
DISCUSSION
Defects in subcellular compartmentalization are central to the pathogenesis of ALS, most clearly illustrated by the clearance of nuclear TDP-43 and its accumulation in cytoplasmic aggregates in most ALS patients. The mechanisms underlying TDP-43 mislocalization are complex, resulting from a combination of passive diffusion from the nucleus (Archbold et al., 2018; Ederle et al., 2018; Pinarbasi et al., 2018) and likely sequestration of TDP-43 in cytoplasmic aggregation “sinks.” The resulting nuclear clearance of TDP-43 in turn leads to widespread defects in cellular RNA processing and cell death (Barmada et al., 2015; Fang et al., 2019; Gasset-Rosa et al., 2019; Krach et al., 2018; Liu et al., 2019; Polymenidou et al., 2011). To intervene in this cascade of events, most current therapeutic strategies aim to prevent the formation of TDP-43 aggregates (Boyd et al., 2014; Fang et al., 2019) or enhance the clearance of aggregates (Barmada et al., 2014; Tamaki et al., 2018; Wang et al., 2012b). However, approaches aimed directly at restoring normal levels of TDP-43 in the nucleus might be easier to achieve and would more immediately mitigate the contribution to pathogenesis caused by nuclear loss of function of TDP-43. A more detailed understanding of the mechanisms by which nucleocytoplasmic transport is impaired in ALS could reveal potential targets for restoring cellular transport mechanisms and thus address a root cause of ALS pathogenesis. However, this requires robust and reproducible approaches to recapitulating these specific molecular aspects of ALS in cellular models.
We have previously shown that transient stress can induce the formation of persistent cytoplasmic aggregates containing TDP-43 in the context of ALS-associated mutations (Fang et al., 2019). Here, we demonstrate that the application of a single transient, non-lethal stress treatment can directly induce several disease-relevant molecular changes (e.g., disruption of nucleocytoplasmic RNA and protein distributions, splicing-mediated loss of Stathmin-2), and can synergize with genetic risk factors (e.g., mutation in HNRNPA2B1) to induce a downstream state that captures additional key molecular aspects of ALS (e.g., cytoplasmic TDP-43 aggregates, increased cell death). Notably, these latter phenotypes occur upon recovery from stress, particularly in the absence of acute translation inhibition and canonical stress granules. Similarly, the induction of mild but chronic oxidative stress by sodium arsenite was also recently shown to induce the formation of cytoplasmic TDP-43 aggregates distinct from SGs (Ratti et al., 2020).
Stressors such as puromycin or sodium arsenite are supraphysiological interventions that are not expected to be directly representative of a physiological condition found in ALS or other neurodegenerative diseases. Additionally, there appear to be multiple paths leading to persistent cytoplasmic aggregation of TDP-43, including some that do not rely on SG formation (Dewey et al., 2012; Fernandes et al., 2020; Gasset-Rosa et al., 2019; Mann et al., 2019). It is therefore clear that stress-based approaches alone will be insufficient to elucidate the many unknown molecular mechanisms underlying ALS pathogenesis. Nevertheless, given the practical hurdles to modeling late-onset diseases in general, there remains an urgent need for a variety of approaches to best recapitulate key aspects of ALS pathology. The experiments presented in this study and in our previous work demonstrate the utility of a transient stress-based approach to model a range of physiological disease phenotypes, dissect molecular mechanisms and identify potential small molecules and protein targets for therapeutic intervention.
STAR★METHODS
RESOURCE AVAILABILITY
Lead contact
Further information and requests for resources and reagents should be directed to and will be fulfilled by the lead contact, Gene W. Yeo (geneyeo@ucsd.edu).
Materials availability
This study did not generate new unique reagents.
Data and code availability
All CeFra-seq and eCLIP data have been deposited at GEO and are publicly available as of the date of publication. Accession numbers are listed in the key resources table. Raw mass spectrometry data reported in this paper will be shared by the lead contact upon request
This paper does not report original code.
Any additional information required to reanalyze the data reported in this paper is available from the lead contact upon request.
KEY RESOURCES TABLE
| REAGENT or RESOURCE | SOURCE | IDENTIFIER |
|---|---|---|
|
| ||
| Antibodies | ||
|
| ||
| Rabbit polyclonal anti-G3BP1 | MBL International | Cat#RN048PW; RRID:AB_10794608 |
| Mouse monoclonal anti-G3BP1 | EMD Millipore | Cat#05–1938; RRID:AB_10561767 |
| Rabbit polyclonal anti-TARDBP | Abnova | Cat#H00023435-A01; RRID:AB_461752 |
| Rabbit polyclonal anti-Isl1/2 | Santa Cruz Biotech | Cat#sc-30200; RRID:AB_2126589 |
| Mouse monoclonal anti-SMI-31 | EMD Millipore | Cat#NE1022; RRID:AB_2043448 |
| Rabbit polyclonal anti-DAZAP1 | Novus Biologicals | Cat#NBP1–82741; RRID:AB_11002177 |
| Rabbit polyclonal anti-KAP1 | Novus Biologicals | Cat# NBP2–39014 |
| Mouse monoclonal anti-CUGBP1/CELF1 | Novus Biologicals | Cat# NB200–316SS; RRID:AB_921076 |
|
| ||
| Chemicals, peptides, and recombinant proteins | ||
|
| ||
| Dorsomorphin | Tocris | Cat#3093 |
| SB431542 | Tocris | Cat#1614 |
| Retinoic Acid | Sigma | Cat#R2625 |
| SAG | EMD Millipore | Cat#566660 |
| DAPT | Tocris | Cat#2634 |
| CHIR 99021 | Tocris | Cat#4423 |
| Purmorphamine | Tocris | Cat#4551 |
| DMH-1 | Tocris | Cat#4126 |
| Valproic acid | Tocris | Cat#2815 |
| Puromycin | Thermo Fisher | Cat#A1113803 |
|
| ||
| Deposited data | ||
|
| ||
| CeFra-seq data | This paper | GEO: GSE157467 |
| seCLIP data | This paper | GEO: GSE157467 |
|
| ||
| Experimental models: cell lines | ||
|
| ||
| H9 ESCs (46, XX) | Yeo lab stocks | N/A |
| H1 ESCs (46, XY) | Yeo lab stocks | N/A |
| Kin2ALS6 iPSCs (46, XY) | Generated in-house, described in Fang et al., 2019 | N/A |
| CV-B iPSCs (46, XY) | (Gore et al., 2011) | N/A |
| hnRNPA2/B1 D290V-1.1 hiPSC (46, XX) (also referred to as CR463.4) | Generated in-house, described in Martinez et al., 2016 | N/A |
| hnRNPA2/B1 D290V-1.2 hiPSC (46, XX) (also referred to as CR464.2) | Generated in-house, described in Martinez et al., 2016 | N/A |
|
| ||
| Software and algorithms | ||
|
| ||
| MaxQuant (version 1.6.0.16) | Cox and Mann, 2008 | N/A |
| STAR (v2.4.0i) | Dobin et al., 2013 | N/A |
| Cutadapt (v1.14) | (Martin, 2011) | N/A |
| CLIPper | Lovci et al., 2013 | N/A |
| DeSeq2 | Love et al., 2014 | N/A |
| metaplotR | Olarerin-George and Jaffrey, 2017 | N/A |
| featureCounts | Liao et al., 2014 | N/A |
| Jellyfish (v2.0) | Marçais and Kingsford, 2011 | N/A |
EXPERIMENTAL MODEL AND SUBJECT DETAILS
Maintenance of pluripotent stem cells (PSCs)
Human pluripotent stem cells (hiPSCs) and human embryonic stem cells (hESCs) were utilized in this study. hiPSCs and hESCs were maintained under feeder-free conditions in mTeSR1 medium (Stem Cell Technologies) and propagated either by single-cell passaging using Accutase or clump-passaging using enzyme-free dissociation buffer (EDTA).
Generation of PSC-derived motor neurons
Motor neurons were differentiated from PSCs as described in Markmiller et al. (2018). Briefly, hiPSCs or hESCs were plated into matrigel-coated 6-well plates or 10cm culture dishes and grown for 2–3 days in mTeSR1 medium until they reached 70%–90% confluency. On day 1 of the differentiation protocol, medium was changed to N2B27 medium (DMEM/F12+Glutamax, 1:200 N2 supplement, 1:100 B27 supplement, 150mM ascorbic acid and 1% Penicillin/Streptomycin) supplemented with 1 μM Dorsomorphin, 10 μM SB431542 and 3 μM CHIR99021. Cells were maintained with daily medium changes in the same medium for 6 days. On day 7, medium was changed to N2B27 medium supplemented with 1 μM Dorsomorphin, 10 μM SB431542, 200nM Smoothened Agonist (SAG) and 1.5 μM retinoic acid (RA). Medium was changed daily with increasing volumes to adjust for cell density until day 18. At day 18 of differentiation, cells were dissociated using Accutase and either plated directly for continued differentiation or expanded in motor neuron progenitor (MNP) medium as described previously (Du et al., 2015). For expansion as MNPs, cells were plated onto matrigel-coated 10cm plates at a density of 3–5 million cells per plate into N2B27 medium supplemented with 3 μM CHIR99021, 2 μM DMH1, 2 μM SB431542, 0.1 μM RA, 0.5 μM Purmorphamine and 0.5mM valproic acid (VPA). Cells were maintained for no more than 5 passages under these conditions with weekly splitting using Accutase at 1:8–1:12 before final differentiation. For continued differentiation, cells were plated at a density of ~10 million cells per plate into 10cm plates plate serially coated with 0.001% ( = 0.01mg/ml) poly-D-lysine (PDL, Sigma, P6407) and poly-L-ornithine (PLO, Sigma, P3655) followed by 20ug/ml laminin (Life technologies, 23017015). Cells were plated into N2B27 medium supplemented with 200nM SAG, 1.5 μM RA and 10 μM rock inhibitor. Medium was changed on day 20 and cells transferred into N2B27 medium supplemented with 2 μM DAPT on day 22. For imaging, cells were dissociated again at day 23 and plated into PDL/PLO/laminin-coated 96-well plates. Medium was changed into N2B27 medium without additional small molecules on day 25 and cells were maintained with medium changes every 2–3 days thereafter. Cells were stressed and fixed between day 29–32 of differentiation.
METHOD DETAILS
Subcellular fractionation
Subcellular fractionation was performed as described previously with minor modifications (Lefebvre et al., 2017). Briefly, one confluent 10cm tissue culture plate (corresponding to ~2×10⁷ or ~3–4×10⁷ PSC-MNs) was used for each fractionation sample.
Sample harvest
PSCs were rinsed once with ice-cold PBS and then harvested by scraping and resuspension in 1ml of ice-cold PBS. Cells were centrifuged at 200 g for 3min at 4°C, the supernatant removed and the pellets either processed directly or snap-frozen and stored at −80°C until use. PSC-MNs were rinsed once with ice-cold PBS and then harvested by gently dislodging the entire monolayer of cells and neurite connections from the plate using a cell scraper or pipette tip followed by gentle agitation of the plate containing 5ml ice-cold PBS. Once the entire cell layer was detached from the plate, it was gently transferred into a 1.5ml tube using a transfer pipette to minimize cell disruption and leakage of cell contents. Cells were centrifuged at 200 g for 3min at 4°C, the supernatants removed and the pellets either processed directly or snap-frozen and stored at −80°C until use.
Total input fraction
For fractionation, cell pellets were thawed on ice and resuspended in 1ml of hypotonic lysis buffer (20 mM Tris HCl pH 7.5, 10 mM KCl, 1.5 mM MgCl, 5 mM EGTA, 1 mM EDTA, 1 mM DTT) supplemented with complete protease inhibitor tablets (Roche) and 20ul RNase inhibitor (RNaseOUT). For PSC-MNs, the amount of RNase inhibitor was increased to 40ul. Cells were incubated on ice for 15min, transferred into a 2ml dounce homogenizer with a tight-fitting (type B) pestle and gently homogenized using 8 strokes to lyse the cells while keeping nuclei intact. This and all subsequent homogenization steps were performed on ice at all times. After homogenization, 1/10th volume (100–150ul) was removed as total input and mixed with 3 volumes of Trizol LS (300–450ul).
Nuclear fraction
The remaining lysate was transferred into a 1.5ml tube and centrifuged at 1200 g for 10min at 4°C to pellet cell nuclei. After the first spin, the supernatant was transferred either directly into a 1.5ml ultracentrifuge tube (PSCs) or into a fresh 1.5ml tube for two additional repeats of the 1200 g spin. The nuclei pellets from the first 1200 g spin were gently rinsed with 250 μL of hypotonic lysis buffer and resuspended in 1ml 0.32M sucrose buffer (0.32M sucrose, 3mM CaCl2, 2mM MgOAc, 0.1mM EDTA, 10mM Tris Cl pH8.0, 1mM DTT, 0.5% v/v NP-40) supplemented with protease and RNase inhibitors. The nuclei pellets in 0.32M sucrose buffer were transferred into a clean 2ml dounce homogenizer and resuspended using 3 strokes of a tight-fitting pestle. After addition of 1ml of 2M sucrose buffer (2M Sucrose, 5mM MgOAc, 0.1mM EDTA, 10 mM Tris pH8.0, 1 mM DTT) supplemented with protease and RNase inhibitors, the nuclei suspension was mixed and gently transferred to create a layer on top of a 1ml cushion of 2M sucrose buffer in a 3ml ultracentrifuge tube. The tubes were transferred into a SW50.1 swinging bucket rotor and centrifuged at 30,000 g for 30min at 4°C. After the spin, the supernatant was removed, and the pellet was rinsed twice with 500 μL of 0.32M sucrose buffer. The rinsed nuclear pellet was then resuspended by trituration in 250 μL of hypotonic lysis buffer and 750 μL of Trizol LS were added.
Cytoplasmic fraction
10ul of TurboDNase were added and mixed into the supernatant from the first (PSCs) or third (PSC-MN) 1200 g spin in 1.5ml ultracentrifuge tubes. The samples were then centrifuged at 100,000 g for 1h at 4°C in a tabletop ultracentrifuge using a TLA110 fixed-angle rotor. After the spin, the supernatant was transferred into a fresh 5ml tube and 3 volumes of Trizol LS were added.
Insoluble fraction
The pellets from the 100,000 g spin were rinsed twice with 100 μL hypotonic buffer, resuspended in 1ml of hypotonic buffer supplemented with protease and RNase inhibitors and 1% Triton-X and transferred into a fresh 2ml dounce homogenizer. An additional 25ul of Superase RNase inhibitor was added and the sample was homogenized using 20 strokes of a tight-fitting pestle. The sample was incubated on ice for 20min, followed by homogenization for an additional 10 strokes, another 20min incubation on ice followed by homogenization for an additional 10 strokes and a final incubation on ice for 20min. After a total of 60min on ice, the sample was transferred into a 1.5ml ultracentrifuge tube and centrifuged at 100,000 g for 30min at 4°C in a TLA110 fixed-angle rotor. After the spin, the supernatant was removed, the pellet rinsed twice with 100 μL hypotonic buffer + Triton-X and resuspended by trituration in 250 μL of hypotonic buffer, followed by addition of 750 μL of Trizol LS.
RNA extraction and CeFra-seq library preparation
RNA was extracted from fractions in Trizol-LS according to the manufacturers standard protocol. mRNA-sequencing libraries were prepared from polyA-enriched RNA using the Illumina TruSeq stranded mRNA library preparation kit.
Immunofluorescence and RNA FISH
For immunofluorescence and RNA FISH experiments, cells were plated into 96-well optical bottom plates or 8-well glass bottom chamber slides between days 22 and 24 of differentiation and maintained for at least one week to allow for growth and interaction of neurites and axons. For stress treatments, cells were incubated either in 250 μM sodium arsenite NaAsO2 for 90min or in 10 μg/ml of puromycin for 24h. After stress treatments, cells were fixed in 4% paraformaldehyde in PBS or PHEM buffer (60mM PIPES, 25mM HEPES, 4mM MgCl2, 10mM EGTA, pH 7.4) for 15–20’ at room temperature. For immunofluorescence, cells were permeabilized in 0.25% Triton-X in PBS for 15’ at RT, followed by blocking in 5% normal goat serum in PBS + 0.01% Tween-20 (PBST) and 0.3M glycine for at least 60min at RT. Primary antibodies were diluted in either 1x PHEM buffer or PBST + 5% normal goat serum and incubated either at RT for 1–4 hours or overnight at 4°C. After 2 washes in PBST, cells were incubated with secondary antibodies in PBST + DAPI for 30–60min at RT, followed by two washes in PBST and final resuspension in 50% glycerol in PBS. Cells were then imaged either at 20X or 40X magnification on a ZEISS Axio Vert.A1 inverted microscope. For RNA FISH, fixed cells were transferred into ice-cold 70% ethanol and stored for at least 24h at −20°C prior to staining. CAL Fluor Red 635-labeled Stellaris FISH probes were used according to the manufacturer’s protocol. Cells were imaged at 60X magnification using a A1R confocal mounted on a Nikon Ti2 inverted microscope. Images were processed in ImageJ.
Longitudinal Imaging Experiments
Differentiation and Cell Culture
iPSC lines from two ALS patients with HNRNPA2B1 mutations and two healthy individuals (Miyaoka et al., 2014) were confirmed for normal karyotype. The iPSCs were differentiated into motor neurons as previously described (Burkhardt et al., 2013; Chambers et al., 2009) with some modifications (Du et al., 2015).The iPSC were neuralized in IMDM/F12 medium (Thermo Fisher) with SMAD inhibitors: 0.2 μM LDN-193189 (Stemgent) and 10 μM SB431542 (Stemgent). Cultures were split 1:2 after 1 week in medium containing 0.1 μM RA, (Sigma-Aldrich) and 1 μM SAG (Fisher Scientific) and 3 μM CHIR99021, 0.2 μM LDN193189 and 10 μM SB431542. After 1 more week, the cultures were banked frozen in Synthafreeze (Thermo Fisher). All cell lines were then thawed simultaneously to synchronize neuron maturation for imaging experiments. The MN cultures were fed with medium containing Compound E (0.1 μM, Fisher), 2.5 μM DAPT (Fisher), 0.1 μM db-cAMP (Sigma Aldrich), 200 ng/mL ascorbic acid (Sigma), 10 ng/mL each BDNF and GDNF (Fisher Scientific), together with 0.5 μM all-trans RA and 0.1 μM SAG for an additional 6 days. MN cultures were trypisizined and plated into 96-well plates, lipofected with a plasmid expressing the red fluorescent protein mApple under the neuronal specific promoter Synapsin.
Imaging and analysis
The iPSC-neurons were imaged starting 2 days after transfection, once every six hours on a custom-built robotic microscopy (RM) system comprised of a Nikon T2i widefield fluorescence microscope and 888 Andor camera and kept in a robotic incubator (Liconic). Individual neurons were tracked using custom algorithms and neuronal survival was analyzed in time-lapse images. Kaplan Meier survival analysis was used to measure survival of individual neurons over time. Cumulative risk of death curves were derived from the Kaplan Meier survival curves. Cox proportional hazard analysis was used to measure cumulative hazard ratio of PSC-MNs from ALS patients compared with healthy individuals and derive P values as previously described (Skibinski and Finkbeiner, 2013).
SILAC labeling
For SILAC labeling of PSC-MNs, DMEM/F12 without L-arginine and L-lysine (Pierce catalog no. PI88215) was used instead of regular DMEM/F12 and supplemented with 0.7mM and 0.5mM, respectively, of either unlabeled L-Lysine:HCL and L-Arginine:HCl (Sigma, cat no. L8662 and A6969) or isotopically labeled L-Lysine: 2HCl (13C6, 15N2) and L-Arginine:HCl (13C6, 15N4) (Cambridge Isotope laboratories, cat no. CNLM-291 and CNLM-539). To achieve complete labeling of the proteome in PSC-MNs, SILAC labeling was initiated at the highly proliferative MNP stage (equal to day 18 of differentiation). MNPs were grown in heavy or light SILAC medium for at least 5 cell doublings prior to and throughout the final 14-day terminal differentiation phase. On day 22, eight PDL/PLO/laminin-coated 10cm plates each were seeded with equal numbers (30×106) of heavy- or light-labeled cells into N2B27 supplemented with 2 μM DAPT for terminal differentiation. On day 31, four of the heavy-labeled plates were treated with 10 μg/ml of puromycin for 24h, immediately followed by harvesting of cells for subcellular fractionation. Each of the four puromycin-stressed heavy-labeled plates and the four unstressed heavy-labeled plates was combined with a corresponding untreated, light-labeled plate to yield four replicates each of a puro (H) versus unstressed (L) condition, as well as an unstressed (H) versus unstressed (L) control condition. The combined samples were then processed for subcellular fractionation as described above, except that no Trizol or Trizol LS was added to any fractions. Instead, fraction pellets (nuclear and insoluble) or lysates in hypotonic lysis buffer (total and cytoplasmic) were processed directly for digestion and MS sample prep.
Sample preparation for mass spectrometry
The fraction pellets (nuclear and insoluble) were suspended in 100μl of 8M urea lysis buffer (8M Urea, 150mM NaCl, 50mM Tris pH8.0, Roche protease complete inhibitor, 1mM NaF, 1mM β glycerophosphate, 1mM Sodium orthovanadate) and sonicated on 30% intensity (8mW) with the microtip 3 times for 10 s with 30 s rest on ice between the cycles. After the sonication, the lysates were centrifuged at 15,000 RCF for 15min at 4°C and supernatant was pipetted into the fresh Eppendorf tube. Equal volume of 8M urea lysis buffer was added to the lysates in hypotonic lysis buffer (total and cytoplasmic), to make 4M final urea concentration. Protein quantitation was performed by the BCA assay and 40μg of protein amount for each sample was used for the trypsin digestion. Prior to the trypsin digestion, samples were diluted with 50mM ammonium bicarbonate buffer to dilute the urea to 1M final concentration for effective digestion. Samples were digested with trypsin (Promega) with 1: 100 (enzyme: substrate) ratio and incubated overnight at 37°C. The digestion was stopped, and samples were acidified by adding 0.5% formic acid. After the digestion, samples were reduced with 1mM DTT for 30min at RT and then alkylated with 5mM iodoacetamide for 30min at RT in a dark. The trypsin-digested samples were concentrated and desalted using the Stage-Tip method and reconstituted in a 5%Formic acid/5% acetonitrile for MS analysis.
Mass spectrometry data collection
Samples were analyzed in duplicate using a Q-Exactive mass spectrometer (Thermo Scientific, San Jose, CA) with essentially the same nHPLC and instrument method as described previously (Gendron et al., 2016) with the following modifications: Peptides were first separated by reverse phase chromatography using a fused silica microcapillary column (75μM inner diameter, 15cm length) packed with C18 reverse phase resin (ReproSil-pur 120 C18-AQ, 1.9μm; Dr. Maisch GmbH). Peptides were eluted using a 120 min ACN gradient (100 minute 2%–30% ACN gradient, followed by a 5 minute 30%–60% ACN gradient, a 5min 60%- 95% gradient, with a final 10min isocratic step at 0% ACN) at a flow rate of 250 nl/min. A dynamic exclusion time of 40 s was used and singly charged ions, charge states above 6 and unassigned charge states were excluded.
Single-end CLIP (seCLIP) library preparation
seCLIP was performed as described previously (Van Nostrand et al., 2016). Briefly, lysates were generated, sonicated, and treated with RNase I to fragment RNA. 2% of each lysate sample was stored for preparation of a parallel size-matched input (SMInput) library. The remaining lysates were immunoprecipitated. Bound RNA fragments in the IPs were dephosphorylated and 3′ end ligated to an RNA adaptor. Protein-RNA complexes from SMInputs and immunoprecipitates (IPs) were run on an SDS polyacrylamide gel and transferred to nitrocellulose membrane. Membrane regions were excised, and RNA released from the complexes with proteinase K. SMInput samples were dephosphorylated and 3′ end ligated to an RNA adaptor. All RNA samples (IPs and SMInputs) were reverse transcribed with AffinityScript (Agilent). cDNAs were 5′ end ligated to a DNA adaptor. cDNA yields were quantified by qPCR and 100–500 fmol of libraries generated with Q5 PCR mix (NEB). Libraries were sequenced on an Illumina HiSeq4000 platform.
QUANTIFICATION AND STATISTICAL ANALYSIS
CeFra-seq data processing and analysis
RNASeq reads were adaptor-trimmed using Cutadapt (v1.14) (Martin, 2011) and mapped to human-specific repetitive elements from RepBase (version 18.05) by STAR (v2.4.0i) (Dobin et al., 2013). Repeat-mapping reads were removed, and remaining reads were mapped to the human genome assembly (hg19) with STAR. Read counts for all genes annotated in GENCODE (hg19) were calculated using the read summarization program featureCounts (Liao et al., 2014). Differential expression analysis between fractions and between different cell lines was performed using DESeq2 (Love et al., 2014).
K-mer analysis
All regions pertaining to a given region (CDS, 3′UTR, 5′UTR) were collected based on Gencode annotations. 6-mer counts were generated from the sequences belonging to the given regions using Jellyfish (v2.0) (Marçais and Kingsford, 2011). A normalized frequency for each 6-mer was calculated for each sequence. The normalized frequency amounts to the frequency of a 6-mer within a region normalized to the corresponding mean frequency across all regions. Normalized frequency for each 6-mer was calculated for all genes and then compared across different fractions or cell lines.
Mass spectrometry data analysis
RAW files were analyzed using the Andromeda/MaxQuant (version 1.6.0.16) (Cox and Mann, 2008) Data were searched against a concatenated target-decoy database comprised of forward and reversed sequences from the reviewed UniprotKB/Swiss-Prot FASTA Human database (2017). Arg10 and Lys8 were selected as isotope labels and trypsin was specified for protein digestion. Variable modifications for methionine oxidation and protein N terminus acetylation and a fixed modification for cysteine carbamidomethylation were allowed. A mass accuracy of ± 50ppm was specified for the first search and ± 4.5ppm for the main search. A maximum of 2 missed cleavages and 5 modifications were allowed per peptide and the maximum charge was set to 7. The minimum allowed peptide length was 7 amino acids and matching between runs feature was enabled. The data were filtered using protein, peptide and site level false discovery rates of 0.01. Unique and razor peptides were used for quantification. Matches to common contaminants, reverse identifications and identifications based only on site-specific modifications were removed prior to further analysis. To identify proteins with differential enrichment in individual fractions, the resulting protein-level heavy:light ratios were first log2-transformed and all fraction ratios median-centered based on the total input sample. To account for global reductions in protein levels due to puromycin treatment, log2(H/L) ratios or individual proteins in the cytoplasmic, nuclear and insoluble fractions were normalized based on the log2(H/L) ratio of the corresponding total input fraction. Changes in fraction enrichment were determined by calculating the difference between log2(H/L) ratios for each protein between the experimental condition (heavy = puromycin, light = unstressed) and the control condition (heavy = unstressed, light = unstressed). Statistically significant changes were identified using multiple unpaired t test with an FDR cutoff of 0.05 in Prism 8.0.
SeCLIP data processing and analysis
Sequencing reads were processed as described previously (Van Nostrand et al., 2016). Briefly, reads were adaptor-trimmed using Cutadapt (v1.14) and mapped to human-specific repetitive elements from RepBase (version 18.05) by STAR (v2.4.0i) (Dobin et al., 2013). Repeat-mapping reads were removed, and remaining reads were mapped to the human genome assembly (hg19) with STAR. PCR duplicate reads were removed using the unique molecular identifier (UMI) sequences in the 5′ adaptor and remaining reads retained as ‘usable reads’. Peaks were called on the usable reads by CLIPper (Lovci et al., 2013) and assigned to gene regions annotated in GENCODE (hg19) with the following descending priority order: CDS, 5′UTR, 3′UTR, proximal intron, and distal intron. Proximal intron regions are defined as extending up to 500 bp from an exon-intron junction. Each peak was normalized to the size-matched input (SMInput) by calculating the fraction of the number of usable reads from immunoprecipitation to that of the usable reads from the SMInput. Peaks were deemed significant at 8-fold enrichment and p value 10−3 (Chi-square test, or Fisher’s exact test if the observed or expected read number in eCLIP or SMInput was below 5). Sequencing and mapping statistics are described in Table S3. Metagene plots were generated based on the location of each peak using the metaplotR package (Olarerin-George and Jaffrey, 2017).
Kullback-Leibler divergence (relative entropy)
The degree of difference between subcellular distributions for two experimental conditions can be assessed using the Kullback-Leibler divergence (relative entropy) on a per-gene basis. This provides a measure of loss of information between two distributions, with larger values corresponding to more dissimilar distributions. We have used relative entropy to understand the similarity (or difference) between the gene expression profiles of two subcellular fractions or conditions. RPKM values for an identical set of genes were used to generate a distribution of gene expression across two given conditions and the relative entropy between two conditions (A and B) was calculated using the following equation:
Here, x belongs to a given set of genes X. Ax and Bx are RPKM expression values for a given gene x in conditions A and B respectively.
Using the expression value in condition A as the base or truth, we can measure the relative entropy for a given gene x between the two conditions. Aggregating relative entropies across all genes in set X measures the divergence between the gene expression profiles of conditions A and B. Conditions with similar gene expression values will result in smaller entropy values, which can be used to measure the magnitude of divergence between gene expression profiles.
Supplementary Material
Highlights.
CeFra-seq applied to a range of cell types reveals basic rules of RNA localization
Transient stress disrupts subcellular mRNA and protein localization landscapes
Stress alters RNA binding of RBPs, including TDP-43, and alters splicing of STMN2
Stress induces persistent RNA localization changes and cell death in ALS neurons
ACKNOWLEDGMENTS
We thank Eric Griffis at the UC San Diego Nikon Imaging Center for assistance with imaging and Julie Bergalet in the Lécuyer lab with technical assistance. This work was supported by a grant from the California Institute for Regenerative Medicine (CIRM) through the CIRM Center of Excellence in Stem Cell Genomics (GC1R-06673-A), as well as grants from the ALS Association (VC8370 and 17-IIP-352), the NIH (HG004659), and the Larry L. Hillblom Foundation (2018-A-003-NET) to G.W.Y. This research was partially supported by an Allen Distinguished Investigator Award to G.W.Y., a Paul G. Allen Frontiers Group advised grant of the Paul G. Allen Family Foundation. Work in the E.J.B. lab was supported by a Larry L. Hillblom Foundation Network grant (2018-A-003-NET) and a Hellman Fellowship (E.J.B.). Work in the E.L. lab was supported by a project grant from ALS Canada. Work in the S.F. lab was supported by grants from the NIH (U54 HG0008105/NS091046, 1RF1 AG058476, and 1P01 AG054407), the ALS Association, and the U.S. Department of Defense (W81XWH-18-1-0696 and AL170078).
Footnotes
DECLARATION OF INTERESTS
G.W.Y. is co-founder, a member of the Board of Directors, a scientific advisor, equity holder, and paid consultant for Locanabio and Eclipse BioInnovations. G.W.Y. is a visiting professor at the National University of Singapore. The interest(s) of G.W.Y. have been reviewed and approved by the University of California-San Diego in accordance with its conflict-of-interest policies. The authors declare no other competing financial interests.
SUPPLEMENTAL INFORMATION
Supplemental information can be found online at https://doi.org/10.1016/j.celrep.2021.109685.
REFERENCES
- Alami NH, Smith RB, Carrasco MA, Williams LA, Winborn CS, Han SSW, Kiskinis E, Winborn B, Freibaum BD, Kanagaraj A, et al. (2014). Axonal transport of TDP-43 mRNA granules is impaired by ALS-causing mutations. Neuron 81, 536–543. [DOI] [PMC free article] [PubMed] [Google Scholar]
- Archbold HC, Jackson KL, Arora A, Weskamp K, Tank EM, Li X, Miguez R, Dayton RD, Tamir S, Klein RL, and Barmada SJ (2018). TDP43 nuclear export and neurodegeneration in models of amyotrophic lateral sclerosis and frontotemporal dementia. Sci. Rep 8, 4606. [DOI] [PMC free article] [PubMed] [Google Scholar]
- Barmada SJ, Serio A, Arjun A, Bilican B, Daub A, Ando DM, Tsvetkov A, Pleiss M, Li X, Peisach D, et al. (2014). Autophagy induction enhances TDP43 turnover and survival in neuronal ALS models. Nat. Chem. Biol 10, 677–685. [DOI] [PMC free article] [PubMed] [Google Scholar]
- Barmada SJ, Ju S, Arjun A, Batarse A, Archbold HC, Peisach D, Li X, Zhang Y, Tank EM, Qiu H, et al. (2015). Amelioration of toxicity in neuronal models of amyotrophic lateral sclerosis by hUPF1. Proc. Natl. Acad. Sci. USA 112, 7821–7826. [DOI] [PMC free article] [PubMed] [Google Scholar]
- Benoit Bouvrette LP, Cody NAL, Bergalet J, Lefebvre FA, Diot C, Wang X, Blanchette M, and Lécuyer E. (2018). CeFra-seq reveals broad asymmetric mRNA and noncoding RNA distribution profiles in Drosophila and human cells. RNA 24, 98–113. [DOI] [PMC free article] [PubMed] [Google Scholar]
- Boeynaems S, Bogaert E, Kovacs D, Konijnenberg A, Timmerman E, Volkov A, Guharoy M, De Decker M, Jaspers T, Ryan VH, et al. (2017). Phase Separation of C9orf72 Dipeptide Repeats Perturbs Stress Granule Dynamics. Mol. Cell 65, 1044–1055.e5. [DOI] [PMC free article] [PubMed] [Google Scholar]
- Boyd JD, Lee P, Feiler MS, Zauur N, Liu M, Concannon J, Ebata A, Wolozin B, and Glicksman MA (2014). A high-content screen identifies novel compounds that inhibit stress-induced TDP-43 cellular aggregation and associated cytotoxicity. J. Biomol. Screen 19, 44–56. [DOI] [PMC free article] [PubMed] [Google Scholar]
- Buchan JR, and Parker R. (2009). Eukaryotic stress granules: the ins and outs of translation. Mol. Cell 36, 932–941. [DOI] [PMC free article] [PubMed] [Google Scholar]
- Burkhardt MF, Martinez FJ, Wright S, Ramos C, Volfson D, Mason M, Garnes J, Dang V, Lievers J, Shoukat-Mumtaz U, et al. (2013). A cellular model for sporadic ALS using patient-derived induced pluripotent stem cells. Mol. Cell. Neurosci 56, 355–364. [DOI] [PMC free article] [PubMed] [Google Scholar]
- Chambers SM, Fasano CA, Papapetrou EP, Tomishima M, Sadelain M, and Studer L. (2009). Highly efficient neural conversion of human ES and iPS cells by dual inhibition of SMAD signaling. Nat. Biotechnol 27, 275–280. [DOI] [PMC free article] [PubMed] [Google Scholar]
- Chou CC, Zhang Y, Umoh ME, Vaughan SW, Lorenzini I, Liu F, Sayegh M, Donlin-Asp PG, Chen YH, Duong DM, et al. (2018). TDP-43 pathology disrupts nuclear pore complexes and nucleocytoplasmic transport in ALS/FTD. Nat. Neurosci 21, 228–239. [DOI] [PMC free article] [PubMed] [Google Scholar]
- Cox J, and Mann M. (2008). MaxQuant enables high peptide identification rates, individualized p.p.b.-range mass accuracies and proteome-wide protein quantification. Nat. Biotechnol 26, 1367–1372. [DOI] [PubMed] [Google Scholar]
- Dewey CM, Cenik B, Sephton CF, Johnson BA, Herz J, and Yu G. (2012). TDP-43 aggregation in neurodegeneration: are stress granules the key? Brain Res. 1462, 16–25. [DOI] [PMC free article] [PubMed] [Google Scholar]
- Dobin A, Davis CA, Schlesinger F, Drenkow J, Zaleski C, Jha S, Batut P, Chaisson M, and Gingeras TR (2013). STAR: ultrafast universal RNA-seq aligner. Bioinformatics 29, 15–21. [DOI] [PMC free article] [PubMed] [Google Scholar]
- Du ZW, Chen H, Liu H, Lu J, Qian K, Huang CL, Zhong X, Fan F, and Zhang SC (2015). Generation and expansion of highly pure motor neuron progenitors from human pluripotent stem cells. Nat. Commun 6, 6626. [DOI] [PMC free article] [PubMed] [Google Scholar]
- Ederle H, Funk C, Abou-Ajram C, Hutten S, Funk EBE, Kehlenbach RH, Bailer SM, and Dormann D. (2018). Nuclear egress of TDP-43 and FUS occurs independently of Exportin-1/CRM1. Sci. Rep 8, 7084. [DOI] [PMC free article] [PubMed] [Google Scholar]
- Fallini C, Khalil B, Smith CL, and Rossoll W. (2020). Traffic jam at the nuclear pore: All roads lead to nucleocytoplasmic transport defects in ALS/FTD. Neurobiol. Dis 140, 104835. [DOI] [PMC free article] [PubMed] [Google Scholar]
- Fang MY, Markmiller S, Vu AQ, Javaherian A, Dowdle WE, Jolivet P, Bushway PJ, Castello NA, Baral A, Chan MY, et al. (2019). Small-Molecule Modulation of TDP-43 Recruitment to Stress Granules Prevents Persistent TDP-43 Accumulation in ALS/FTD. Neuron 103, 802–819.e11. [DOI] [PMC free article] [PubMed] [Google Scholar]
- Fernandes N, Nero L, Lyons SM, Ivanov P, Mittelmeier TM, Bolger TA, and Buchan JR (2020). Stress Granule Assembly Can Facilitate but Is Not Required for TDP-43 Cytoplasmic Aggregation. Biomolecules 10, 1367. [DOI] [PMC free article] [PubMed] [Google Scholar]
- Gasset-Rosa F, Lu S, Yu H, Chen C, Melamed Z, Guo L, Shorter J, Da Cruz S, and Cleveland DW (2019). Cytoplasmic TDP-43 De-mixing Independent of Stress Granules Drives Inhibition of Nuclear Import, Loss of Nuclear TDP-43, and Cell Death. Neuron 102, 339–357.e7. [DOI] [PMC free article] [PubMed] [Google Scholar]
- Gendron JM, Webb K, Yang B, Rising L, Zuzow N, and Bennett EJ (2016). Using the Ubiquitin-modified Proteome to Monitor Distinct and Spatially Restricted Protein Homeostasis Dysfunction. Mol. Cell Proteomics 15, 2576–2593. [DOI] [PMC free article] [PubMed] [Google Scholar]
- Gore A, Li Z, Fung HL, Young JE, Agarwal S, Antosiewicz-Bourget J, Canto I, Giorgetti A, Israel MA, Kiskinis E, et al. (2011). Somatic coding mutations in human induced pluripotent stem cells. Nature 471, 63–67. [DOI] [PMC free article] [PubMed] [Google Scholar]
- Hochberg-Laufer H, Schwed-Gross A, Neugebauer KM, and Shav-Tal Y. (2019). Uncoupling of nucleo-cytoplasmic RNA export and localization during stress. Nucleic Acids Res. 47, 4778–4797. [DOI] [PMC free article] [PubMed] [Google Scholar]
- Jain S, Wheeler JR, Walters RW, Agrawal A, Barsic A, and Parker R. (2016). ATPase-Modulated Stress Granules Contain a Diverse Proteome and Substructure. Cell 164, 487–498. [DOI] [PMC free article] [PubMed] [Google Scholar]
- Jambor H, Surendranath V, Kalinka AT, Mejstrik P, Saalfeld S, and Tomancak P. (2015). Systematic imaging reveals features and changing localization of mRNAs in Drosophila development. eLife 4, e05003. [DOI] [PMC free article] [PubMed] [Google Scholar]
- Kedersha N, Panas MD, Achorn CA, Lyons S, Tisdale S, Hickman T, Thomas M, Lieberman J, McInerney GM, Ivanov P, and Anderson P. (2016). G3BP-Caprin1-USP10 complexes mediate stress granule condensation and associate with 40S subunits. J. Cell Biol. 212, 845–860. [DOI] [PMC free article] [PubMed] [Google Scholar]
- Kim HJ, Kim NC, Wang YD, Scarborough EA, Moore J, Diaz Z, MacLea KS, Freibaum B, Li S, Molliex A, et al. (2013). Mutations in prion-like domains in hnRNPA2B1 and hnRNPA1 cause multisystem proteinopathy and ALS. Nature 495, 467–473. [DOI] [PMC free article] [PubMed] [Google Scholar]
- Klim JR, Williams LA, Limone F, Guerra San Juan I, Davis-Dusenbery BN, Mordes DA, Burberry A, Steinbaugh MJ, Gamage KK, Kirchner R, et al. (2019). ALS-implicated protein TDP-43 sustains levels of STMN2, a mediator of motor neuron growth and repair. Nat. Neurosci 22, 167–179. [DOI] [PMC free article] [PubMed] [Google Scholar]
- Krach F, Batra R, Wheeler EC, Vu AQ, Wang R, Hutt K, Rabin SJ, Baughn MW, Libby RT, Diaz-Garcia S, et al. (2018). Transcriptome-pathology correlation identifies interplay between TDP-43 and the expression of its kinase CK1E in sporadic ALS. Acta Neuropathol. 136, 405–423. [DOI] [PMC free article] [PubMed] [Google Scholar]
- Lee KH, Zhang P, Kim HJ, Mitrea DM, Sarkar M, Freibaum BD, Cika J, Coughlin M, Messing J, Molliex A, et al. (2016). C9orf72 Dipeptide Repeats Impair the Assembly, Dynamics, and Function of Membrane-Less Organelles. Cell 167, 774–788.e17. [DOI] [PMC free article] [PubMed] [Google Scholar]
- Lefebvre FA, Cody NAL, Bouvrette LPB, Bergalet J, Wang X, and Lécuyer E. (2017). CeFra-seq: Systematic mapping of RNA subcellular distribution properties through cell fractionation coupled to deep-sequencing. Methods 126, 138–148. [DOI] [PubMed] [Google Scholar]
- Liao Y, Smyth GK, and Shi W. (2014). featureCounts: an efficient general purpose program for assigning sequence reads to genomic features. Bioinformatics 30, 923–930. [DOI] [PubMed] [Google Scholar]
- Lin Y, Mori E, Kato M, Xiang S, Wu L, Kwon I, and McKnight SL (2016). Toxic PR Poly-Dipeptides Encoded by the C9orf72 Repeat Expansion Target LC Domain Polymers. Cell 167, 789–802.e12. [DOI] [PMC free article] [PubMed] [Google Scholar]
- Liu EY, Russ J, Cali CP, Phan JM, Amlie-Wolf A, and Lee EB (2019). Loss of Nuclear TDP-43 Is Associated with Decondensation of LINE Retrotransposons. Cell Rep. 27, 1409–1421.e6. [DOI] [PMC free article] [PubMed] [Google Scholar]
- Lovci MT, Ghanem D, Marr H, Arnold J, Gee S, Parra M, Liang TY, Stark TJ, Gehman LT, Hoon S, et al. (2013). Rbfox proteins regulate alternative mRNA splicing through evolutionarily conserved RNA bridges. Nat. Struct. Mol. Biol 20, 1434–1442. [DOI] [PMC free article] [PubMed] [Google Scholar]
- Love MI, Huber W, and Anders S. (2014). Moderated estimation of fold change and dispersion for RNA-seq data with DESeq2. Genome Biol. 15, 550. [DOI] [PMC free article] [PubMed] [Google Scholar]
- Mackenzie IR, Nicholson AM, Sarkar M, Messing J, Purice MD, Pottier C, Annu K, Baker M, Perkerson RB, Kurti A, et al. (2017). TIA1 Mutations in Amyotrophic Lateral Sclerosis and Frontotemporal Dementia Promote Phase Separation and Alter Stress Granule Dynamics. Neuron 95, 808–816.e9. [DOI] [PMC free article] [PubMed] [Google Scholar]
- Mann JR, Gleixner AM, Mauna JC, Gomes E, DeChellis-Marks MR, Needham PG, Copley KE, Hurtle B, Portz B, Pyles NJ, et al. (2019). RNA Binding Antagonizes Neurotoxic Phase Transitions of TDP-43. Neuron 102, 321–338.e8. [DOI] [PMC free article] [PubMed] [Google Scholar]
- Marçais G, and Kingsford C. (2011). A fast, lock-free approach for efficient parallel counting of occurrences of k-mers. Bioinformatics 27, 764–770. [DOI] [PMC free article] [PubMed] [Google Scholar]
- Markmiller S, Soltanieh S, Server KL, Mak R, Jin W, Fang MY, Luo EC, Krach F, Yang D, Sen A, et al. (2018). Context-Dependent and Disease-Specific Diversity in Protein Interactions within Stress Granules. Cell 172, 590–604.e13. [DOI] [PMC free article] [PubMed] [Google Scholar]
- Martin M. (2011). Cutadapt removes adapter sequences from high-throughput sequencing reads. EMBnet.journal 17. 10.14806/ej.17.1.200. [DOI] [Google Scholar]
- Martin M. (2011). Cutadapt removes adapter sequences from high-throughput sequencing reads. EMBnetjournal 17, 10–12. [Google Scholar]
- Martinez FJ, Pratt GA, Van Nostrand EL, Batra R, Huelga SC, Kapeli K, Freese P, Chun SJ, Ling K, Gelboin-Burkhart C, et al. (2016). Protein-RNA Networks Regulated by Normal and ALS-Associated Mutant HNRNPA2B1 in the Nervous System. Neuron 92, 780–795. [DOI] [PMC free article] [PubMed] [Google Scholar]
- Mejzini R, Flynn LL, Pitout IL, Fletcher S, Wilton SD, and Akkari PA (2019). ALS Genetics, Mechanisms, and Therapeutics: Where Are We Now? Front. Neurosci 13, 1310. [DOI] [PMC free article] [PubMed] [Google Scholar]
- Melamed Z, López-Erauskin J, Baughn MW, Zhang O, Drenner K, Sun Y, Freyermuth F, McMahon MA, Beccari MS, Artates JW, et al. (2019). Premature polyadenylation-mediated loss of stathmin-2 is a hallmark of TDP-43-dependent neurodegeneration. Nat. Neurosci 22, 180–190. [DOI] [PMC free article] [PubMed] [Google Scholar]
- Miyaoka Y, Chan AH, Judge LM, Yoo J, Huang M, Nguyen TD, Lizarraga PP, So PL, and Conklin BR (2014). Isolation of single-base genome-edited human iPS cells without antibiotic selection. Nat. Methods 11, 291–293. [DOI] [PMC free article] [PubMed] [Google Scholar]
- Murakami T, Qamar S, Lin JQ, Schierle GS, Rees E, Miyashita A, Costa AR, Dodd RB, Chan FT, Michel CH, et al. (2015). ALS/FTD Mutation-Induced Phase Transition of FUS Liquid Droplets and Reversible Hydrogels into Irreversible Hydrogels Impairs RNP Granule Function. Neuron 88, 678–690. [DOI] [PMC free article] [PubMed] [Google Scholar]
- Namkoong S, Ho A, Woo YM, Kwak H, and Lee JH (2018). Systematic Characterization of Stress-Induced RNA Granulation. Mol. Cell 70, 175–187.e8. [DOI] [PMC free article] [PubMed] [Google Scholar]
- Neumann M, Sampathu DM, Kwong LK, Truax AC, Micsenyi MC, Chou TT, Bruce J, Schuck T, Grossman M, Clark CM, et al. (2006). Ubiquitinated TDP-43 in frontotemporal lobar degeneration and amyotrophic lateral sclerosis. Science 314, 130–133. [DOI] [PubMed] [Google Scholar]
- Olarerin-George AO, and Jaffrey SR (2017). MetaPlotR: a Perl/R pipeline for plotting metagenes of nucleotide modifications and other transcriptomic sites. Bioinformatics 33, 1563–1564. [DOI] [PMC free article] [PubMed] [Google Scholar]
- Patel A, Lee HO, Jawerth L, Maharana S, Jahnel M, Hein MY, Stoynov S, Mahamid J, Saha S, Franzmann TM, et al. (2015). A Liquid- to-Solid Phase Transition of the ALS Protein FUS Accelerated by Disease Mutation. Cell 162, 1066–1077. [DOI] [PubMed] [Google Scholar]
- Pinarbasi ES, Cağatay T, Fung HYJ, Li YC, Chook YM, and Thomas PJ (2018). Active nuclear import and passive nuclear export are the primary determinants of TDP-43 localization. Sci. Rep 8, 7083. [DOI] [PMC free article] [PubMed] [Google Scholar]
- Polymenidou M, Lagier-Tourenne C, Hutt KR, Huelga SC, Moran J, Liang TY, Ling SC, Sun E, Wancewicz E, Mazur C, et al. (2011). Long pre-mRNA depletion and RNA missplicing contribute to neuronal vulnerability from loss of TDP-43. Nat. Neurosci 14, 459–468. [DOI] [PMC free article] [PubMed] [Google Scholar]
- Ratti A, Gumina V, Lenzi P, Bossolasco P, Fulceri F, Volpe C, Bardelli D, Pregnolato F, Maraschi A, Fornai F, et al. (2020). Chronic stress induces formation of stress granules and pathological TDP-43 aggregates in human ALS fibroblasts and iPSC-motoneurons. Neurobiol. Dis 145, 105051. [DOI] [PubMed] [Google Scholar]
- Rousseaux MW, de Haro M, Lasagna-Reeves CA, De Maio A, Park J, Jafar-Nejad P, Al-Ramahi I, Sharma A, See L, Lu N, et al. (2016). TRIM28 regulates the nuclear accumulation and toxicity of both alpha-synuclein and tau. eLife 5, e19809. [DOI] [PMC free article] [PubMed] [Google Scholar]
- Rousseaux MW, Revelli JP, Vázquez-Vélez GE, Kim JY, Craigen E, Gonzales K, Beckinghausen J, and Zoghbi HY (2018). Depleting Trim28 in adult mice is well tolerated and reduces levels of a-synuclein and tau. eLife 7, e36768. [DOI] [PMC free article] [PubMed] [Google Scholar]
- Skibinski G, and Finkbeiner S. (2013). Longitudinal measures of proteostasis in live neurons: features that determine fate in models of neurodegenerative disease. FEBS Lett. 587, 1139–1146. [DOI] [PubMed] [Google Scholar]
- Solnestam BW, Stranneheim H, Hällman J, Käller M, Lundberg E, Lundeberg J, and Akan P. (2012). Comparison of total and cytoplasmic mRNA reveals global regulation by nuclear retention and miRNAs. BMC Genomics 13, 574. [DOI] [PMC free article] [PubMed] [Google Scholar]
- Strom AR, Emelyanov AV, Mir M, Fyodorov DV, Darzacq X, and Karpen GH (2017). Phase separation drives heterochromatin domain formation. Nature 547, 241–245. [DOI] [PMC free article] [PubMed] [Google Scholar]
- Taha MS, Haghighi F, Stefanski A, Nakhaei-Rad S, Kazemein Jasemi NS, Al Kabbani MA, Görg B, Fujii M, Lang PA, Häussinger D, et al. (2021). Novel FMRP interaction networks linked to cellular stress. FEBS J. 288, 837–860. [DOI] [PubMed] [Google Scholar]
- Tamaki Y, Shodai A, Morimura T, Hikiami R, Minamiyama S, Ayaki T, Tooyama I, Furukawa Y, Takahashi R, and Urushitani M. (2018). Elimination of TDP-43 inclusions linked to amyotrophic lateral sclerosis by a misfolding-specific intrabody with dual proteolytic signals. Sci. Rep 8, 6030. [DOI] [PMC free article] [PubMed] [Google Scholar]
- Van Nostrand EL, Pratt GA, Shishkin AA, Gelboin-Burkhart C, Fang MY, Sundararaman B, Blue SM, Nguyen TB, Surka C, Elkins K, et al. (2016). Robust transcriptome-wide discovery of RNA-binding protein binding sites with enhanced CLIP (eCLIP). Nat. Methods 13, 508–514. [DOI] [PMC free article] [PubMed] [Google Scholar]
- Wang ET, Cody NA, Jog S, Biancolella M, Wang TT, Treacy DJ, Luo S, Schroth GP, Housman DE, Reddy S, et al. (2012a). Transcriptome-wide regulation of pre-mRNA splicing and mRNA localization by muscleblind proteins. Cell 150, 710–724. [DOI] [PMC free article] [PubMed] [Google Scholar]
- Wang IF, Guo BS, Liu YC, Wu CC, Yang CH, Tsai KJ, and Shen CK (2012b). Autophagy activators rescue and alleviate pathogenesis of a mouse model with proteinopathies of the TAR DNA-binding protein 43. Proc. Natl. Acad. Sci. USA 109, 15024–15029. [DOI] [PMC free article] [PubMed] [Google Scholar]
- Zhang K, Donnelly CJ, Haeusler AR, Grima JC, Machamer JB, Steinwald P, Daley EL, Miller SJ, Cunningham KM, Vidensky S, et al. (2015). The C9orf72 repeat expansion disrupts nucleocytoplasmic transport. Nature 525, 56–61. [DOI] [PMC free article] [PubMed] [Google Scholar]
- Zhang K, Daigle JG, Cunningham KM, Coyne AN, Ruan K, Grima JC, Bowen KE, Wadhwa H, Yang P, Rigo F, et al. (2018). Stress Granule Assembly Disrupts Nucleocytoplasmic Transport. Cell 173, 958–971.e17. [DOI] [PMC free article] [PubMed] [Google Scholar]
Associated Data
This section collects any data citations, data availability statements, or supplementary materials included in this article.
Supplementary Materials
Data Availability Statement
All CeFra-seq and eCLIP data have been deposited at GEO and are publicly available as of the date of publication. Accession numbers are listed in the key resources table. Raw mass spectrometry data reported in this paper will be shared by the lead contact upon request
This paper does not report original code.
Any additional information required to reanalyze the data reported in this paper is available from the lead contact upon request.
KEY RESOURCES TABLE
| REAGENT or RESOURCE | SOURCE | IDENTIFIER |
|---|---|---|
|
| ||
| Antibodies | ||
|
| ||
| Rabbit polyclonal anti-G3BP1 | MBL International | Cat#RN048PW; RRID:AB_10794608 |
| Mouse monoclonal anti-G3BP1 | EMD Millipore | Cat#05–1938; RRID:AB_10561767 |
| Rabbit polyclonal anti-TARDBP | Abnova | Cat#H00023435-A01; RRID:AB_461752 |
| Rabbit polyclonal anti-Isl1/2 | Santa Cruz Biotech | Cat#sc-30200; RRID:AB_2126589 |
| Mouse monoclonal anti-SMI-31 | EMD Millipore | Cat#NE1022; RRID:AB_2043448 |
| Rabbit polyclonal anti-DAZAP1 | Novus Biologicals | Cat#NBP1–82741; RRID:AB_11002177 |
| Rabbit polyclonal anti-KAP1 | Novus Biologicals | Cat# NBP2–39014 |
| Mouse monoclonal anti-CUGBP1/CELF1 | Novus Biologicals | Cat# NB200–316SS; RRID:AB_921076 |
|
| ||
| Chemicals, peptides, and recombinant proteins | ||
|
| ||
| Dorsomorphin | Tocris | Cat#3093 |
| SB431542 | Tocris | Cat#1614 |
| Retinoic Acid | Sigma | Cat#R2625 |
| SAG | EMD Millipore | Cat#566660 |
| DAPT | Tocris | Cat#2634 |
| CHIR 99021 | Tocris | Cat#4423 |
| Purmorphamine | Tocris | Cat#4551 |
| DMH-1 | Tocris | Cat#4126 |
| Valproic acid | Tocris | Cat#2815 |
| Puromycin | Thermo Fisher | Cat#A1113803 |
|
| ||
| Deposited data | ||
|
| ||
| CeFra-seq data | This paper | GEO: GSE157467 |
| seCLIP data | This paper | GEO: GSE157467 |
|
| ||
| Experimental models: cell lines | ||
|
| ||
| H9 ESCs (46, XX) | Yeo lab stocks | N/A |
| H1 ESCs (46, XY) | Yeo lab stocks | N/A |
| Kin2ALS6 iPSCs (46, XY) | Generated in-house, described in Fang et al., 2019 | N/A |
| CV-B iPSCs (46, XY) | (Gore et al., 2011) | N/A |
| hnRNPA2/B1 D290V-1.1 hiPSC (46, XX) (also referred to as CR463.4) | Generated in-house, described in Martinez et al., 2016 | N/A |
| hnRNPA2/B1 D290V-1.2 hiPSC (46, XX) (also referred to as CR464.2) | Generated in-house, described in Martinez et al., 2016 | N/A |
|
| ||
| Software and algorithms | ||
|
| ||
| MaxQuant (version 1.6.0.16) | Cox and Mann, 2008 | N/A |
| STAR (v2.4.0i) | Dobin et al., 2013 | N/A |
| Cutadapt (v1.14) | (Martin, 2011) | N/A |
| CLIPper | Lovci et al., 2013 | N/A |
| DeSeq2 | Love et al., 2014 | N/A |
| metaplotR | Olarerin-George and Jaffrey, 2017 | N/A |
| featureCounts | Liao et al., 2014 | N/A |
| Jellyfish (v2.0) | Marçais and Kingsford, 2011 | N/A |