Abstract
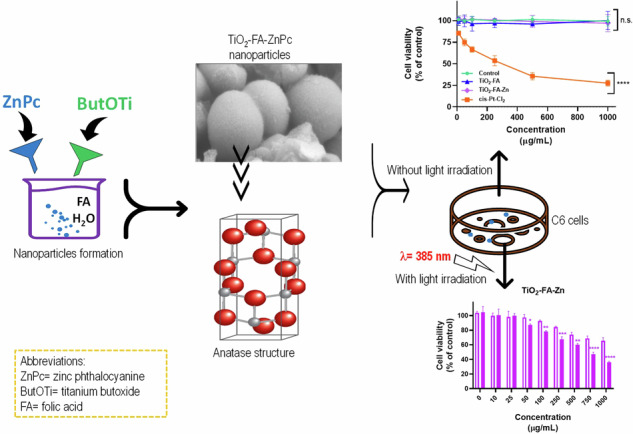
The use of TiO2 as a photosensitizer in photodynamic therapy is limited due to TiO2 generates reactive oxygen species only under UV irradiation. The TiO2 surface has been modified with different functional groups to achieve activation at longer wavelengths (visible light). This work reports the synthesis, characterization, and biological toxicity assay of TiO2 nanoparticles functionalized with folic acid and combined with a zinc phthalocyanine to obtain a nano-photosensitizer for its application in photodynamic therapy for glioblastoma cancer treatment. The nano-photosensitizer was prepared using the sol-gel method. Folic acid and zinc phthalocyanine were added during the hydrolysis and condensation of titanium butoxide, which was the TiO2 precursor. The samples obtained were characterized by several microscopy and spectroscopy techniques. An in vitro toxicity test was performed using the MTT assay and the C6 cellular line. The results of the characterization showed that the structure of the nanoparticles corresponds mainly to the anatase phase. Successful functionalization with folic acid and an excellent combination with phthalocyanine was also achieved. Both folic acid-functionalized TiO2 and phthalocyanine-functionalized TiO2 had no cytotoxic effect on C6 cells (even at high concentrations) in comparison to Cis-Pt, which was very toxic to C6 cells. The materials behaved similarly to the control (untreated cells). The cell viability and light microscopy images suggest that both materials could be considered biocompatible and mildly phototoxic in these cells when activated by light.
Graphical Abstract
Introduction
Glioblastoma (GBM) is the most common primary and malignant central nervous system tumor, occurring primarily in adults 65 years and older [1]. Although it is a rare tumor, it is responsible for 4% of all tumor deaths. GBM is associated with a poor prognosis, as these tumors are resistant to all current therapeutic advances and often recur within months of aggressive treatment. Median survival after initial diagnosis is 15 months. The current standard of care is trimodality therapy, which includes maximal safe tumor removal followed by local radiation and concurrent adjuvant chemotherapy with temozolomide [2]. Tumor progression after surgical resection is also common, with lethality expected within 1 year. Tumor cells remaining at the edge of the cavity after surgical removal of the mass appear to be resistant to standard treatments, as most GBMs rapidly relapse 2–3 cm from the original tumor site, giving rise to more aggressive and resistant forms of cancer [1].
Photodynamic therapy (PDT) is a promising and clinically approved, less invasive treatment for several medical conditions, including skin diseases, localized infections, age-related macular degeneration, and premalignant and malignant disorders (various cancers) [3, 4]. Like surgery and radiotherapy (RT), PDT is a local treatment that can be used alone or in combination with currently used cancer therapies such as radiation and chemotherapy. Specifically, PDT has been used in the clinic to treat several types of cancer, including bladder, neck, esophageal, non-small cell lung, and head cancers [5, 6]. PDT is characterized by non-invasiveness, minimal systemic toxicity, and high tumor selectivity, unlike chemotherapeutic drugs that cause systemic side effects and ionizing radiation from radiotherapy that damages normal tissues [7].
In PDT, a photosensitizer (PS) is first administered systemically or topically, allowing time for it to accumulate in the target tissue. Then a specific wavelength of light is applied for several hours. Thus, the photosensitizer absorbs a photon and enters its excited singlet state, giving rise to its long-lived excited triplet state [8, 9]. The triplet excited species can react with molecular oxygen to produce reactive oxygen species (ROS), such as singlet oxygen (1O2), superoxide anions (O2-•), hydroxyl radicals (OH•), and hydrogen peroxide (H2O2), which can kill cancer cells. However, the excited photosensitizer can return to its ground state in several ways, including photon emission (fluorescence), which can be used for photodynamic diagnosis by fluorescence imaging. The triplet state can either undergo electron transfer with organic substrates to form radical species (type I reaction) or react directly with ground-state oxygen to form singlet oxygen, a highly ROS (type II reaction) [9]. Most photosensitization reactions are considered Type II, but both can occur simultaneously. The rate of Type I and Type II reaction depends on the biochemical properties of the photosensitizer and cell substrates and the binding affinity of the sensitizer for the substrate. In PDT, ROS generated on cancer cells cause irreversible oxidation of one or more critical cellular components, including plasma membranes, mitochondria, endoplasmic reticulum, and lysosomes, resulting in cellular damage and thus cancer death either by apoptosis or necrosis, vascular collapse, tissue destruction, or cell death [5, 8, 10].
In PDT experiments, natural and synthetic dyes have been tested as photosensitizers in vitro and in vivo [9, 11–14]. Most photosensitizers have a heterocyclic ring structure similar to that of chlorophyll or heme in hemoglobin. Phthalocyanines have been developed as photosensitizers for PDT. Effective photosensitization requires a long-lived triplet state, which has been achieved by incorporating a diamagnetic metal such as Zn or Al with a high absorption coefficient into the phthalocyanine macrocycle, and optical stability has been achieved in clinical practice [9, 15]. However, a disadvantage of these PS is their tendency to aggregate, resulting in short triplet lifetimes and reduced 1O2 yields. In addition, their low solubility, poor light absorption, cutaneous photosensitivity, low selectivity for target tissues, and π-π stacking in these molecules limit their further clinical application [5, 9, 16].
To overcome these drawbacks, nanomaterials (NMs) appear as potential carriers of photosensitizers and new PS promising for PDT [17–22]. NMs range in size from 1 to 100 nm, and their high surface-to-volume ratio would allow for improved PS loading [23]. The combination of NMs with PS drugs has recently received considerable attention in PDT. Among the wide variety of NMs are quantum dots (QDs), up-conversion NPs (UCNPs), silica NPs, plasmonic NPs, carbon NMs, polymeric NPs, liposomes, and micelles have been combined with PS drugs and applied in PDT both in vitro and in vivo [24–31]. Specifically, metal or metal oxide NPs can generate ROS when irradiated with light and induce cell death [32, 33].
Titanium dioxide (TiO2) is one of the best-known metal oxides; as a semiconductor, it generates large amounts of ROS when excited by UV light [34, 35]. It also has many relevant properties, such as low-cost availability, chemical stability, high photostability, high photocatalytic activity, non-toxicity, and safety for humans and the environment. Although TiO2 is used in classical areas such as solar cells, electrochromic devices, dye-sensitized solar cells, self-cleaning coatings, cosmetics, paints, food, and photocatalysis for environmental remediation, it also has biomedical applications [34, 36, 37]. TiO2 can be obtained synthetically mainly by sol-gel, hydrothermal, green chemistry, and microwave methods. In the last two decades, TiO2 has attracted attention for its application in PDT because it is known as TiO2 in aqueous media and under UV light irradiation produces ROS species such as hydroxyl radical, hydrogen peroxide and superoxide, which causes a remarkable photodeath effect against cancer cells, causing them severe oxidative stress and consequently apoptosis. TiO2 NPs have been reported to be used as a PDT agent in various cancer cells, such as bladder cancer cells, cervical cancer cells, non-small cell lung cancer, human skin cancer cells, breast cancer cells, and Leukemic HL60 Cells [38–43]. Although TiO2 is a potential ROS-generating agent, it can only be photo-excited by UV light, which limits its use in PDT since the approved therapeutic window is at wavelengths of 700–1100 nm. For this reason, TiO2 has been modified to absorb long-wavelength light in the visible or NIR range. Titanium dioxide has been doped with a variety of metal and non-metal ions and combined with a variety of dyes [44–47]. Among the organic dyes, porphyrins and phthalocyanines are the most commonly used in combination with TiO2, with better absorption in the visible range, proving to be potential photosensitizers in the application of photodynamic therapy [48]. In addition, various ligands such as monoclonal antibodies, phages or folic acid can be coupled to the nanoparticle surface in the photosensitizer-nanoparticle complexes for more selective accumulation [48–52].
For this work, TiO2 was functionalized with folic acid for its selective accumulation preferentially in tumor cells. It has also been loaded with ZnPc to increase its light absorption spectrum so that it can be activated and used in photodynamic therapy against GBM cancer.
Material and methods
Chemicals
The chemicals used to prepare the different materials are listed below. Folic acid (FA) [Sigma-Aldrich, ≥97%], zinc phthalocyanine (ZnPc) [Sigma-Aldrich, 97%], titanium butoxide [Fluka, ≥97%], absolute ethyl alcohol [Alfimex, 96%], deionized water [HYCEL]. On the other hand, the chemical and biological substances used in this work are listed below: C6 glial cell line (CCL-107, ATCC), fetal bovine serum (Biowest), Dulbecco’s Modified Eagle’s (DMEM), trypsin-EDTA, penicillin and streptomycin [Gibco, Invitrogen], and MTT cell proliferation kit [Roche].
Materials preparation
The molar ratios of titanium butoxide: water (1:16), titanium butoxide: ethyl alcohol (1:8) and ZnPc: TiO2 (1:10) were the amount used, and 1 mol% of folic acid.
TiO2-FA
In a mix of water and ethyl alcohol, folic acid was dissolved and kept under stirring until FA dissolution. Next, titanium butoxide was added slowly to the solution. The final mixture was stirred for 24 h until the gel formed. The water and ethanol excess were removed by evaporation. Finally, the sample was dried at 60 °C.
TiO2-FA-ZnPc
Folic acid was dissolved in a mix of water and ethanol and kept under stirring until FA dissolution. Next, titanium butoxide was added slowly to the solution. The final mixture was stirred for 12 h, and the ZnPc was added. Afterward, the solution was stirred for 12 h until the gel formed. The excess water and alcohol were removed by evaporation. Finally, the sample was dried at 60 °C.
Physicochemical characterization
N2 adsorption-desorption
The N2 adsorption-desorption isotherms were obtained at N2 liquid temperature using Belsorpt II-BEL equipment. The surface area was obtained from the adsorption isotherms through the BET method. The pore sizes and pore volumes were obtained from the desorption isotherms using the BJH method. Before the N2 measurements, the samples were pretreated thermally at 60 °C for 12 h under a vacuum.
Fourier Transform Infrared spectroscopy (FTIR)
The KBr method was used to obtain the FTIR spectra. 5 mg of each solid sample was mixed and ground with 95 mg of potassium bromide (KBr). The mixture was then pressed into a translucent tablet and placed in an Affinity-1 Shimadzu spectrophotometer for measurement. The interval of analysis was at 4000–500 cm−1 wavenumber.
UV-Vis spectroscopy
Diffuse reflectance spectra of the powder samples were obtained using a Cary 100 UV–Vis spectrophotometer equipped with an integrating sphere and using BaSO4 as the baseline reference. A small amount of sample was placed uniformly on the sample holder which is closed with a transparent quartz cap to prevent the sample from moving as it is introduced vertically into the equipment. The wavelength interval was from 190 to 900 nm.
X-Ray diffraction (XRD)
The sample holder was filled with the previously ground sample to form a completely uniform surface. The sample holder was then placed in the x-ray diffractometer (Bruker D2 Phaser diffractometer) for measurement. Cu Kα radiation (λ = 1.5405 nm) was used, and the samples were analyzed at a throughput rate of 0.6°/sec.
Scanning electronic microscopy (SEM) and High-Resolution Transmission Electron Microscopy (HR-TEM)
The SEM images of the samples were obtained using a Quanta 3D FEG Microscope. A high-resolution transmission electron microscopy analysis was performed on a JEM 2100 microscope with a voltage from 80 to 200 kV filament LaB6. Samples were suspended in an isopropanol solution for application and placed in a sonicator to increase their dispersion. Then samples were placed on a copper plate and introduced into the equipment for measuring.
Biological assays
Cell culture
The C6 cell line was cultured in DMEM medium supplemented with 10% fetal bovine serum, 100 units/mL penicillin, and 100 μg/mL streptomycin. Cells were incubated at 37 °C with 95% humidity and 5% CO2 until adequate confluence was reached. Cells were harvested using trypsin (0.25%) and subcultured for biological studies after allowing them to adhere for 24 h.
MTT assay (3-[4,5-dimethylthiazol-2-yl]-2,5 diphenyl tetrazolium bromide or MTT)
Cells were seeded at a density of 1 × 10⁵ cells per well in a 96-well plate (n = 3) and treated with sequentially increasing concentrations of TiO2-FA, TiO2-FA-ZnPc, and Cis-Pt (0–1000 µg/mL). Treated and untreated cells were then incubated at 37 °C in 5% CO2 and 95% humidity for 24 or 72 h. MTT reagent was then added and incubated for 2 h. The resulting purple formazan salt crystals were then dissolved in 100 µL of solubilization buffer (10% sodium dodecyl sulfate, 0.01 N HCl) in each well. The absorbance of each well was recorded on a microplate reader at 570 and 630 nm. The cell viability was calculated by using the following formula: Cell viability (%) = (A570–A660 sample)/ (A570–A660 control) x 100%, where untreated cells were tested as controls.
Cell morphology. The cell morphology analysis was carried out by the cell’s observation after stimulation for 72 h. The images were recorded at 10X using a light microscope (Olympus CKX41).
Phototoxicity test
C6 cells were seeded at a concentration of 1 × 10⁵/well in a 96-well plate and allowed to grow overnight. The next day, they were incubated with different concentrations of photosensitizer (TiO2-FA and TiO2-FA-ZnPc) ranging from 0 to 1000 μg/mL. After 1 h, the treated cells were exposed to light from the top of the plate at a distance of 10 cm and irradiated with a 385 nm LED lamp for 15, 30, and 60 min. After incubation time (72 h), cellular viability was evaluated by MTT assay, as mentioned before. Cell exposure to light was carried out in a laminar hood at room temperature.
Statistical analysis
Two-way analysis of variance (ANOVA) followed by the Dunnett’s test or Ṧídak multiple comparison test and paired Student’s t test were performed. Results are expressed as mean ± SE. Statistical significance was considered when p < 0.05. Data were statistically performed using GraphPad Prism 9.4.1.
Results
Textural properties
Figure 1 shows the N2 adsorption-desorption isotherms of TiO2-FA and TiO2-FA-ZnPc samples. According to the International Union of Pure and Applied Chemistry (IUPAC) classification, both samples derived a type IV isotherm with a narrow hysteresis loop between 0.5 and 1.0 relative pressure. These isotherms are characteristic of mesoporous materials. At high relative pressures, no N2 adsorption was observed, indicating that no macropores were formed on the TiO2 network.
Fig. 1.
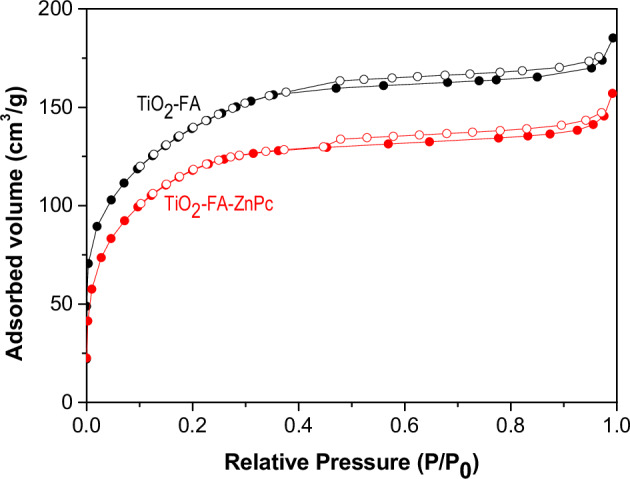
N2 adsorption-desorption isotherms of TiO2-FA and TiO2-FA-ZnPc samples. Filled black and red circles correspond to the adsorption isotherms, while empty black and red circles correspond to the desorption isotherms
Table 1 summarizes the textural properties of TiO2-FA and TiO2-FA-Zn Pc samples: Surface area (SBET), pore volume (PV) and pore diameter (PD). The surface area values are obtained from the adsorption isotherm using the BET equation. The surface area values were 476 and 397 m2/g for TiO2-FA and TiO2-FA-ZnPc, respectively. Approximately 16% of the surface area was reduced from TiO2-FA to TiO2-FA-ZnPc due to the ZnPc molecules occupying part of this space (surface area). The surface area reduction value is very close to the calculated theoretical value (10%) of ZnPc for TiO2 loading.
Table 1.
Texture values of the TiO2-FA and TiO2-FA-ZnPc samples
| Sample | SBET (m2/g) | PV (cm3/g) | PD (nm) |
|---|---|---|---|
| TiO2-FA | 476 | 0.28 | 2.40 |
| TiO2-FA-ZnPc | 397 | 0.24 | 2.40 |
Surface area (SBET) was obtained by the BET method; pore volume (PV) and average pore diameter (PD) were obtained by BJH theory
On the other hand, the pore volume and pore diameter were obtained from the desorption isotherms using the BJH theory. In our case, the pore volume decreased from 0.28 for TiO2-FA to 0.24 cm3/g for TiO2-FA-ZnPc since the pores were partially occupied by ZnPc molecules. In contrast, the pore diameter value was the same for both samples.
Fourier transform infrared spectroscopy
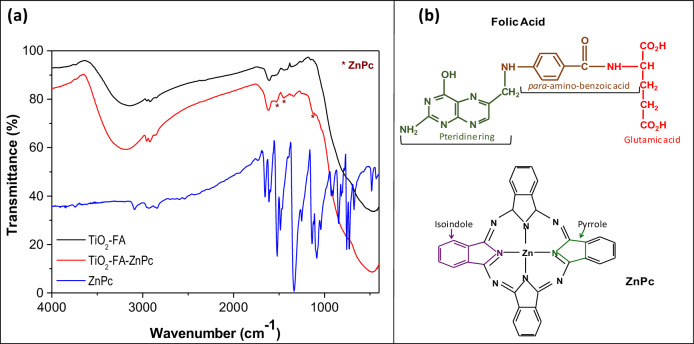
The infrared spectra of TiO2-FA, TiO2-FA-ZnPc, and ZnPc are shown in Fig. 2. The TiO2-FA spectrum shows a broad band mixed with other small bands between 3560 and 2500 cm−1. The broad band corresponds to OHs groups from surface hydroxyls and water molecules, but may also include amino group signals from folic acid. The small bands are associated with C-H vibrations of CH2 groups from the pteridine ring and glutamic acid groups in the FA chemical structure (see Fig. 2) [53]. Another set of bands is seen in a round of 1741–1130 cm−1, where the band centered at 1616 cm−1 is related to H2O, and the small band at 1525 cm−1 confirms the N-Ti bond formed during the functionalization of TiO2 with the activated folate [54]. Finally, the large and broad band located at 1096–400 cm−1 is characteristic of Ti-O bonds from the TiO2 network contributing more significantly.
Fig. 2.
a FT-IR spectra of TiO2-FA, ZnPc and TiO2-FA-ZnPc samples, (b) chemical structures of folic acid (FA) and Zinc phtalocyanine (ZnPc)
In the spectrum corresponding to TiO2-FA-ZnPc, the bands described above were also found. Signals identifying ZnPc are not observed due to the predominance of FA bands; however, some ZnPc-derived bands can be seen in their corresponding spectra, which are marked with asterisks (Fig. 2a). These signals may belong to vibrations from the isoindole and pyrrole cycles of ZnPc (Fig. 2b). Typically, metal phthalocyanines give strong signals in the 1000–1800 cm−1 region due to vibrations of the isoindole and pyrrole cycles, as seen in the ZnPc spectrum (Fig. 2a) [55]. Although TiO2-FA and TiO2-FA-ZnPc spectra look very similar, experimentally, the samples changed their color from yellow (characteristic of FA) to blue (a characteristic of ZnPc) was observed after TiO2-FA was loaded with ZnPc, indicating that the ZnPc was adequately loaded in TiO2-FA network.
X ray diffraction
The powder XRD patterns of the ZnPc, TiO2-FA, and TiO2-FA-ZnPc samples are shown in Fig. 3. ZnPc shows characteristic signals of its crystalline arrangement in its chemical structure, deriving signals at 2θ = 6.74, 8.77, 10.52, 14.74, 20.54, 23.57, and 26.51° corresponding to the crystalline planes of (001), (201), (200), (2001), (203), (110) and (214) of ZnPc, respectively. It can be observed that the XRD patterns of TiO2-FA and TiO2-FA-ZnPc samples are highly similar and show intense signals at 2θ = 25, 38, 48, 54, and 62° corresponding to the pure anatase crystalline phase [56]. The absence of characteristic peaks of ZnPc in the TiO2-FA-ZnPc sample may be due to its good dispersion on the surface of TiO2-FA, or the amount of ZnPc used was not sufficient to be detected by this technique. However, the samples changed from yellow to dark blue for TiO2-FA and TiO2-FA-ZnPc, respectively.
Fig. 3.
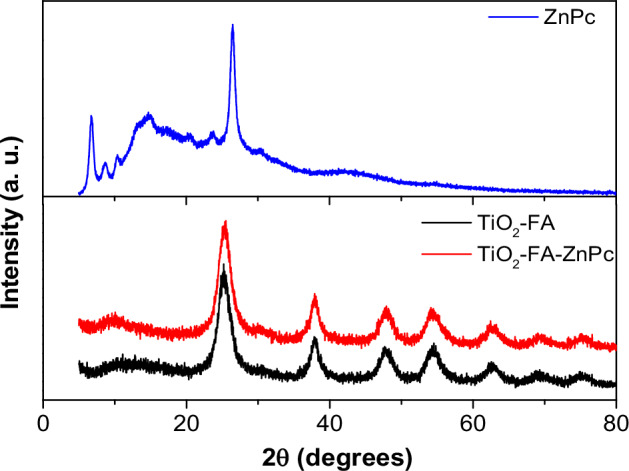
XRD patterns of TiO2-FA, TiO2-FA-ZnPc and ZnPc samples
UV-Vis spectroscopy
UV-Vis diffuse reflectance spectra of TiO2-FA, ZnPc, and TiO2-FA-ZnPc samples are shown in Fig. 4. In the TiO2-FA spectrum, the classical electronic transition of titania can be identified between 325 and 380 nm as a result of electron transitions from the 2p orbital of the oxygen atom to the d orbital of the titanium atoms. A band appears in the ZnPc spectrum at 544 nm due to interactions between the zinc atom and the heterocyclic ZnPc, where an electron is transferred from the macrocycle to the d-orbital of the zinc atom. The band at 717 nm results from the π-π electronic transitions on the phthalocyanine rings. In the TiO2-FA-ZnPc spectrum, in addition to the TiO2 transition, another broad band was observed in the visible region between 500 and 800 nm. This last zone has been zoomed in as shown in the inset of Fig. 4, where two small bands at 640 nm and 717 nm can be detected. The first results from the interaction between TiO2 and ZnPc, while the second is characteristic of the ZnPc, as mentioned above. Therefore, the conjunction of TiO2 and Zn Pc may be beneficial in improving the photosensitizing properties of TiO2-FA.
Fig. 4.
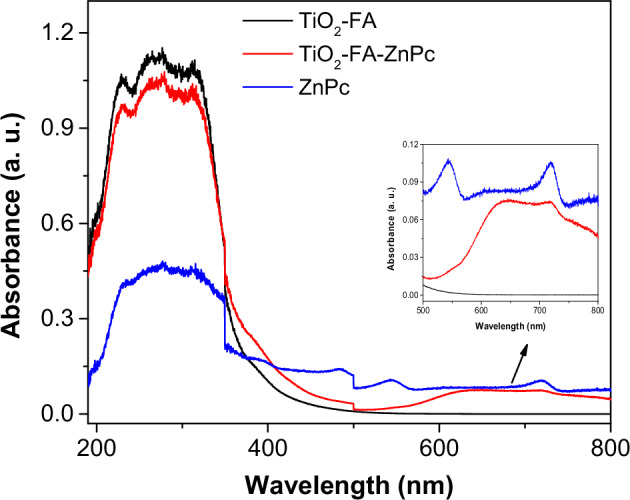
UV-Vis spectra of ZnPc, TiO2-FA, and TiO2-FA-ZnPc samples. The insert shows the zoomed intervals of 500–800 nm for all samples
Scanning electronic microscopy
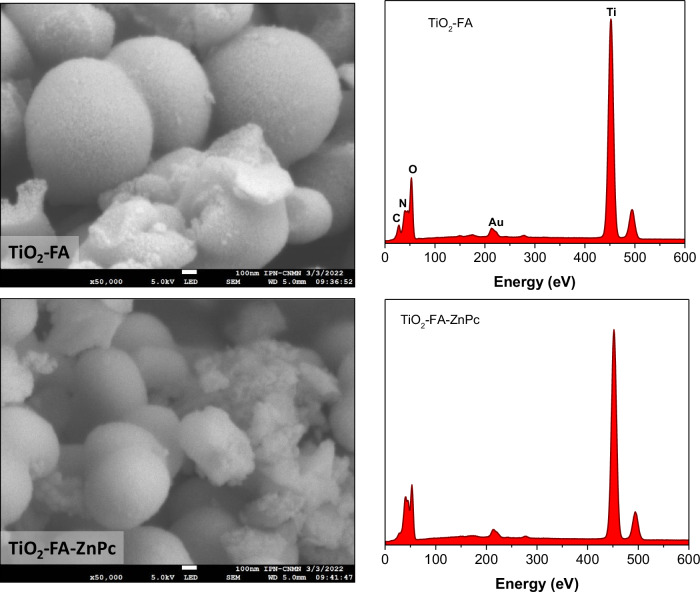
Figure 5 shows the scanning electronic micrograph and its corresponding EDS graph for each sample of TiO2-FA and TiO2-FA-ZnPc. The TiO2-FA image shows coarse spherical particles with sizes of approximately 200–500 nm. From its EDS graphic, C, N, O, and Ti atoms were identified, corresponding to TiO2 and folic acid used as functionalizing agent. In the TiO2-FA-ZnPc SEM micrograph, a similar morphology was observed where the identical particles mentioned above are seen combined with tiny particles that may be from the ZnPc molecules. The EDS graph for this sample shows the characteristic peaks of folic acid and TiO2 but does not identify Zn atoms. In both EDS graphs, a small peak appeared around 220 eV, which should be ignored because it is caused by the gold grid that supported the sample for measurement.
Fig. 5.
SEM image and its corresponding EDS graphic of TiO2-FA and TiO2-FA-ZnPc samples. The scale bar in each figure is equivalent to 100 nm
High resolution-transmission electronic microscopy
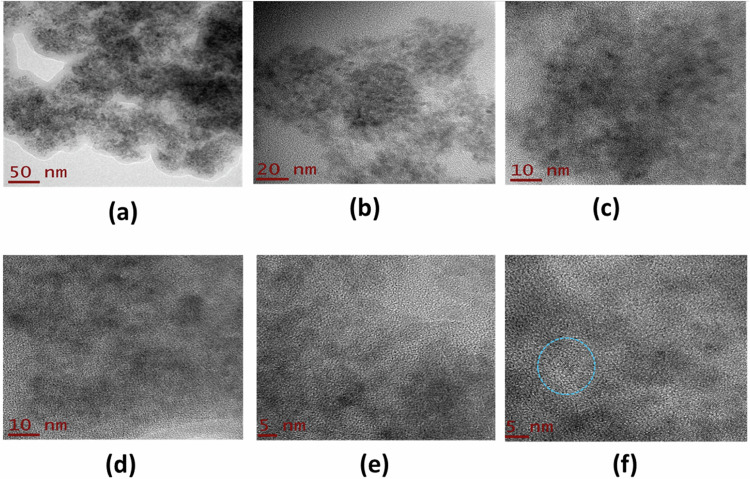
Figure 6 shows the HR-TEM images of the TiO2-FA sample at different magnifications. The morphology consists of aggregates of nanoparticles ranging in size from 2 to 10 nm that form a porous material. Since there are always electrostatic forces between these particles, they tend to clump together, resulting in nanoparticle clusters being formed (Fig. 6a–c). When the resolution is slightly increased, high crystallinity mixed with the amorphous phase is observed with the formation of polycrystals (Fig. 6d–f), where the orientation of the atomic planes is completely random. From these last figures, it is possible to appreciate the crystalline planes corresponding to the anatase phase (see blue circle) (Fig. 6f), as identified by X-ray diffraction results.
Fig. 6.
HR-TEM photographs of TiO2-FA sample taken at different resolutions. The scale in Figures is 50 nm (a), 20 nm (b), 10 nm (c, d), and 5 nm (e, f), respectively. The blue circle shows the crystallinity mixed with the amorphous phase with a higher proportion
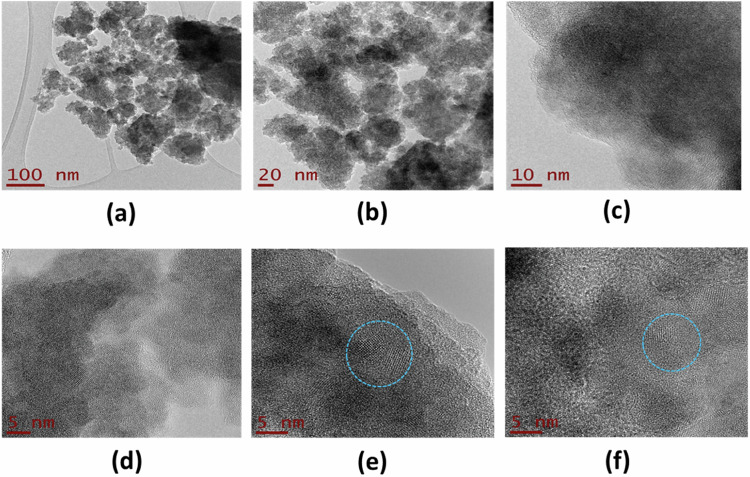
TEM micrographs of the TiO2-FA-ZnPc sample were taken at higher resolution and are shown in Fig. 7. Like the previous sample, the TiO2-FA-Zn sample presents a morphology consisting of aggregates of nanoparticles (Fig. 7a–c). The photographs from Fig. 7d–f clearly show the high crystallinity of the sample (see blue circles), corresponding to the anatase phase, and may be due to the presence of ZnPc, which is crystalline, as observed in the XRD study (Fig. 3). The average particle size is between 5 and 10 nm. It is also possible to keep the amorphous phase in a higher proportion mixed with the crystalline anatase phase of TiO2.
Fig. 7.
HR-TEM photographs of TiO2-FA-ZnPc sample taken at different resolutions. The scale in Figures is 100 nm (a), 20 nm (b), 10 nm (c), and 5 nm (d–f), respectively. The blue circles show the crystallinity observed in this sample mixed with the amorphous phase
Biological results
In vitro cell viability
The in vitro cell viability studies were performed using rat tumor cells known as the C6 cell line. Figure 8 shows the cell viability (% of control) versus increasing concentrations of TiO2-FA, TiO2-FA-ZnPc, and Cis-Pt used to treat the C6 cells, while untreated cells were the control. It can be assumed that the viability of untreated cells was 100%. As expected, cell viability decreases significantly in a dose-dependent manner when cells are treated with Cis-Pt. However, when cells were treated with increased TiO2-FA or TiO2-FA-ZnPc, even at high concentrations, cell viability remained the same as the control (untreated cells).
Fig. 8.
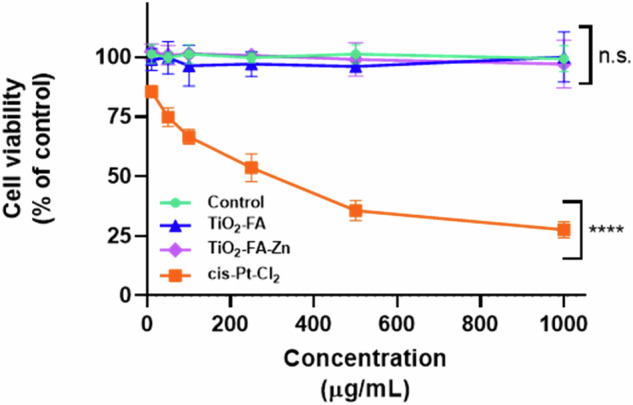
In vitro viability of C6 cells treated with increased concentrations (0–1000, µg/mL) of TiO2-FA, TiO2-FA-ZnPc, and Cis-Pt (as therapeutic control). Results are expressed as mean ± SE of n = 3 per group. Two-way analysis of variance (ANOVA) followed by the Dunnett’s test. Statistically significance was control vs TiO2-FA (p = 0.2862), vs TiO2-FA-ZnPc (p = 0.9963) and vs Cis-Pt (p = 0.0001). Statistical significance: p < 0.05 (*), p < 0.01 (**), p < 0.001 (***) and p < 0.0001 (****); n.s.= non significative
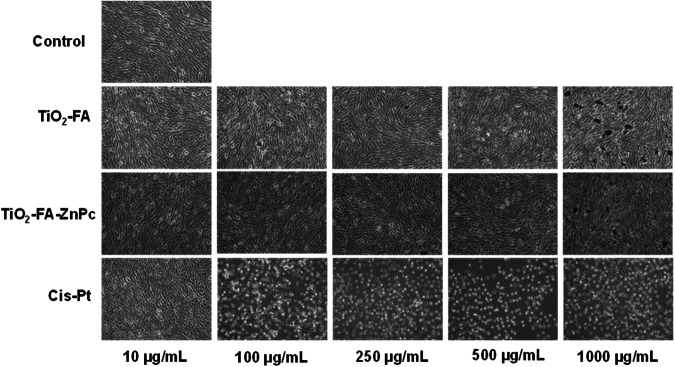
To visualize the effect of each material on the morphology of C6 cells, they were analyzed by light microscopy, as it is shown in Fig. 9. First, the extreme events were analyzed, where untreated cells showed their characteristic morphology at all concentrations of material used, and during 72 h, viability remained around 100% in all cases. In contrast, cells treated with cis-Pt are observed to be destroyed even at low concentrations (10 μg/mL), and as cis-Pt increases, their damage becomes more pronounced. The structural morphology of the cells was unaltered when treated with TiO2-FA and TiO2-FA-ZnPc, with similar behavior to the control. We can observe clusters of nanoparticles, which are more noticeable at the concentration of 1000 μg/mL. Cell viability and light microscopy images suggest that both TiO2-FA and TiO2-FA-ZnPc materials can be considered biocompatible.
Fig. 9.
Visual cytotoxic effects of different materials on C6 cells treated with increased concentrations of TiO2-FA, TiO2-FA-ZnPc and Cis-Pt. The images were taken at 10X amplification
In vitro nanoparticles photoactivation
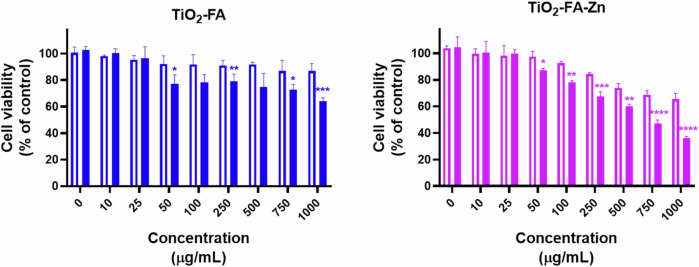
The photoactivation of nanocarriers with ultraviolet light resulted in a marked reduction in the viability of C6 cells (Fig. 10), which was incremental depending on the concentrations of TiO2-FA and TiO2-FA-ZnPc, which was more evident in the latter. The significant effects were observed at 250 μg/mL, with a maximum difference between not activated vs. activated of 22% for TiO2-FA and TiO2-FA-ZnPc of 29.6%.
Fig. 10.
Cell viability of C6 cells exposed to TiO2-FA (blue) or TiO2-FA-Zn (purple) not activated (open barr) or photoactivated (full barr) by visible light (λ = 385 nm, d = 10 cm, t = 30 min), followed by incubation for 72 h at 37 °C. The values are expressed as percentage of control of mean ± SE, n = 3. Student’s t test. Statistical significance: p < 0.05 (*), p < 0.01 (**), p < 0.001 (***) and p < 0.0001 (****)
Discussion
TiO2 is the semiconductor widely known and used in photocatalytic processes, mainly in the degradation of organic pollutants and organic synthesis, because it generates ROS under light irradiation [34, 35]. But also, TiO2 is considered a structurally stable material; its availability is cheap, and it is highly biocompatible. Among the different preparation methods for TiO2, the sol-gel method is a process that allowed us to functionalize with FA and disperse ZnPc in the TiO2 network in a single step. In this work, we report preparing a combined material to obtain a targeted photosensitizing agent and use it in PDT against glioma cancer cells. The functionalization of TiO2 with FA was carried out in a fine way and a single step without the need for other chemical agents and other long processes as is commonly done [54]. It has been reported that during the functionalization process of materials with folate groups, an amination reaction is first carried out on the surface of the material, later, through a carbodiimide reaction, the anchoring of the folate groups is carried out [54]. In our case, we report that AF was added during the synthesis of TiO2, where generated the links between Ti atoms and amino groups from FA were carried out as detected by FTIR spectroscopy. As has been widely reported, the functionalization of the surface of the materials with directing molecules has allowed them to reach the target tissues and perform the function for which they are intended. As we have reported on several occasions, the objective of functionalizing the surface of TiO2 and SiO2 with folic acid is because these materials are recognized more by cancer cells than by healthy cells [53, 54]. By overexpressing folate receptors, cancer cells can more easily capture the functionalized materials, thus making the treatment safer.
On the other hand, when TiO2 is irradiated with light, electron-hole pairs are generated where the electrons migrate to the conduction band (CB), and the holes remain in the valence band (VB) [34, 35]. In the presence of oxygen and molecular water on the surface, reduction reactions can be carried out by the electrons in CB to form O2•- and oxidation reactions by the holes in VB to form 1O2. These ROS can carry out the decomposition of pollutants in wastewater. Photodynamic therapy is based on this principle when irradiating a photosensitizer generates ROS that will damage cancer cells [8, 9]. However, the wavelengths used in PDT fall in the visible range (600–1100 nm). Although TiO2 has been used in PDT applications to treat various types of cancer, its total application as a photosensitizer has been limited since it must be irradiated with UV light to generate the ROS [35]. To counteract this drawback, the TiO2 surface has been modified with various agents to shift its light absorption to visible light. Zinc phthalocyanine (ZnPc) has been used as a photosensitizer in photodynamic therapy because it has a λ ≈ 660 nm. However, one of its disadvantages is that it tends to aggregate in aqueous media [12]. So, in this work, it was also possible to disperse the ZnPc in the TiO2 network since the XRD results did not show signs of ZnPc when it was added to TiO2-FA; this means that it was so dispersed that it did not allow its identification. In addition, the surface area found for TiO2-FA was large (476 m2/g), and TiO2 -FA-ZnPc was 397 m2/g decreased by 16.5%, indicating that this space was occupied by ZnPc molecules. Although the FTIR spectra of TiO2-FA and TiO2-FA-ZnPc appear very similar, experimentally, it was observed that the samples changed their color from yellow (characteristic of FA) to blue (part of ZnPc) after loading TiO2-FA with ZnPc. However, the UV-Vis spectra do show significant differences.
From the UV-Vis spectra and the equation Eg=hC/λ (where h is the Planks constant, C is the speed of light, and λ is the wavelength cutoff), the bandgap energy (Eg) value for the materials was calculated [46]. For the TiO2-FA material, a value of Eg = 3.55 eV was obtained, similar to that reported in the literature [33, 35]. The value of Eg for the TiO2-FA-ZnPc material was slightly shifted to 3.1 eV; however, other bands were observed between 600 and 800 nm (zoomed area in Fig. 4), indicating that, indeed, the combination of TiO2-FA and ZnPc does generate a new absorption in the visible range.
By XRD, the Anatase phase was mainly identified, while a high crystallinity was observed by TEM, which may also correspond to this phase. The cell viability results show that TiO2-FA and TiO2-FA-ZnPc did not exert any toxic effect on C6 cells, and the morphology of these cells remained intact compared to when Cis-Pt (chemotherapeutic used to treat gliomas) was used. These results indicate that the materials are biocompatible and are in agreement with what has been reported in the literature; anatase-phase TiO2 has been found to be biocompatible [36, 44]. The C6 rat glioma cell line was used as an in vitro model to study human GBMs and explore various aspects of the biological function of the glial cell. It is also widely used to evaluate the effects of new therapies for GBM treatment.
As preliminary studies, TiO2-FA and TiO2-FA-ZnPc materials were irradiated with UV light when incubated with C6 cells. Figure 10 shows that cell viability decreases with increasing concentration of each material and with the application of UV light. A greater decrease is seen when using the TiO2-FA-ZnPc-based material and irradiated with UV light. Similar studies have been performed using different TiO2 conjugates (TiO2-GA, TiO2-PEG, TiO2-Fe, and TiO2-CdS) and different cancer cell lines (HepG2, HT144, and HL60), and UV irradiation [39, 41, 43, 44]. These preliminary studies indicate that the combination of TiO2 with other agents results in a photoactive compound with great potential for application in PDT.
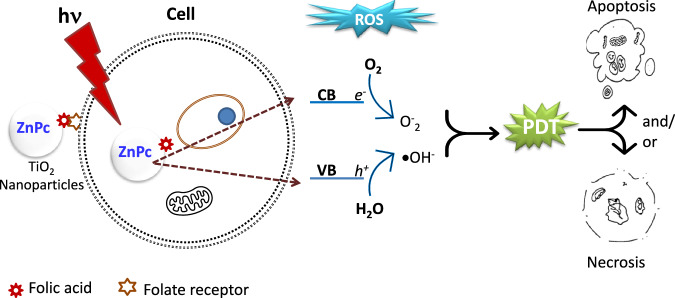
In summary, the biological results indicate that the materials are biocompatible or non-toxic to C6 cells. They are only activated when exposed to light and generate ROS that act on cancer cells. Then, our general approach is shown in Fig. 11, where folic acid functionalized nanoparticles are recognized by folate receptors, which are overexpressed in higher amounts in cancer cells. Subsequently, upon exposure to light, charge separation will occur to form ROS that will cause cell damage and death. Our subsequent experiments are oriented towards applying visible light to the TiO2-FA-ZnPc material to see the effect on cell viability and determine the mechanism of cell death.
Fig. 11.
Schematic representation of the uptake of TiO2-ZnPc nanoparticles by cancer cells through the folate groups on the nanoparticles and those on the cell. Subsequent irradiation of the NPs with light generates and separates charges to produce reactive oxygen species that cause cell damage by apoptosis and/or necrosis
Conclusions
Folic acid-functionalized TiO2 nanoparticles loaded with ZnPc were obtained by sol-gel processing. TEM and XRD results show that TiO2-FA and TiO2-FA-ZnPc nanoparticles are composed of a mixture of anatase-amorphous phases corresponding to the TiO2 structure. A new signal was observed at 640 nm by UV-Vis spectroscopy, which is due to the interaction between titanium dioxide and phthalocyanine. The nanoparticles are mesoporous with pore diameters of approximately 2.40 nm. The surface area was reduced from 476 m2/g for TiO2-FA to 397 m2/g for TiO2-FA-ZnPc due to the incorporation of the phthalocyanine molecules occupying part of the surface. Nanoparticles were not toxic to C6 cells at all concentrations compared to Cis-Pt treatment. These results allow us to postulate that TiO2-FA-ZnPc are biocompatible and are activated only by light irradiation to generate charge separation and produce ROS species. Therefore, these materials can be used in photodynamic therapy for the treatment of GBM or other cancers. Then, our immediately future efforts will focus on the use of glioma cell lines to determine the mechanism of cell death induced by PDT using our TiO2-FA-ZnPc system as a nanophotosensitizer. Also, to perform in vivo studies using GBM animal models to evaluate the therapeutic efficacy and safety profile of the nano-system prior to its preclinical application as our ultimate goal.
Acknowledgements
The authors thank the Universidad Aautónoma Metropolitana-Xochimilco and the Instituto Nacional de Neurología y Neurocirugía for all the facilities provided for this work. We also thank CONAHCYT-México for the grant awarded through project number CBF2023-2024-1982.
Author contributions
Conceptualization: [Emma Ortiz-Islas], [Araceli Díaz-Ruiz], [Camilo Ríos]; Methodology: [Gustavo Jardón Guadarrama], [Ma Elena Manríquez-Ramírez], [Citlali E. Rodríguez-Pérez],[Araceli Díaz-Ruiz], [María de los Ángeles Martínez-Cárdenas], [Alfonso Mata-Bermúdez], [Emma Ortiz-Islas]; Formal analysis and investigation: [Gustavo Jardón Guadarrama], [Ma Elena Manríquez-Ramírez], [Citlali E. Rodríguez-Pérez], [Araceli Díaz-Ruiz], [Alfonso Mata-Bermúdez], [María de los Ángeles Martínez-Cárdenas]; Writing - original draft preparation: [Gustavo Jardón Guadarrama], [Citlali E. Rodríguez-Pérez], [Araceli Díaz-Ruiz] [Camilo Ríos], [Emma Ortiz-Islas]; Writing - review and editing: [Emma Ortiz-Islas]; Resources: [María de los Ángeles Martínez-Cárdenas]; Supervision: [Camilo Ríos], [Emma Ortiz-Islas].
Data availability
Data will be made available upon request.
Compliance with ethical standards
Conflict of interest
The authors declare no competing interests.
Footnotes
Publisher’s note Springer Nature remains neutral with regard to jurisdictional claims in published maps and institutional affiliations.
Contributor Information
Camilo Ríos, Email: crios@correo.xoc.uam.mx.
Emma Ortiz-Islas, Email: emma.ortiz@innn.edu.mx.
References
- 1.Persano L, Rampazzo E, Basso G, Viola G. Glioblastoma cancer stem cells: role of the microenvironment and therapeutic targeting. Biochem Pharm. 2013;8:5612–22. [DOI] [PubMed] [Google Scholar]
- 2.Coate L, McNamara MG, Lwin Z, MacFadden D, Al-Zahrani A, Massey C. et al. Glioblastoma treatment in the elderly in the temozolomide therapy era. Can J Neurol Sci. 2014;4:357–62. 10.1017/S0317167100017303 [DOI] [PubMed] [Google Scholar]
- 3.Huang Z. A review of progress in clinical photodynamic therapy. Technol Cancer Res Treat. 2005;4:283–93. 10.1177/153303460500400308 [DOI] [PMC free article] [PubMed] [Google Scholar]
- 4.Huang Z, Li L, Wang H, Wang X, Yuan K, Meyers A, Yang L, Hetzel FW. Photodynamic therapy — an update on clinical applications. J Innov Opt Health Sci. 2009;2:73–92. 10.1142/S1793545809000401 [DOI] [Google Scholar]
- 5.van Straten D, Mashayekhi V, de Bruijn HS, Oliveira S, Robinson DJ. Oncologic photodynamic therapy: basic principles, current clinical status and future directions. Cancers. 2017;9:1–54. [DOI] [PMC free article] [PubMed] [Google Scholar]
- 6.Liu Y, Meng X, Bu W. Upconversion-based photodynamic cancer therapy. Coord Chem Rev. 2019;379:82–98. 10.1016/j.ccr.2017.09.006 [DOI] [Google Scholar]
- 7.Yano S, Hirohara S, Obata M, Hagiya Y, Ogura S, Ikeda A. et al. Current states and future views in photodynamic therapy. J Photochem Photobiol C. 2011;12:46–67. 10.1016/j.jphotochemrev.2011.06.001 [DOI] [Google Scholar]
- 8.Je-Ok Y, Kwon-Soo H. New insights into the mechanisms for photodynamic therapy-induced cancer cell death. Int Rev Cell Mol Biol. 2012;295:139–174. 10.1016/B978-0-12-394306-4.00010-1 [DOI] [PubMed] [Google Scholar]
- 9.Zhang J, Jiang C, Figueiró Longo JP, Bentes Azevedo R, Zhang H, Muehlmann LA. An updated overview on the development of new photosensitizers for anticancer photodynamic therapy. Acta PharmSin B. 2018;8:137–46. 10.1016/j.apsb.2017.09.003 [DOI] [PMC free article] [PubMed] [Google Scholar]
- 10.Duc Loc S, Jieun L, Duc Long N, Young-Pil K. Tailoring photosensitive ROS for advanced photodynamic therapy. Exp Mol Med. 2021;53:495–504. 10.1038/s12276-021-00599-7 [DOI] [PMC free article] [PubMed] [Google Scholar]
- 11.Gomes A, Neves M, Cavaleiro J. Cancer, photodynamic therapy and porphyrin-type derivatives. Acad Bras Cienc. 2018;90:993–1026. 10.1590/0001-3765201820170811 [DOI] [PubMed] [Google Scholar]
- 12.Chen D, Xu Q, Wang W, Shao J, Huang W, Dong X. Type I photosensitizers revitalizing photodynamic oncotherapy. Small. 2021;17:1–21. [DOI] [PubMed] [Google Scholar]
- 13.Rajendran M. Quinones as photosensitizer for photodynamic therapy: ROS generation, mechanism and detection methods. Photodiagnosis Photodyn Ther. 2016;13:175–87. 10.1016/j.pdpdt.2015.07.177 [DOI] [PubMed] [Google Scholar]
- 14.Scanone AC, Gsponer NS, Alvarez MG, Durantini EN. Porphyrins containing basic aliphatic amino groups as potential broad spectrum antimicrobial agents. Photodiagnosis Photodyn Ther. 2018;24:220–7. 10.1016/j.pdpdt.2018.09.017 [DOI] [PubMed] [Google Scholar]
- 15.Wang A, Li Y, Zhou L, Yuan L, Lu S, Lin Y. et al. Charge dependent photodynamic activity of alanine based zinc phthalocyanines. J Photochem Photobio B, Biol. 2014;141:10–19. 10.1016/j.jphotobiol.2014.09.002 [DOI] [PubMed] [Google Scholar]
- 16.Xue J, Li C, Liu H, Wei J, Chen N, Huang J. Optimal light dose and drug dosage in the photodynamic treatment using PHOTOCYANINE. Photodiagnosis Photodyn Ther. 2011;8:267–74. 10.1016/j.pdpdt.2010.10.003 [DOI] [PubMed] [Google Scholar]
- 17.Yang Z, Sun Z, Ren Y, Chen X, Zhang W, Zhu X. et al. Advances in nanomaterials for use in photothermal and photodynamic therapeutics (Review). Mol Med Rep. 2019;20:5–15. [DOI] [PMC free article] [PubMed] [Google Scholar]
- 18.Chen J, Fan T, Xie Z, Zeng Q, Xue P, Zheng T. et al. Advances in nanomaterials for photodynamic therapy applications: status and challenges. Biomater. 2020;237:1–27. 10.1016/j.biomaterials.2020.119827 [DOI] [PubMed] [Google Scholar]
- 19.Bechet D, Couleaud P, Frochot C, Viriot ML, Guillemin F, Barberi-Heyo M. Nanoparticles as vehicles for delivery of photodynamic therapy agents. Trends Biotechnol. 2008;26:612–21. 10.1016/j.tibtech.2008.07.007 [DOI] [PubMed] [Google Scholar]
- 20.Nasseri B, Alizadeh E, Bani F, Davaran S, Akbarzadeh A, Rabiee N. et al. Nanomaterials for photothermal and photodynamic cancer therapy. Appl Phys Rev. 2022;9:1–32. 10.1063/5.0047672 [DOI] [Google Scholar]
- 21.Krajczewski J, Rucińska K, Townley HE, Kudelski A. Role of various nanoparticles in photodynamic therapy and detection methods of singlet oxygen. Photodiagnosis Photodyn Ther. 2019;26:162–78. 10.1016/j.pdpdt.2019.03.016 [DOI] [PubMed] [Google Scholar]
- 22.Yu-Ling Y, Lin K, Yang L. Progress in nanocarriers codelivery system to enhance the anticancer effect of photodynamic therapy. Pharmaceutics. 2021;13:1–41. [DOI] [PMC free article] [PubMed] [Google Scholar]
- 23.Silva Adaya D, Aguirre Cruz ML, Guevara J, Ortiz-Islas E. Nanobiomaterials applications in neurodegenerative diseases. J Biomater Appl. 2017;31:953–84. 10.1177/0885328216659032 [DOI] [PubMed] [Google Scholar]
- 24.Rejinold NS, Choi G, Jin-Ho C. Recent trends in nano photochemo therapy approaches and future scopes. Coord Chem Rev. 2020;411:1–23. [Google Scholar]
- 25.Wang J, Wu X, Shen P, Wang J, Shen Y, Shen Y. et al. Applications of inorganic nanomaterials in photothermal therapy based on combinational cancer treatment. Int J Nanomed. 2020;15:1903–14. 10.2147/IJN.S239751 [DOI] [PMC free article] [PubMed] [Google Scholar]
- 26.Lv Z, He S, Wang Y, Zhu X. Noble metal nanomaterials for NIR-triggered photothermal therapy in cancer. Adv Healthcare Mater. 2021;10:1–17. 10.1002/adhm.202001806 [DOI] [PubMed] [Google Scholar]
- 27.Kwiatkowski S, Knap B, Przystupski D, Saczko J, Kędzierska E, Knap-Czop K. et al. Photodynamic therapy – mechanisms, photosensitizers and combinations. Biomed Pharmacother. 2018;106:1098–1107. 10.1016/j.biopha.2018.07.049 [DOI] [PubMed] [Google Scholar]
- 28.Ahirwar S, Mallick S, Bahadur D. Photodynamic therapy using graphene quantum dot derivatives. J Solid State Chem. 2020;282:1–9. 10.1016/j.jssc.2019.121107 [DOI] [Google Scholar]
- 29.Lin Z, Bang-Ping J, Liang J, Wen C, Xing-Can S. Phycocyanin functionalized single-walled carbon nanohorns hybrid for near-infrared light-mediated cancer phototheranostics. Carbon. 2019;143:814–27. 10.1016/j.carbon.2018.12.011 [DOI] [Google Scholar]
- 30.Rossi F, Bedogni E, Bigi F, Rimoldi T, Cristofolini L, Pinelli S. et al. Porphyrin conjugated SiC/SiOx nanowires for X-ray-excited photodynamic therapy. Sci Rep.2014;5:1–6. [DOI] [PMC free article] [PubMed] [Google Scholar]
- 31.Hao C, Wang X, Jia X, Liu T, Sun J, Yan Z. The applications of two-dimensional materials and the derivative quantum dots in photodynamic therapy. APL Mater. 2022;10:1–21. 10.1063/5.0068996 [DOI] [Google Scholar]
- 32.Younis MR, He G, Qu J, Lin J, Huang P, Xia XH. Inorganic nanomaterials with intrinsic singlet oxygen generation for photodynamic therapy. Adv Sci. 2021;8:1–37. 10.1002/advs.202102587 [DOI] [PMC free article] [PubMed] [Google Scholar]
- 33.Li J, Zhang JZ. Optical properties and applications of hybrid semiconductor nanomaterials. Coord Chem Rev. 2009;253:3015–3041. 10.1016/j.ccr.2009.07.017 [DOI] [Google Scholar]
- 34.Reghunath S, Pinheiro D, Devi S. A review of hierarchical nanostructures of TiO2: advances and applications. Appl Surf Sci Adv. 2021;3:1–34. 10.1016/j.apsadv.2021.100063 [DOI] [Google Scholar]
- 35.Wang M, Hou Z, Al Kheraif AA, Xing B, Lin J. Mini review of TiO2-based multifunctional nanocomposites for near-infrared light–responsive phototherapy. Adv Healthc Mater. 2018;7:1–19. 10.1002/adhm.201800351 [DOI] [PubMed] [Google Scholar]
- 36.Isacfranklin M, Yuvakkumar R, Ravi G, Kumar P, Saravanakumar B, Velauthapillai D, Alahmadi TA, Alharbi SA. Biomedical application of single anatase phase TiO2 nanoparticles with addition of Rambutan (Nephelium lappaceum L.) fruit peel extract. Appl Nanosci. 2021;11:699–708. 10.1007/s13204-020-01599-1 [DOI] [Google Scholar]
- 37.Khataee A, Mansoori GA. Preparation of NS–TiO2 and Nano–Titanates. In: Khataee A, Mansoori GA, editors. Nanostructured titanium dioxide materials: Properties, preparation and applications. Singapore: Word Scientific; 2011. p. 12–37.
- 38.Ni W, Li M, Cui J, Xing Z, Li Z, Wu X. et al. 808 nm light triggered black TiO2 nanoparticles for killing of bladder cancer cells. Mater Sci Eng C. 2017;81:252–60. 10.1016/j.msec.2017.08.020 [DOI] [PubMed] [Google Scholar]
- 39.Li J, Wang X, Shao Y, Lu X, Chen B. A novel exploration of a combination of gambogic acid with TiO2 nanofibers: the photodynamic effect for HepG2 cell proliferation. Materials. 2014;7:6865–78. 10.3390/ma7096865 [DOI] [PMC free article] [PubMed] [Google Scholar]
- 40.Zheng K, Chen R, Sun Y, Tan Z, Liu Y, Cheng X. et al. Cantharidin-loaded functional mesoporous titanium peroxide nanoparticles for non-small cell lung cancer targeted chemotherapy combined with high effective photodynamic therapy. Thorac Cancer. 2020;11:1476–86. 10.1111/1759-7714.13414 [DOI] [PMC free article] [PubMed] [Google Scholar]
- 41.Shah Z, Nazir S, Mazhar K, Abbas R, Samokhvalov IM. PEGylated doped- and undoped-TiO2 nanoparticles for photodynamic therapy of cancers. Photodiagnosis Photodyn Ther. 2019;27:173–83. 10.1016/j.pdpdt.2019.05.019 [DOI] [PubMed] [Google Scholar]
- 42.Yurt F, Ocakoglu K, Ince M, Colak SG, Er O, Soylu HM. et al. Photodynamic therapy and nuclear imaging activities of zinc phthalocyanine-integrated TiO2 nanoparticles in breast and cervical tumors. Chem Biol Drug Des. 2018;91:789–796. 10.1111/cbdd.13144 [DOI] [PubMed] [Google Scholar]
- 43.Huang K, Chen L, Liao M, Xiong J. The photocatalytic inactivation effect of Fe-doped TiO2 nanocomposites on Leukemic HL60 cells-based photodynamic therapy. Int J Photoenergy. 2012;2012:1–8. [Google Scholar]
- 44.Huang K, Chen L, Deng J, Xiong J. Enhanced visible-light photocatalytic performance of nanosized Anatase TiO2 doped with CdS quantum dots for cancer-cell treatment. J Nanomater. 2012;2012:1–12. 10.1155/2012/720491 [DOI] [Google Scholar]
- 45.Matijević M, Nešić M, Stepić M, Radoičić M, Šaponjić Z, Petković M. Light controllable TiO2‑Ru nanocomposite system encapsulated in phospholipid unilamellar vesicles for anti‑cancer photodynamic therapy. Opt Quant Electron. 2018;50:1–8. 10.1007/s11082-018-1495-z [DOI] [Google Scholar]
- 46.Jimenez VA, Moreno N, Guzman L, Torres CC, Campos CH, Alderete JB. Visible-light-responsive folate-conjugated titania and alumina nanotubes for photodynamic therapy applications. J Mater Sci. 2020;55:6976–6991. 10.1007/s10853-020-04483-z [DOI] [Google Scholar]
- 47.Dong M, Sun X, Bu T, Zhang H, Wang J, He K. et al. 3D/2D TMSs/TiO2 nanofibers heterojunctions for photodynamic-photothermal and oxidase-like synergistic antibacterial therapy co-driven by VIS and NIR biowindows. Compos B: Eng. 2022;230:1–11. 10.1016/j.compositesb.2021.109498 [DOI] [Google Scholar]
- 48.Yurt F, Sarı FA, Ince M, Colak SG, Er O, Soylu HM. et al. Photodynamic therapy and nuclear imaging activities of SubPhthalocyanine integrated TiO2 nanoparticles. J Photochem Photobio A. 2018;367:45–55. 10.1016/j.jphotochem.2018.08.004 [DOI] [Google Scholar]
- 49.Hong EJ, Choi DG, Shimn MS. Targeted and effective photodynamic therapy for cancer using functionalized nanomaterials. Acta Pharm Sin. 2016;6:297–307. 10.1016/j.apsb.2016.01.007 [DOI] [PMC free article] [PubMed] [Google Scholar]
- 50.Montaseri H, Kruger CA, Abrahamse H. Recent advances in porphyrin-based inorganic nanoparticles for cancer treatment. Int J Mol Sci. 2020;21:1–24. 10.3390/ijms21093358 [DOI] [PMC free article] [PubMed] [Google Scholar]
- 51.Gonçalves ASC, Rodrigues CF, Fernandes N, de Melo-Diogo D, Ferreira P, Moreira AF. et al. IR780 loaded gelatin-PEG coated gold core silica shell nanorods for cancer-targeted photothermal/photodynamic therapy. Biotechnol Bioeng. 2022;119:644–56. 10.1002/bit.27996 [DOI] [PubMed] [Google Scholar]
- 52.Xie J, Pan X, Wang M, Yao L, Liang X, Ma J. et al. Targeting and photodynamic killing of cancer cell by nitrogen-doped titanium dioxide coupled with folic acid. Nanomater. 2016;6:1–9. 10.3390/nano6060113 [DOI] [PMC free article] [PubMed] [Google Scholar]
- 53.Ortiz-Islas E, Sosa-Arróniz A, Manríquez-Ramírez ME, Rodríguez-Pérez CE, Tzompantzi F, Padilla JM. Mesoporous silica nanoparticles functionalized with folic acid for targeted release Cis-Pt to glioblastoma cells. Rev Adv Mater Sci. 2021;60:25–37. 10.1515/rams-2021-0009 [DOI] [Google Scholar]
- 54.Uribe-Robles M, Ortiz-Islas E, Rodriguez-Perez E, Lim T, Martinez-Morales AA. TiO2 hollow nanospheres functionalized with folic acid and ZnPc for targeted photodynamic therapy in glioblastoma cancer. MRS Commun. 2019;9:1242–8. 10.1557/mrc.2019.142 [DOI] [Google Scholar]
- 55.Lopez T, Ortiz E, Alvarez M, Navarrete J, Odriozola JA, Martinez-Ortega F. et al. Study of the stabilization of zinc phthalocyanine in sol-gel TiO2 for photodynamic therapy applications. Nanomed: Nanotechnol Biol Med. 2010;6:777–85. 10.1016/j.nano.2010.04.007 [DOI] [PubMed] [Google Scholar]
- 56.Lopez T, Ortiz-Islas E, Guevara P, Rodriguez-Reinoso F, Gomez E, Cuevas JL. et al. Release of copper complexes from a nanostructured sol–gel titania for cancer treatment. J Mater Sci. 2015;50:2410–21. 10.1007/s10853-014-8796-9 [DOI] [Google Scholar]
Associated Data
This section collects any data citations, data availability statements, or supplementary materials included in this article.
Data Availability Statement
Data will be made available upon request.


