

Abstract
Regeneration in many animals involves the formation of a blastema, which differentiates and organizes into the appropriate missing body parts. Although the mechanisms underlying blastema formation are often fundamental to regeneration biology, information on the cellular and molecular basis of blastema formation remains limited. Here, we focus on a fragmenting potworm (Enchytraeus japonensis), which can regenerate its whole body from small fragments. We find soxC and mmpReg as upregulated genes in the blastema. RNAi of soxC and mmpReg reduce the number of blastema cells, indicating that soxC and mmpReg promote blastema formation. Expression analyses show that soxC-expressing cells appear to gradually accumulate in blastema and constitute a large part of the blastema. Additionally, similar expression dynamics of SoxC orthologue genes in frog (Xenopus laevis) are found in the regeneration blastema of tadpole tail. Our findings provide insights into the cellular and molecular mechanisms underlying blastema formation across species.
Subject terms: Regeneration, Regeneration
Blastema formation is a critical early step during regeneration, but how it is initially formed is still unclear. Here, they find soxC and mmpReg promote blastema formation in fragmenting potworms, and identify similar expression dynamics in tadpole tail, suggesting a conserved mechanism.
Introduction
Regeneration is a prominent feature in many animals1. The degree of restoration of missing body parts or organs varies across species1–3. In highly regenerative animals, regeneration involves the formation of a blastema, which includes an undifferentiated mass of proliferative cells and provides the source material for lost body parts1,2,4–8. Hence, the mechanisms underlying blastema formation are fundamental for regeneration.
In vertebrates, the popular model systems for studying blastema formation are limb regeneration in salamanders and tail fin regeneration in zebrafish9. After wound healing, studies using lineage-tracing tools have identified that the connective tissue progenitors migrate to the amputation site and form regeneration blastema in both these model systems10,11. Among invertebrates, the highly regenerative animals are broadly distributed in many groups, including Platyhelminths12, Annelids13, Xenacoelomorphs14, Cnidarians15, and Sponges16. Among them, some animals can regenerate whole bodies from small fragments of tissues7. Planaria is the most intensively studied model for whole-body regeneration, which includes blastema formation12. Several studies on regeneration in planaria have indicated that cell migration is crucial for blastema formation in invertebrates17–20. To clarify whether the cellular mechanisms underlying blastema formation can be generalized among broad animal species, they need to be verified in other model systems.
Annelids have long been used as model animals for studying regeneration because of their impressive regenerative abilities4,13,21,22. Some annelids exhibit regenerative abilities comparable to planaria, which can regenerate the entire body from small fragments7,13. In oligochaetes (a group of annelids that includes earthworms), a population of cells was speculated to migrate to blastema along the ventral nerve cord (VNC) from a distant location22–24, which has not yet been determined. Putative multipotent stem cells, called neoblasts in oligochaetes (in contrast, in planaria, neoblasts were shown to be multipotent by an elegant transplantation experiment25), are thought to be involved in this cell migration4; however, no solid evidence has been reported to date.
Three hypotheses have been put forth to explain oligochaete regeneration, and these theories have been believed for approximately 130 years despite the absence of definitive evidence: 1) the existence of multipotent neoblasts, 2) cell migration to the amputation site to form blastema, and 3) migration of cells to the blastema along the VNC4,13,22,24,26,27. Nevertheless, the germ cell precursor population has been reported to accumulate along the VNC towards the anterior blastema28. To date, some progress has been made in identifying the molecules involved in blastema formation in oligochaete29–33. However, these hypotheses are yet to be clearly addressed.
The potworm Enchytraeus japonensis Nakamura, 199334 is an enchytraeid (an oligochaete) reported in Japan. It reproduces asexually by dividing its body into several fragments, which then regenerate into complete individuals within 4–5 days34 (Fig. 1a). The amputated fragments can similarly regenerate into whole bodies35. Enchytraeus japonensis is a small whitish animal that is approximately 10 mm in length and is easy to culture and handle. Additionally, blastema formation in E. japonensis is completed in approximately 24 h postamputation (hpa)36. All these features make E. japonensis an excellent laboratory animal for studying molecular and cellular basis underlying blastema formation.
Fig. 1. soxC expression and blastema formation.

a Enchytraeus japonensis grows to about 10 mm in length and reproduces asexually by fragmentation approximately every 2 weeks. b Workflow of transcriptomic analyses during regeneration. Intact worms were amputated into 3 fragments (blastema-poor group) or 8 fragments (blastema-rich group). c Venn diagrams depicting selectively upregulated contigs in regenerating animals (blastema-poor and blastema-rich groups) compared with that of intact animals. d Sequential filters to select upregulated contigs in regenerating worms. We selected the genes that showed higher upregulation in the blastema-rich than in the blastema-poor group based on the FPKM value (>10). e Expression level of soxC during regeneration. soxC was upregulated at 2, 6, and 24 hpa. n = 5 for intact animals and for each time point. Error bars indicate the standard error of the mean (S.E.M.). f, g soxC expression during blastema formation at 0, 1, 3, 5, 8, and 24 hpa in horizontal sections (f) and sagittal sections (g). The sense controls and their diagrams are shown at the top. in, intestine; bw, body wall; se, septa; vn, ventral nerve cord. Dashed lines indicate amputation sites. f’ f” f”’ Magnified view of the boxed areas in (f) (1 hpa, arrowhead (f’); 3 hpa, arrowhead (f”); 5 hpa, arrowhead (f”’)). h Quantification of soxC-expressing areas in the anterior blastema of regenerating worms at 0 hpa (n = 11), 3 hpa (n = 10), 8 hpa (n = 12) and 24 hpa (n = 12). Data was combined from three independent experiments. The central lines and the error bars indicate the mean and standard deviation (SD), respectively. *p < 0.05, **p < 0.01, ***p < 0.001 (Dunnett’s test) (e, h). Scale bars represent 100 µm (f, g) and 20 µm (f’, f”, f”’). Source data are provided as a Source Data file. A: anterior, P: posterior, D: dorsal, V: ventral (f, g).
In this work, using large-scale RNA-sequencing (RNA-seq) and the newly established functional RNA interference (RNAi) system in E. japonensis, we try to understand the molecular and cellular basis underlying blastema formation. We find soxC and mmpReg as upregulated genes in the blastema. RNAi of soxC and mmpReg reduce the number of blastema cells, indicating that soxC and mmpReg promote blastema formation. Expression analyses show that soxC-expressing cells appear to gradually accumulate in blastema and constitute a large part of the blastema. Furthermore, to examine whether the findings obtained using E. japonensis can be generalized across species, we conduct a comparative study using a tail regeneration model of a frog (Xenopus laevis) tadpole. We show similarity in the expression dynamics of SoxC genes in the blastema formation in E. japonensis and X. laevis, raising the possibility of common cellular mechanisms underlying blastema formation in both species.
Results
soxC is upregulated in blastema formation in E. japonensis
To understand the cellular and molecular basis of blastema formation in E. japonensis, we tried to identify the genes that were selectively expressed in the blastema. To this end, we explored the differentially expressed genes between blastema and other body parts in E. japonensis using RNA-seq. We devised a dose-dependent strategy to overcome the challenges associated with the surgical isolation of blastema. We increased the amount of blastema obtained by cutting the worms into multiple fragments. These fragments were sorted into two groups of blastema-containing fragments: worms cut into 3 fragments (blastema-poor group) and worms cut into 8 fragments (blastema-rich group). Additionally, the third group contained intact worms (Fig. 1b). In E. japonensis, blastema formation is completed in approximately 24 hpa36. We thus cut and cultured the worms for 24 h and used them for RNA-seq analysis (Fig. 1b). We generated a large-scale RNA-seq data and de novo assembled it to generate 291,660 contigs with N50 value of 534 base pairs from all reads derived from the three libraries: blastema-rich group, blastema-poor group, and intact group. Among the 291,660 contigs, 86,094 common non-redundant contigs were detected in all three libraries (Fig. 1b). We identified 1177 differentially expressed contigs between the blastema-poor and intact groups (Fig. 1c left and d) and 1593 differentially expressed contigs between the blastema-rich and intact groups (Fig. 1c right and d). We found 465 annotated genes that were differentially expressed (Fig. 1d). Among these, we identified 278 genes that were more upregulated in the blastema-rich group than in the blastema-poor group at 10 fragments per kilobase of exon per million reads mapped (FPKM) values or higher (Fig. 1c, d, Supplementary Data 1). Among 465 annotated genes, we found 398 genes in the blastema-poor group shared with blastema-rich group at 10 FPKM values or higher. We identified 124 genes that were more downregulated in the blastema-rich group than in the blastema-poor group at 10 FPKM values or higher (Supplementary Fig. 1a, Supplementary Data 2).
Among the 278 upregulated genes, we performed in situ hybridization (ISH) using 4 genes (soxC, mmpReg, lrp8, nas36) and found that all 4 were expressed in the blastema (lrp8, nas36; Supplementary Fig. 2a, b), suggesting that our strategy to identify genes associated with blastema was successful.
As transcription factors that act early in regeneration often establish and maintain cell identities37, we focused on transcription factors (Supplementary Data 3) among the 278 genes. The most upregulated gene among the transcription factors (7.9-fold upregulation in the blastema-rich group, Supplementary Data 3) belonged to the Sry-related high-mobility group (HMG) box (SOX)C transcription factor family. It contains a highly conserved HMG box DNA-binding domain (Supplementary Fig. 1b, c), which is distinct from other families, namely, SOXB and SOXD (Supplementary Fig. 1d). We named the gene Ej-soxC (hereafter referred to as soxC). As the SOX transcription factor family generally contributes to determining cell fate and identity in many lineages38, we further analyzed soxC by performing expression analysis using quantitative reverse-transcription polymerase chain reaction (qRT-PCR). We found that soxC was upregulated during blastema formation until 24 hpa (Fig. 1e) and leveled off at later stages (Supplementary Fig. 1e). This suggests that soxC is involved in the regeneration of E. japonensis, especially blastema formation.
To understand the role of soxC in blastema formation, we first examined the soxC expression pattern using ISH in horizontal and sagittal sections of the regenerating fragments (Fig. 1f, g). We did not detect soxC-positive cells just after amputation (0 hpa) and rarely detected them in intact worms (Supplementary Fig. 3), showing that soxC is not highly expressed in the homeostatic state. soxC-expressing cells were found close to the body wall and septa only near the posterior amputation site at 1 hpa (Fig. 1f, f’, g). At 3 hpa, soxC-expressing cells were found close to the body wall near both the anterior and posterior amputation sites (Fig. 1f, f”, g). At 5, 8, and 24 hpa, we detected the soxC-expressing cells at both anterior and posterior amputation sites (Fig. 1f, f”’, g). The area of soxC-expressing cells in the amputation site increased during blastema formation (Fig. 1h). At 24 hpa, the area of soxC-expressing cells encompassed a large part of the developing blastema (Fig. 1f, g, Supplementary Fig. 4a, b). The soxC-expressing cells observed close to the body wall (at 3 and 5 hpa) were spread out and flat (Fig. 1f”, f”’). Phalloidin staining showed that the shape of the cells close to the body wall were also spread out and flat at 5 hpa (Supplementary Fig. 4c–e). These shapes are typical of that of migrating cells39,40.
soxC promotes blastema formation
To test whether soxC regulates blastema formation, we silenced soxC using RNAi by soaking or feeding the worms with double-stranded RNA (dsRNA) (Fig. 2a, b, Supplementary Fig. 4f). The soxC transcript level reduced by 40% (24 hpa) after soaking and feeding RNAi (Fig. 2c, Supplementary Fig. 4g). Interference efficiency was approximately the same in both methods. However, soaking RNAi takes less time than feeding RNAi; therefore, subsequent RNAi experiments were performed using the soaking RNAi method. soxC silencing significantly decreased the number of cells around the amputation site compared with that of the control at 6 hpa (anterior: by 29%, p = 0.0127; posterior: by 38%, p = 6.65 × 10⁻⁵; Fig. 2d–g) and 24 hpa (anterior: by 33%, 4.2 × 10⁻⁴; posterior: by 27%, p = 0.00571; Fig. 2h–k). As mentioned earlier, as the area of soxC-expressing cells encompassed a large part of the developing blastema (Fig. 1f, g, Supplementary Fig. 4a, b), we analyzed the size of blastema by visualizing soxC expression. soxC RNAi decreased the volume of the blastema compared with that in the control at 6 hpa (by 59%, p = 5.6 × 10⁻¹⁰) and 24 hpa (by 52%, p = 7.4 × 10⁻⁸) (Fig. 2l–o). These data showed that soxC is required for functions in blastema formation. At 2 days post amputation (dpa), soxC RNAi-treated animals did not show a significant decrease in the number of cells in the blastema (Supplementary Fig. 5a–e). At 4 dpa, soxC RNAi-treated animals did not show significant difference in blastema size, morphology, or the anti-acetylated tubulin antibody-labelled central and peripheral nervous system compared with that in the control RNAi-treated animals (Supplementary Fig. 5j–l). Proliferating cells were detected in the blastema of soxC RNAi- and control RNAi-treated animals (Supplementary Fig. 5m). These data suggested that soxC silencing did not affect regeneration at 2 and 4 dpa. Taken together, soxC is required for functions in blastema formation for at least up to 24 hpa, indicating that soxC promotes blastema formation.
Fig. 2. soxC promotes blastema formation.

a Illustration of RNAi by soaking. b Schematic drawing of knock-down. Animals were amputated after 24 h of soaking in dsRNA and cultured for 1 day. c qPCR for the RNAi-mediated downregulation of soxC transcripts at 24 hpa (n = 4, biologically independent sample pools, p = 0.0289). Error bars indicate S.E.M. d, e Representative images of RNAi animals at 6 hpa. Bright-field images (d). The nuclei were stained with DAPI (e). f, g RNAi of soxC reduced the number of cells in both the anterior blastema (GFP RNAi (n = 20), soxC RNAi (n = 42), p = 0.0127) (f) and posterior blastema (GFP RNAi (n = 20), soxC RNAi (n = 43), p = 6.6 × 10⁻⁵) (g). Representative of two independent experiments (f, g). h, i Representative images of RNAi animals at 24 hpa. Bright-field images (h). The nuclei were stained with DAPI (i). j, k RNAi of soxC reduced the number of cells in both the anterior blastema (GFP RNAi (n = 25), soxC RNAi (n = 36), p = 4.2 × 10⁻⁴) (j) and posterior blastema (GFP RNAi (n = 25), soxC RNAi (n = 38), p = 0.0057) (k). Representative of two independent experiments (j, k). l–o soxC RNAi resulted in a decrease in the blastema volume at 6 hpa (GFP RNAi (n = 22), soxC RNAi (n = 20), p = 5.6 × 10⁻¹⁰) (m) or 24 hpa (GFP RNAi (n = 21), soxC RNAi (n = 23), p = 7.8 × 10⁻⁸) (o). Data was combined from two independent experiments (m, o). Typical images are shown (RNAi 6 hpa (l) or 24 hpa (n)). t-test, *p < 0.05, **p < 0.01, ***p < 0.001 (c, f, g, j, k, m, o). Error bars: mean ± SD (f, g, j, k, m, o). Scale bars represent 250 µm (e, i, l, n). Dashed lines indicate the position of amputation sites (d, e, h, i, l, n). Dotted lines indicate the outline of regenerating worms (e, i). Ventral views (d, e, h, i). Sagittal sections (l, n). Source data are provided as a Source Data file.
mmpReg promotes blastema formation
To further delineate the molecular basis of blastema formation in E. japonensis, we performed a Kyoto Encyclopedia of Genes and Genomes (KEGG) pathway analysis41. We mapped the 465 differentially expressed genes between regenerating and intact animals to functional categories (Fig. 3a). Among the 465 genes, we mapped 110 and frequently detected the extracellular matrix (ECM)-receptor interaction pathway category (Fig. 3b). This pathway analysis raised the possibility that ECM remodeling might modulate blastema formation. The cleavage of ECM components is one of the main processes during ECM remodeling42. We focused on matrix metalloprotease (MMP) because MMPs are the primary enzymes involved in ECM degradation42. Among the 278 genes that showed higher upregulation in the blastema-rich group than in the blastema-poor group, we found that only one gene encoded a protein belonging to the MMP family of extracellular proteases (35.8-fold upregulated in the blastema-rich group, Fig. 1d, Supplementary Fig. 6a and Supplementary Data 1). It was characterized by a pro-domain and a zinc-binding motif with potential catalytic properties and hemopexin-like motifs (Fig. 3c). Phylogenetic analysis showed that this mmp was somehow close to Japanese scallop Mizuhopecten yessoensis MMP2-like and sea mussels Mytilus edulis MMP-17 (Supplementary Fig. 6b). qRT-PCR analysis showed that this mmp was upregulated during blastema formation until 24 hpa (Fig. 3d) and leveled off from 1 to 4 dpa (Supplementary Fig. 6c). This result suggests that this mmp may be involved in regeneration in E. japonensis, particularly in blastema formation. ISH showed that this mmp was expressed in the blastema at 5, 8, and 24 hpa (Fig. 3e, f) and in the chloragocytes, which are specialized peritoneal cells of unknown function (Supplementary Fig. 6d). These results also suggested that this mmp might be involved in blastema formation in E. japonensis.
Fig. 3. mmpReg and blastema formation.

a KEGG pathway categories of frequently detected genes differentially expressed between regenerating and intact animals. b The KEGG pathway subcategories of frequently detected genes are categorized as environmental information processing in the upper panel. c Schematic of the predicted MmpReg structure of E. japonensis. d Expression level of mmpReg during regeneration. mmpReg was upregulated after 2, 6, and 24 hpa. ***p < 0.001 (Dunnett’s test). Error bars indicate S.E.M. n = 5 for intact animals and for other time points. e, f mmpReg expression during blastema formation at 1, 5, 8, and 24 hpa using horizontal sections (e) and sagittal sections (f). Dashed lines indicate amputation sites. Scale bars represent 100 µm (e, f). A: anterior, P: posterior, D: dorsal, V: ventral (e, f). Source data are provided as a Source Data file.
To determine whether this mmp regulates blastema formation, we examined whether silencing this mmp using RNAi affected blastema formation. Soaking worms in this mmp-specific dsRNA reduced mmp expression by 40% at 24 hpa (Fig. 4a), which significantly decreased the number of cells around the amputation site compared with that in the control at 6 hpa (anterior: by 41%, p = 0.00109; posterior: by 38%, p = 2.06 × 10⁻⁴; Fig. 4b–e) and 24 hpa (anterior: by 40%, p = 9.1 × 10⁻⁵; posterior: by 37%, p = 0.00165; Fig. 4f–i). We analyzed blastema size by visualizing soxC expression. The mmp RNAi decreased blastema volume compared with that in control at 6 hpa (by 32%, p = 4.8 × 10⁻⁶) and 24 hpa (by 38%, p = 2.7 × 10⁻⁴) (Fig. 4j–m). Similarly, treatment with an MMP inhibitor (MMP2/MMP9 inhibitor I, N-([1,1′-biphenyl]-4-ylsulfonyl)-D-phenylalanine) decreased blastema volume (by 40%, p = 1.4 × 10⁻⁵) (Fig. 4n,o). These data showed this mmp is required for functions in blastema formation. Therefore, we named this mmp Ej-mmpReg (Reg referring to regeneration, hereafter referred to as mmpReg). Similar to that of soxC RNAi-induced phenotype at 2 dpa, mmpReg RNAi-treated animals did not show a significant decrease in the number of blastema cells (Supplementary Fig. 5a, f–i). At 4 dpa, no significant difference was found in blastema size, morphology, or the nervous system (Supplementary Fig. 5j, n, o). Proliferating cells were detected in the blastema of mmpReg RNAi- and control RNAi-treated animals (Supplementary Fig. 5p). These data suggested that mmpReg silencing did not affect regeneration on 2 and 4 dpa. Taken together, mmpReg is required for functions in blastema formation for at least up to 24 hpa, indicating that mmpReg promotes blastema formation.
Fig. 4. mmpReg promotes blastema formation.

a qPCR for the RNAi-mediated downregulation of mmpReg transcripts at 24 hpa (n = 4, biologically independent sample pools, p = 0.00732). Error bars indicate S.E.M. b, c Representative images of animals at 6 hpa. Bright-field images (b). The nuclei were stained with DAPI (c). d, e RNAi of mmpReg reduced the number of cells in both the anterior blastema (GFP RNAi (n = 22), mmpReg RNAi (n = 30), p = 0.00109) (d) and posterior blastema (GFP RNAi (n = 22), mmpReg RNAi (n = 29), p = 2.06 × 10⁻⁴) (e). Representative of two independent experiments (d, e). f, g Representative images of animals at 24 hpa. Bright-field images (f). The nuclei were stained with DAPI (g). h, i RNAi of mmpReg reduced the number of cells in the anterior blastema (GFP RNAi (n = 20), mmpReg RNAi (n = 32), p = 9.1 × 10⁻⁵) (h) and posterior blastema (GFP RNAi (n = 20), mmpReg RNAi (n = 31), p = 0.00165) (i). Representative of two independent experiments (h, i). j–m mmpReg RNAi resulted in a decrease in the blastema volume at 6 hpa (GFP RNAi (n = 22), mmpReg RNAi (n = 20), p = 4.8 × 10⁻⁶) (k) or 24 hpa (GFP RNAi (n = 24), mmpReg RNAi (n = 29), p = 2.7 × 10⁻⁴) (m). Representative images are shown (RNAi 6 hpa (j) or 24 hpa (l)). n, o MMP inhibitor (MMP2/MMP9 inhibitor I, N-([1,1’-biphenyl]−4-ylsulfonyl)-D-phenylalanine, CAS#:193807−58-8) resulted in decreased blastema volume at 24 hpa (DMSO (n = 22), inhibitor (n = 24), p = 1.4 × 10⁻⁵) (o). Representative images are shown (MMP inhibitor (n)). Data was combined from two independent experiments (k, m, o). t-test, *p < 0.05, **p < 0.01, ***p < 0.001(a, d, e, h, i, k, m, o). Error bars: mean ± SD (d, e, h, i, k, m, o). Scale bars represent 250 µm (c, g, j, l, n). Dashed lines indicate amputation sites (b, c, f, g, j, l, n). Dotted lines indicate the outline of regenerating worms (c, g). Ventral views (b, c, f, g). Sagittal sections (j, l, n). Source data are provided as a Source Data file.
A limitation of our study is that the RNAi-induced phenotypes for soxC and mmpReg appeared to be relatively mild. Whether this phenomenon reflects gene function or the technical limits of our gene silencing system (e.g., quick recovery from RNAi-induced silencing by 2 dpa) is unclear. In our normal protocol, intact worms were soaked with dsRNA for 24 h and amputated worms were allowed to undergo regeneration on filter paper kept moist with Milli-Q water. To continuously treat amputated worms with dsRNA, we cultured them on filter paper kept moist with dsRNA solution until 2 dpa. At 2 dpa, animals continuously treated with soxC and mmpReg dsRNA did not exhibit a significantly reduced cell number in the blastema (Supplementary Fig. 5q-u), suggesting a similar phenotype to those treated following our normal protocol (Supplementary Fig. 5a–I, q–u).
Cell proliferation and blastema formation
To clarify the mechanisms underlying soxC and mmpReg promoted blastema formation, we analyzed cell proliferation, which is a hallmark of blastema formation1. We investigated the cellular proliferation dynamics in the blastema using 5′-ethynyl-2′-deoxyuridine (EdU) labelling analysis to identify the time point at which the proliferating cells appeared in the blastema (Fig. 5a). The number of DAPI-labelled cells increased in the anterior (3 vs. 5 hpa, p < 0.05; 3 vs 8 hpa, p < 0.001; 3 vs. 24 hpa, p < 0.001; Fig. 5b, c, e) and posterior (3 vs 5 hpa, p = 0.0634; 3 vs 8 hpa, p < 0.001; 3 vs. 24 hpa, p < 0.001; Fig. 5b, c, g) blastema regions, whereas the number of EdU-incorporated cells did not increased in the anterior (0–3 hpa vs 3–5 hpa, p = 1; 0–3 hpa vs 5–8 hpa, p = 0.464; Fig. 5b, d, f) and posterior (0–3 hpa vs 3–5 hpa, p = 1; 0–3 hpa vs 5–8 hpa, p = 0.153; Fig. 5b, d, h) blastema regions, but increased during 21–24 hpa in the blastema (vs. 0–3 hpa, anterior, p < 0.001; posterior, p < 0.001; Fig. 5b, d, f, h). These data showed that the number of cells increased, whereas that of proliferating cells rarely increased at 0–8 hpa. This suggests that the cells are supplied from elsewhere to the amputation site rather than proliferate at the amputation site up to 8 hpa.
Fig. 5. Distribution of proliferating cells in blastema formation.

a Schematic drawing of EdU labelling. Small arrows indicate the fixation points with PFA–PBS. b, c, d Representative images of regenerating animals at 3, 5, 8 and 24 hpa. Bright-field images (b). The nuclei were stained with DAPI (c). EdU-incorporated cells (d). e, f, g, h The number of cells increased in both anterior blastema (e, 3 hpa (n = 18), 5 hpa (n = 32), 8 hpa (n = 18), 24 hpa (n = 25)) and posterior blastema (g, 3 hpa (n = 19), 5 hpa (n = 32), 8 hpa (n = 18), 24 hpa (n = 25)). The number of proliferating cells did not significantly increase (0–3 vs 3–5, 0–3 vs 5–8 hpa), but increased at 21–24 hpa (0–3 vs 21–24 hpa) in anterior and posterior blastema (d, f, h). *p < 0.05, **p < 0.01, ***p < 0.001. NS indicates not significant (Dunnett’s test). Representative of two independent experiments (e, f, g, h). Error bars: mean ± SD (e, f, g, h). Scale bars represent 250 µm (c, g, j, l, n). Dashed lines indicate amputation sites (b, c, d). Dotted lines indicate the outline of regenerating worms (c, d). Ventral views (b, c, d). Source data are provided as a Source Data file.
Next, to explore whether soxC and mmpReg are required for functions in cell proliferation in the blastema, we examined the effect of soxC and mmpReg RNAi on cell proliferation (Fig. 6a, i). At 3 and 5 hpa, both soxC and mmpReg RNAi did not affect the number of anterior and posterior blastema cells (soxC, p > 0.05 [Fig. 6b, c, e, g]; mmpReg, p > 0.05 [Fig. 6j, k, m, o], except for mmpReg RNAi posterior at 5 hpa p = 0.0030; Tukey– Kramer’s test) or proliferating cells (soxC, p > 0.05 [Fig. 6b, d, f, h]; mmpReg, p > 0.05 [Fig. 6j, l, n, p]; Tukey–Kramer’s test). At 8 hpa, soxC RNAi significantly decreased the number of cells around the amputation site compared with that in the control (anterior, p < 0.01 [Fig. 6b, c, e]; posterior, p < 0.05 [Fig. 6b, c, g]; Tukey–Kramer’s test), whereas the number of proliferating cells did not significantly differ at 5–8 hpa in the blastema (anterior, p = 0.91, [Fig. 6b, d, f]; posterior, p = 0.33, [Fig. 6b,d,h]; Tukey–Kramer’s test). At 24 hpa, soxC RNAi reduced both the number of DAPI-stained cells (anterior, p < 0.01, [Fig. 6b, c, e]; posterior, p < 0.0001, [Fig. 6b, c, g]; Tukey–Kramer’s test) and EdU-incorporated proliferating cells (anterior, p < 0.001, [Fig. 6b, d, f]; posterior, p < 0.05, [Fig. 6b, d, h]; Tukey–Kramer’s test). Moreover, mmpReg RNAi elicited a similar effect on the number of cells and cellular proliferation dynamics in blastema at 8 hpa (DAPI: anterior, p < 0.01; posterior, p < 0.01, [Fig. 6j,k,m,o]; EdU: anterior, p = 0.57; posterior, p = 0.44, [Fig. 6j, l, n, p]; Tukey–Kramer’s test) and 24 hpa (DAPI: anterior, p < 0.0001; posterior, p < 0.0001, [Fig. 6j, k, m, o]; EdU: anterior, p < 0.0001; posterior, p < 0.01, [Fig. 6j, l, n, p]; Tukey–Kramer’s test). These data showed that for at least up to 5–8 hpa, both soxC and mmpReg are not required for cell proliferation, but functions to supply cells to the amputation site; they are required subsequently for cell proliferation.
Fig. 6. Distribution of proliferating cells in the blastema of RNAi-subjected worms.

a Schematic drawing of EdU labelling in soxC RNAi-subjected worms. Small arrows indicate the fixation points with PFA–PBS. b, c, d Representative images of regenerating animals at 8 and 24 hpa. Bright-field images (b). The nuclei were stained with DAPI (c). EdU-incorporated cells (d). e, f, g, h Quantification of DAPI-stained cells. 3 hpa (GFP (n = 41), soxC (n = 43)), 5 hpa (GFP (n = 47), soxC (n = 44), 8 hpa (GFP (n = 43), soxC (n = 44)), 24 hpa (GFP (n = 40), soxC (n = 42)) in the anterior blastema (e) and 3hpa (GFP (n = 40), soxC (n = 42)), 5 hpa (GFP (n = 46), soxC (n = 41)), 8 hpa (GFP (n = 43)), soxC (n = 44)), 24 hpa (GFP (n = 38), soxC (n = 38)) in the posterior blastema (g). Quantification of EdU-incorporated cells in the anterior blastema (f) and posterior blastema (h). i Schematic drawing of EdU labelling in mmpReg RNAi worms. Small arrows indicate the fixation points with PFA–PBS. j, k, l Representative images of regenerating animals at 8 and 24 hpa. Bright-field images (j). The nuclei were stained with DAPI (k). EdU-incorporated cells (l). m, n, o, p Quantification of DAPI-stained cells. 3 hpa (GFP (n = 40), soxC (n = 31)), 5 hpa (GFP (n = 35), soxC (n = 34), 8 hpa (GFP (n = 45), soxC (n = 52)), 24 hpa (GFP (n = 44), soxC (n = 44)) in the anterior blastema (m) and 3hpa (GFP (n = 39), soxC (n = 31)), 5 hpa (GFP (n = 35), soxC (n = 34)), 8 hpa (GFP (n = 44)), soxC (n = 51)), 24 hpa (GFP (n = 43), soxC (n = 44)) in the posterior blastema (o). Quantification of EdU-incorporated cells in the anterior blastema (n) and posterior blastema (p). *p < 0.05, **p < 0.01, ***p < 0.001. NS indicates not significant (Tukey-Kramer’s test). Error bars: mean ± SD (e, f, g, h, m, n, o, p). Dashed lines indicate amputation sites (b, c, d, j, k, l). Dotted lines indicate the outline of regenerating worms (c, d, k, l). Ventral views (b, c, d, j, k, l). Source data are provided as a Source Data file.
Expression patterns of stem cell marker genes at homeostatic state
To elucidate the relationship between soxC-expressing cells and putative stem cells at the homeostatic state, we examined the expression patterns of known stem cell marker genes in E. japonensis (0 hpa or intact worm). We used the germline multipotency program (GMP) genes, including piwi, vasa, nanos, and pl10, as stem cell marker genes as they are broadly expressed in germline and multipotent stem cells in animals43. We analyzed the 86,094 assembled contigs obtained from our transcriptomic analysis and identified two vasa genes (Ej-vasa1 and Ej-vasa2), Ej-nanos, Ej-pl10, and Ej-piwi (Supplementary Fig. 8a,b,c). All five GMP genes were not differentially expressed between the blastema-rich and intact groups (>1.0- and <1.7-fold). The amino acid sequence of Ej-vasa1 was similar to that of Ej-vasa-like gene (vlg)-1 (89.9% identity, Supplementary Fig. 9a), and the amino acid sequence of Ej-vasa2 was similar to that of Ej-vlg-2 (86.6% identity, Supplementary Fig. 9b), as previously reported for E. japonensis44. Some previous studies have partially examined the expression patterns of some GMP genes in E. japonensis28,44,45. Our ISH analysis showed the presence of Ej-vasa1-positive cells close to the body wall just after amputation (0 hpa) (Fig. 7a, Supplementary Fig. 11a) and in intact worms (Supplementary Fig. 12a, b). The expression pattern of Ej-vasa1 at 0 hpa was highly similar to those in intact worms, suggesting that 0 hpa time point can be considered as the homeostatic state. Consistent with a previous study28, Ej-piwi-expressing cells were found on the VNC (Fig. 7d). These cells act as germ cell precursors during gonad regeneration in E. japonensis28. Ej-nanos and Ej-pl10 were expressed in the cells close to the body wall after amputation at 0 hpa (Fig. 7b, c, Supplementary Fig. 11b,c) but Ej-piwi and Ej-vasa2 were not detected in the cells close to the body wall after amputation at 0 hpa (Fig. 7d, e, Supplementary Fig. 11d, e). Additionally, Ej-vasa2 was expressed in cells in the body cavity at 0 hpa (Fig. 7e). The expression patterns of all GMP genes that were tested differed from that of soxC in a homeostatic state.
Fig. 7. Expression of GMP genes during blastema formation in E. japonensis.

a–e GMP gene (Ej-vasa1 (a), Ej-nanos (b), Ej-pl10 (c), Ej-piwi (d), Ej-vasa2 (e)) expression during blastema formation at 0, 1, 5, and 24 hpa in horizontal sections (upper eight panels) and sagittal sections (lower eight panels). Dashed lines indicate amputation sites. f GMP gene expression in gonad and PGZ at 0 hpa. Expression level varies depending on the GMP gene, but all GMP genes were expressed in the gonad and PGZ, except for Ej-piwi in PGZ at 0 hpa. Arrowheads in the left panels indicate the position of the gonad, and arrowheads in the right panels indicate the position of PGZ. g GMP gene expression in neoblast at 0 hpa. Ej-vasa1 was expressed in neoblasts, whereas the other GMP genes were not detected in neoblasts at 0 hpa. The regions around the septa are shown in each panel. Dotted lines indicate the outline of neoblasts. Scale bars represent 250 µm (a–f) and 20 µm (g). A: anterior, P: posterior, D: dorsal, V: ventral (a–f). All images are representative of at least two independent experiments (a–g).
Next, we examined the expression pattern of the GMP genes in the body parts where putative stem cells are considered to be present: the posterior growth zone (PGZ), gonad (recently referred to as multipotent progenitor cell (MPC) clusters in a marine annelid Capitella teleta46), and neoblasts13. The gonad expressed all GMP genes that were examined (Ej-vasa1, Ej-vasa2, Ej-nanos, Ej-pl10, Ej-piwi) (Fig. 7f), whereas PGZ expressed all GMP genes except Ej-piwi (Ej-vasa1, Ej-vasa2, Ej-nanos, Ej-pl10) (Fig. 7f, Supplementary Fig. 11f). In contrast, the neoblasts only expressed Ej-vasa1 (Fig. 7g, Supplementary Fig. 10). Furthermore, soxC was expressed in PGZ but not in the gonad and neoblasts (Supplementary Figs. 3a, b, 10b). Taken together, these data showed that the expression patterns of the tested GMP genes were different from that of soxC except for PGZ.
Expression dynamics of soxC and GMP genes are different
To understand the relationship between soxC-expressing cells and putative stem cells during blastema formation, ISH for the GMP genes was performed. At 5 hpa, soxC-expressing cells were present (Fig. 1f,g) but Ej-vasa1-expressing cells were absent in the blastema (Fig. 7a). In contrast, at 24 hpa, Ej-vasa1 was expressed in a small portion of the blastema (Fig. 7a), which is reminiscent of the results of previous studies in other annelids47,48 that GMP genes were expressed de novo in the early blastema. To clarify the relationship between the Ej-vasa1-expressing and soxC-expressing cells, we examined whether Ej-vasa1 and soxC were co-expressed in blastema. A double ISH analysis revealed that the soxC and Ej-vasa1 expression patterns did not fully overlap in the blastema (18 out of 18 fragments) (Fig. 8). Ej-piwi-expressing cells were not found in the blastema even at 0–24 hpa (Fig. 7d). Similarly, Ej-vasa1, Ej-nanos, Ej-pl10, and Ej-vasa2 were not detected in the cells near the anterior or posterior amputation sites at 0–5 hpa (Fig. 7a, b, c, e) but were expressed in a small portion of the blastema at 24 hpa (Fig. 7a,b,c,e). The neoblasts only expressed Ej-vasa1 at 0–24 hpa (Fig. 7g, Supplementary Fig. 10a). The expression pattern of all the tested GMP genes varied considerably from that of soxC during blastema formation, particularly at 0–5 hpa.
Fig. 8. Double ISH of soxC and Ej-vasa1 in blastema formation.
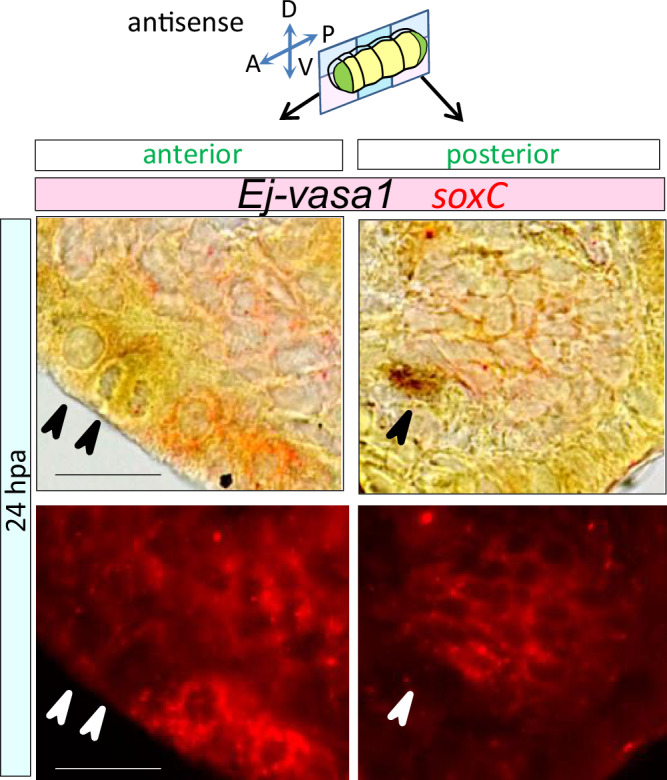
DIG-labeled soxC and fluorescence-labeled Ej-vasa1 RNA antisense probes were used for double ISH in horizontal sections of regenerating worms at 24 hpa. Arrowheads indicate the position of Ej-vasa1-expressing cells. Scale bars represent 25 µm. Representative of two independent experiments.
Expression dynamics of soxC genes during tadpole tail blastema formation
We consider the possibility that animals other than annelid may display similar expression dynamics of soxC during blastema formation because SOXC transcription factors are widely conserved across animals49. In many vertebrates, SOX4, SOX11, and SOX12 constitute the SOXC family50. We examined this possibility using blastema in regenerating the African claw frog (X. laevis, amphibian) tadpole tail. Blastema formed within 48 hpa in the tadpole tail51 (Fig. 9a). ISH was performed using serial sections of regenerating tadpole tail. It showed that Xl-sox4 and Xl-sox11 were not detected just after amputation at 0 hpa (Fig. 9b,e); only Xl-sox11 was expressed around amputation sites at 6 hpa (Fig. 9b,e). Then, both Xl-sox4 and Xl-sox11 were expressed around amputation sites at 24 hpa (Fig. 9b,c), particularly underneath the outer layer that covers the wounds (Fig. 9c,f). At 48 hpa, Xl-sox4 and Xl-sox11 were expressed abundantly in the blastema (Fig. 9b,e). Time–course ISH analysis showed that Xl-soxC-expressing cells appeared to accumulate gradually in the blastema. qRT-PCR showed that the Xl-sox4 and Xl-sox11 expression levels increased in the regenerating tadpole tail, including the blastema (Fig. 9d,g). Overall, these data indicate that the regenerating frog tadpole tail displays similar expression dynamics as that of soxC in E. japonensis in blastema formation.
Fig. 9. Xl-sox4 and Xl-sox11 expression in the blastema formation of tadpole tails.

a Schematic drawing of tadpole tail blastema formation. A: anterior, P: posterior, D: dorsal, V: ventral. b Xl-sox4 expression during blastema formation at 0, 6, 24 and 48 hpa. The sense controls are shown on the lower panels. c Magnified view of the boxed areas in (b, 24 hpa). d Expression level of Xl-sox4 during blastema formation. sox4 was upregulated after amputation. n = 4 for time points. e Xl-sox11 expression during blastema formation at 0, 6, 24 and 48 hpa. The sense controls are shown on the lower panels. f Magnified view of the boxed areas in (e, 24 hpa). g Expression level of Xl-sox11 during blastema formation. Xl-sox11 was upregulated after amputation. n = 4 for time points. (d, g) Error bars indicate S.E.M. *p < 0.05, **p < 0.01, ***p < 0.001 (Dunnett’s test). Dashed lines indicate amputation sites (a, b, e). Source data are provided as a Source Data file.
Discussion
In this study, we identified 278 upregulated (Fig. 1d, Supplementary Data 1) and 124 downregulated (Supplementary Fig. 1a, Supplementary Data 2) genes involved in blastema formation in E. japonensis using large-scale RNA-seq. Additionally, we developed a system for silencing genes in the potworms, which involves soaking or feeding the worms with dsRNA. This system is an easily applicable, reproducible, and minimally invasive strategy for gene silencing (Figs. 2a–o, 4a–m, 6a–p, Supplementary Fig. 5a–p) (the first RNAi study using injection in E. japonensis was published by Takeo, et al.33). We expect that analyzing the functions of the genes on our lists using the functional RNAi tool would significantly contribute to enhancing our understanding of the molecular and cellular basis of blastema formation in E. japonensis. Here, we present the significance of two genes (soxC and mmpReg) that are upregulated in blastema formation.
We found that soxC was rarely expressed in the homeostatic state (Supplementary Fig. 3) and was upregulated during regeneration (Fig. 1f,g). After amputation, soxC was expressed selectively close to the body wall and septa near the amputation site at 1 hpa (posterior) and 3 hpa (anterior and posterior) (Fig. 1f,g). The soxC-expressing cells near the body wall were spread out and flat (Fig. 1f”,f”’), which is typical of migrating cells39,40. Subsequently, the area in which soxC was expressed gradually increased (Fig. 1f,g). The area of soxC-expressing cells encompassed to a large part of the developing blastema at 24 hpa (Fig. 1f,g, Supplementary Fig. 4a,b). Furthermore, soxC silencing led to a significant decrease in the number of cells around the amputation site at 6 and 24 hpa (Fig. 2a–o), showing that soxC is required for functions in blastema formation at least up to 24 hpa. Taken together, these results suggest that soxC can be used as a representative marker for blastema formation (Fig. 10a).
Fig. 10. Model for blastema formation in E. japonensis.

a GMP gene(s)-expressing cells (ASCs, shown in blue) are present in intact worms. soxC-expressing cells (shown in red) might be the cells supplied to the amputation site. The relationship between soxC-expressing cells and ASCs remains unclear. soxC-expressing cells were distinct from the population of cells on the VNC (shown in orange), which are Ej-piwi-positive cells that serve as germ cell precursors. b Similarity in expression dynamics of SoxC genes in E. japonensis and X. laevis raised the possibility of the common cellular mechanisms underlying blastema formation in both species. In the cnidarian polyp Hydra vulgaris, HvSoxC was expressed in a transition state between i-cells and differentiated cells63 (*).
The multipotent stem cells maintained in the adults (hereafter referred to as adult stem cells (ASCs)) of other whole-body regeneration animals generally express GMP genes7,52. For instance, neoblasts in planaria are molecularly defined by the expression of piwi-153. Multipotent interstitial stem cells (i-cells) in Hydra expressed piwi, Vasa, and PL1054,55. We found that in E. japonesis, Ej-vasa1 was expressed in all putative ASC niches, which we have described subsequently. Furthermore, Ej-vasa1 was expressed abundantly in the homeostatic state (Supplementary Fig. 12a). These results suggest that Ej-vasa1 can be used as a representative marker for ASCs in E. japonensis. Additionally, GMP genes were not found in blastema at 0–5 hpa (Fig. 7a–e). In contrast, soxC was not detected at 0 hpa (Fig. 1f,g) and was expressed in blastema at 3–5 hpa (Fig. 1f,g), showing that soxC and Ej-vasa1 distribution patterns differed in blastema. Moreover, their distribution patterns did not fully overlap in blastema (Fig. 1f, g, Fig. 7a), as confirmed by the double ISH analysis results at 24 hpa (Fig. 8). Taken together, these data suggest that a part of the ASC population differed from that of the soxC-expressing cells. Currently, the relationship between soxC-expressing cells and ASCs remains unclear, and further information may be obtained by enumerating the relationship between soxC-expressing cells and ASCs in annelid blastema formation (Fig. 10a).
In annelids, putative ASCs found in the PGZ, gonad (recently referred to as MPC clusters in a marine annelid, C. teleta46), and neoblasts13. The PGZ of annelids is a highly proliferative region at the posterior tip of the body that produces new segments during normal growth48,56,57. In E. japonensis, the PGZ expressed all the tested GMP genes with the exception of Ej-piwi, showing that PGZ contains putative ASCs (Fig. 7f, Supplementary Fig. 11f). Additionally, soxC was expressed in the PGZ at the homeostatic state (Supplementary Figs. 3, 10b), suggesting that soxC is also involved in normal growth. The gonad was identified in the 7th and 8th segments in E. japonensis28. A pair of neoblasts are located adjacent to the septa in each E. japonensis segment58. Neoblasts of annelids have been hypothesized to correspond to ASCs4, although this is yet to be proven. In contrast, in planaria, neoblasts were proven to be multipotent through an elegant transplantation experiment25. In E. japonensis, neoblasts only expressed Ej-vasa1 (Fig. 7g), whereas the cells close to the body wall expressed Ej-vasa1, Ej-nanos, and Ej-pl10 (Fig. 7a–c). The GMP gene-expressing cells close to the body wall appeared to be distinct from neoblasts. These results suggest the heterogeneity of vasa1-expressing ASCs.
Historically, many studies have speculated that a population of cells might migrate to blastema along the VNC4,13,23,24 instead of through the body wall in oligochaete; however, limited evidence is available. Recently, time-lapse imaging of a freshwater annelid Pristina leidyi showed wound-directed migrating cells40. However, these migrating cells were detected and classified using purely morphological features, with no molecular markers available. Owing to the lack of molecular markers, the types of cells that contribute to blastema formation remain unknown. To date, ISH analysis in E. japonensis using GMP genes as markers has shown that Ej-vasa1-expressing cells and Ej-piwi-expressing cells are attached to the dorsal side of the VNC28,44 (consistent with the data shown in Fig. 7a, d) and that Ej-vasa1 and Ej-piwi are co-expressed44. Ej-piwi-expressing germ cell precursors attached to the VNC were suggested to migrate to blastema28. However, Ej-piwi-expressing cells were not detected in the blastema at 0–24 hpa28 (consistent with our data in Fig. 7d). Hence, no evidence exists that Ej-piwi-expressing cells are related to blastema formation at least 0–24 hpa. Another study claimed that Ej-vasa1-expressing cells found close to the body wall could migrate to blastema based on the results of an ISH analysis at 48 hpa45. However, we found that Ej-vasa1-expressing cells were not detected in the blastema at 0–5 hpa (Fig. 7a), whereas a certain number of DAPI-stained cells were detected in blastema up to 5 hpa (Fig. 5c,e,g). Hence, no evidence exists that Ej-vasa1-expressing cells are related to blastema formation at least at 0–5 hpa. In contrast, soxC-expressing cells were found close to the body wall and septa near the amputation site at 1 hpa (posterior) and 3 hpa (anterior and posterior) (Fig. 1f,g). Time–course ISH analysis showed that soxC-expressing cells appeared to gradually accumulate in the blastema (Fig. 1f,g). The area of soxC-expressing cells encompassed to a large part of the developing blastema (Fig. 1f,g, Supplementary Fig. 4a,b). Expression dynamics of soxC tended to coincide with the increase in the number of DAPI-stained cells during blastema formation (Figs. 1h, 5e,g). Additionally, RNAi experiments showed that soxC is required for functions in blastema formation at 6 and 24 hpa (Fig. 2a–o). All these data suggest that soxC-expressing cells contribute to blastema formation. We further investigated the cellular proliferation dynamics in the blastema using EdU labelling analysis and found that the number of cells in the blastema gradually increased before they started proliferating at 8 hpa (Fig. 5a–h). This suggests that the cells were supplied from elsewhere to the amputation site up to 8 hpa rather than proliferated. Before the onset of cell proliferation, soxC RNAi led to a significant decrease in the number of cells in blastema (Fig. 6a,b,c,e,g). This result suggests that soxC is required for functions to supply cells from elsewhere to the amputation site up to 8 hpa. Taken together, possibly, soxC-expressing cells may be the cells supplied to the amputation site (Fig. 10a).
We identified mmpReg as another upregulated gene in blastema formation. Recently, a single-cell RNA-seq (scRNA-seq) study in salamander limb regeneration showed that Mmp8 and Mmp13 were upregulated during blastema formation, indicating extensive ECM remodeling by MMPs59. Similar to the results obtained using soxC RNAi, mmpReg silencing decreased the number of cells in blastema and delayed blastema formation at 6 and 24 hpa. Before onset of cell proliferation (at 8 hpa), mmpReg RNAi significantly decreased the number of cells in the blastema (Fig. 6a,b,c,e,g). We analyzed the size of blastema by visualizing soxC expression. At 6 and 24 hpa, mmpReg RNAi and MMP inhibitor decreased the volume of the blastema (Fig. 4j–o). Our data indicate that mmpReg promotes blastema formation. Notably, the role of MmpReg in regenerating E. japonensis needs to be clarified by determining the substrate ECM proteins and the stimulation factors that release MmpReg to better understand the whole picture of blastema formation at the molecular level. Currently, we did not detect an epistatic relationship between soxC and mmpReg in terms of level of expression by knock-down (Supplementary Fig. 7a,b). However, further investigation of the relationship between soxC-expressing cells and MmpReg could provide valuable information.
SOXC transcription factors are widely conserved across animals49. SOX4 and SOX11 (in mammals, SOX4, SOX11, and SOX12 constitute the SOXC family) were highly expressed in embryonic epidermal cells and re-expressed in postnatal skin wounds in mice60. SOX4 and SOX11 regulate downstream cytoskeleton genes, one of which was required for cell migration60. In zebrafish, the result of a knock-down analysis suggested that sox11b regulates the migration of Muller glia-derived progenitor cells and their fate determination during retina regeneration61. During cerebral development in mice, Sox11 inhibition suppressed the radial migration of cortical neurons62. Overall, these results in addition to those inferred from the present study suggest that SOXC gene(s)-expression may be a characteristic of migrating cells across different contexts and animal species.
If SOXC gene(s)-expression reflects a characteristic of blastema cell mass across different animal species, similar expression dynamics in blastema formation would be found in other animals. We found Xl-sox4 and Xl-sox11-expressing cells appeared to accumulate in the blastema in the regenerating tadpole tail. Our data point to a similarity in the expression dynamics of SoxC genes in the blastema formation in E. japonensis and X. laevis, raising the possibility of common cellular mechanisms underlying blastema formation in both species (Fig. 10b). Recently, in the cnidarian polyp Hydra vulgaris, HvSoxC was found to be expressed in a transition state between i-cells and differentiated cells, which suggests that HvSoxC is a marker for cells in a transition state63. At present, whether HvSoxC-expressing cells migrate is unknown, and further studies are warranted to determine the migration capabilities of the HvSoxC-expressing cells. In planaria, scRNA-seq suggested that soxP-1 is expressed in multiple lineage progenitors64. In the acoel worm Hofstenia miamia, scRNA-seq suggested that sox-1 was expressed in the likely neural specialized neoblast population65. However, the relationship of soxP-1 in planaria or sox-1 in acoel worm and SOXC family needs to be verified. Notably, examining the expression dynamics of soxP-1 in planaria and sox-1 in acoal worm in blastema formation may provide important information. Further studies on the expression dynamics and behavior of SOXC gene(s)-expressing cells in various regeneration animal models would help understand whether the cellular mechanisms underlying blastema formation can be generalized among across species.
Methods
Animals
Enchytraeus japonensis34 worms were reared in 1.0% agar in Holtfreter’s solution (15 mM NaCl, 0.2 mM KCl, 0.6 mM NaHCO3, 0.2 mM MgSO47H2O, and 0.2 mM CaCl2) in 150-mm disposable Petri dishes at 24 °C and fed with rolled oats (Quaker Oats). Under these conditions, E. japonensis grows continuously to approximately 10 mm in length and reproduces asexually by fragmentation approximately every 2 weeks. Artificial amputation of E. japonensis was performed using needle-sharp tweezers (Feather, K-715). The amputees were cultured on filter paper (Whatman No 3030917) and kept moist at 24 °C with Milli-Q water in 60 × 10 mm disposable Petri dishes. E. japonensis was provided by Dr. Yoshida-Noro, C. (Nihon University, Tokyo, Japan).
Niewkoop and Faber stage66 51–53 Tadpoles (X. laevis) were purchased from a Japanese company (Watanabe Zoushoku). The tadpoles were maintained in tap water, which was left in a bucket overnight and filtered with canister filters (EHEIM Classic Model 2213). The tadpoles were fed with dumplings made of barely grass powder (Yamamoto Kampo Pharmaceutical Co.) and Ceramicron (Cera Japan Co.) mixed with Milli-Q water. The water and dumplings were replaced every day. Tail amputation was performed using fine razor blades after the tadpoles were anesthetized with ice. The amputated tadpoles were kept in the water at 20 °C and allowed to regenerate. The regenerating tail tissues including the blastema (about 5 mm long from the amputation site) were collected. These experiments were performed by following the recommendations of the Guidelines for Proper Conduct of Animal Experiments of the Science Council of Japan. The protocol was approved by the Committee on the Ethics of Animal Experiments of Teikyo University.
cDNA cloning and RNA probe preparation
Worms were cut into several fragments (normally 6–8) and allowed to regenerate for 24 h. Total RNA was extracted from approximately 100 regenerating fragments using TRIzol Reagent (Invitrogen) and reverse-transcribed using the SuperScript III kit (Invitrogen) using an oligo (dT) primer, by following the manufacturer’s protocol. RT-PCR was performed using the following gene-specific primer pairs:
soxC: (Forward) 5′-ATGATACTAAGTTCTAAAAT-3′ and (Reverse) 5′-TTAGTTCACCAATCTCTTA-3′;
mmpReg: (Forward) 5′-AACCAGTAACCAAGGCAACG-3′ and (Reverse) 5′-CCCTCATGATTTACGCCACT-3′;
Ej-vasa1: (Forward) 5′-GCCCGTTGATCCTGATAAGA-3′ and (Reverse) 5′-TGTTACCACATCGCCCTGTA-3′;
Ej-vasa2: (Forward) 5′- CTGGTAAAACGGCATCATTTCTC -3′ and (Reverse)5′-TTCTCCAGCCACTCCGGCAC-3′;
Ej-nanos: (Forward) 5′-GCTCGTTGGAATCGATTAGTG-3′ and (Reverse) 5′-CCCACACTGACTTGTGGTTG-3′;
Ej-pl10: (Forward) 5′-TTCTGGCTGTGGGAAGAGTT-3′ and (Reverse) 5′-CTGCTCCTCGAGCCATTTAG-3′;
Ej-piwi: (Forward) 5′-GATCAAACAGCACACGGATG-3′ and (Reverse) 5′-CTTGGTCCCATCTTCTCTCG-3′.
The PCR products were subcloned into the pGEM-T easy vector (Promega), and the sequences were confirmed using Sanger sequencing. The plasmids containing the cDNA fragments for soxC, mmpReg, Ej-vasa1, Ej-vasa2, Ej-nanos, Ej-pl10, and Ej-piwi were amplified using PCR with the M13 primer pair. The amplicons containing the T7 and SP6 promoter sites were purified using a PCR purification kit (Qiagen). Digoxigenin (DIG)-labeled sense and antisense RNA probes were prepared via in vitro transcription using the DIG RNA labeling kit (Roche). For double ISH analysis, Ej-vasa1 fluorescein-labeled sense and antisense RNA probes were prepared through in vitro transcription using the fluorescein RNA labeling kit (Roche). For the preparation of Xl-sox4S and Xl-sox11S RNA probes, template DNA corresponding to full-length Xl-sox4S (GenBank accession number: AF186844) or Xl-sox11S (GenBank accession number: D83650) cDNA with T7 and SP6 promoter sites were synthesized and purchased from Twist Biosciences (South San Francisco, CA, USA).
ISH
The worms were fixed overnight in 4% paraformaldehyde in 0.1 M phosphate-buffered saline (pH 7.5, PFA–PBS) at 4 °C. For cryoprotection, the fixed samples were placed overnight in an 18% sucrose/PFA–PBS solution at 4 °C. Subsequently, the worms with sucrose substitution were embedded in Tissue-Tek OCT compound (Sakura Finetechnica) using a Cryomold (Sakura Finetechnical), frozen immediately on dry ice, and stored at −80 °C until sectioning was performed. The frozen worm blocks were cut into 12 µm-thick sections using a cryostat (CM3050S; Leica Biosystems). Ten serial sections were mounted on a glass slide, and the sectioned specimens were fixed in PFA–PBS. After incubation in 10 μg/ml of proteinase K in 10 mM Tris/HCl and 1 mM EDTA, the specimens were post-fixed for 10 min in PFA–PBS, treated with 0.2 M HCl for 10 min, washed in PBS, and treated with 0.25% acetic anhydride in 0.1 M triethanolamine (pH 7.5) for 1 h. Hybridization was performed at 70 °C for 16 h in ULTRAhybTM Hybridization Buffer (Ambion) containing 500 ng/ml of the probe. The hybridized specimens were washed twice in wash buffer (50% formamide, 2× saline-sodium citrate (SSC) buffer) at 70 °C for 10 min, subjected to RNase treatment (20 mg/ml) in TNE (10 mM Tris, 1 mM EDTA, and 0.5 M NaCl [pH 7.5]) for 10 min, and washed in TNE for 10 min. After stringent washes with a series of SSC buffers, the specimens were incubated at 25 °C for 1 h in 1.5% blocking reagent (Roche, cat. # 11096176001) in DIG buffer I (100 mM Tris, 150 mM NaCl, pH 7.5), followed by incubation at 25 °C for 30 min with the alkaline phosphatase (AP)-conjugated anti-DIG antibody (Roche, cat. # 11093274910, 1:1000 dilution) in 1.5 % blocking reagents. After incubation, the specimens were washed twice at 25 °C with DIG buffer I for 20 min each time. For signal visualization, a chromogenic reaction was performed with a nitro blue tetrazolium/5-bromo-4-chloro-3-indolyl phosphate (NBT/BCIP, Roche) at 25 °C for 18 h until the signal pattern levelled off. The sections were counterstained with nuclear fast red solution (ScyTek Laboratorie). Bright-field images of whole sections on each slide glass were semi-automatically captured using the NanoZoomer 2.0HT or NanoZoomer XR systems (Hamamatsu Photonics). The microscopic fields of interest were cropped using the NDP.view2 software (ver. 2.7.25; Hamamatsu Photonics). The cropped images were converted to 8-bit images, and their brightness and contrast were adjusted using ImageJ (ver. 1.52a; National Institutes of Health). Sense probes were used as negative controls.
ISH was performed in the regenerating tadpole tail tissues using the same protocol as that used for worms with minor modifications. The frozen blocks were cut into 10 µm-thick sections using a cryostat. Six serial sections were mounted alternatively on two glass slides. One slide glass was used for the antisense probe and the other was used for the sense probe.
Double ISH
The process from the re-fixation of sections to the chromogenic reaction with NBT/BCIP was performed as described earlier, except for hybridization. DIG-labeled RNA probes and fluorescein-labeled RNA probes were mixed and mounted simultaneously during hybridization. After the first chromogenic reaction with NBT/BCIP, the AP-conjugated anti-DIG antibody was detached using 100 mM glycine (pH 2.2). After washing in PBS, the fluorescein-labeled probes were immunohistochemically detected using the AP-conjugated anti-fluorescein antibody (Roche, cat # 11426338910, 1:1000 dilution). To visualize the signals, the second color chromogenic reactions were performed for 4 days at room temperature with SIGMAFAST Fast Red TR/Naphthol AS-MX tablets (Sigma-Aldrich, cat. # F4523). Sense probes were used as negative controls.
Transcriptome seq, assembly, and annotation
Total RNA was extracted from the intact group (20 worms), blastema-poor group (about 100 fragments, 24 hpa) and blastema-rich group (about 100 fragments, 24 hpa) using TRIzol. Total RNA was further purified using RNeasy Plus Mini Kit (Qiagen) and submitted to Macrogen Corp. (https://www.macrogen-japan.co.jp/). The RNAs were purified by ribo-zero RNA removal kit (Illumina). Sequencing libraries were generated using the TruSeq Stranded mRNA LT Sample Prep Kit (Illumina). The libraries were sequenced on the NovaSeq 6000 platform, and 150 bp paired-end reads were generated. Raw sequences were deposited in the NCBI Short Read Archive (SRA) database (http://www.ncbi.nlm.nih.gov/Traces/sra/) under the accession numbers: SRR21413950, SRR21413951, and SRR21413952. Trimmomatic 0.38 (http://www.usadellab.org/cms/?page=trimmomatic) was used to quality trim the reads using the default settings, and the remaining clean reads were assembled using Trinity version trinityrnaseq_r20140717, bowtie 1.1.2 (https://github.com/trinityrnaseq/trinityrnaseq/wiki) for transcriptome assembly without a reference genome. The longest transcript for each gene was selected as the unigene. For annotation analysis, the unigenes were searched against the KEGG, NCBI Nucleotide (NT), Pfam, Gene ontology (GO), NCBI non-redundant Protein (NR), UniProt, and EggNOG using BLASTN of NCBI BLAST version 2.9.0 (https://blast.ncbi.nlm.nih.gov/Blast.cgi) and BLASTX of DIAMOND version 0.9.21 (https://github.com/bbuchfink/diamond) software with an E-value default cut-off of 1.0E-5. The differentially expressed genes (DEGs) between the control (intact group) and regeneration groups (blastema-rich group or blastema-poor group) were identified using DEGseq analysis from the adjusted read count data. Statistical analyses were performed using fold change and Fisher’s exact test using edgeR per comparison pair. The significant DEGs were determined by setting the threshold of fold change to >2 and Fisher’s exact test at a raw p-value to <0.05. The unigenes were annotated based on BLASTX results, and the best alignments were used for downstream analyses. The GO and KEGG databases were used to predict the functions of the unigenes. Pathway analysis was performed using the KEGG Mapper tool (http://www.genome.jp/kegg/tool/map_pathway2.html). NCBI-gi numbers were applied as queries, and the acquired pathway search results were grouped under the KEGG pathway maps.
5′-rapid amplification of cDNA end (RACE) for mmpReg
5′-RACE was performed using the SMARTerRACE5′/3′ kit (Takara Bio) according to the manufacturer’s protocol. Briefly, after first-strand cDNA synthesis, PCR was performed using the gene-specific primer 5′- TCACCTCCTCGACCTTCTCCTGG -3′ and the universal primer included in the kit. Nested PCR was performed using the gene-specific primer 5′-CGGTACCCGGGGATCGCCATCCTGATGATAGCCTGATGAG -3′ and the universal primer short included in the kit. The gene-specific primer for nested PCR contained a sequence at its 5′ ends for cloning of RACE products (CGGTACCCGGGGATC). Cloning was performed using the In-Fusion Snap Assembly Master Mix (Takara Bio) according to the manufacturer’s protocol.
Phylogenetic analysis
Multiple sequence analysis was performed using Clustal X 2.1 [https://clustalx.software.informer.com/2.1/] using complete sequences from the selected eukaryotic species. A phylogenetic tree was constructed using the Draw tree option in Clustal X67 using the Neighbor-Joining algorithm with default settings (Gap opening:10, Gap extension:0.2, bootstrap number:1000), and the output file was analyzed using NJplot software68 [http://pbil.univ-lyon1.fr/software/njplot.html]. The names of the genes and their accession numbers used for the phylogenetic analysis are listed in Supplementary Data 4. The E. japonensis sequences have been submitted to the DNA Data Bank of Japan (DDBJ) nucleotide database (LC727633, Ej-mmpReg; LC727634, Ej-nanos; LC727635, Ej-piwi; LC727636, Ej-pl10; LC727637, Ej-soxC: LC727638, Ej-vasa1; LC727639, Ej-vasa2; LC727632, Ej-gapdh).
RNAi and inhibitor experiments
dsRNA was synthesized by following the protocol for RNAi in planarians with some modifications69. Briefly, DNA templates used for subsequent dsRNA synthesis were generated using PCR, and primers were designed to amplify limited regions of the cDNA sequence for each gene. Each primer contained a T7 promoter sequence at its 5′-end (TAATACGACTCACTATAGGGAGACCAC). The following PCR primers were used:
soxC: (Forward) 5′-TAAGCTGTGATGAGCTGAATCA-3′ and (Reverse) 5′-CACCAATCTCTTAATATTCCCA-3′;
mmpReg: (Forward) 5′-AACCAGTAACCAAGGCAACG-3′ and (Reverse) 5′-CCCTCATGATTTACGCCACT-3′;
GFP: (Forward) 5′-GTGCCCATCCTGGTCGAGCT-3′ and (Reverse) 5′-ACTTGTACAGCTCGTCCATGCC-3′.
dsRNA was synthesized using the MegaScriptTM T7 kit (Invitrogen) by following the manufacturer’s instructions. The typical yield was approximately 50 μg of dsRNA per reaction. dsRNA (50 μg/100 μl) was diluted with 900 μl of Milli-Q water (5 μg/μl). Each worm was soaked in 5 μl of dsRNA in a 96-well plate at 24 °C. In all cases, the animals were transferred to a large volume of Milli-Q water and amputated 1 days after RNAi soaking. The amputated worms were allowed to undergo regeneration on filter paper that was kept moist with Milli-Q water. For the inhibitor experiment, MMP-2/MMP-9 inhibitor I (Cayman, CAS#193807-58-8) was used. The animals were soaked in 10 μM of inhibitor in 0.3% DMSO/PBS for 24 h at 24 °C, followed by amputation. The amputees were cultured on filter paper kept moist with 10 μM of inhibitor in 0.3% DMSO/PBS in Petri dishes at 24 °C.
Determination of amputation site
The amputation site was determined on the image at a site where the curvature of the body wall suddenly changes. Care was taken to avoid chloragocytes and intestines as much as possible from the amputation site to the tip (Supplementary Fig. 13).
Image analysis for evaluation of RNAi and inhibitor phenotype
The worms were fixed after 6 h or 24 h of amputation, and serial sections were subjected to ISH for soxC. We selected adjacent serial sections (three consecutive sections) in which signals were detected. The images, including blastema, were cropped and converted to 8-bit images using ImageJ software. The threshold for binarization was determined to appropriately measure the area of positive signals detected. The total area was calculated from the sum of the values obtained from three consecutive sections.
Fluorescent image acquisition and quantification
For EdU labeling, the Click-iT EdU Alexa Fluor 488 Imaging Kit (Life Technologies, cat. # C10337) was used by following the manufacturer’s protocol with minor modifications. Briefly, the amputated worms were allowed to regenerate for 3, 5, 8 or 24 h. The worms were exposed to EdU at a final concentration of 250 μM for the last 2 or 3 h. Then, the animals were fixed with PFA–PBS and incubated for 30 min in a freshly prepared EdU click-iT reaction cocktail. The nuclei were stained with DAPI (1/1000). The specimens were rinsed with PBS containing 0.1% Tween 20 several times and mounted on slide glasses with 90% glycerol/PBS. Imaging was performed using CellVoyager CQ1 (Yokogawa). Z-stack images were acquired at approximately 5-µm intervals (15 sections). The area containing the blastema was enclosed manually. The total number of EdU-incorporated cells or DAPI-labelled cells was measured using the Cell Pathfinder software (Yokogawa) according to the manufacturer’s protocol.
RT and qRT-PCR analysis
The worms were cut into several fragments (normally 6–8) and allowed to regenerate for different times for experiments. Total RNA was extracted from each pool of fragments (approximately 200 fragments) using TRIzol, and cDNA was synthesized from 1 μg of total RNA using a Reverse-Transcription Kit (Thermofisher). Quantitation of each gene product was performed using a LightCycler 96 System (Roche). Each reaction contained TB Green® Premix Ex TaqTM II (Qiagen), gene-specific primers, and the cDNA template and was subjected to PCR as follows: 95 °C for 30 s; 40 cycles of 95 °C for 5 s, 60 °C for 20 s; and 1 cycle at 65 °C for 15 s. The measurements were normalized to the expression level of Ej-gapdh. The mean of three replicate qRT-PCR assays was used for quantification. The following PCR primer pairs were used:
soxC: (Forward) 5′-TGCCAGCTTCTACCCTGAAGA-3′ and (Reverse) 5′-GGTGCATGGTGCCAAAACTT-3′;
mmpReg: (Forward) 5′-CGATGGGCCAGGTATGGTACT-3′ and (Reverse) 5′-ATGTCACCTCCTCGACCTTCTC-3′;
Ej-gapdh: (Forward) 5′-AGGATTGGAGAGGAGGCAGAA -3′ and (Reverse) 5′-CCGGTGGAGGATGGAATG -3′.
The tips of the tails were amputated from the tadpoles at st. 51–53 and allowed to regenerate for 0, 6, 24, and 48 h. The regenerating tail tissues including the blastema (about 5 mm long from the amputation site) were collected and pooled. Total RNA was extracted from each pool consisting of approximately 50 regenerating tail tissues. The measurements were normalized to the expression level of Xl-elf1α. The mean of four replicates was used for quantification. The following PCR primer pairs were used:
Xl-sox4: (Forward) 5′- CATCAAGCGGCCAATGAAC -3′ and (Reverse) 5′- TGATTTTCCTCCGCTCGATCT -3′;
Xl-sox11: (Forward) 5′- GGGCTCCCACTTCGACTTC -3′ and (Reverse) 5′- TGCGATCATCTCGCTGAGTT -3′;
Xl-elf1α: (Forward) 5′- GGAACGGTGACAACATGC -3′ and (Reverse) 5′- AGGCAGACGGAGAGGCTTA -3′.
Statistical analysis
Sample size (n) is indicated in the figure legends. Statistical analyses were performed using EZR software based on R (version 2.7.1) or R (version 4.1.2). The methods used for each analysis are presented in the corresponding sections. All tests performed were two-sided.
Reporting summary
Further information on research design is available in the Nature Portfolio Reporting Summary linked to this article.
Supplementary information
Description of Additional Supplementary Files
Source data
Acknowledgements
We thank Dr. Takahiro Ito, Dr. Shinji Takada, and Dr. Yusuke Mii for critically reading the manuscript. We thank Dr. Mii for providing protocols and apparatus for raising the tadpoles. We would like to thank Editage (www.editage.com) for English language editing. This study was supported by a Teikyo University Research Encouragement Grant (T.F.), a Fund for the Promotion of Joint International Research (Fostering Joint International Research [B]) (T. F., K.J.H. 19KK0211), Grants-in-Aid for Scientific Research from the Japan Society for the Promotion of Science (S.Y., 24590096, 15K07945, 18K06667; N.A., 24790089, 20K06915; C.M., 20K16472; and K.J.H., 26440182, 17K07492, 20K06747), the Uehara Memorial Foundation (S.Y.), the Sagawa Foundation for Promotion of Cancer Research (S.Y.), and a Grant-in-Aid for Scientific Research on Innovative Areas Memory dynamism (26115522), Adaptive circuit shift (15H01449), and Evolinguistics (20H05012) from the Ministry of Education, Culture, Sports, Science and Technology (K.J.H.), the Naito Foundation (K.J.H.), and the Japan Foundation for Applied Enzymology (K.J.H.).
Author contributions
T.F. and S.Y. designed the study and performed the experiments; T.F., N.A., C.M., K.J.H., and S.Y. analyzed the data and wrote the paper. All authors have reviewed the manuscript.
Peer review
Peer review information
Nature Communications thanks José Martín-Durán and the other, anonymous, reviewer(s) for their contribution to the peer review of this work. A peer review file is available.
Data availability
Source data for graphs are provided with this paper. The raw sequences generated in this study were deposited in the NCBI Short Read Archive (SRA) database [http://www.ncbi.nlm.nih.gov/Traces/sra/] under the accession numbers: SRR21413950, SRR21413951, and SRR21413952. DNA sequences used for PCR in this study were deposited in the DNA Data Bank of Japan (DDBJ) nucleotide database under the accession numbers: Ej-mmpReg, LC727633; Ej-nanos, LC727634; Ej-piwi, LC727635; Ej-pl10, LC727636; Ej-soxC, LC727637; Ej-vasa1, LC727638; Ej-vasa2, LC727639; Ej-gapdh, LC727632. Source data are provided with this paper.
Competing interests
The authors declare no competing interests.
Footnotes
Publisher’s note Springer Nature remains neutral with regard to jurisdictional claims in published maps and institutional affiliations.
Supplementary information
The online version contains supplementary material available at 10.1038/s41467-024-50865-1.
References
- 1.Barresi, M. & Gilbert, S. Developmental Biology. (Oxford University Press 2019).
- 2.Morgan, T. H. Regeneration and Liability to Injury. Science14, 235–248 (1901). 10.1126/science.14.346.235 [DOI] [PubMed] [Google Scholar]
- 3.Sanchez Alvarado, A. Regeneration in the metazoans: why does it happen? Bioessays22, 578–590 (2000). [DOI] [PubMed] [Google Scholar]
- 4.Randolph, H. The regeneration of the tail in Lumbriculus. J. Morphol.7, 317–344 (1892).
- 5.Tanaka, E. M. & Reddien, P. W. The cellular basis for animal regeneration. Dev. Cell21, 172–185 (2011). 10.1016/j.devcel.2011.06.016 [DOI] [PMC free article] [PubMed] [Google Scholar]
- 6.Tsonis, P. A. Regeneration in vertebrates. Dev. Biol.221, 273–284 (2000). 10.1006/dbio.2000.9667 [DOI] [PubMed] [Google Scholar]
- 7.Srivastava, M. Beyond Casual Resemblance: Rigorous Frameworks for Comparing Regeneration Across Species. Annu Rev. Cell Dev. Biol.37, 415–440 (2021). 10.1146/annurev-cellbio-120319-114716 [DOI] [PubMed] [Google Scholar]
- 8.Bely, A. E. & Nyberg, K. G. Evolution of animal regeneration: re-emergence of a field. Trends Ecol. Evol.25, 161–170 (2010). 10.1016/j.tree.2009.08.005 [DOI] [PubMed] [Google Scholar]
- 9.Tornini, V. A. & Poss, K. D. Keeping at arm’s length during regeneration. Dev. Cell29, 139–145 (2014). 10.1016/j.devcel.2014.04.007 [DOI] [PMC free article] [PubMed] [Google Scholar]
- 10.Currie, J. D. et al. Live Imaging of Axolotl Digit Regeneration Reveals Spatiotemporal Choreography of Diverse Connective Tissue Progenitor Pools. Dev. Cell39, 411–423 (2016). 10.1016/j.devcel.2016.10.013 [DOI] [PMC free article] [PubMed] [Google Scholar]
- 11.Bassat, E. & Tanaka, E. M. The cellular and signaling dynamics of salamander limb regeneration. Curr. Opin. Cell Biol.73, 117–123 (2021). 10.1016/j.ceb.2021.07.010 [DOI] [PubMed] [Google Scholar]
- 12.Reddien, P. W. The Cellular and Molecular Basis for Planarian Regeneration. Cell175, 327–345 (2018). 10.1016/j.cell.2018.09.021 [DOI] [PMC free article] [PubMed] [Google Scholar]
- 13.Ozpolat, B. D. & Bely, A. E. Developmental and molecular biology of annelid regeneration: a comparative review of recent studies. Curr. Opin. Genet Dev.40, 144–153 (2016). 10.1016/j.gde.2016.07.010 [DOI] [PubMed] [Google Scholar]
- 14.Srivastava, M., Mazza-Curll, K. L., van Wolfswinkel, J. C. & Reddien, P. W. Whole-body acoel regeneration is controlled by Wnt and Bmp-Admp signaling. Curr. Biol.24, 1107–1113 (2014). 10.1016/j.cub.2014.03.042 [DOI] [PubMed] [Google Scholar]
- 15.Vogg, M. C., Galliot, B. & Tsiairis, C. D. Model systems for regeneration: Hydra. Development146, dev177212 (2019). 10.1242/dev.177212 [DOI] [PubMed] [Google Scholar]
- 16.Funayama, N. The cellular and molecular bases of the sponge stem cell systems underlying reproduction, homeostasis and regeneration. Int J. Dev. Biol.62, 513–525 (2018). 10.1387/ijdb.180016nf [DOI] [PubMed] [Google Scholar]
- 17.Guedelhoefer, O. C. & Sanchez Alvarado, A. Planarian immobilization, partial irradiation, and tissue transplantation. J. Vis. Exp.6, 4015 (2012). [DOI] [PMC free article] [PubMed] [Google Scholar]
- 18.Salo, E. & Baguna, J. Cell movement in intact and regenerating planarians. Quantitation using chromosomal, nuclear and cytoplasmic markers. J. Embryol. Exp. Morphol.89, 57–70 (1985). [PubMed] [Google Scholar]
- 19.Lapan, S. W. & Reddien, P. W. dlx and sp6-9 Control optic cup regeneration in a prototypic eye. PLoS Genet7, e1002226 (2011). 10.1371/journal.pgen.1002226 [DOI] [PMC free article] [PubMed] [Google Scholar]
- 20.Abnave, P. et al. Epithelial-mesenchymal transition transcription factors control pluripotent adult stem cell migration in vivo in planarians. Development144, 3440–3453 (2017). [DOI] [PMC free article] [PubMed] [Google Scholar]
- 21.Seaver, E. C. Annelid models I: Capitella teleta. Curr. Opin. Genet Dev.39, 35–41 (2016). 10.1016/j.gde.2016.05.025 [DOI] [PubMed] [Google Scholar]
- 22.Herlant-Meewis, H. Regeneration in annelids. Adv. Morphog.4, 155–215 (1964). 10.1016/B978-1-4831-9951-1.50008-5 [DOI] [PubMed] [Google Scholar]
- 23.Cornec, J.-P., Cresp, J., Delye, P., Hoarau, F. & Reynaud, G. Tissue responses and organogenesis during regeneration in the oligochete Limnodrilus hoffmeisteri (Clap.). Can. J. Zool.65, 403–414 (1986). 10.1139/z87-061 [DOI] [Google Scholar]
- 24.Stephan-Dubois, F. Migration and Differentiation of Neoblasts in Anterior Regeneration of Lumbriculus variegatus (Annelida, Oligochaeta). C. R. Seances Soc. Biol. Fil.150, 1239–1242 (1956). [PubMed] [Google Scholar]
- 25.Wagner, D. E., Wang, I. E. & Reddien, P. W. Clonogenic neoblasts are pluripotent adult stem cells that underlie planarian regeneration. Science332, 811–816 (2011). 10.1126/science.1203983 [DOI] [PMC free article] [PubMed] [Google Scholar]
- 26.Hill, S. D. Origin of the regeneration blastema in polychaete annelids. Am. Zool.10, 101–112 (1970). 10.1093/icb/10.2.101 [DOI] [PubMed] [Google Scholar]
- 27.Martinez Acosta, V. G., Arellano-Carbajal, F., Gillen, K., Tweeten, K. A. & Zattara, E. E. It Cuts Both Ways: An Annelid Model System for the Study of Regeneration in the Laboratory and in the Classroom. Front Cell Dev. Biol.9, 780422 (2021). 10.3389/fcell.2021.780422 [DOI] [PMC free article] [PubMed] [Google Scholar]
- 28.Tadokoro, R., Sugio, M., Kutsuna, J., Tochinai, S. & Takahashi, Y. Early segregation of germ and somatic lineages during gonadal regeneration in the annelid Enchytraeus japonensis. Curr. Biol.16, 1012–1017 (2006). 10.1016/j.cub.2006.04.036 [DOI] [PubMed] [Google Scholar]
- 29.Myohara, M., Niva, C. C. & Lee, J. M. Molecular approach to annelid regeneration: cDNA subtraction cloning reveals various novel genes that are upregulated during the large-scale regeneration of the oligochaete, Enchytraeus japonensis. Dev. Dyn.235, 2051–2070 (2006). 10.1002/dvdy.20849 [DOI] [PubMed] [Google Scholar]
- 30.Bhambri, A. et al. Large scale changes in the transcriptome of Eisenia fetida during regeneration. PLoS One13, e0204234 (2018). 10.1371/journal.pone.0204234 [DOI] [PMC free article] [PubMed] [Google Scholar]
- 31.Shao, Y. et al. Genome and single-cell RNA-sequencing of the earthworm Eisenia andrei identifies cellular mechanisms underlying regeneration. Nat. Commun.11, 2656 (2020). 10.1038/s41467-020-16454-8 [DOI] [PMC free article] [PubMed] [Google Scholar]
- 32.Cho, S. J. et al. Gene expression profile in the anterior regeneration of the earthworm using expressed sequence tags. Biosci. Biotechnol. Biochem73, 29–34 (2009). 10.1271/bbb.80391 [DOI] [PubMed] [Google Scholar]
- 33.Takeo, M., Yoshida-Noro, C. & Tochinai, S. Functional analysis of grimp, a novel gene required for mesodermal cell proliferation at an initial stage of regeneration in Enchytraeus japonensis (Enchytraeidae, Oligochaete). Int J. Dev. Biol.54, 151–160 (2010). 10.1387/ijdb.082790mt [DOI] [PubMed] [Google Scholar]
- 34.Nakamura, Y. A new fragmenting enchytraeid species, Enchytraeus japonensis from a cropped Kuroboku soil in Fukushima, Northern Japan (enchytraeids in Japan 5). Edaphologia50, 37–39 (1993). [Google Scholar]
- 35.Myohara, M., Yoshida-Noro, C., Kobari, F. & Tochinai, S. Fragmenting oligochaete Enchytraeus japonensis: a new material for regeneration study. Dev. Growth Differ.41, 549–555 (1999). 10.1046/j.1440-169x.1999.00455.x [DOI] [PubMed] [Google Scholar]
- 36.Yoshida-Noro, C. & Tochinai, S. Stem cell system in asexual and sexual reproduction of Enchytraeus japonensis (Oligochaeta, Annelida). Dev. Growth Differ.52, 43–55 (2010). 10.1111/j.1440-169X.2009.01149.x [DOI] [PubMed] [Google Scholar]
- 37.Goldman, J. A. & Poss, K. D. Gene regulatory programmes of tissue regeneration. Nat. Rev. Genet21, 511–525 (2020). 10.1038/s41576-020-0239-7 [DOI] [PMC free article] [PubMed] [Google Scholar]
- 38.Sarkar, A. & Hochedlinger, K. The sox family of transcription factors: versatile regulators of stem and progenitor cell fate. Cell Stem Cell12, 15–30 (2013). 10.1016/j.stem.2012.12.007 [DOI] [PMC free article] [PubMed] [Google Scholar]
- 39.Bretscher, M. S. On the shape of migrating cells-a ‘front-to-back’ model. J. Cell Sci.121, 2625–2628 (2008). 10.1242/jcs.031120 [DOI] [PubMed] [Google Scholar]
- 40.Zattara, E. E., Turlington, K. W. & Bely, A. E. Long-term time-lapse live imaging reveals extensive cell migration during annelid regeneration. BMC Dev. Biol.16, 6 (2016). 10.1186/s12861-016-0104-2 [DOI] [PMC free article] [PubMed] [Google Scholar]
- 41.Okuda, S. et al. KEGG Atlas mapping for global analysis of metabolic pathways. Nucleic Acids Res36, W423–W426 (2008). 10.1093/nar/gkn282 [DOI] [PMC free article] [PubMed] [Google Scholar]
- 42.Bonnans, C., Chou, J. & Werb, Z. Remodelling the extracellular matrix in development and disease. Nat. Rev. Mol. Cell Biol.15, 786–801 (2014). 10.1038/nrm3904 [DOI] [PMC free article] [PubMed] [Google Scholar]
- 43.Juliano, C. E., Swartz, S. Z. & Wessel, G. M. A conserved germline multipotency program. Development137, 4113–4126 (2010). 10.1242/dev.047969 [DOI] [PMC free article] [PubMed] [Google Scholar]
- 44.Sugio, M. et al. Exploration of embryonic origins of germline stem cells and neoblasts in Enchytraeus japonensis (Oligochaeta, Annelida). Gene Expr. Patterns8, 227–236 (2008). 10.1016/j.gep.2007.12.008 [DOI] [PubMed] [Google Scholar]
- 45.Sugio, M., Yoshida-Noro, C., Ozawa, K. & Tochinai, S. Stem cells in asexual reproduction of Enchytraeus japonensis (Oligochaeta, Annelid): proliferation and migration of neoblasts. Dev. Growth Differ.54, 439–450 (2012). 10.1111/j.1440-169X.2012.01328.x [DOI] [PubMed] [Google Scholar]
- 46.de Jong, D. M. & Seaver, E. C. Investigation into the cellular origins of posterior regeneration in the annelid Capitella teleta. Regenerat. (Oxf.)5, 61–77 (2018). 10.1002/reg2.94 [DOI] [PMC free article] [PubMed] [Google Scholar]
- 47.Kozin, V. V. & Kostyuchenko, R. P. Vasa, PL10, and Piwi gene expression during caudal regeneration of the polychaete annelid Alitta virens. Dev. Genes Evol.225, 129–138 (2015). 10.1007/s00427-015-0496-1 [DOI] [PubMed] [Google Scholar]
- 48.Ozpolat, B. D. & Bely, A. E. Gonad establishment during asexual reproduction in the annelid Pristina leidyi. Dev. Biol.405, 123–136 (2015). 10.1016/j.ydbio.2015.06.001 [DOI] [PubMed] [Google Scholar]
- 49.Heenan, P., Zondag, L. & Wilson, M. J. Evolution of the Sox gene family within the chordate phylum. Gene575, 385–392 (2016). 10.1016/j.gene.2015.09.013 [DOI] [PubMed] [Google Scholar]
- 50.Angelozzi, M. & Lefebvre, V. SOXopathies: Growing Family of Developmental Disorders Due to SOX Mutations. Trends Genet35, 658–671 (2019). 10.1016/j.tig.2019.06.003 [DOI] [PMC free article] [PubMed] [Google Scholar]
- 51.Tsujioka, H., Kunieda, T., Katou, Y., Shirahige, K. & Kubo, T. Unique gene expression profile of the proliferating Xenopus tadpole tail blastema cells deciphered by RNA-sequencing analysis. PLoS One10, e0111655 (2015). 10.1371/journal.pone.0111655 [DOI] [PMC free article] [PubMed] [Google Scholar]
- 52.Lai, A. G. & Aboobaker, A. A. EvoRegen in animals: Time to uncover deep conservation or convergence of adult stem cell evolution and regenerative processes. Dev. Biol.433, 118–131 (2018). 10.1016/j.ydbio.2017.10.010 [DOI] [PubMed] [Google Scholar]
- 53.Reddien, P. W. et al. SMEDWI-2 is a PIWI-like protein that regulates planarian stem cells. Science310, 1327–1330 (2005). 10.1126/science.1116110 [DOI] [PubMed] [Google Scholar]
- 54.Plickert, G., Frank, U. & Muller, W. A. Hydractinia, a pioneering model for stem cell biology and reprogramming somatic cells to pluripotency. Int J. Dev. Biol.56, 519–534 (2012). 10.1387/ijdb.123502gp [DOI] [PubMed] [Google Scholar]
- 55.Lim, R. S., Anand, A., Nishimiya-Fujisawa, C., Kobayashi, S. & Kai, T. Analysis of Hydra PIWI proteins and piRNAs uncover early evolutionary origins of the piRNA pathway. Dev. Biol.386, 237–251 (2014). 10.1016/j.ydbio.2013.12.007 [DOI] [PubMed] [Google Scholar]
- 56.de Rosa, R., Prud’homme, B. & Balavoine, G. Caudal and even-skipped in the annelid Platynereis dumerilii and the ancestry of posterior growth. Evol. Dev.7, 574–587 (2005). 10.1111/j.1525-142X.2005.05061.x [DOI] [PubMed] [Google Scholar]
- 57.Zattara, E. E. & Bely, A. E. Evolution of a novel developmental trajectory: fission is distinct from regeneration in the annelid Pristina leidyi. Evol. Dev.13, 80–95 (2011). 10.1111/j.1525-142X.2010.00458.x [DOI] [PubMed] [Google Scholar]
- 58.Myohara, M. What role do annelid neoblasts play? A comparison of the regeneration patterns in a neoblast-bearing and a neoblast-lacking enchytraeid oligochaete. PLoS One7, e37319 (2012). 10.1371/journal.pone.0037319 [DOI] [PMC free article] [PubMed] [Google Scholar]
- 59.Gerber, T. et al. Single-cell analysis uncovers convergence of cell identities during axolotl limb regeneration. Science362, eaaq0681 (2018). 10.1126/science.aaq0681 [DOI] [PMC free article] [PubMed] [Google Scholar]
- 60.Miao, Q. et al. SOX11 and SOX4 drive the reactivation of an embryonic gene program during murine wound repair. Nat. Commun.10, 4042 (2019). 10.1038/s41467-019-11880-9 [DOI] [PMC free article] [PubMed] [Google Scholar]
- 61.Song, K. et al. Sox11b regulates the migration and fate determination of Muller glia-derived progenitors during retina regeneration in zebrafish. Neural Regen. Res18, 445–450 (2023). [DOI] [PMC free article] [PubMed] [Google Scholar]
- 62.Hoshiba, Y. et al. Sox11 Balances Dendritic Morphogenesis with Neuronal Migration in the Developing Cerebral Cortex. J. Neurosci.36, 5775–5784 (2016). 10.1523/JNEUROSCI.3250-15.2016 [DOI] [PMC free article] [PubMed] [Google Scholar]
- 63.Siebert, S. et al. Stem cell differentiation trajectories in Hydra resolved at single-cell resolution. Science365, eaav9314 (2019). 10.1126/science.aav9314 [DOI] [PMC free article] [PubMed] [Google Scholar]
- 64.Zeng, A. et al. Prospectively Isolated Tetraspanin(+) Neoblasts Are Adult Pluripotent Stem Cells Underlying Planaria Regeneration. Cell173, 1593–1608 e1520 (2018). 10.1016/j.cell.2018.05.006 [DOI] [PMC free article] [PubMed] [Google Scholar]
- 65.Hulett, R. E. et al. Acoel single-cell atlas reveals expression dynamics and heterogeneity of adult pluripotent stem cells. Nat. Commun.14, 2612 (2023). 10.1038/s41467-023-38016-4 [DOI] [PMC free article] [PubMed] [Google Scholar]
- 66.Nieuwkoop D. P., Faber, J. Normal Table of Xenopus laevis (Daudin): A Systematical and Chronological Survey of the Development from the Fertilized Egg Till the End of Metamorphosis. Cold Spring Harbor Laboratory Press (1967).
- 67.Larkin, M. A. et al. Clustal W and Clustal X version 2.0. Bioinformatics23, 2947–2948 (2007). 10.1093/bioinformatics/btm404 [DOI] [PubMed] [Google Scholar]
- 68.Perriere, G. & Gouy, M. WWW-query: an on-line retrieval system for biological sequence banks. Biochimie78, 364–369 (1996). 10.1016/0300-9084(96)84768-7 [DOI] [PubMed] [Google Scholar]
- 69.Shibata, N. & Agata, K. RNA Interference in Planarians: Feeding and Injection of Synthetic dsRNA. Methods Mol. Biol.1774, 455–466 (2018). 10.1007/978-1-4939-7802-1_18 [DOI] [PubMed] [Google Scholar]
Associated Data
This section collects any data citations, data availability statements, or supplementary materials included in this article.
Supplementary Materials
Description of Additional Supplementary Files
Data Availability Statement
Source data for graphs are provided with this paper. The raw sequences generated in this study were deposited in the NCBI Short Read Archive (SRA) database [http://www.ncbi.nlm.nih.gov/Traces/sra/] under the accession numbers: SRR21413950, SRR21413951, and SRR21413952. DNA sequences used for PCR in this study were deposited in the DNA Data Bank of Japan (DDBJ) nucleotide database under the accession numbers: Ej-mmpReg, LC727633; Ej-nanos, LC727634; Ej-piwi, LC727635; Ej-pl10, LC727636; Ej-soxC, LC727637; Ej-vasa1, LC727638; Ej-vasa2, LC727639; Ej-gapdh, LC727632. Source data are provided with this paper.