

Abstract
The current experiment was designed to evaluate the ramifications of simulated acid rain (SAR) on two pea (Pisum sativum L.) cultivars, Kashi Samridhi (Samridhi) and Kashi Nandini (Nandini), to decipher the intraspecific variations in defence mechanism considering the current scenario of rapid anthropogenic activities leading to increase in rain acidity. The pea cultivars were subjected to SAR of pH 7 (Control), 5.6, 5.0, and 4.5 under field conditions. SAR increased active oxygen species and malondialdehyde content due to increased lipid peroxidation in both cultivars; however, the increment intensity was more remarkable in Samridhi at the later growth stage. Ascorbic acid, thiol, and flavonoids were significantly increased in cultivar Nandini, along with increased peroxidase and superoxide dismutase activities. Total phenolics, glutathione reductase, and ascorbate peroxidase activities were enhanced considerably in Samridhi than in Nandini under SAR treatments. Higher stomatal density and stomatal size in Samridhi prompted greater acidic particles influx which further damaged the chloroplast and mitochondria. The present study concludes that cultivar Nandini is more proficient in inducing defence responses by elevating non-enzymatic antioxidants than Samridhi. Non-enzymatic linked defence mechanisms are more metabolically expensive, leading to less biomass accumulation in Nandini. The study depicted that innate defence responses, particularly the role of non-enzymatic antioxidants, governed the sensitivity level of cultivars towards SAR stress. Further, findings also contribute to bridging the knowledge gap regarding the responses of tropical and subtropical crops to acid rain.
Supplementary Information
The online version contains supplementary material available at 10.1007/s12298-024-01494-x.
Keywords: Acid rain, Pea cultivars, Reactive oxygen species, Enzymatic antioxidants, Non-enzymatic antioxidants, Ultrastructure, Biomass accumulation
Introduction
The expeditious growth and development of the economy led to increased anthropic emissions of sulphur dioxide (SO2), nitrogen oxides (NOx), and other acidifying compounds in the atmosphere from various sources, such as the combustion of fossil fuels, oil, and natural gas in industries as well as in vehicles, which lead to the formation of acid rain (AR) (Singh and Agrawal 2007). Rainwater with a pH of 5.61 and below is considered acid rain (Prakash et al. 2023). According to the study by Singh and Agrawal, regions including North America, Europe, and Southeast Asia had become global hotspots facing AR catastrophes (2007). Among developing countries, AR events are frequently reported in China (Zhou et al. 2019). Additionally, both SO2 and NOx emissions are anticipated to rise until 2030, with India being the second-highest known SO2 producer (Li et al. 2017). Based on the detailed study of Prakash et al. (2023), the pace of emissions of NO2 along with SO2 at major Indian cities showed a significant 2–threefold increase from 2004 to 2020 that was also supported by the data provided by the National Ambient Air Quality Monitoring Programme of Central Pollution Control Board, India (CPCB 2021). The annual average SO2 and NO2 concentrations, respectively were 8 and 22 µg m−3 at Allahabad, 12 and 34 µg m−3 at Varanasi, 26 and 38 µg m−3 at Pune, 29 and 41 µg m−3 at Singruali and 10 and 70 µg m−3 at Rohtak (CPCB 2021). The yearly mean pH showed an increasing tendency of AR events for the last four decades measured at all 10 Global Atmospheric Watch (GAW) stations (Allahabad, Jodhpur, Kodaikanal, Minicoy, Mohanbari, Nagpur, PortBlair, Pune, Srinagar, Visakhapatnam) across India and the values ranged from 5.25 ± 0.82 to 6.91 ± 0.76 between 1981 and 2012 (Bhaskar and Rao 2017). Further, due to the increasing concentrations of SO42− and NO3− (acidic ions) and a simultaneous decreasing trend of Ca2+ resulted in significant decline in pH of long-term annual precipitation at Allahabad (Bhaskar and Rao 2017). A recent study conducted in the mid-Brahmaputra Plain from 2012 to 2018 by Ahmed et al. (2022) reported variations in rainwater pH from 5.35 to 6.18, with a significant number of events having a pH of < 5.6.
Acid rain is known to have looming effects on terrestrial and aquatic ecosystems and their components (Singh and Agrawal 2007). With the severe ongoing pollution of AR, agricultural ecosystem safety faces significant hurdles due to acid rain’s direct impairment of plant growth, development, productivity, and yield through damage to the plasma membrane and degradation of chlorophyll (Ren et al. 2018). The other impacts of AR on plants reported in previous studies are alteration in the ultrastructure of chloroplasts, leaf injury including chlorosis, necrosis, senescence, and curling, along with induction of oxidative stress (Ahmad et al. 2021). Earlier studies have shown that various plant species exhibit varying levels of AR tolerance (Ren et al. 2018; Debnath et al. 2018; Arora et al. 2022). For example, AR of pH 2.5 caused 31% decrement in total plant biomass of pea (Ashenden and Bell 1989) while growth traits including component wise biomass of rice showed decrements varying from 60 to 76% (Sun et al. 2016), indicating that rice was less able to withstand AR than pea. In addition, the maximum quantum yield of PSII (Fv/Fm) showed insignificant alteration in pea (Polishchuk et al. 2016) compared to 16% reduction in rice at same acidic pH of 2.5 (Liang et al. 2015). Alteration of permeability of plant cells, electrolyte leakage, inhibition of transpiration and decrease in Photosynthetic rate (Pn) (Neves et al. 2009) and modification in leaf nutrient (Zhang et al. 2020) balance have been reported responses of plants to simulated acid rain (SAR) solutions. Therefore, investigation on the mechanism underpinning the resistance variation to SAR may potentially shed light on ways to find methods to strengthen plant acid resistance, which in turn could alleviate the loss of agriculture and forest in regions where the AR problem occurs frequently.
Plants have different striving mechanisms under acid-stress conditions (Debnath et al. 2018). Exposure to AR leads to increased H+ concentration (Neves et al. 2009), which induces oxidative stress in plant cells due to reactive oxygen species (ROS) production. To reduce ROS inside cells, the defence mechanism in response to AR stress differed significantly between crops, including brinjal and cowpea (Arora et al. 2022) and even among cultivars (Red Rain and Micro-Tom of tomato) (Debnath et al. 2018). According to Liang et al. (2015), sensitivity of rice to AR stress varied across different growth stages. A decrease in antioxidant activities under extreme AR treatment is reported due to the destruction of membrane lipids (Dolatabadian et al. 2013).
In India, the pH of rainwater is often low enough to cause visible symptoms on plant leaves (Ahmad et al. 2021), photosynthetic reductions, phenological imbalance, thereby hampering the crop’s development and growth (Xalxo and Keshavkant 2019). Nevertheless, research regarding the response of different crops to AR has been an active area for decades, characterizing the underlying mechanistic changes that determine the metabolic responses to SAR, primarily related to ROS scavenging, are scarce in tropical regions, including India, and are insufficient to comprehend AR’s harm to tropical plants fully. So, the present study is planned with two varieties of pea, widely grown by local farmers in and around the Varanasi experiencing higher concentrations of SO2, NO2, and O3 especially during pea growing winter season (Gupta et al. 2022b; Prakash et al. 2023; Singh et al. 2023b). Low rainwater pH was reported from nearest GAW station at Allahabad with pH varying from minimum of 3.67 to maximum of 7.61 (Bhaskar and Rao (2017).
The garden pea (Pisum sativum L.) is amongst the most significant and productive cold-season pulse crop grown worldwide, cultivated over an area of 7.18 and 2.78 million hectares (m ha) for dry and green seeds, respectively (Devi et al. 2023). India occupies an area of 0.59 m ha and produces 6.13 million tons of green peas annually (Agricultural Statistics at glance 2023, DAC& FW, GOI), making it the second-largest producer behind China (11.25 million tons) (Singh et al. 2023a). Along with its production capacity, India is one of the largest peas exporting country. Uttar Pradesh alone produces 2.74 million tons (approx. half of country’s total production) of peas annually over an area of 0.23 m ha which makes it the highest pea producing state. Due to their balanced micro and macronutrients profile, high dietary fiber content, antioxidant content, and abundance of vital biomolecules, peas are beneficial for the management of various health ailments (Kumari and Deka 2021; Devi et al. 2023). Peas serve as a crucial ingredient in ensuring nutritional security for poor people in developing countries. Thus, the susceptibility of pea towards AR, especially under changing climatic conditions, can be one of the reasons for its low productivity, which becomes a serious threat both to its sustainable productivity and consequently, to the country’s economy.
A number of studies have covered the influence of acid rain on various leguminous crops such as Elaeocarpus glabripetalus, Glycine max L., Vigna unguiculata, Trigonella foenum-graecum L. (Liu et al. 2015; Pham et al. 2021; Odiyi and Eniola 2015; Andrade and Silva 2017; Xalxo and Keshavkant 2019); however, only two studies have been attempted on pea in temperate region (Polishchuk et al. 2016; Ashenden and Bell 1989). The studies on pea clearly demonstrated the negative effects of SAR on ultrastructural and functional parameters of the photosynthetic apparatus (Polishchuk et al. 2016) and yield (Ashenden and Bell 1989). However, the above studies have not comprehensively worked out the cultivar differences in physiological, biochemical and molecular mechanisms operating under different SAR.
Considering the above, two pea (Pisum sativum L.) cultivars were used as test materials to investigate the responses of plant photosynthetic traits, morphology, and antioxidant properties against different pH of SAR. However, no attempt has been made to evaluate the responses of pea plants against increasing rain acidity in tropical regions. The present work seems to be the first attempt to examine the possible mechanism leading to the cultivar-specific response of pea cultivars against SAR under field conditions. The study was designed with the hypothesis that cultivar showing more induction of antioxidants (enzymatic and non-enzymatic) under SAR exposure will be more tolerant to SAR than others and may protect against oxidative stress. These results will help us comprehend pea cultivars antioxidant responses as indicators of acid tolerance and alterations in defence strategies to simulated acid deposition. Ascertain of the sensitivity of cultivars against acidity will undoubtedly help in choosing an appropriate cultivar for growing in SAR-designated regions.
Material and methods
Experimental setup and plant material
The experiment was performed from November to March (2020–2021) in the field of Botanical Garden, Department of Botany, Banaras Hindu University (BHU), Varanasi, positioned in the middle of Indian eastern Gangetic plains (25°16′22″ N, 82°59′37″ E) and 76.19 m above sea level. The experimental site’s soil was alluvial, sandy loam in texture (27% clay, 28% silt, and 45% sand), and pale brown, with mild alkaline pH (7.2). During the experimental period, data on meteorological parameters (total rainfall, minimum and maximum temperature, and relative humidity) were collected from the observatory of the Indian Meteorological Division (IMD), BHU, Varanasi, India.
Two cultivars of pea (Pisum sativum L.) Kashi Nandini (Nandini) and Kashi Samridhi (Samridhi) were selected for the experiment. Seeds were collected from the division of Vegetable Improvement, ICAR, Indian Institute of Vegetable Research (IIVR), Varanasi. Both cultivars are frequently cultivated in India’s northern region and are resistant to rust and powdery mildew, while Nandini is also tolerant to leaf miners and pod borers. The growing season for both cultivars is winter, from November to March. Recommended doses of NPK for pea (50, 80, and 80 kg ha−1, respectively) were applied as urea, single-superphosphate, and muriate of potash. Pea seeds were hand-sown inside each plot following the standard cultivation practices in rows with a spacing of 30 cm between each row. Following germination, thinning was carried out to maintain one plant per 15 cm to ensure consistent growth. Regular watering was done in each plot to maintain a similar moisture regime. During the whole course of the study, manual weeding was done four times. Two border rows were also planted around each plot to reduce microclimate heterogeneity.
The experimental study’s design utilised a split plot with cultivars serving as the whole plots, while SAR treatments were the subplots, randomised within entire plots, and each treatment had three replicates. In total, 24 plots, each of 1.0 × 1.0 m2 were prepared. Each plot had two rows having 6 plants in each row i.e., 12 plants in total. SAR treatments were administered after 15 days of germinating the plants twice a week, from 9:00 to 10:00 till maturity. The plants were sprayed with SAR within pH 4.5, 5.0, 5.6, and 7 (control).
Treatments of acid rain
Before each treatment, the various SAR solutions were made in big plastic carboys using double-distilled water. To adjust the pH of the rain solution to different pH, 1 N H2SO4 (sulphuric acid) and 1 N HNO3 (nitric acid) were mixed. The pH measurement was done using a digital pH meter (Model, Eutech cyberscan 510) with a glass electrode and was standardised with pH 4.0, 7.0 and 9.2 buffers. A mist sprayer mounted 1.2 m above the plot’s ground was used to apply simulated rain solution (approximately 400 ml) to each replicate plot. The sulphate: nitrate ratio was maintained at approximately 4:3 in all solutions.
Plant sampling
Sampling for physiological and biochemical attributes was done at 45 (vegetative stage) and 90 (reproductive stage) days after germination (DAG). Six randomly selected plants from both cultivars have been tagged from each treatment. Fully expanded third or fourth leaves of pea cultivars from the top of the canopy were chosen randomly. For biochemical analyses, the leaf samples were collected and immediately placed into a cold box before being transported from the experimental site to the laboratory for further analysis.
Meteorological parameters
During the growth period of the pea, the mean maximum temperature was highest during March (34.9 °C) and lowest during January (21.5 °C). Mean minimum temperatures recorded ranged from 9.7 to 17.3 °C, respectively, from November to March. Maximum mean relative humidity was highest in January (94%) and lowest during March (60.6%). Total rainfall was 21.2 mm from November 2020 to March 2021 (Table 1).
Table 1.
Meteorological condition of the experimental site during the study period (November 2020–March 2021)
| Month/year | Rainfall (mm) | Mean temperature (℃) | Mean relative humidity (%) | |
|---|---|---|---|---|
| Max | Min | |||
| November 2020 | 9.8 | 29.2 | 13.6 | 87.6 |
| December 2020 | 2.6 | 24.8 | 9.9 | 92 |
| January 2021 | 8 | 21.5 | 9.7 | 94 |
| February 2021 | 0.8 | 28.5 | 11.3 | 82.6 |
| March 2021 | 0 | 34.9 | 17.3 | 60.6 |
| Average (Total) | 21.2 | 27.7 | 12.3 | 83.3 |
Analytical methods
Reactive oxygen species and lipid peroxidation
The amount of ·O2− radicals was quantified using the protocol based on the work of Elstner and Heupel (1976) with minor modifications and absorbance was documented at 530 nm. After applying the technique developed by Alexieva et al., determination of the H2O2 production (2001) was carried out. The methodology of Halliwell and Gutteridge (1981) was followed to calculate the amount of hydroxyl radical (OH−) content and the optical density of final extraction solution was measured at 553 nm. Malondialdehyde (MDA) content was determined from leaf tissue (0.5 g) by the procedure briefly described by Singh et al. (2023b). The sample’s mixture optical density was taken at 532 and 600 nm. The molar extinction coefficient of 155 mM−1 cm−1 was used to calculate MDA content.
Histochemical localisation and microscopic analysis
Histochemical assays were used to monitor test cultivars in-situ localisation of accumulated hydrogen peroxide (H2O2) and superoxide radicals (·O2−) leaf fragments at 90 DAG. Leaves from six plants of each cultivar were chosen randomly from each SAR-treated plot. The procedure employed by Gupta et al. (2022a) has been used with minor modifications to localised the ·O2− and H2O2 histochemically, which utilise NBT (nitro tetrazolium blue chloride) as the chromogenic substrate and DAB (3, 3'- Diaminobenzidine), respectively. A Dewinter image microscope was used at magnifications of 4 and 10X for the microscopic analysis of leaf discs.
Enzymatic antioxidants
For enzyme extraction at 4 °C, 0.2 g fresh leaves were homogenised in 10 ml of pre-chilled 0.1 M phosphate buffer (pH 7.0) having 0.1 mM EDTA, 1% Polyvinylpyrrolidone (PVP), phenyl methane sulfonyl fluoride and Triton-X-100. The homogenate was then centrifuged for 30 min at 15,000 rpm. According to Beyer and Fridovich’s method, superoxide dismutase (SOD) activity was calculated as a 50% reduction of NBT at 560 nm (1987). Nakano and Asada’s method of measuring the ascorbic acid-dependent reduction of H2O2 was used to determine ascorbate peroxidase (APX) activity at 290 nm (1981). The APX activity was calculated using 2.8 mM−1 cm−1 as the extinction coefficient. The methodology of Aebi (1984) was used for determining the catalase (CAT) activity by estimating the decline in H2O2 rate at 240 nm. An extinction coefficient of 6.93 × 10⁻³ mM−1 cm−1 was used for CAT calculation. Using the methodology provided by Dalton et al. (1986), the glutathione reductase (GR) activity was estimated by determining the decrease in NADPH absorbance due to oxidation at 340 nm. The GR activity was calculated using a 6.22 mM−1 cm−1 molar extinction coefficient. The activity of peroxidase (POX) was estimated according to the methodology of Chance and Maehly and calculated in terms of μmol purpurogallin formed min−1 (1955).
Non-enzymatic antioxidants
Following the Bray and Thorpe (1954) protocol, total phenolics were determined by adding the Folin ciocalteau reagent with minor modification. The blue colour produced by folin reagent reduction was measured at 650 nm. Total flavonoids were analyzed using the procedure described by Flint et al. (1985) with slight optimization, and the concentration was estimated using a standard graph of quercetin. The modified technique of Keller and Schwager (1977) was used to quantify ascorbic acid content. The absorbance of the pink colour was measured at 520 nm after extracting 0.1 g of leaf tissue in oxalic acid (0.5%) solution and reacting it with 5 mL of dichlorophenolindophenol (DCPIP) solution. The Fahey et al. (1978) method was used to quantify thiol by extracting leaf tissue in 80% ethanol, which was then estimated using 60 µM 5, 5′-Dithiobis-2-nitrobenzoic acid (DNTB).
Photosynthetic pigments
A method utilised by Pandey et al. (2022) was used to estimate the photosynthetic pigments in test plants. 0.1 g of leaf tissue was homogenised in 80% acetone (10 ml) and then centrifuged for 15 min at 5000 × g. For determining the carotenoids, the extract’s absorbance was taken at 480 and 510 nm and 645 and 663 nm for chlorophyll employing a double beam UV–VIS spectrophotometer (Model 2203, Systronics, India).
Chlorophyll fluorescence measurement
The parameters of photochemical efficiency like variable fluorescence (Fv), minimum fluorescence (Fo), maximum fluorescence (Fm), and their ratio, Fv/Fm, were measured using a portable plant efficiency analyser (Model, MK29414, Hansatech Instrument Ltd., UK). The data collection for the photochemical efficiency parameters was done between the morning hours of 8:00 and 10:00 A.M. It was taken on the third or fourth fully developed leaf from each control and treatments plots during both the growth stages. For dark adaptation, leaf clips were placed on adaxial surfaces for 30 min, then followed by exposure to red light (650 nm) at 3000 μmol m−2 s−1 excitation irradiance.
Scanning electron microscopy (SEM) and Transmission electron microscopy (TEM) analyses
Variations in the stomatal features under control and SAR treatments were observed using a scanning electron microscope (SEM, Carl Zeiss, EVO-18, Germany). Following the procedure utilised by Pandey et al. (2022), the third leaf from top of each treatment in triplicate was taken at 90 DAG and fixed for two hours in paraformaldehyde (2%) and glutaraldehyde (2.5%) solution at 4 °C. Pictures were taken for the density, length, and width of the stomata. In order to compute stomatal density (SD), the number of stomata was divided by the leaf surface area of the image using Fiji-ImageJ software (National Institutes of Health in Maryland, USA).
For ultrastructural (TEM) analysis, fresh leaves were cut into 1 mm × 1 mm sections from each treatment, avoiding the midrib, and preliminary fixation was done in Karnovsky’s fixative (2.5% glutaraldehyde, 2% paraformaldehyde in 0.1 M (pH 7.4) sodium phosphate buffer) using the vacuum infiltration method. Following which leaf slices were cleaned using sodium phosphate buffer (chilled; pH 7.4, 0.1 M) and then, the sections were treated to secondary fixation with 1% osmium tetroxide and sodium phosphate buffer (0.1 M pH 7.4). Further, the leaf sections were dehydrated in acetone (graded series) and fixed in epoxy resin. The ultrathin sections were cut using cryo-ultramicrotome (Model: UC7, Company: Leica) and stained with lead citrate and uranyl acetate and then imaged with the transmission electron microscope (Model: Talos L120C; Company: FEI Company-Thermo Fisher Scientific Inc., Massachusetts, USA).
Growth parameters
Morphological characteristics were analysed concerning plant height (PH), the number of leaves (NoL), specific leaf area (SLA), and specific leaf weight (SLW) at 45 and 90 days after germination (DAG). SLA and SLW were assessed using the formulae modified by Hunt (1982). Fiji-ImageJ leaf area software (National Institute of Health, Maryland, USA) was employed to measure the leaf area (LA). At 45 and 90 DAG, six monoliths (10 × 10 × 20 cm3) having roots intact were extracted randomly from each SAR-treated plot and then thoroughly rinsed with tap water to remove the soil particles attached to the roots. For the estimation of the total biomass (TB) and root-shoot-ratio (RSR) of plants, leaves, shoot, and root portions were separated, followed by oven drying (80 °C) till a constant weight was obtained.
Statistical analysis
Using one-way ANOVA (analysis of variance), the responses of various parameters between control and SAR treatments were compared. Following one-way ANOVA, Tukey’s post hoc test was performed to interpret the means of the four treatments, including the control. Values were presented in the form of mean ± standard error. For each test cultivar, three-way ANOVA was used to test the significance level of individual effects of age and treatment and their interaction for various parameters. GraphPad Prism version 8 was used to create graphs, and for all statistical analyses, software SPSS Inc. version 21.0 (IBM Corp, Armonk, NY) was employed. The interrelations between SAR treatments and investigated parameters at 90 DAG were obtained independently by applying principal component analysis through varimax rotation for both cultivars.
Results
ROS production and lipid peroxidation
Under SAR treatments, contents of ROS (OH−, ·O2−, H2O2) mostly showed enhancement in both the pea cultivars compared to their respective controls (Fig. 1). H2O2 content increased significantly in both cultivars under all the SAR levels except under pH 5.6 in Samridhi. The maximum increment in H2O2 content was recorded in Nandini under SAR of pH 5.0 at the reproductive stage. An increasing trend of ·O2− production was found in both the cultivars at the reproductive stage (Fig. 1). Further, the increment in ·O2− production was more remarkable in Samridhi compared to Nandini at pH 5.0 and 4.5. SAR treatments also significantly induced the OH− content in test plants at both growth stages under pH 5.0 and 4.5 (Fig. 1). The increments were higher in Samridhi compared to Nandini at both ages. MDA content was increased in both the cultivars at both sampling ages under SAR treatments compared to the control (Fig. 1). Among the cultivars, the highest increment in MDA content was found in Samridhi at SAR pH 4.5 at 90 DAG. Multivariate-ANOVA analyses found that the variations in ROS production were significant due to all individual factors of growth stage (A), SAR treatment (SAR), and cultivar (Cv) as well as their interactions except A × SAR for OH− and SAR × Cv for ·O2− content. The MDA content also varied significantly due to all the individual factors and interactions of SAR × Cv (Table S1).
Fig. 1.

Variations in lipid peroxidation and ROS generation (superoxide radical (•O2−), hydrogen peroxide (H2O2) and hydroxyl radical (OH−)) in pea cultivars at two growth stages under control (pH 7) and SAR (pH 5.6, 5.0 and 4.5) treatments (mean ± SE). Different letters on the top of line graph indicate significant differences among treatments at p < 0.05 according to Tukey’s test. Different color in the box represents different growth stage
Histochemical localization
Leaves of Samridhi showed more potent dark brown stains of DAB polymerisation compared to Nandini under all the SAR treatments (Fig. 2). It was further observed that the stains were more profound at pH 5.0 compared to 4.5 in Nandini. Localisation of ·O2− radicals observed as deep blue formazone upon reaction with NBT was more pronounced in Samridhi under all SAR treatments (Fig. 2).
Fig. 2.

a Microscopic surface view of leaf tissues showing histochemical localization of hydrogen peroxide (H2O2) stained with DAB (brown colour), b leaf fragment showing histochemical localization of superoxide radical (·O2−) stained with NBT (blue colour of formazone) in Nandini and Samridhi cultivars exposed to control (pH 7) and SAR (pH 5.6, 5.0 and 4.5) treatments at reproductive stage. Arrow denotes localization of H2O2 and ·O2–
Enzymatic antioxidants
SOD, APX and GR activity
Treatment with SAR of different acidity-induced variations in the activities of APX, GR, CAT, POX, and SOD in both the test cultivars across the sampling ages (Fig. 3). At both growth stages, SAR treatments upregulated the SOD activity in Samridhi relative to its control (Fig. 3). Nandini showed a significant increment in SOD activity under SAR pH 4.5 and 5.0 only at 90 DAG but declined at 45 DAG. The activity of APX amplified under all SAR treatments in Nandini during both growth stages except at pH 5.6 at 90 DAG (Fig. 3). However, in Samridhi, APX activity decreased significantly at 45 DAG and then increased as the acidity of SAR increased. SAR application at all pH significantly increased the GR activity in Samridhi at 90 DAG, with the most significant activity under pH 4.5. On the other hand, GR activity diminished in Nandini at 90 DAG under all SAR treatments (Fig. 3).
Fig. 3.

Variations in antioxidative enzymatic activities in pea cultivars at two growth stages under control (pH 7) and SAR (pH 5.6, 5.0 and 4.5) treatments (mean ± SE). Different letters on the top of line graph indicate significant differences among treatments at p < 0.05 according to Tukey’s test. Different color in the box represents different growth stage
CAT and POX activity
CAT activity was stimulated during the vegetative growth phase in both the cultivars under all the SAR pH in contrast to pH 7; however, a significant reduction was observed at 90 DAG with a maximum decline in Samridhi at pH 4.5 (Fig. 3). SAR exposure increased POX activity significantly in Nandini at both the growth stages and in Samridhi at 45 DAG with greater induction at SAR pH 4.5; however, the activity decreased considerably in Samridhi across all SAR treatments as compared to pH 7 at 90 DAG (Fig. 3). Findings of three-way ANOVA analyses exhibited significant variations in POX, CAT, SOD, and APX due to A, SAR, and Cv and their interaction except for A and A × SAR × Cv for CAT, SAR for APX and SOD. In contrast, the activity of GR varied significantly only due to A, Cv, and A × SAR × Cv (Table S1).
Non-enzymatic antioxidants
Flavonoids and total phenolics
The content of flavonoids decreased significantly only under SAR of pH 4.5 at 90 DAG in Samridhi compared to their respective control (Fig. 4). In contrast, an increment in flavonoids was noticed in Nandini at 90 DAG at pH 4.5 in comparison to the control (Fig. 4). Total phenolics showed decrement under SAR treatments at an early growth stage in both the cultivars, but a significant reduction was found in Nandini under SAR of pH from 5.6 to 4.5 at 90 DAG. The Multivariate ANOVA test (Table S1) revealed that flavonoids and total phenolics varied significantly with A, SAR, and Cv and their interaction, except for Cv for total phenolics and A × SAR for flavonoids.
Fig. 4.

Variations in flavonoids, total phenolics, ascorbic acids and thiol contents in pea cultivars at two growth stages under control (pH 7) and SAR (pH 5.6, 5.0 and 4.5) treatments (mean ± SE). Different letters on the top of line graph indicate significant differences among treatments at p < 0.05 according to Tukey’s test. Different color in the box represents different growth stage
Ascorbic acid and Thiol
Ascorbic acid (AsA) and thiol contents displayed decrements in Samridhi at both growth stages under all SAR treatments with maximum decline at pH 4.5 as compared to the control at 45 and 90 DAG, respectively (Fig. 4). However, SAR exposure stimulated the pool of AsA and thiol in the leaves of Nandini at both growth stages as compared to the control (Fig. 4). The highest percentage of increments for AsA and thiol were observed under SAR pH 4.5 during the reproductive phase. Results of multivariate ANOVA analyses revealed significant variations of AsA and thiol due to A, SAR, Cv, and their interaction, except for SAR and A × SAR × Cv for AsA and SAR and Cv for thiol (Table S1).
Photosynthetic pigments
SAR treatments led to a decrease in total chlorophyll (TChl) and carotenoid (CAR) contents in Nandini under pH 5.0 and 4.5 during both growth stages (Fig. 5). The highest percentage reduction in TChl was observed at 90 DAG under pH 4.5 compared to its control. In Samridhi, TChl and CAR displayed a reduction under all SAR treatments only at 45 DAG (Fig. 5). Outcomes of three-way ANOVA showed that TChl and CAR were significantly affected by all the factors and their interactions except A × SAR, A × SAR × Cv for TChl and A × SAR, SAR × V and A × SAR × Cv for CAR (Table S1).
Fig. 5.

Variations in total chlorophyll and carotenoids content in pea cultivars at two growth stages under control (pH 7) and SAR (pH 5.6, 5.0 and 4.5) treatments. Different letters on the Box plot indicate significant differences among treatments at p < 0.05 according to Tukey’s test. The box is divided by a line represented as median and different color in the box represents different growth stage
Chlorophyll fluorescence
The trend of photochemical efficiency of PS II, represented as a ratio of Fv/Fm under SAR exposure, is shown in Fig. 6. Fo showed a significant increment in Samridhi only at 90 DAG under SAR pH 5.0 and 4.5, while a reduction was observed in Nandini at pH 4.5 at 45 DAG (Fig. 6). Values of Fm displayed significant decrement in Samridhi during both growth stages only at pH 4.5. However, a significant reduction was found in Nandini only under SAR pH 4.5 at 90 DAG (Fig. 6). SAR treatments decreased Fv in Samridhi at pH 4.5 at 45 DAG and pH 5.0–4.5 at 90 DAG. Nandini showed a significant decrement in Fv only at SAR pH 4.5 during the reproductive stage. Fv/Fm, an important stress indicator, showed a substantial reduction at pH 4.5 at 45 DAG and pH 5.6 to 4.5 during 90 DAG in Samridhi, with a maximum decrement under pH 4.5 compared to pH 7 at 90 DAG. However, the Nandini Fv/Fm ratio did not change significantly at 45 DAG. Still, it reduced at 5.0 and 4.5 significantly during 90 DAG as compared to its control (Fig. 6). Findings of three-way ANOVA showed that Fo, Fm, Fv and Fv/Fm were significantly affected by all the individual factors and their interactions except Cv for Fm, Fv and Fv/Fm, A × SAR for Fm and A × SAR × Cv for Fo and Fv/Fm (Table S1).
Fig. 6.

Variations in minimal fluorescence (Fo), maximum fluorescence (Fm), variable fluorescence (Fv) and the maximum quantum yield of PSII (Fv/Fm) in pea cultivars at two growth stages under control (pH 7) and SAR (pH 5.6, 5.0 and 4.5) treatments. Different letters on the Box plot indicate significant differences among treatments at p < 0.05 according to Tukey’s test. The box is divided by a line represented as median and different color in the box represents different growth stage
Stomatal density, length and width
SEM analysis showed that stomatal density (SD) increased significantly in both the cultivars under SAR pH 5.0 and 4.5 as compared to pH 7 with maximum increment in Nandini under SAR 4.5 (Fig. 7a). Stomatal length reduced significantly in Nandini under all SAR treatment compared to the respective control (Fig. 7b), however, length of stomata increased in Samridhi with rise in acidity (Fig. 7b). Width of stomata decreased significantly only in Samridhi when exposed to SAR pH 5.0 and 4.5 as compared to pH 7 (Fig. 7c).
Fig. 7.
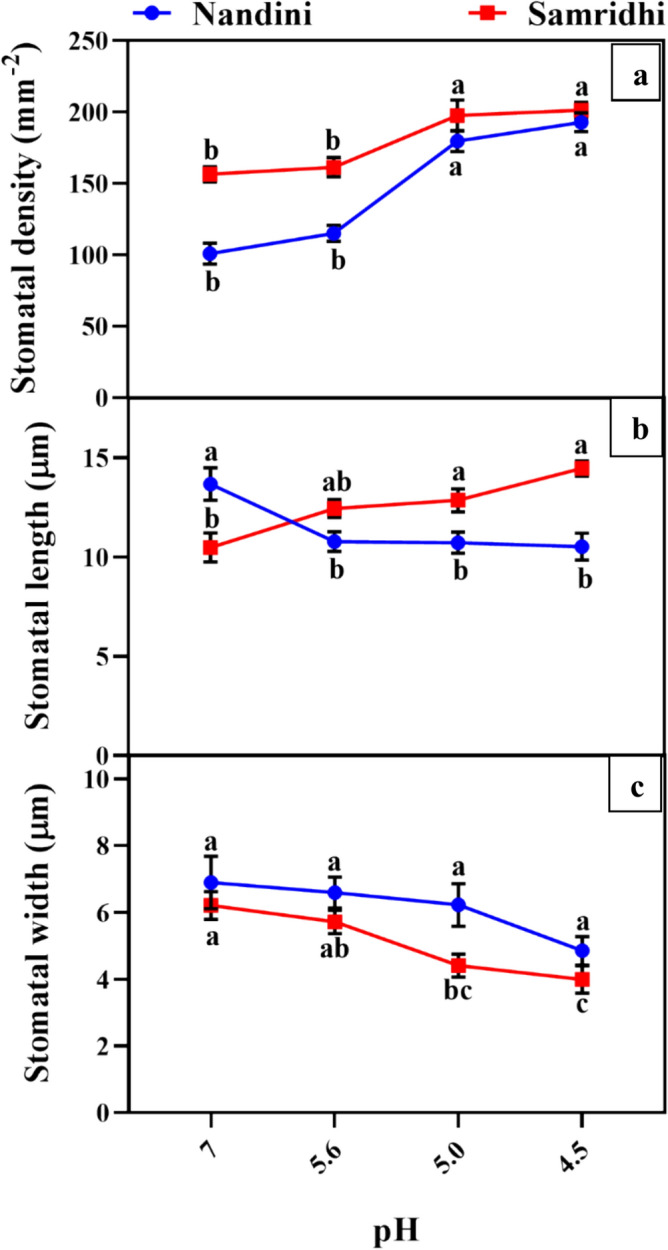
Stomatal density (a), stomatal length (b) and stomatal width (c), under SAR treatments (pH 7, 5.6, 5.0, and 4.5) including control in Nandini and Samridhi. Values are mean ± SE, n = 3; Different letters on the top of line graph indicate significant differences among treatments at p < 0.05 according to Tukey’s test. Different color in the box represents different cultivar
Ultrastructural alterations
Analysis through TEM showed that all the organelles have been intact in both the cultivars under control (pH 7) condition (Figs. 8a and 9a). Chloroplasts were elliptical, exhibiting dense thylakoid and grana, and the mitochondria contain several cristae in the dense stroma with one or two starch granules. After SAR treatment of pH 5.6, no considerable alterations were observed in chloroplast of Nandini as compared to the control (Fig. 8b). In Nandini, shape of chloroplast was well preserved but disordered thylakoids with multiple plastoglobuli were observed under SAR treatment of pH 5.0 and 4.5 (Fig. 8c, d). The number of starch granules decreased but became elongated as compared to the control in Nandini under SAR of pH 5.0 and 4.5. In Samridhi, the elliptical shape of chloroplast changes into inflated round shape with thylakoids showing more waviness and swelling when exposed to SAR treatments (Fig. 9b, c and d). Moreover, the numbers and volume of starch granules increased compared with that to its control. Many small sized mitochondria with disorganized cristae and deformed membrane were observed in SAR exposed plants as compared to their respective controls in both cultivars (Figs. 8 and 9).
Fig. 8.

Transmission electron microscopy (TEM) images of Nandini (scale bar- 1 µm) under a control (pH 7), b pH 5.6, c pH 5.0 d pH 4.5 and Scanning electron microscopy (SEM) images (at 500 KX) under e control (pH 7), f pH 5.6, g pH 5.0, h pH 4.5 of SAR treatments at 90 DAG. Abbreviations: Cp, chloroplast; CW, cell wall; Th, thylakoids; MC, mitochondria; V, vacuole; Sg, starch granules; P, plastoglobuli, yellow arrow showed stomata
Fig. 9.

Transmission electron microscopy (TEM) images of Samridhi (scale bar- 1 µm) under a control (pH 7), b pH 5.6, c pH 5.0 d pH 4.5 and Scanning electron microscopy (SEM) images (at 500 KX) under e control (pH 7), f pH 5.6, g pH 5.0, h pH 4.5 of SAR treatments at 90 DAG. Abbreviations: Cp, chloroplast; CW, cell wall; MC, mitochondria; Th, thylakoids; V, vacuole; Sg, starch granules; P, plastoglobuli, yellow arrow showed stomata
Growth characteristics
Plant height, Number of leaves and leaf area
Plant height (PH) in Samridhi decreased significantly under SAR treatments of pH 5.6 to 4.5 at 45 DAG and under pH 5.0 and 4.5 at 90 DAG compared to pH 7 (Fig. 10a). In Nandini, PH only decreased significantly under pH 5.0 and 4.5 during 45 DAG compared to the control; the maximum reduction was found under pH 4.5 (Fig. 10a). The total number of leaves (NoL) decreased considerably in Nandini under SAR treatments of pH 5.0 and 4.5 at 45 DAG and 4.5 at 90 DAG. Samridhi, on the other hand, showed an increasing trend in the NoL at both growth stages (Fig. 10a). Leaf area (LA) increased in Samridhi under all SAR treatments with maximum increment recorded under SAR of pH 4.5 at early growth stages. However, a significant reduction in LA was observed in Nandini across all the SAR treatments compared to its control at 90 DAG with maximum reduction under SAR of pH 4.5 at 45 DAG (Fig. 10a).
Fig. 10.

a Variations in growth attributes (plant height, number of leaves plant−1 and leaf area) of pea cultivars at two growth stages under control (pH 7) and SAR (pH 5.6, 5.0 and 4.5) treatments (mean ± SE). Different letters on the top of line graph indicate significant differences among treatments at p < 0.05 according to Tukey’s test. Different color in the box represents different growth stage. b Variations in leaf demography (SLA, SLW), RSR and total biomass plant−1 of pea cultivars at two growth stages under control (pH 7) and SAR (pH 5.6, 5.0 and 4.5) treatments (mean ± SE). Different letters on the top of line graph indicate significant differences among treatments at p < 0.05 according to Tukey’s test. Different color in the box represents different growth stage
SLA, SLW and Total biomass
SLA decreased significantly at all SAR pH during the vegetative stage but increased only at pH 5.0 and 4.5 at 90 DAG in both the cultivars compared to the control (Fig. 10b). SAR treatments caused a significant increment in SLW of both cultivars at 45 DAG (Fig. 10b). However, at 90 DAG, both cultivars displayed reductions in SLW, with a maximum decline in Samridhi under pH 4.5 (Fig. 10b). Nandini showed increments in RSR under SAR treatments at 45 DAG with a maximum increment at pH 4.5, while Samridhi displayed insignificant changes across treatments during both growth stages (Fig. 10b). SAR significantly increased the total biomass (TB) of Samridhi during the early growth stage, with maximum increment under pH 4.5. However, a substantial reduction in TB was recorded in Nandini at all SAR pH during both growth stages (Fig. 10b). Multivariate ANOVA results on growth parameters such as SLA, SLW, TB, RSR, PH, and the NoL revealed that variations were significant due to A, SAR, and Cv, and their interactions except for SAR, A × Cv and SAR × Cv for SLW and SLA, A × SAR × Cv for TB, A × SAR for PH and RSR and SAR, A × SAR and A × SAR × Cv for NoL (Table S1).
Principal component analysis (PCA)
The pattern and correlations in the test cultivars were investigated using PCA between the selected characteristics at the reproductive growth stage. Samridhi had three PCA components with eigen values > 1 that accounted for 79% of the overall variations, whereas Nandini had four components that accounted for 85%. The biplot was constructed using the first two components (PC1 and PC2), since they best described most of the data (Fig. S1). PCA evaluation in Samridhi revealed a variability of 58.8% for component 1 (eigen value 13.5) and 12.3% (eigen value 2.8) for component 2. Parameters like SOD, APX, GR, phenol, H2O2, ·O2−, −OH, MDA, LA, SLA, and TB showed a strong positive correlation for Samridhi on PC1 (Fig. S1a). However, the parameters CAT, POX, AsA, thiol, Fv/m, PH, and SLW revealed negative loading on the same component (Fig. S1a). For PC2, TChl, CAR, flavonoids, NoL has higher loadings. Variability for PC1 in Nandini was 61.3% (eigen value 14.09) and 11.07% (eigen value 2.54) for PC2 (Fig. S1b). The biplot for Nandini showed higher positive loading for APX, POX, SOD, AsA, MDA, ·O2−, OH−, and thiol, while TChl and NoL showed a negative correlation on PC1. The parameters identified on PC2 include CAR, CAT, phenol, GR, TB, Fv/Fm, and SLW represent a robust negative loading. H2O2, flavonoids, SLA, LA, and RSR are positively linked to PC2. Biplot PCA analysis represents a favourable relationship between MDA content, ROS radical production, and antioxidative enzyme activities in both cultivars (Fig. S1b).
Discussion
The findings of the current investigation manifested the alterations in overall growth and physiological and biochemical aspects of pea cultivars under different SAR treatments of pH 5.6, 5.0, 4.5, and 7 (control). However, the tolerance of different cultivars to SAR stress varied with the growth stage and pH of the acid rain.
Divergent response of enzymatic and non-enzymatic antioxidants under SAR induced oxidative stress
SAR induced ROS generation and associated membrane damage
After SAR treatments, both the cultivars exhibited the production of ROS, which was also evidenced by in-situ localisation of H2O2 and ·O2− in the leaf, with Samridhi showing more prominent stains compared to Nandini (Fig. 1). Heightened accumulation of free radicals in Samridhi at the early growth stage compared to Nandini under SAR stress has been observed in the present study. Moreover, long-term exposure to SAR led to excessive ROS generation and accretion in Samridhi under SAR of pH 5.0 and 4.5. The histochemical analysis outcome also confirmed the ROS production trend in both cultivars (Fig. 2). Our findings corroborated with the study of Debnath et al. (2018) made on two cultivars of Solanum lycopersicum L. where increases in H2O2 generation ranging from 42 to 75% at SAR pH 2.5 and 28- 53% at pH 3.5 as compared to their respective controls, were reported. Increments in lipid peroxidation (MDA content) were observed in both cultivars at all growth stages in SAR-treated plants, indicating induced membrane damage with a notable increment in Samridhi compared to Nandini. Overproduction and accumulation of ROS in the form of H2O2, OH− and ·O2− may bring about peroxidation of membrane lipids, which may lead to membrane damage (Neves et al. 2009). Thus, the increment in MDA content leads to maximum membrane lipid damage and makes Samridhi more sensitive to AR. A substantial increase in MDA content by 13% has been reported in rice under SAR of pH 3.0 (da Fonseca et al. 2020). In comparison, a similar increment in H2O2 content was reported by Choudhary and Agrawal (2014) and Karataş et al., (2014) in pea cultivars under elevated UV-B (HUP-2: 56% and HUDP-15: 33%) and drought stress (cv. Rona: 4–10%), respectively, however, the extent of increment was found to be lesser when compared to SAR treatments.
Response of enzymatic antioxidants
Plants generate antioxidant enzymes such as APX, GR, SOD, POX, and CAT to defend against oxidative stress after being exposed to AR (Ahmad et al. 2021). With the decreasing pH, ROS generation and its accumulation in plants increased. When a plant’s stress exceeds its defence capacity, the function of the antioxidant system gets disrupted, resulting in a decrease in enzyme activity (Xalxo and Keshavkant 2019). SAR application led to differential responses of the studied antioxidant enzymes in Samridhi and Nandini.
Catalase, a tetrameric enzyme that directly converts H2O2 into H2O and O2, was significantly upregulated in both cultivars under SAR treatments in the initial growth stage while reduced at the later growth stage (Fig. 3). A more significant reduction in CAT activity has been observed in Samridhi, with a concomitant decrease in POX activity. Yang et al. (2021) found a rise in CAT and POX activities in rice leaves under SAR of pH 3 and above; however, activity reduced at pH 2.0, which implied that acid rain of pH 2.0 triggered the surfeit production of ROS, which might exceed the scavenging capacity of these antioxidant enzymes. In Nandini, the increased activities of POX and APX at both growth stages were enough to detoxify the OH− and H2O2, thus leading to the downregulation of CAT activity as APX has a high affinity towards H2O2 as compared to CAT (Ren et al. 2018).
SOD, a metalloenzyme, serves as the first line of defence, which scavenges ·O2– and dismutates to H2O2 (reduced form) and later into OH− (highly reactive form) (Gupta et al. 2022a). In the present study, higher activity of SOD in Samridhi at both the ages under SAR is primarily accountable for the profuse generation of H2O2 from ·O2–, leading to more accumulation in Samridhi due to lower activities of CAT and POX (Fig. 3). Moreover, decreased POX activity caused increased accretion of OH− in cells, thus leading to more significant damage. Considerable increments in the activities of SOD and CAT in Cucurbita moschata leaves were reported under SAR of pH 4.5 as compared to control to protect against ROS damage by SAR (Ahmad et al. 2021). Accordingly, the tolerant threshold of antioxidant content and enzymes in different plants might be utilised to contemplate the tolerance of plants because the ability of the antioxidant system to remove ROS from plants under SAR stress helped prevent oxidative damage brought on by AR.
APX is a crucial antioxidative enzyme in the ascorbate–glutathione cycle that detoxifies H2O2 by using AsA as an electron donor. GR activity in plant cells determines the efficiency of APX in removing H2O2. Enhanced levels of APX and GR at the early growth stage attenuated the harmful effects of SAR in Nandini by scavenging H2O2, which corresponded well with a reduction in H2O2 content at 45 DAG (Fig. 3). This trend indicated that Nandini had greater acid tolerance than Samridhi. Ren et al. (2018) described that the application of SAR of pH 3.5 and 3.0 stimulated and promoted the tolerance mechanism in Oryza sativa L. (rice) by modulating the activities of CAT, POD (peroxidase) and SOD genes. Further, at transcriptional level, the expression of Cu/Zn-SOD, POD1 and CAT1 were upregulated and led to reduction in the levels of H2O2 and ·O2 in cell, thus enhanced the potential of antioxidative system to scavenge ROS (Ren et al. 2018). Higher induction of major enzymatic antioxidants and detoxifying abilities in Nandini at both ages (Fig. 3) showed a greater combating efficiency that played a vital role in ROS scavenging, resulting in lower membrane damage under SAR stress, revealing Nandini’s higher level of tolerance compared to Samridhi. Greater levels of SOD and POX in test plants (P. sativum) under UV-B radiation (Singh et al. 2015) and salinity stress (Ismail et al. 2022) can be considered as one of the adaptive traits which reduce the H2O2 toxic levels and might protect the cells from oxidative damage.
Response of non-enzymatic antioxidants
To counter the oxidative stress, together with enzymatic antioxidants, non-enzymatic antioxidants such as flavonoids, ascorbic acids, phenolics, and thiol compounds are actuated by plants to protect themselves by indirectly scavenging ROS and help to maintain intracellular redox-homeostasis of cells (Yendrek et al. 2015; Gupta et al. 2022a). Ascorbic acid and thiol are the most abundant and powerful ROS detoxifier that serves as biochemical markers in evaluating the sensitivity of cultivars against environmental stress (Fatima et al. 2019), and helps to curb the harm caused by ROS in plants (Ren et al. 2018). Improved levels of AsA and thiols in Nandini, especially during the vegetative stage provided maximum protection against SAR thus making it more tolerant than Samridhi. The outcomes of our study showed that a significant increment in these antioxidants in tolerant cultivars has a direct correlation with resistance to SAR and may be utilised as a preferred indicator for AR damage to crops (Fatima et al. 2019). Biosynthesis of these antioxidants demands heavy translocation of assimilates which was accompanied by decline in biomass in Nandini at both stages. Additionally, the ability of tolerant cultivar to maintain a higher concentration of antioxidants at reproductive stage offers more resistance against yield losses. Findings of Yendrek et al. (2015) also established that a pronounced concentration of glutathione, ascorbate, and phenolics in pea leaves provided better antioxidative potential to withstand any physiological and biochemical modifications under stress.
Enhanced accumulation of phenolic compounds (ubiquitous secondary metabolites) via the phenylpropanoid pathway is an adaptive response towards adverse environmental conditions (Gupta et al. 2022a). The increased levels of flavonoids under SAR of pH 5.6, 5.0, and 4.5 in Nandini were contributed by higher AsA concentration, which serves as a cofactor in the biosynthesis of polyphenols, thus attenuating the effects of SAR. Debnath et al. (2018) found that more production of non-enzymatic antioxidants (Flavonoids and phenols) in tomato plants under SAR of pH 2.5 and 3.5 assisted the role of ROS scavenger by neutralizing the radicals before any harm to the cells. The present outcomes indicate that the amplification of non-enzymatic antioxidants (flavonoids, ascorbic acids, and thiols) in Nandini supported the function of these compounds in promoting plant defence by scavenging ROS under SAR treatments. However, in Samridhi, a reverse trend of reduction in non-enzymatic antioxidants has been observed, suggesting its greater sensitivity towards SAR stress.
Photosynthetic response under SAR stress
Effect of SAR on photosynthetic pigments
Plants absorb light energy to support photosynthetic production using chlorophyll (Ren et al. 2018), strongly associated with plant growth. In this study, Nandini had a greater reduction of both TChl and CAR than Samridhi when exposed to SAR treatments at 90 DAG, which suggests that SAR of pH 5.0–4.5 may retard the synthesis of chlorophyll or induce the breakdown of chlorophyll molecules leading to lowering of the content. Reductions in chlorophyll content in soybeans (Hu et al. 2014) and Solanum melogena (Sharma and Sharma 2011) were reported under SAR exposure. A decrease in CAR and photosynthetic pigments together under SAR exposure may lead to a decline in the absorbing capacity of the light-harvesting system under stress conditions. Also, a decrease in chlorophyll content under AR is correlated with foliar leaching of magnesium, one of the critical components of chlorophyll (Hu et al. 2014). Reduced photosynthetic pigments in Nandini corresponded to decreased TB accumulation under SAR treatments at both growth stages. In agreement with our result, El-Saadony et al. (2017) and Husen et al. (2016) have also reported a decline in total chlorophyll in P. sativum. The findings also suggested that chlorophyll content is directly associated with plant growth, and degradation of TChl might be the outcome of an imbalance in ion homeostasis leading to a reduction in chlorophyll synthesis under drought and salt stress. Stress may impair the photosystem and increase electron leakage to O2 due to insufficient levels of chlorophyll (Husen et al. 2016).
Effect of SAR on chlorophyll fluorescence
The results of chlorophyll fluorescence analysis, a widely used technique for examining plant photosynthetic efficiency, corroborated with pigment response (Liu et al. 2015). In the present study, an increment in Fo values under SAR treatment at pH 4.5 in Samridhi indicated the impairment in the PSII reaction centre’s energy trapping efficiency or disconnection of antennae from the reaction centres. Reduction in Fm and Fv under SAR of pH 4.5 at both growth stages in Samridhi revealed a change in the thylakoid membrane ultrastructure that affected the electron transport rate (Yu et al. 2002). A significant decline in Fv/Fm in Samridhi compared to Nandini under SAR of low pH showed that the maximum quantum efficiency of PSII was impacted, leading to functional and structural modifications in photosynthetic processes (Yu et al. 2002). This suggests that compared to pH 7, severe acidic conditions might damage the PSII in Samridhi, which was not compensated or overcome even at 90 DAG.
Minor variations in fluorescence parameters of Nandini across all growth stages, except at pH 4.5, indicated an inbuilt protective mechanism that allowed the leaves to dissipate the dangerously excess excitation energy as heat. Consequently, it implies that Nandini has efficient PSII photochemistry that prevented photoinhibition or photodamage to PSII at low acid concentrations, consistent with the study of Zhang et al. (2020) in Camellia sinensis (tea). Reduction in biomass of Nandini under SAR treatments, especially during the later growth stage, depicts that plants maximised the utilisation of energy in acclimatising the process of the maximal quantum photochemical efficiency to maintain a stable photosynthetic process. Moreover, a study by Liu et al. (2015) on E. glabripetalus seedlings reported enhanced Chl fluorescence when treated with SAR of pH 2.5 as compared to pH 4.0 and 5.6, suggesting that the test plant was able to adapt metabolism to deal with acidic surroundings. As a result, the capacity to withstand increasing acidity benefits productivity. Previous studies on pea under various abiotic stress, such as by Ismail et al. (2014) and Husen et al. (2016) demonstrated the reduction in Fv/Fm was found to be correlated with a decrement in Pn, which suggests under ozone (10–29%) and salt (27–33%) stress inhibits the pea plants abilities to utilise the photon energy and consequently alters the photosynthetic processes.
SAR induced ultrastructural alterations
In the present study, SAR exposure damaged the chloroplast leading to increased plastoglobuli (Figs. 8 and 9). Generally, the chloroplasts contain few plastoglobuli, however, its number and size increase with thylakoid disintegration (Vodka 2017), which might be a reason for increased plastoglobuli under SAR pH 5.0 and 4.5 (Fig. 8 b, c, and d). Similar changes in the structure of thylakoid system of chloroplast after SAR exposure have been reported in leaves of Lycopersicon esculentum Mill. in which chloroplast rounding, inflating, thylakoid swelling, and appearance of several starch granules were also observed (Gabara et al. 2003). Thylakoid waviness and swelling were also reported in P. sativum at SAR pH 2.5 (Polishchuk et al. 2016). Damage to the ultrastructure of chloroplasts is known to hamper chlorophyll fluorescence parameters (Fig. 6) as observed in our study and the photosynthetic process (Ju et al. 2020). In Samridhi, the volume and number of starch granules in chloroplast increased as the acidity of SAR increases, which could be related to SAR interferences with the physiological metabolism and damage to the cell and tissue structures, which may block photosynthate transport (sugars) from leaves to roots and thus led to the accumulation of large and disorganized starch granules in the leaves (Ju et al. 2020; Rajpoot et al. 2016). An increase in the number of mitochondria accompanied by the reduction in size and loss of cristae were observed under SAR treatment of both cultivars at higher acidity. Gabara et al. (2003) also reported similar observations in L. esculentum under SAR of pH 1.8.
Association of stomatal density and stomatal size (SS) with SAR tolerance
Modifications in SD and SS are considered as plant’s adaptive strategy against the adverse environment which consequently affects the gas exchange capacity of plants. In the current study, Samridhi displayed high SD and SS while Nandini showed an increase in SD along with a decrease in SS under SAR pH 5.0 and 4.5 (Fig. 7). This trend indicates that Nandini had better stomatal responsiveness against SAR, which led to more efficient stomatal closure thus limiting the entry of acid particles inside the leaf tissue. Prior research has demonstrated that greater SD and smaller SS improve the sensitivity of the stomatal regulation of the plants under SAR and enhance the stomatal function at comparable leaf areas (Ju et al. 2017). Furthermore, Nandini having low biomass, and smaller LA with low SS require less water and may close their stomata faster than Samridhi with larger LA and SS. Moreover, Nandini was able to maintain high PSII values for a long duration during SAR and also recovered faster compared to Samridhi with higher plant biomass along with high SS. In line with the present study, a correlation between SD, SS, and plant biomass under drought and salinity stress was also reported by Caine et al. (2023) on 72 varieties of O. sativa under drought and salinity stresses. A similar trend of induction of SD after SAR treatments was also observed by Ju et al. (2017) under individual and combined treatments of Silicon and SAR (pH 4.0, 3.0, and 2.0) in O. sativa which led to enhanced photosynthesis by regulating gas diffusion.
Dual effect of SAR on growth
A plant’s growth status can be contemplated by its height, NoL, LA, and biomass of roots and shoots. AR has a dual effect on plant development, which can be positive and negative (Pham et al. 2021). The current study demonstrated that SAR exposure of pH 5.0 and 4.5 reduced PH in both cultivars. In addition, NoL declined in Nandini as the acidity of SAR increased, suggesting that the depletion of photosynthates might be responsible for reducing the initiation of leaves (Li et al. 2022). Reduction in TB due to AR has been reported by Neufeld et al. in Platanus occidentalis L. and Liquidambar styraciflua L. under SAR of pH 2.0, mainly due to decreased allocation in stem and root biomass, along with reduction of viable LA (1985). Under SAR treatments, TB in Nandini decreased primarily as more energy was invested in reviving the non-antioxidant and oxidative defence system at the early growth stage. This shielding effect endorsed by plants resulted in the greater diversion of photosynthate towards providing protection, and remained less available for storage in Nandini compared to Samridhi. Additionally, higher RSR in Nandini may enable plants to absorb sufficient nutrients to prevent a decline in photosynthetic rate and assist in buffering the negative impacts of AR (Fig. 10b). Similar reduction in LA (~ 20%) and TB (19–29%) was recorded by Choudhary and Agrawal (2014) in two pea cultivars (HUP-2 and HUDP-15) when exposed to elevate UV-B signifies lower plant growth rates negate the effects of UV-B and trigger protective mechanisms, which reduces the leaf surface area and thus limits the radiation absorbance.
The stimulation of leaf numbers and TB at the early development stage under all SAR treatments in Samridhi (Fig. 10a, b) is consistent with the report of Sreesaeng et al. (2021) in Thai rice and Zhang et al. (2021) in Acer catalpifolium. Gain in LA and leaf count suggest that AR of low pH facilitated plant growth via foraging nutrients towards shoot and promoted aboveground tissue growth, thus assisting plants in successfully thriving under acid rain stressed environment. Similar findings were also reported in O. sativa L. by Ju et al. (2020) under SAR of pH 3.0 where an increase in the PH, roots, and dry weight was noticed. Chen et al. (2023) reported an increasing trend in PH, leaf length, and LA of Mirabilis jalapa L. under SAR of pH 5.6 to 3.0. The study suggests that plants growing under SAR of mild pH enhance their resource acquisition and utilization towards height and breadth. Kohno and Kobayashi (1989) found that SAR of pH 4.0 stimulated plant growth by increasing the absorption of nitrate–N via leaf surface and soil during AR treatment.
Effect of SAR on growth indices
The plants adapt different strategies for lowering the penetration of acids inside leaf tissue (Ren et al. 2018). According to Chen et al. (2023), the plant’s reduced LA and increased leaf thickness assist them in avoiding SAR stress by diminishing the receptive LA. Nandini responded better than Samridhi by enhancing its SLW and reducing its LA during the initial stage (Fig. 10b). A study by Singh and Agrawal (1996) on two varieties of T. aestivum L. found that plants with thinner cuticles would allow acid solutions to enter the leaf interior, bringing about more prominent reductions in growth, accumulation of dry matter, and yield. Furthermore, increased SLW with a concurrent decrease in SLA indicates the production of thicker leaves under SAR stress as more biomass is allocated for producing sturdy leaves in Nandini, reflecting better adaptability towards acidic conditions (Fig. 10b). A similar decline in SLA was also detected in greenhouse-grown Glycine max L. (soybean) plants under SAR of pH 2.6 (Norby and Luxmoore 1983). Moreover, increased SLA during the reproductive stage in pea cultivars reflects a plant’s fundamental tradeoff in functionality between rapid development (high SLA), and resource conservation along with defence (low SLA). Thus, variation in SLA under SAR can be used to assess plant reproductive effort, which represents amount of resources invested in reproduction. The transformation of growth into fitness, i.e., the link between plant biomass and reproductive production, is another crucial component of plant strategy (Dovrat et al. 2019). Cultivar investing more towards its growth and development in the vegetative period might undermine its ability to provide energy for reproduction.
PCA biplot graph showed the adverse impact of SAR on both pea cultivars and established interrelation connecting oxidative stress with enzymatic and non-enzymatic antioxidants in plants as an avenue of defence. PCA outcomes showed a strong positive correlation between lipid peroxidation and ROS content (OH−, ·O2− and H2O2) in both cultivars. In Nandini, the rise in enzymatic antioxidants (APX, POX, SOD) and secondary metabolites (AsA and thiol) are closely correlated with the generation of ROS, demonstrating activation of defence in retaliation against SAR (Fig. S1b). The correlation among numerous parameters shows more divergence of photosynthates towards defence; as a result, no appreciable membrane damage was seen in Nandini. At the same time, growth parameters and pigments were more prevalent on the negative axes of PC1 and PC2, indicating comparable behaviour of these parameters in Nandini, implying a decrease in TChl, CAR, number of leaves, and Fv/Fm led to a drop in TB. In Samridhi, enzymatic and non-enzymatic antioxidants (SOD, APX, GR, and phenols), SLA, LA, and MDA exhibited greater affinity on the positive axis of PC1 (Fig. S1a). At the same time, CAT, POD, thiol, AsA, Fv/Fm, PH, and SLW were grouped on a negative axis, suggesting contrasting behaviour of these traits under SAR. These traits revealed that higher LA and SLA, along with lesser SLW in Samridhi, enhanced the inception of acidic particles on leaves, thus increasing MDA formation. Fv/Fm was positively linked with PH and secondary metabolites, indicating that the reduction in Fv/Fm might have contributed to the decline in PH.
A proposed mechanistic pathway exhibiting a differential response of antioxidants to oxidative stress induced by SAR in both cultivars is depicted in Fig. S2. The distinctive trade-off between biomass and antioxidants (non-enzymatic and enzymatic) was demonstrated by both the test cultivars under SAR treatments in our study. Higher production of ROS coupled with elevated levels of non-enzymatic antioxidants (AsA and thiols) led to a greater reduction of biomass (g plant−1) of Nandini as more deviation of energy towards defence. Samridhi, on the other hand prioritized its growth over its reproductive fitness. Our study finds that cultivar investing more energy to elicit the responses of non-enzymatic antioxidants at early growth stages proved to have better resistance against SAR stress as it equipped the plant to cope up with oxidative stress at reproductive stage. The whole set of findings, especially the strong induction of antioxidants (enzymatic and non-enzymatic) in the Nandini cultivar, amply demonstrates the validity of our proposed hypothesis. This led us to assume that Nandini was more tolerant than Samridhi to the oxidative damage caused by SAR of different pH.
Conclusion
The present study concluded that increased rain acidity has negatively affected the metabolic responses and biomass accumulation during the reproductive stage of two pea cultivars. Diminution of prime antioxidants comprising thiols and ascorbic acids along with APX and GR was observed in Samridhi under SAR stress compared to Nandini. However, induction of SOD at both growth stages in Samridhi does not compensate for the adverse effect of SAR, thus accompanied by greater membrane damage. Greater increase in SLA in Samridhi at reproductive stage compromise the reproductive potentiality as rapid resource capture by plant was utilise for growth on expense of stress resistance. Contrary to this, Nandini displayed higher induction of most of the enzymatic and non-enzymatic antioxidants (AsA and thiols) linked to defence with reduced biomass, suggesting a differential trade-off between defence and growth. This exchange/ bargain was vital in alleviating the diminishing effects of SAR in Nandini. The study established that Nandini is more tolerant towards SAR than Samridhi. This work gives better insight into the defence scheme adopted by plants under SAR exposure to different pH. Additionally, comparing the pea specific response to different abiotic stresses (Ozone, drought, salinity and UV-B) the magnitude of changes with respect to growth, photochemistry (Fv/Fm) and biochemical traits are found to be in greater extent under SAR stress. Thus, making SAR one of the top stressors that pose a danger to crop productivity and growth as compared to other environmental stress. The elevation in activities of SOD, POX, and APX in pea cultivars under SAR may serve as a functional discerning marker for tolerant cultivars against changing concentrations of acidic compounds caused by dynamic climatic variables, especially when it is not possible to entirely eradicate air pollution over the long term. With particular emphasis, the present research highlights the need to screen crops and landraces in their natural environment to evaluate the species-specific response toward SAR stress which can help in identification and selection of AR tolerant genotypes. Furthermore, using modern phenomics tools for precise phenotyping and genomic approaches may be utilized to target the genes responsible for the AR tolerance in crops. The development of AR tolerant genotypes and their planting may prove to be the most feasible alternative for pea cultivation in AR prone areas in IGP in near future.
Supplementary Information
Below is the link to the electronic supplementary material.
Acknowledgements
The authors are grateful to the Head, Department of Botany, and the coordinator of the Institute of Eminence (IOE), Banaras Hindu University for providing all the necessary facilities for the experiment. We are thankful to the Indian Institute of Vegetable Research (IIVR), Varanasi, Uttar Pradesh, India, for providing seeds of Pisum sativum. S.B. Agrawal acknowledges the Council of Scientific and Industrial Research (CSIR), New Delhi, for providing funding in the form of Emeritus Scientist project. Sophisticated Analytical Instrumentation Facility, AIIMS, New Delhi for TEM analysis and Department of Geology, Banaras Hindu University for SEM analysis, is also acknowledged.
Author contributions
Jigyasa Prakash: Conceptualization, Validation, Formal analysis, Investigation, Data curation, Writing—original draft, Visualisation. Shashi Bhushan Agrawal: Visualization, Writing-review & editing. Madhoolika Agrawal: Conceptualization, Validation, Writing—review & editing, Supervision. All authors read and approved the final manuscript.
Funding
Jigyasa Prakash acknowledges the Council of Scientific and Industrial Research (CSIR), New Delhi, India, for JRF and SRF (File No. 09/013(0934)/2020-EMR-I) fellowships. Madhoolika Agrawal is also grateful to DST-SERB, New Delhi, for J.C. Bose Fellowship (Sanction no. JCB/2021/000040).
Data availability
The datasets used and/or analyzed during the current study are available from the corresponding author on reasonable request.
Declarations
Conflict of interest
The authors have no competing interests to declare that are relevant to the content of this article.
Ethical approval
Not applicable
Consent to participate
Not applicable.
Consent for publication
Not applicable.
Footnotes
Publisher's Note
Springer Nature remains neutral with regard to jurisdictional claims in published maps and institutional affiliations.
References
- Aebi H (1984) Catalase in vitro. In: Methods in enzymology, 105, Academic press. pp 121-126. 10. 1016/ S0076- 6879(84) 05016-3 [DOI] [PubMed]
- Agricultural statistics at a glance 2022 (2023) Horticulture crops production data. Department of agriculture & farmers welfare, economics and statistics, GOI. https://agriwelfare.gov.in/Documents/CWWGDATA/Agricultural_Statistics_at_a_Glance_2022_0.pdf. horticulure-crops-2021–22-second-advance estimates
- Ahmad G, Khan AA, Mohamed HI (2021) Changes in growth, yield, photosynthetic pigments, biochemical substances, oxidative damage, and antioxidant activities induced by treatment with different pH of artificial acid rain in pumpkin (Cucurbita Moschata). Gesunde Pflanz 73:623–637. 10.1007/s10343-021-00583-1 10.1007/s10343-021-00583-1 [DOI] [Google Scholar]
- Ahmed M, Bhuyan P, Sarkar S, Hoque RR (2022) Seven-year study of monsoonal rainwater chemistry over the mid-Brahmaputra plain, India: assessment of trends and source regions of soluble ions. Environ Sci Pollut Res 29:1–20. 10.1007/s11356-021-17385-7 10.1007/s11356-021-17385-7 [DOI] [PubMed] [Google Scholar]
- Alexieva V, Sergiev I, Mapelli S, Karanov E (2001) The effect of drought and ultraviolet radiation on growth and stress markers in pea and wheat. Plant Cell Environ 24:1337–1344. 10.1046/j.1365-3040.2001.00778.x 10.1046/j.1365-3040.2001.00778.x [DOI] [Google Scholar]
- Andrade GC, Silva LC (2017) Responses of tropical legumes from the Brazilian Atlantic Rainforest to simulated acid rain. Protoplasma 254:1639–1649. 10.1007/s00709-016-1054-z 10.1007/s00709-016-1054-z [DOI] [PubMed] [Google Scholar]
- Arora V, Singh BJ, Bithel N, Malik N, Upadhyay SK, Singh R (2022) Effect of simulated acid rain on plant growth behaviour of Solanum melongena Linn. and Vigna unguiculata ssp cylindrica (L.) Walp. Environ Dev Sustain 1–29:627–655. 10.1007/s10668-022-02726-4 10.1007/s10668-022-02726-4 [DOI] [Google Scholar]
- Ashenden TW, Bell SA (1989) Growth responses of three legume species exposed to simulated acid rain. Environ Pollut 62:21–29. 10.1016/0269-7491(89)90093-6 10.1016/0269-7491(89)90093-6 [DOI] [PubMed] [Google Scholar]
- Beyer WF Jr, Fridovich I (1987) Assaying for superoxide dismutase activity: some large consequences of minor changes in conditions. Anal Biochem 161:559–566. 10.1016/0003-2697(87)90489-1 10.1016/0003-2697(87)90489-1 [DOI] [PubMed] [Google Scholar]
- Bhaskar VV, Rao PSP (2017) Annual and decadal variation in chemical composition of rain water at all the ten GAW stations in India. J Atmos Chem 74:23–53. 10.1007/s10874-016-9339-3 10.1007/s10874-016-9339-3 [DOI] [Google Scholar]
- Bray HG, Thorpe W (1954) Analysis of phenolic compounds of interest in metabolism. Methods Biochem Anal. 10.1002/9780470110171.ch2 10.1002/9780470110171.ch2 [DOI] [PubMed] [Google Scholar]
- Caine RS, Harrison EL, Sloan J, Flis PM, Fischer S, Khan MS, Nguyen PT, Nguyen LT, Gray JE, Croft H (2023) The influences of stomatal size and density on rice abiotic stress resilience. New Phytol 237:2180–2195. 10.1111/nph.18704 10.1111/nph.18704 [DOI] [PMC free article] [PubMed] [Google Scholar]
- Chance B, Maehly AC (1955) Assay of catalases and peroxidases. Methods Enzymol 2:764–775. 10.1016/S0076-6879(55)02300-8 10.1016/S0076-6879(55)02300-8 [DOI] [Google Scholar]
- Chen LY, Wang L, Wang HY, Zhu X (2023) Characterising the influence of acid rain on the growth and physiological characteristics of Mirabilis jalapa Linn. in southern China. Acta Physiol Plant 45:5. 10.1007/s11738-022-03490-8 10.1007/s11738-022-03490-8 [DOI] [Google Scholar]
- Choudhary KK, Agrawal SB (2014) Ultraviolet-B induced changes in morphological, physiological and biochemical parameters of two cultivars of pea (Pisum sativum L.). Ecotoxicol Environ Saf 100:178–187. 10.1016/j.ecoenv.2013.10.032 10.1016/j.ecoenv.2013.10.032 [DOI] [PubMed] [Google Scholar]
- da Fonseca SS, da Silva BRS, Lobato AKDS (2020) 24-Epibrassinolide positively modulate leaf structures, antioxidant system and photosynthetic machinery in rice under simulated acid rain. J Plant Growth Regul 39:1559–1576. 10.1007/s00344-020-10167-4 10.1007/s00344-020-10167-4 [DOI] [Google Scholar]
- Dalton DA, Russell SA, Hanus FJ, Pascoe GA, Evans HJ (1986) Enzymatic reactions of ascorbate and glutathione that prevent peroxide damage in soybean root nodules. Proc Natl Acad Sci 83:3811–3815. 10.1073/pnas.83.11.3811 10.1073/pnas.83.11.3811 [DOI] [PMC free article] [PubMed] [Google Scholar]
- Debnath B, Irshad M, Mitra S, Li M, Rizwan HM, Liu S, Pan T, Qiu D (2018) Acid rain deposition modulates photosynthesis, enzymatic and non-enzymatic antioxidant activities in tomato. Int J Environ Res 12:203–214. 10.1007/s41742-018-0084-0 10.1007/s41742-018-0084-0 [DOI] [Google Scholar]
- Devi J, Sagar V, Mishra GP, Jha PK, Gupta N, Dubey RK, Singh PM, Behera TK, Prasad PV (2023) Heat stress tolerance in peas (Pisum sativum L.): current status and way forward. Front Plant Sci 13:1108276. 10.3389/fpls.2022.1108276 10.3389/fpls.2022.1108276 [DOI] [PMC free article] [PubMed] [Google Scholar]
- Dolatabadian A, Sanavy SAMM, Gholamhoseini M, Joghan AK, Majdi M, Kashkooli AB (2013) The role of calcium in improving photosynthesis and related physiological and biochemical attributes of spring wheat subjected to simulated acid rain. Physiol Mol Biol Plant 19:189–198. 10.1007/s12298-013-0165-7 10.1007/s12298-013-0165-7 [DOI] [PMC free article] [PubMed] [Google Scholar]
- Dovrat G, Meron E, Shachak M, Golodets C, Osem Y (2019) Plant size is related to biomass partitioning and stress resistance in water-limited annual plant communities. J Arid Environ 165:1–9. 10.1016/j.jaridenv.2019.04.006 10.1016/j.jaridenv.2019.04.006 [DOI] [Google Scholar]
- El-Saadony FM, Nawar DA, Zyada HG (2017) Effect of foliar application with salicylic acid, garlic extract and proline on growth, yield and leaf anatomy of pea (Pisum sativum L.) grown under drought stress. Middle East J Appl Sci 7:633–650 [Google Scholar]
- Elstner EF, Heupel A (1976) Inhibition of nitrite formation from hydroxylammoniumchloride: a simple assay for superoxide dismutase. Anal Biochem 70:616–620. 10.1016/0003-2697(76)90488-7 10.1016/0003-2697(76)90488-7 [DOI] [PubMed] [Google Scholar]
- Fahey RC, Brown WC, Adams WB, Worsham MB (1978) Occurrence of glutathione in bacteria. J Bacteriol 133:1126–1129. 10.1128/jb.133.3.1126-1129.1978 10.1128/jb.133.3.1126-1129.1978 [DOI] [PMC free article] [PubMed] [Google Scholar]
- Fatima A, Singh AA, Mukherjee A, Agrawal M, Agrawal SB (2019) Ascorbic acid and thiols as potential biomarkers of ozone tolerance in tropical wheat cultivars. Ecotoxicol Environ Saf 171:701–708. 10.1016/j.ecoenv.2019.01.030 10.1016/j.ecoenv.2019.01.030 [DOI] [PubMed] [Google Scholar]
- Flint SD, Jordan PW, Caldwell MM (1985) Plant protective response to enhanced UV-B radiation under field conditions: leaf optical properties and photosynthesis. Photochem Photobiol 41:95–99. 10.1111/j.1751-1097.1985.tb03454.x 10.1111/j.1751-1097.1985.tb03454.x [DOI] [Google Scholar]
- Gabara B, Skłodowska M, Wyrwicka A, Glińska S, Gapińska M (2003) Changes in the ultrastructure of chloroplasts and mitochondria and antioxidant enzyme activity in Lycopersiconesculentum Mill. Leaves sprayed with acid rain. Plant Sci 164:507–516. 10.1016/S0168-9452(02)00447-8 10.1016/S0168-9452(02)00447-8 [DOI] [Google Scholar]
- Gupta A, Agrawal SB, Agrawal M (2022a) Evaluation of toxicity of tropospheric ozone on tomato (Solanumlycopersicum L.) cultivars: ROS production defense strategies and intraspecific sensitivity. J Plant Growth Regul. 10.1007/s00344-022-10870-4 10.1007/s00344-022-10870-4 [DOI] [Google Scholar]
- Gupta A, Yadav DS, Agrawal SB, Agrawal M (2022b) Sensitivity of agricultural crops to tropospheric ozone: a review of Indian researches. Environ Monit Assess 194:894. 10.1007/s10661-022-10526-6 10.1007/s10661-022-10526-6 [DOI] [PubMed] [Google Scholar]
- Halliwell B, Gutteridge JM (1981) Formation of a thiobarbituric-acid-reactive substance from deoxyribose in the presence of iron salts: the role of superoxide and hydroxyl radicals. FEBS Lett 128:347–352 10.1016/0014-5793(81)80114-7 [DOI] [PubMed] [Google Scholar]
- Hu H, Wang L, Liao C, Fan C, Zhou Q, Huang X (2014) Combined effects of lead and acid rain on photosynthesis in soybean seedlings. Biol Trace Elem Res 161:136–142. 10.1007/s12011-014-0088-3 10.1007/s12011-014-0088-3 [DOI] [PubMed] [Google Scholar]
- Hunt R (1982) Plant growth analysis. University Press, Baltimore [Google Scholar]
- Husen A, Iqbal M, Aref IM (2016) IAA-induced alteration in growth and photosynthesis of pea (Pisum sativum L.) plants grown under salt stress. J Environ Biol 37:421 [Google Scholar]
- Ismail IM, Basahi JM, Hassan IA (2014) Gas exchange and chlorophyll fluorescence of pea (Pisum sativum L.) plants in response to ambient ozone at a rural site in Egypt. Sci Total Environ 497:585–593. 10.1016/j.scitotenv.2014.06.047 10.1016/j.scitotenv.2014.06.047 [DOI] [PubMed] [Google Scholar]
- Ismail LM, Soliman MI, Abd El-Aziz MH, Abdel-Aziz HM (2022) Impact of silica ions and nano silica on growth and productivity of pea plants under salinity stress. Plants 11:494. 10.3390/plants11040494 10.3390/plants11040494 [DOI] [PMC free article] [PubMed] [Google Scholar]
- Ju S, Yin N, Wang L, Zhang C, Wang Y (2017) Effects of silicon on Oryza sativa L. seedling roots under simulated acid rain stress. PloS one 12:e0173378. 10.1371/journal.pone.0187021 10.1371/journal.pone.0187021 [DOI] [PMC free article] [PubMed] [Google Scholar]
- Ju S, Wang L, Chen J (2020) Effects of silicon on the growth, photosynthesis and chloroplast ultrastructure of Oryza sativa L. seedlings under acid rain stress. Silicon 12:655–664. 10.1007/s12633-019-00176-8 10.1007/s12633-019-00176-8 [DOI] [Google Scholar]
- Karataş İ, Öztürk L, Demir Y, Ünlükara A, Kurunç A, Düzdemir O (2014) Alterations in antioxidant enzyme activities and proline content in pea leaves under long-term drought stress. Toxicol Ind Health 30:693–700. 10.1177/0748233712462471 10.1177/0748233712462471 [DOI] [PubMed] [Google Scholar]
- Keller T, Schwager H (1977) Air pollution and ascorbic acid. Eur J Plant Pathol 7:338–350. 10.1111/j.1439-0329.1977.tb00603.x 10.1111/j.1439-0329.1977.tb00603.x [DOI] [Google Scholar]
- Kohno Y, Kobayashi T (1989) Effect of simulated acid rain on the growth of soybean. Water Air Soil Pollut 43:11–19. 10.1007/BF00175579 10.1007/BF00175579 [DOI] [Google Scholar]
- Kumari T, Deka SC (2021) Potential health benefits of garden pea seeds and pods: a review. Legume Science 3:e82. 10.1002/leg3.82 10.1002/leg3.82 [DOI] [Google Scholar]
- Li C, McLinden C, Fioletov V, Krotkov N, Carn S, Joiner J, Streets D, He H, Ren X, Li Z, Dickerson RR (2017) India is overtaking China as the world’s largest emitter of anthropogenic sulfur dioxide. Sci Rep 7:14304. 10.1038/s41598-017-14639-8 10.1038/s41598-017-14639-8 [DOI] [PMC free article] [PubMed] [Google Scholar]
- Li H, Xu Q, Li C, Zhang J, Wang Q, Xiang H, Liu Y, Wei H, Qin Z (2022) Dual role of acid rain and Pyricularia oryzae on growth, photosynthesis and chloroplast ultrastructure in rice seedlings. Agronomy 12:567. 10.3390/agronomy12030567 10.3390/agronomy12030567 [DOI] [Google Scholar]
- Liang C, Ge Y, Su L, Bu J (2015) Response of plasma membrane H+-ATPase in rice (Oryza sativa) seedlings to simulated acid rain. Environ Sci Pollut Res 22:535–545. 10.1007/s11356-014-3389-3 10.1007/s11356-014-3389-3 [DOI] [PubMed] [Google Scholar]
- Liu MH, Yi LT, Yu SQ, Yu F, Yin XM (2015) Chlorophyll fluorescence characteristics and the growth response of Elaeocarpus glabripetalus to simulated acid rain. Photosynthetica 53:23–28. 10.1007/s11099-015-0071-z 10.1007/s11099-015-0071-z [DOI] [Google Scholar]
- Nakano Y, Asada K (1981) Hydrogen peroxide is scavenged by ascorbate-specific peroxidase in spinach chloroplasts. Plant Cell Physiol 22:867–880. 10.1093/oxfordjournals.pcp.a076232 10.1093/oxfordjournals.pcp.a076232 [DOI] [Google Scholar]
- National ambient air quality monitoring programme (NAMP) data, central pollution control board (2021) https://cpcb.nic.in/displaypdf.php?id=bWFudWFsLW1vbml0b3JpbmcvTG9jYXRpb25fZGF0YV8yMDIxLnBkZg. Accessed 23 June 2024
- Neufeld HS, Jernstedt JA, Haines BL (1985) Direct foliar effects of simulated acid rain: I. Damage, growth and gas exchange. New Phytol 99:389–405. 10.1111/j.1469-8137.1985.tb03667.x 10.1111/j.1469-8137.1985.tb03667.x [DOI] [Google Scholar]
- Neves NR, Oliva MA, da Cruz CD, Costa AC, Ribas RF, Pereira EG (2009) Photosynthesis and oxidative stress in the restinga plant species Eugenia uniflora L. exposed to simulated acid rain and iron ore dust deposition: potential use in environmental risk assessment. Sci Total Environ 407:3740–3745. 10.1016/j.scitotenv.2009.02.035 10.1016/j.scitotenv.2009.02.035 [DOI] [PubMed] [Google Scholar]
- Norby RJ, Luxmoore RJ (1983) Growth analysis of soybean exposed to simulated acid rain and gaseous air pollutants. New Phytol 9:277–287. 10.1111/j.1469-8137.1983.tb03494.x 10.1111/j.1469-8137.1983.tb03494.x [DOI] [Google Scholar]
- Odiyi BO, Eniola AO (2015) The Effect of simulated acid rain on plant growth component of Cowpea (Vigna unguiculata) L. Walps Jordan J Biol Sci 8:51–54 10.12816/0026948 [DOI] [Google Scholar]
- Pandey A, Agrawal M, Agrawal SB (2022) Ultraviolet-B induced modifications in growth, physiology, essential oil content and composition of a medicinal herbal plant Psoralea corylifolia. Hortic Environ Biotechnol 63:917–934. 10.1007/s13580-022-00454-2 10.1007/s13580-022-00454-2 [DOI] [Google Scholar]
- Pham HT, Nguyen AT, Do ATN, Hens L (2021) Impacts of simulated acid rain on the growth and the yield of soybean (Glycine max (L.) Merr.) in the mountains of Northern Vietnam. Sustainability 13:4980. 10.3390/su13094980 10.3390/su13094980 [DOI] [Google Scholar]
- Polishchuk OV, Vodka MV, Belyavskaya NA, Khomochkin AP, Zolotareva EK (2016) The effect of acid rain on ultrastructure and functional parameters of photosynthetic apparatus in pea leaves. Cell Tissue Biol 10:250–257. 10.1134/S1990519X16030093 10.1134/S1990519X16030093 [DOI] [PubMed] [Google Scholar]
- Prakash J, Agrawal SB, Agrawal M (2023) Global Trends of Acidity in Rainfall and Its Impact on Plants and Soil. J Soil Sci Plant Nutr 23:398–419. 10.1007/s42729-022-01051-z 10.1007/s42729-022-01051-z [DOI] [PMC free article] [PubMed] [Google Scholar]
- Rajpoot R, Rani A, Srivastava RK, Pandey P, Dubey RS (2016) Terminalia arjuna bark extract alleviates nickel toxicity by suppressing its uptake and modulating antioxidative defence in rice seedlings. Protoplasma 253:1449–1462. 10.1007/s00709-015-0899-x 10.1007/s00709-015-0899-x [DOI] [PubMed] [Google Scholar]
- Ren X, Zhu J, Liu H, Xu X, Liang C (2018) Response of antioxidative system in rice (Oryza sativa) leaves to simulated acid rain stress. Ecotoxicol Environ Saf 148:851–856. 10.1016/j.ecoenv.2017.11.046 10.1016/j.ecoenv.2017.11.046 [DOI] [Google Scholar]
- Sharma M, Sharma VP (2011) Effect of acid rain on the contents of leaves of Solanum melongena. J Plant Dev Sci 3:169–173 [Google Scholar]
- Singh A, Agrawal M (1996) Response of two cultivars of Triticum aestivum L. to simulated acid rain. Environ Pollut 91:161–167. 10.1016/0269-7491(95)00056-9 10.1016/0269-7491(95)00056-9 [DOI] [PubMed] [Google Scholar]
- Singh A, Agrawal M (2007) Acid rain and its ecological consequences. J Environ Biol 29:15 [PubMed] [Google Scholar]
- Singh S, Agrawal SB, Agrawal M (2015) Responses of pea plants to elevated UV-B radiation at varying nutrient levels: N-metabolism, carbohydrate pool, total phenolics and yield. Funct Plant Biol 42:1045–1056. 10.1071/FP15003 10.1071/FP15003 [DOI] [PubMed] [Google Scholar]
- Singh MK, Saikia N, Bhayal L, Bhayal D (2023a) Effect of integrated nutrient management on growth, yield attributes and yield of green pea in humid subtropical climate of Indo-Gangetic Plains. Ann Agric Sci 44:190–196 [Google Scholar]
- Singh P, Singh H, Agrawal SB, Agrawal M (2023b) Assessment of the differential trade-off between growth, subsistence, and productivity of two popular Indian hybrid mango varieties under elevated ozone exposure. Sci Total Environ 889:164275. 10.1016/j.scitotenv.2023.164275 10.1016/j.scitotenv.2023.164275 [DOI] [PubMed] [Google Scholar]
- Sreesaeng J, Kongchiu P, Nakasathien S (2021) Effects of simulated acid rain on morphological traits of Thai rice cultivars. Agric Nat Resour 55:692–702. 10.34044/j.anres.2021.55.4.20 10.34044/j.anres.2021.55.4.20 [DOI] [Google Scholar]
- Sun J, Hu H, Li Y, Wang L, Zhou Q, Huang X (2016) Effects and mechanism of acid rain on plant chloroplast ATP synthase. Environ Sci Pollut Res 23:18296–18306. 10.1007/s11356-016-7016-3 10.1007/s11356-016-7016-3 [DOI] [PubMed] [Google Scholar]
- Vodka MV (2017) Chloroplasts ultrastructural changes as biomarkers of acid rain and heavy metals pollution. Biotechnol Acta 10:57–64. 10.15407/biotech10.03.057 10.15407/biotech10.03.057 [DOI] [Google Scholar]
- Xalxo R, Keshavkant S (2019) Melatonin, glutathione and thiourea attenuates lead and acid rain-induced deleterious responses by regulating gene expression of antioxidants in Trigonella foenum graecum L. Chemosphere 221:1–10. 10.1016/j.chemosphere.2019.01.029 10.1016/j.chemosphere.2019.01.029 [DOI] [PubMed] [Google Scholar]
- Yang XJ, Chen Y, Hu Z, Ma S, Zhang J, Shen H (2021) Alginate oligosaccharides alleviate the damage of rice leaves caused by acid rain and high temperature. Agronomy 11:500. 10.3390/agronomy11030500 10.3390/agronomy11030500 [DOI] [Google Scholar]
- Yendrek CR, Koester RP, Ainsworth EA (2015) A comparative analysis of transcriptomic, biochemical, and physiological responses to elevated ozone identifies species-specific mechanisms of resilience in legume crops. J Exp Bot 66:7101–7112. 10.1093/jxb/erv404 10.1093/jxb/erv404 [DOI] [PMC free article] [PubMed] [Google Scholar]
- Yu JQ, Ye SF, Huang LF (2002) Effects of simulated acid precipitation on photosynthesis, chlorophyll fluorescence, and antioxidative enzymes in Cucumis sativus L. Photosynthetica 40:331–335. 10.1023/A:1022658504882 10.1023/A:1022658504882 [DOI] [Google Scholar]
- Zhang C, Yi X, Gao X, Wang M, Shao C, Lv Z, Chen J, Liu Z, Shen C (2020) Physiological and biochemical responses of tea seedlings (Camellia sinensis) to simulated acid rain conditions. Ecotoxicol Environ Saf 192:110315. 10.1016/j.ecoenv.2020.110315 10.1016/j.ecoenv.2020.110315 [DOI] [PubMed] [Google Scholar]
- Zhang Y, Yu T, Ma W, Dayananda B, Iwasaki K, Li J (2021) Morphological, physiological and photophysiological responses of critically endangered Acer catalpifolium to acid stress. Plants 10:1958. 10.3390/plants10091958 10.3390/plants10091958 [DOI] [PMC free article] [PubMed] [Google Scholar]
- Zhou X, Xu Z, Liu W, Wu Y, Zhao T, Jiang H, Zhang X, Zhang J, Zhou L, Wang Y (2019) Chemical composition of precipitation in Shenzhen, a coastal mega-city in South China: influence of urbanisation and anthropogenic activities on acidity and ionic composition. Sci Total Environ 662:218–226. 10.1016/j.scitotenv.2019.01.096 10.1016/j.scitotenv.2019.01.096 [DOI] [PubMed] [Google Scholar]
Associated Data
This section collects any data citations, data availability statements, or supplementary materials included in this article.
Supplementary Materials
Data Availability Statement
The datasets used and/or analyzed during the current study are available from the corresponding author on reasonable request.