Abstract
Surface-enhanced Raman spectroscopy (SERS) is widely utilized in bacterial analyses, with the dominant SERS peaks attributed to purine metabolites released during sample preparation. Although adenosine triphosphate (ATP) and nucleic acids are potential molecular origins of these metabolites, research on their exact contributions remains limited. This study explored purine metabolite release from E. coli and RNA integrity following various sample preparation methods. Standard water washing generated dominant SERS signals within 10 s, a duration shorter than the anticipated RNA half-lives under starvation. Evaluating RNA integrity indicated that the most abundant ribosomal RNA species remained intact for hours post-washing, whereas messenger RNA and transfer RNA species degraded gradually. This suggests that bacterial SERS signatures observed after the typical washing step could originate from only a small fraction of endogenous purine-containing molecules. In contrast, acid depurination led to degradation of most RNA species, releasing about 40 times more purine derivatives than water washing. Mild heating also instigated the RNA degradation and released more purine derivatives than water washing. Notably, differences were also evident in the dominant SERS signals following these treatments. This work provides insights into SERS-based studies of purine metabolites released by bacteria and future development of methodologies.
Subject terms: Bacteria, Bioanalytical chemistry, Raman spectroscopy
Introduction
Surface-enhanced Raman spectroscopy (SERS) is increasingly employed in bacteriological analysis. The dominant spectral features in bacteria, primarily purine metabolites, are released following the washing process with water or salt solutions during sample preparation1–3. This washing step, originally intended to remove media components from commonly used bacterial culture media such as Tryptic Soy Broth (TSB) and Müller-Hinton Broth (MHB), which are rich in purine derivatives4, inadvertently triggers a starvation response in many bacteria. This response leads to the catabolism of intracellular purine-containing molecules, such as adenosine triphosphate (ATP) and nucleic acids (e.g., RNA species), culminating in the release of small molecule end products1. The ability of SERS to detect these metabolites in a label-free and sensitive manner renders it an invaluable tool for rapid bacterial identification and antimicrobial susceptibility testing2,5–9.
Major purine derivatives released by bacteria and corresponding SERS signatures have been documented1–3. Adenine, hypoxanthine, guanine, and xanthine are among the most abundant purine metabolites released by E. coli and several clinical pathogens, while guanosine, uric acid, and adenosine monophosphate (AMP) are also found or even dominant in some bacteria such as Klebsiella pneumoniae. Nevertheless, although ATP and nucleic acids are potential molecular origins of dominant SERS peaks from bacteria, and their turnover under stress conditions has been well studied10–16, there is limited research linking these molecular origins to the released purine derivatives in SERS-based analyses.
The purine content in ATP and nucleic acids exhibits significant variation16–23, as outlined in Supplementary Table S1. For instance, an E. coli cell in the exponential phase cultured in rich media contains about 1.5 mM of intracellular ATP within a cell volume of approximately 1 μm3 (1 fL)17, equating to around 9 × 10⁵ adenine units. In RNA species, ribosomal RNA (rRNA) often represents over 90% of the total RNA mass24. Such an E. coli cell possesses roughly 50,000 ribosomes, each comprising a 23S, a 16S, and a 5S rRNA, with respective sizes of about 2900, 1540, and 120 nucleotides21,22. This totals approximately 2.28 × 10⁸ nucleobases. Considering the roughly equal presence of A, G, C, and T nucleotides in the E. coli genome23, there are about 5.7 × 10⁷ adenine units in rRNA, a figure 63 times higher than that in ATP.
Our previous study showed that an exponential phase E. coli cell can release approximately 106 purine derivative molecules within 10 min following water washing3. The disintegration of either ATP or mRNA could almost account for this quantity, as indicated in Supplementary Table S1. Additionally, the turnover rates of ATP and RNA species vary markedly. E. coli can deplete its ATP reserves within seconds during starvation10,11, while messenger RNA (mRNA) and transfer RNA (tRNA) require at least several minutes to degrade, and rRNA is generally more stable12–16.
Consequently, we hypothesize that the dominant SERS peaks observed after the typical washing step, lasting a few to tens of minutes, could be attributed to the breakdown of only a small fraction of purine-containing molecules. Simultaneously, if most intracellular purine units are released, bacteria could produce much stronger SERS signals than those observed after water washing.
This study aims to explore the molecular origins of purine metabolites released from bacteria in SERS-based analyses with the impact of different sample preparation strategies on RNA integrity and SERS signatures. Investigating the time-dependent release of metabolites and RNA integrity after water washing and other stress conditions might offer insights into our hypotheses. However, examining the effects of specific stressors presents challenges. The washing step, routinely implemented before SERS measurement, postpones the immediate observation of changes in SERS signatures following treatment.
To address these challenges, we employed a chemically defined medium devoid of purine derivatives. We investigated the release of purine metabolites and RNA integrity after water washing, acid depurination, and exposure to elevated temperatures. Our results disclosed the rapid response of E. coli to water washing, and variations in RNA degradation and SERS signal alterations under different sample preparation conditions.
Materials and methods
Bacteria strains
Escherichia coli BL21(DE3) was purchased from Yeastern Biotech (New Taipei City, Taiwan). Staphylococcus sp. (ATCC 155) and Pseudomonas aeruginosa MOB193 were purchased from Bioresource Collection and Research Centre (Hsinchu City, Taiwan). Mycobacterium tuberculosis H37Rv was provided by Far Eastern Memorial Hospital (New Taipei City, Taiwan).
Bacterial cultures
E. coli was cultured with MHB, M9 minimal medium, or modified M9 (m-M9). m-M9 was modified from M9 by replacing NaCl and NH4Cl with 6 g/L of sucrose and 1 g/L of (NH4)2SO4, respectively. Sucrose, which E. coli BL21(DE3) cannot utilize as a carbon source, was used as an osmotic agent. In M9 or m-M9, glucose, MgSO4·7H2O, CaCl2, and FeSO4·7H2O were supplied at 4 g/L, 1 mM, 0.1 mM, and 0.01 mM, respectively. Staphylococcus and Pseudomonas were cultured with MHB. Mycobacterium was cultured in Middlebrook 7H9 with OADC Enrichment. Bacterial concentration was determined by optical density measurement at 600 nm (OD600) with a spectrophotometer. For experiments, bacteria were inoculated from the –80℃ glycerol stock and cultured at 37℃ with shaking overnight, then subcultured to log phase (OD600 ~ 0.5–0.6); except for M. tuberculosis, which was directly cultured for 4–5 days due to its slow growth rate.
SERS-active substrates
The fabrication of Ag/AAO SERS-active substrates was carried out as described in our previous study7,25. Briefly, silver nanoparticles were grown into the nanochannel arrays, etched on an anodized aluminum film coated on glass slides, through electrochemical plating. The pore diameter and inter-channel gap of AAO nanochannels were adjusted to around 50 nm and 10 nm, respectively. Substrates were cleaned by rinsing with double-distilled water (ddH2O), vacuum-sealed in plastic bags, and used immediately after the bag was unsealed. Quality control was conducted right before use by measuring the 10−4 M adenine solution, dripped near four corners of the effective area.
SERS measurements
Each SERS substrate, with an effective area of around 26 × 56 mm, could measure 40–50 samples. One microliter of sample was dripped onto the SERS substrate, covered with a low fluorescence optical glass, and measured using a Horiba LabRAM HR800 Raman microscope equipped with a HeNe laser emitting at 633 nm and a 20 × objective lens. The incident laser power was about 0.66 mW. Calibration was performed using the 520 cm−1 band of a silicon wafer, achieving spectral accuracy and precision of < 7 and 0.1 cm−1, respectively. Each SERS spectrum was obtained by averaging eight measurements from different positions within the sample. Each position was scanned once with a 1 s exposure time and detected with a liquid nitrogen-cooled charge-coupled device. Spectra that occasionally exhibited atypical patterns were removed. The remaining spectra were processed using a custom-made baseline removal program based on a sensitive nonlinear iterative peak clipping algorithm26, and then averaged to obtain the mean spectrum. In this study, SERS spectra were exclusively obtained from bacterium-free supernatants to eliminate the possibility of bacteria continually releasing metabolites post-sample collection. These supernatants displayed SERS signatures comparable to the bacteria-containing suspensions, particularly in terms of major peak positions and intensities, as determined by the maximum peak height (Supplementary Fig. S1).
Effects of water washing
The sample was centrifuged at 12,000 × g for 3 min and 90% of the supernatant was replaced with an equal volume of ddH2O. This supernatant was preserved for SERS measurement when necessary. The washing step was repeated twice. Then, the bacterial suspension was incubated at 37℃ for 30 min, unless otherwise specified. Finally, the sample was centrifuged again and the supernatant was collected for SERS measurement. To eliminate any potential infectious agents, the collected Mycobacterium supernatants were further heat-treated at 95 °C for 20 min before SERS analysis. For the time-dependent release of metabolites after washing, 1 mL of E. coli, cultured with m-M9 with glucose, was centrifuged at 12,000 × g for 3 min and all supernatant was discarded. The pellet was resuspended in 1 mL of ddH2O by pipetting. At each time point, a 100 μL aliquot of bacterial suspension was filtered with a 0.2 μm syringe filter. The filtrate was collected for SERS measurement.
Analysis of RNA integrity
RNA was extracted using the RNA snap ™ method27. Briefly, 400 μL of culture was centrifuged at 12,000 × g for 2 min and 370 μL of supernatant was discarded. The pellet was resuspended with 90 μL of RNA extraction buffer (containing 95% formamide, 1% 2-mercaptoethanol, 18 mM ethylenediaminetetraacetic acid at pH 8, and 0.025% sodium dodecyl sulfate). The mixture was incubated at 95℃ for 7 min, cooled on ice, and centrifuged at 12,000 × g for 5 min. The supernatant was collected and analyzed with 1% agarose gel. RNA concentration was determined using the NanoDrop 1000 spectrophotometer.
RNA purification and semi-quantitative PCR
RNA was purified using the Presto™ Mini RNA Bacteria Kit (Geneaid, New Taipei City, Taiwan), with in column DNase I digestion to reduce DNA contamination. RNA quality and quantity were examined by agarose gel electrophoresis and the NanoDrop 1000. Approximately 2 μg of each RNA sample was reverse-transcribed to cDNA using the RevertAid First Strand cDNA Synthesis Kit (Thermo Fisher Scientific, MA, USA) in a 20 μL reaction. A control setup without reverse transcriptase was also performed to evaluate residual DNA. Quantitative PCR was conducted using the StepOne Real-Time PCR System and the QuantiFast SYBR Green PCR master mix (Qiagen, Hilden, Germany). Each 15 μL reaction volume contained 0.3 μL of the reverse-transcribed product and was loaded in triplicate into 96-well plates. Thermocycling conditions were: 95℃ for 5 min, followed by 35 cycles of 95℃ for 10 s and 60℃ for 30 s. The relative abundances of target mRNAs (gapA and rpsS) and tRNA (ileV) in each sample were calculated using its 16S rRNA (rrsA) as the reference, with the values from residual DNA subtracted. Primers are listed in Supplementary Table S2.
Acid depurination
To test conditions, 400 μL aliquots of E. coli cultured with m-M9 with glucose were transferred into screw-capped polypropylene tubes. HCl from a 2 M stock solution was added to achieve the desired concentrations and mixed by vortexing. Samples were heated in a water bath at 95℃ for 30 or 60 min, followed by cooling to room temperature. After a brief centrifugation, an equal volume of 2 M NaOH stock solution was added to neutralize to around pH 7. To evaluate its effect in comparison with water washing, 1 mL aliquots of the culture were treated with either water washing or 0.3 M HCl at 95℃, followed by cooling and neutralization. ddH2O was added as necessary to maintain equal final volumes for comparison. The samples were then centrifuged at 12,000 × g for 3 min and the supernatants were collected for SERS measurements.
Effects of elevated temperature
Each 1 mL aliquot of E. coli cultured with m-M9 with glucose was placed in pre-heated water baths at desired temperatures for 10 min. The samples were then centrifuged at 12,000 × g for 3 min and the supernatants were collected for SERS measurements.
Results and discussion
Faster-growing bacteria released more purine metabolites than slower-growing ones
Most purine moieties in E. coli are predominantly found in several key molecules, particularly RNA species (Supplementary Table S1). In bacteria, the intracellular levels of ATP and RNA species generally exhibit a positive correlation with their growth rates10,21. This suggests that bacteria might release more purine metabolites if ATP and RNA species are indeed the primary molecular sources of dominant SERS peaks.
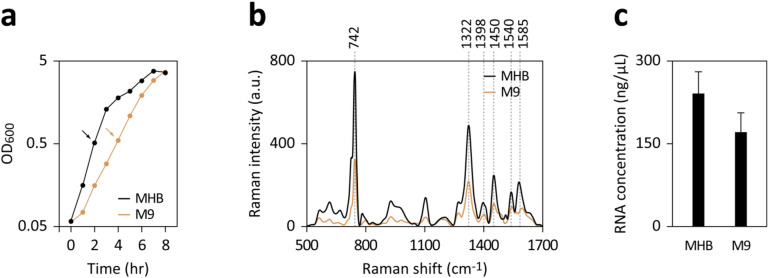
To investigate this hypothesis, we cultured E. coli in either a nutrient-rich medium (MHB) or a minimal medium (M9 with glucose). The observed doubling times during the exponential phase were approximately 25–30 min in MHB and 50–60 min in M9, respectively (Fig. 1a). Upon harvesting an equal volume of both cultures at OD600 ~ 0.5, followed by washing and soaking in double-distilled water (ddH2O), we found that cells cultured in MHB released significantly more purine metabolites in SERS-based analyses compared to those cultured in M9 with glucose (Fig. 1b). Additionally, RNA extraction revealed that MHB-cultured cells had about 1.4 times higher RNA content than those cultured in M9 with glucose (Fig. 1c).
Figure 1.
Influence of growth rate on SERS signals and RNA content in E. coli. (a) Growth curves of E. coli cultivated in either MHB or M9 with glucose. Samples collected at OD600 ~ 0.5 (marked by arrows) underwent washing for SERS measurements (b) and RNA extraction (c). (b) The bacteria were washed, immersed in ddH2O, and incubated at 37℃ for 30 min. SERS spectra were obtained from supernatants post-centrifugation to remove bacteria. (c) Rapid RNA extraction from 400 μL of each culture was performed using the RNA snap ™ method; the extracted RNA was resuspended in 120 μL and quantified using a NanoDrop spectrophotometer. The data represent the mean ± SD of three experiments.
These findings corroborate the hypothesis that faster-growing bacteria with higher RNA concentrations can release greater quantities of purine metabolites following water washing compared to their slower-growing counterparts with lesser RNA. However, given the significant variation in purine content across ATP and different RNA species, the specific contributions of these species to SERS signals warrant further investigation.
SERS detection of purine derivatives in the m-M9 medium
Given the distinct turnover rates of ATP and RNA species, analyzing the time-dependent changes in SERS signatures post-washing could elucidate the origins of purine metabolites. To circumvent the potential side effects of multiple washing cycles before SERS measurement, we utilized a chemically defined medium devoid of purine derivatives, m-M9. This medium, a modification of the M9 minimal medium, was optimized by replacing two main chlorine-containing components to reduce its suppression of SERS detection sensitivity, particularly for hypoxanthine (Supplementary Fig. S2). The suppression is likely due to chloride ions competing with analytes for adsorption on the silver substrate.
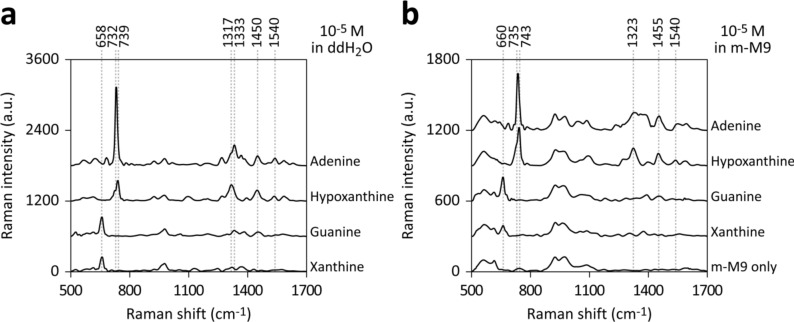
We validated the capability of detecting purine derivatives in m-M9 by measuring SERS spectra of 10−5 M solutions of adenine, hypoxanthine, guanine, or xanthine, prepared either in ddH2O or m-M9. In ddH2O (Fig. 2a), adenine displayed characteristic dominant peaks at 732 and 1333 cm−1, while hypoxanthine exhibited peaks at 739 and 1317 cm−1. Guanine and xanthine both showed dominant peaks at 658 cm−1. The assignments of these major purine derivative bands have been well documented in the literature1,28–32. Signals at around 925 and 970 cm−1, possibly originating from AgSO2, Ag2SO3, and Ag2SO4 formed on the Ag/AAO SERS substrate during fabrication (Supplementary Fig. S3), were excluded from the analysis33–35.
Figure 2.
SERS detection of purine derivatives in m-M9 medium. The SERS spectra of purine derivatives (10–5 M) in ddH2O (a) and m-M9 (b). Key peaks corresponding to various purine derivatives are enumerated.
In the m-M9 medium, components produced broad spectra in the ranges of 520–630 and 890–1140 cm−1, obscuring the signals of purine derivatives (Fig. 2b). Adenine and hypoxanthine in m-M9 showed additional dominant peaks at 735 and 743 cm−1, respectively, shifting by 3–4 cm−1 compared to their aqueous solutions. Another hypoxanthine's peak also shifted from 1317 to 1323 cm−1, and adenine's 1333 cm−1 peak in aqueous solution became a broad spectrum in m-M9. The dominant peaks of guanine and xanthine shifted slightly from 658 to 660 cm−1 (Fig. 2b).
Thus, these results confirm that SERS can detect several major peaks of E. coli purine metabolites in situ in the m-M9 medium. The observed peak shifts between preparations in ddH2O and m-M9 could be attributed to interactions with m-M9 medium components. It is also important to note that other factors, such as analyte concentration and environmental pH, are known to influence peak positions36,37.
Time-dependent release of purine derivatives and RNA integrity after washing
To assess the rapidity of E. coli’s response to water washing, we pelleted cells cultured in m-M9 with glucose, resuspended them in ddH2O, and obtained bacterium-free supernatants using 0.2 μm syringe filters to minimize operational time. Although omitting multiple washing steps in sample preparation raised concerns about residual medium influence, especially at initial time points, this method allowed sample harvesting within 10 s post-ddH2O addition.
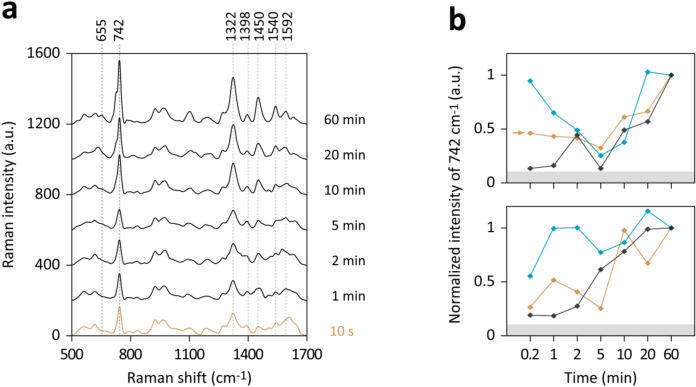
Figure 3a reveals that major peaks, characteristic of hypoxanthine at 742 and 1322 cm−1, along with minor peaks associated with other purine derivatives, were present immediately at the first sampling point (i.e., 10 s). These signals were notably above background levels in five out of six independent experiments, as measured against controls of ddH2O or m-M9 (Fig. 3b). Intriguingly, several tests showed a transient decrease in the intensity of the 742 cm−1 peak between 2 and 5 min, followed by a resurgence to higher signal intensities (Fig. 3b). Additionally, a shoulder peak at approximately 733 cm−1 appeared at 60 min, potentially indicative of increased release of hypoxanthine and/or adenine (Fig. 3a).
Figure 3.
Temporal dynamics of purine derivative release in starved E. coli. (a) SERS spectra derived from E. coli cultured in m-M9 with glucose, subsequently centrifuged and resuspended in ddH2O. Samples from the cell suspensions were taken at the specified time intervals, filtered using 0.2 μm syringe filters to eliminate bacteria, and the filtrates were analyzed to obtain spectra. (b) The peak intensities at 742 cm–1 from six experiments are illustrated. To normalize for variations in sensitivity among SERS substrates, intensities in each experiment were adjusted by setting the intensity at the 60-min mark to 1. The gray shaded areas approximately below 40 a.u. denote the background intensities at 742 cm–1, ascertained using ddH2O or m-M9. The spectra corresponding to the experiment marked by an arrow are displayed in (a).
Considering these observations and the known rapid turnover rate of E. coli’s ATP under starvation conditions10,11, the immediate signals post-water washing could be attributed to swift ATP degradation. E. coli has been reported to uptake extracellular purine derivatives within the first few minutes of starvation38, which could transiently diminish extracellular SERS signatures. However, it is hypothesized that the immediately released metabolites from ATP degradation might be eliminated in the 2–3 washing cycles typically employed in SERS analysis of bacteria. Consequently, the primary molecular sources are likely attributed to the subsequent degradation of RNA, which gradually amplified the SERS signal intensities following bacterial soaking in ddH2O.
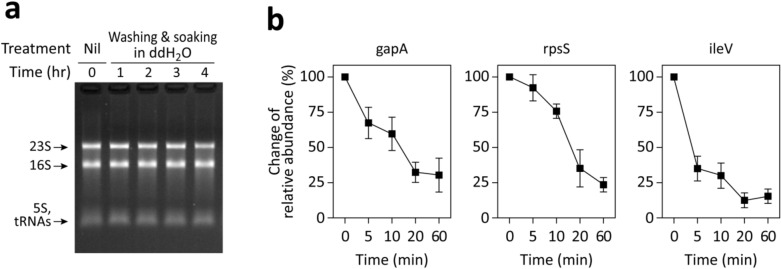
To investigate RNA species degradation post-soaking in ddH2O, we rapidly extracted total RNA using the RNA snap ™ method and analyzed it through electrophoresis. As depicted in Fig. 4a, major rRNA bands (23S and 16S rRNAs in E. coli) remained largely intact for several hours post-washing, exceeding the typical 10–20 min washing duration in SERS-based bacterial analysis.
Figure 4.
RNA degradation in starved E. coli. (a) E. coli was washed, soaked in ddH2O at 37℃, and RNA was extracted at the specified time points using the RNA snap ™ method for electrophoresis analysis. Notable bands, likely representing 23S, 16S, 5S rRNA, and tRNAs, are identified. (b) Alterations in the relative abundances of two mRNAs (gapA and rpsS) and one tRNA (ileV) following washing and soaking in ddH2O are presented. At designated times, total RNA was purified, converted to cDNA via reverse transcription. The relative cDNA abundance of each target compared to the 16S rRNA was quantified using semi-quantitative PCR. The data depict changes in relative abundances, with the baseline (t = 0 min) set to 100%. The data represent the mean ± SD of three experiments.
Furthermore, the degradation of mRNA and tRNA was examined via semi-quantitative PCR, using 16S rRNA as a reference (Fig. 4b). Within 20 min post-washing, representative mRNAs (gapA and rpsS) degraded to approximately 25–35%, while a representative tRNA (ileV) degraded to about 15%. Notably, the half-lives of various mRNA and tRNA species vary, with most ranging from a few to tens of minutes12. The selected mRNAs, gapA and rpsS, represent some of E. coli’s most abundant mRNAs during the log phase and have half-lives near the average, around 5.5 min12.
These results suggest that ATP degradation occurs rapidly post-water washing, followed by mRNA and tRNA degradation. Such degradation is likely to transpire during the bacterial preparation for SERS analysis, typically lasting from a few to tens of minutes, depending on the protocol. The purine content in ATP, mRNA, and tRNA is estimated at around 106–107 molecules per cell (Supplementary Table S1), corresponding with the level of released purine derivatives observed in our previous study3. Conversely, rRNA species, which harbor the highest intracellular purine content, generally remain intact post-water washing. If rRNA were to degrade and be released, bacteria could potentially yield considerably more intense SERS signals.
RNA degradation by acid depurination enhanced SERS signal intensities
Purine metabolites released after water washing are thought to arise from enzymatic reactions. However, nucleic acids can also release nucleobases through non-enzymatic reactions, such as acid depurination, which involves breaking glycosidic bonds under specific conditions like heating in acidic environments39,40.
To induce acid depurination, we added HCl to the E. coli culture to achieve final concentrations ranging from 0.1 to 0.3 M and incubated at 95℃. The sample was then cooled to room temperature and neutralized to approximately pH 7 using NaOH to prevent the strong acid from degrading the SERS substrate's performance and causing peak position shifts. Considering E. coli’s mesophilic nature and non-acidophilic characteristics, these conditions are likely detrimental to most cellular proteins, indicating that purine derivatives released under these conditions are probably not products of active purine metabolism.
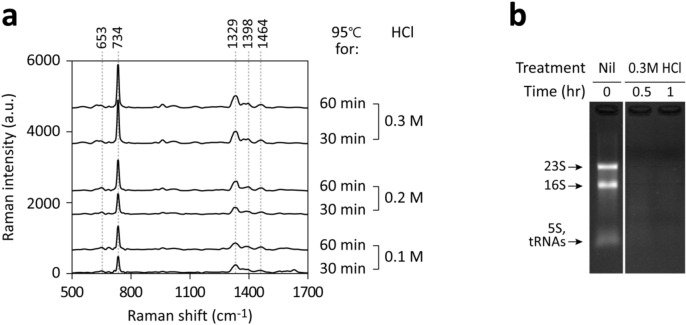
SERS analysis of the bacterium-free supernatants revealed that heating in 0.3 M HCl for 30–60 min produced the highest signal intensities (Fig. 5a), surpassing those observed following water washing. Dominant peaks at 734 and 1329 cm−1 suggested the release of adenine as a result of acid depurination. Rapid RNA extraction and electrophoresis further confirmed the near-complete absence of intact rRNA bands post-acid depurination (Fig. 5b).
Figure 5.
Effects of extreme heating in strong acid on purine derivative signals and RNA degradation in E. coli. (a) E. coli cultured in m-M9 with glucose was treated with 0.1–0.3 M HCl at 95℃ for either 30 or 60 min, cooled, and neutralized. Samples were adjusted to the same final volumes, centrifuged to remove bacteria, and analyzed by SERS. (b) RNA was extracted pre- or post-treatments using the RNA snap ™ method for electrophoresis analysis. Major bands, likely representing 23S, 16S, 5S rRNA, and tRNAs, are indicated. The HCl-treated samples were analyzed on the same gel shown in Fig. 4a; the control image used was identical.
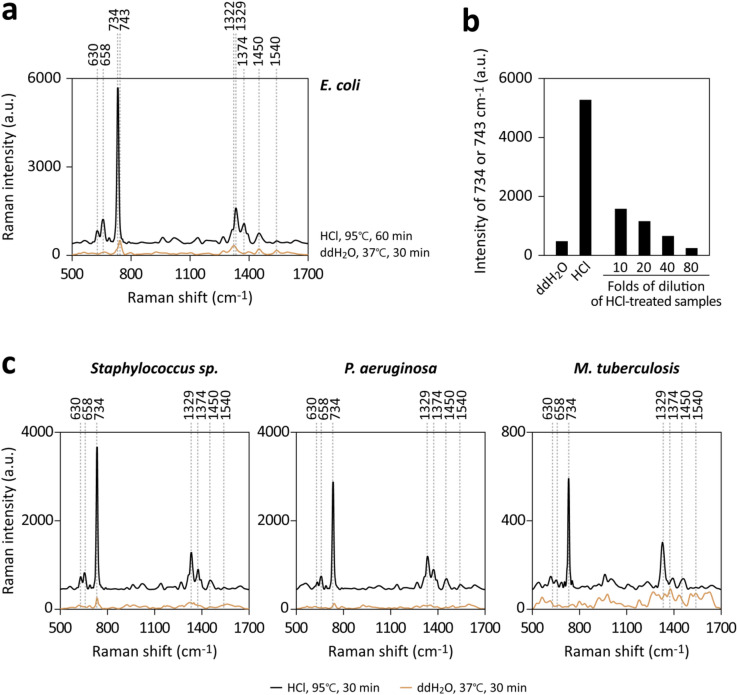
To better understand the relationship between SERS signal intensity and the concentration of analytes, we quantified the relative amount of released purine derivatives by measuring signals from HCl-treated samples after various dilutions with water. Figures 6a and b show that the intensity of the HCl-treated sample, after approximately a 40-fold dilution, was comparable to that of bacteria soaked in ddH2O. This suggests that acid treatment led to the release of about 40 times more purine derivatives compared to water washing. The enhancement in signal intensity was not due to the presence of HCl in the sample. This is because the acidity was neutralized by NaOH prior to the SERS measurements, and the presence of chloride ions could potentially reduce, rather than amplify, the signal intensities of purine derivatives in our system.
Figure 6.
Substantial increase in purine derivative release following intense heating of bacteria in strong acid. (a) E. coli cultured in m-M9 with glucose underwent either washing and soaking in ddH2O or treatment with 0.3 M HCl at 95℃, followed by cooling and neutralization. The samples were normalized to the same final volumes, centrifuged to exclude bacteria, and analyzed using SERS. (b) Peak intensities at 734 or 743 cm–1, including those from the HCl-treated sample after various dilutions before measurements. (c) Staphylococcus sp., P. aeruginosa, or M. tuberculosis were subjected to similar treatments as in (a) for SERS analysis.
Acid depurination was also applied to other bacterial species, including Staphylococcus sp., Pseudomonas aeruginosa, and Mycobacterium tuberculosis. These latter two species typically exhibit low signal intensities following water washing. As demonstrated in Fig. 6c, acid depurination consistently produced higher SERS signals compared to water washing across all tested species. Therefore, we infer that only a minor fraction of intracellular purine-containing molecules undergo degradation and release after water washing. In contrast, a sample preparation approach that includes rRNA degradation could significantly amplify SERS signal intensities.
Release of purine derivatives after mild heating
This finding spurred the hypothesis that other treatments that trigger RNA degradation and leave the purine degradation machinery intact might also induce the release of purine metabolites. The employment of a chemically defined medium facilitated the monitoring of purine metabolite release from E. coli in response to various stressors, such as temperature changes.
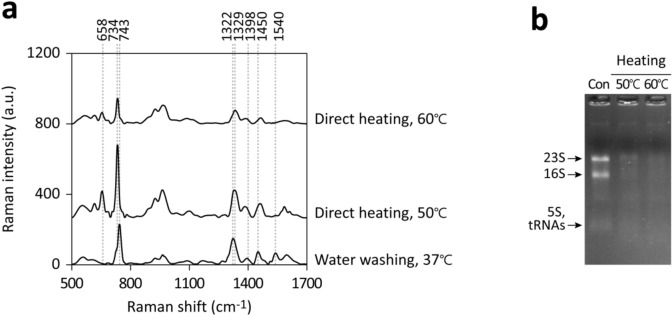
When the temperature for E. coli cultured in m-M9 with glucose was raised from 37℃ to 50℃, slightly above its optimal growth range, a marked increase in SERS signal intensities at 658, 734, and 1329 cm−1 was observed in the culture supernatant within 10 min (Fig. 7a). Such mild heating in salt solutions can facilitate rRNA degradation (Fig. 7b). The distinct dominant peak at 743 cm−1 observed post-water washing, as opposed to the major 733–734 cm−1 peak induced by mild heating (Fig. 7a), suggests that different metabolic pathways or mechanisms are activated under varying conditions. However, peak intensities diminished when cells were subjected to 60 °C, although rRNA degradation was still extensive (Fig. 7a and b). This suggests that at higher temperatures, enzymes in the purine metabolic pathway might become thermolabile and stop producing small-molecule end products.
Figure 7.
Enhanced rRNA degradation and purine metabolite release from bacteria due to mild heating in salt solutions. (a) E. coli, cultured in m-M9 with glucose, was either directly heated at 50 or 60℃ for 10 min or washed and incubated in ddH2O at 37℃ for 10 min. SERS spectra were obtained from the solutions post-centrifugation to eliminate bacteria. (b) RNA was extracted from samples before and after heating using the RNA snap ™ method for electrophoresis analysis. Significant bands, likely representing 23S, 16S, 5S rRNA, and tRNAs, are indicated.
While many RNases remain active even after cellular damage, enzymes involved in subsequent purine degradation pathways might be differentially sensitive to environmental factors such as salt conditions, temperature, and pH. This could lead to a shift in metabolic pathway selection, potentially affecting the efficient production or release of small molecule end products. Therefore, rRNA degradation in damaged cells may not directly correlate with the observed SERS signatures. It is also crucial to recognize that these responses can significantly vary across different bacterial species due to genetic diversity. This highlights the complexity and variability in bacterial responses to environmental stressors and the consequent impact on purine metabolism and SERS signal profiles.
Conclusions
Our study investigated the effects of various treatments on the release of purine metabolites from E. coli in a chemically defined medium lacking purine derivatives. The rapid release of purine metabolites into the culture supernatant within 10 s following water washing suggests that ATP, with its high turnover rate, could be a significant contributor to these releases. In typical SERS-based analyses, the degradation of a portion of mRNA and tRNA from a few to several minutes after water washing is likely the primary molecular source of purine metabolites. Intriguingly, rRNA species, which harbor the highest intracellular purine content, generally remain intact post-water washing.
However, alternative methods like heating at 50 °C under specific salt conditions or even 95 °C with HCl can induce rRNA degradation and generate stronger SERS signals compared to water washing. These strategies would be useful when examining those bacterial species that exhibit low signal intensities following water washing, such as Pseudomonas aeruginosa or Mycobacterium tuberculosis. By carefully considering factors like washing solutions, temperature, and pH during sample preparation, researchers can influence the degradation of different purine-containing molecules, thereby enhancing SERS signal intensities and detection sensitivity. However, these modifications may also impact the activity and/or selection of purine metabolic pathways, leading to distinct spectral fingerprints.
Environmental changes elicit numerous stress responses regulated by the sigma factor RpoS and the signal molecule (p)ppGpp41–43. Although the transcription regulator RpoS requires time to activate stress response genes, (p)ppGpp accumulates within minutes under stress conditions, making its role in purine metabolite release a subject worthy of further investigation. Moreover, while several specific purine derivative importers have been identified in bacteria, such as AdeP and AdeQ, for importing adenine in E. coli, purine exporters like PbuE in Bacillus species are less commonly reported44,45. Investigating whether any purine exporter contributes to the rapid release of purine metabolites is thus warranted.
Supplementary Information
Acknowledgements
The authors thank Dr. Ruwen Jou and the Mycobacterium lab in Taiwan Centers for Disease Control for their guidance in Mycobacterium experiments. This work was supported by National Science and Technology Council and the Ministry of Education, Higher Education SPROUT Project for Cancer Progression Research Center (111W31101) and Cancer and Immunology Research Center (112W31101). Grand numbers: MOST 110-2639-M-001-001-ASP, MOST 111-2740-B-A49-001, NSTC 111-2123-M-001-005, NSTC 111-2634-F-A49-014, and NSTC 112-2740-B-A49-001.
Author contributions
J-Y.C., Y-L.W., and C-H.L. conceived and designed the experiments. Y-C.G., C-C.C., Y-J.N., H-W.C., and S.C. performed the experiments. H-M.T. prepared the SERS substrates. C-L.C., F-Y.C., and H-F.T. discussed and performed the Mycobacterium experiments. J-Y.C. analyzed the data and wrote the manuscript. Y-L.W. revised the manuscript.
Data availability
All data generated during this study are included in the article and its supplementary files or are available from the corresponding author on reasonable request.
Competing interests
The authors declare no competing interests.
Footnotes
Publisher's note
Springer Nature remains neutral with regard to jurisdictional claims in published maps and institutional affiliations.
Supplementary Information
The online version contains supplementary material available at 10.1038/s41598-024-70274-0.
References
- 1.Premasiri, W. R. et al. The biochemical origins of the surface-enhanced Raman spectra of bacteria: A metabolomics profiling by SERS. Anal. Bioanal. Chem.408, 4631–4647. 10.1007/s00216-016-9540-x (2016). 10.1007/s00216-016-9540-x [DOI] [PMC free article] [PubMed] [Google Scholar]
- 2.Premasiri, W. R. et al. Rapid urinary tract infection diagnostics by surface-enhanced Raman spectroscopy (SERS): Identification and antibiotic susceptibilities. Anal. Bioanal. Chem.409, 3043–3054. 10.1007/s00216-017-0244-7 (2017). 10.1007/s00216-017-0244-7 [DOI] [PubMed] [Google Scholar]
- 3.Chiu, S. W. et al. Quantification of biomolecules responsible for biomarkers in the surface-enhanced Raman spectra of bacteria using liquid chromatography-mass spectrometry. Phys. Chem. Chem. Phys.20, 8032–8041. 10.1039/C7CP07103E (2018). 10.1039/C7CP07103E [DOI] [PubMed] [Google Scholar]
- 4.Premasiri, W. R., Gebregziabher, Y. & Ziegler, L. D. On the difference between surface-enhanced Raman scattering (SERS) spectra of cell growth media and whole bacterial cells. Appl. Spectrosc.65, 493–499. 10.1366/10-06173 (2011). 10.1366/10-06173 [DOI] [PMC free article] [PubMed] [Google Scholar]
- 5.Ho, C.-S. et al. Rapid identification of pathogenic bacteria using Raman spectroscopy and deep learning. Nat. Commun.10, 4927. 10.1038/s41467-019-12898-9 (2019). 10.1038/s41467-019-12898-9 [DOI] [PMC free article] [PubMed] [Google Scholar]
- 6.Cheng, W.-C. et al. Sensible functional linear discriminant analysis effectively discriminates enhanced Raman spectra of Mycobacterium species. Anal. Chem.93, 2785–2792. 10.1021/acs.analchem.0c03681 (2021). 10.1021/acs.analchem.0c03681 [DOI] [PubMed] [Google Scholar]
- 7.Liu, C.-Y. et al. Rapid bacterial antibiotic susceptibility test based on simple surface-enhanced Raman spectroscopic biomarkers. Sci. Rep.6, 23375. 10.1038/srep23375 (2016). 10.1038/srep23375 [DOI] [PMC free article] [PubMed] [Google Scholar]
- 8.Han, Y.-Y. et al. Rapid antibiotic susceptibility testing of bacteria from patients’ blood via assaying bacterial metabolic response with surface-enhanced Raman spectroscopy. Sci. Rep.10, 12538. 10.1038/s41598-020-68855-w (2020). 10.1038/s41598-020-68855-w [DOI] [PMC free article] [PubMed] [Google Scholar]
- 9.Samek, O., Bernatová, S. & Dohnal, F. The potential of SERS as an AST methodology in clinical settings. Nanophotonics.10, 2537–2561. 10.1515/nanoph-2021-0095 (2021). 10.1515/nanoph-2021-0095 [DOI] [Google Scholar]
- 10.Link, H., Fuhrer, T., Gerosa, L., Zamboni, N. & Sauer, U. Real-time metabolome profiling of the metabolic switch between starvation and growth. Nat. Methods.12, 1091–1097. 10.1038/nmeth.3584 (2015). 10.1038/nmeth.3584 [DOI] [PubMed] [Google Scholar]
- 11.Deng, Y., Beahm, D. R., Ionov, S. & Sarpeshkar, R. Measuring and modeling energy and power consumption in living microbial cells with a synthetic ATP reporter. BMC Biol.19, 101. 10.1186/s12915-021-01023-2 (2021). 10.1186/s12915-021-01023-2 [DOI] [PMC free article] [PubMed] [Google Scholar]
- 12.Bernstein, J. A., Khodursky, A. B., Lin, P.-H., Lin-Chao, S. & Cohen, S. N. Global analysis of mRNA decay and abundance in Escherichia coli at single-gene resolution using two-color fluorescent DNA microarrays. Proc. Natl. Acad. Sci. USA99, 9697–9702. 10.1073/pnas.112318199 (2002). 10.1073/pnas.112318199 [DOI] [PMC free article] [PubMed] [Google Scholar]
- 13.Fessler, M., Gummesson, B., Charbon, G., Svenningsen, S. L. & Sørensen, M. A. Short-term kinetics of rRNA degradation in Escherichia coli upon starvation for carbon, amino acid or phosphate. Mol. Microbiol.113, 951–963. 10.1111/mmi.14462 (2020). 10.1111/mmi.14462 [DOI] [PubMed] [Google Scholar]
- 14.Sørensen, M. A., Fehler, A. O. & Svenningsen, S. L. Transfer RNA instability as a stress response in Escherichia coli: rapid dynamics of the tRNA pool as a function of demand. RNA Biol.15, 586–593. 10.1080/15476286.2017.1391440 (2018). 10.1080/15476286.2017.1391440 [DOI] [PMC free article] [PubMed] [Google Scholar]
- 15.Prossliner, T., Agrawal, S., Heidemann, D. F., Sørensen, M. A. & Svenningsen, S. L. tRNAs are stable after all: Pitfalls in quantification of tRNA from starved Escherichia coli cultures exposed by validation of RNA purification methods. mBio.14, e0280522 (2023). 10.1128/mbio.02805-22 [DOI] [PMC free article] [PubMed] [Google Scholar]
- 16.Moran, M. A. et al. Sizing up metatranscriptomics. ISME J.7, 237–243. 10.1038/ismej.2012.94 (2013). 10.1038/ismej.2012.94 [DOI] [PMC free article] [PubMed] [Google Scholar]
- 17.Yaginuma, H. et al. Diversity in ATP concentrations in a single bacterial cell population revealed by quantitative single-cell imaging. Sci. Rep.4, 6522. 10.1038/srep06522 (2014). 10.1038/srep06522 [DOI] [PMC free article] [PubMed] [Google Scholar]
- 18.Bartholomäus, A. et al. Bacteria differently regulate mRNA abundance to specifically respond to various stresses. Philos. Trans. R. Soc. A.374, 20150069. 10.1098/rsta.2015.0069 (2016). 10.1098/rsta.2015.0069 [DOI] [PubMed] [Google Scholar]
- 19.Dong, H., Nilsson, L. & Kurland, C. G. Co-variation of tRNA abundance and codon usage in Escherichia coli at different growth rates. J. Mol. Biol.260, 649–663. 10.1006/jmbi.1996.0428 (1996). 10.1006/jmbi.1996.0428 [DOI] [PubMed] [Google Scholar]
- 20.Mackie, G. A. RNase E: At the interface of bacterial RNA processing and decay. Nat. Rev. Microbiol.11, 45–57. 10.1038/nrmicro2930 (2013). 10.1038/nrmicro2930 [DOI] [PubMed] [Google Scholar]
- 21.Failmezger, J., Ludwig, J., Nieß, A. & Siemann-Herzberg, M. Quantifying ribosome dynamics in Escherichia coli using fluorescence. FEMS Microbiol. Lett.364, fnx055. 10.1093/femsle/fnx055 (2017). 10.1093/femsle/fnx055 [DOI] [PubMed] [Google Scholar]
- 22.Bakshi, S., Siryaporn, A., Goulian, M. & Weisshaar, J. C. Superresolution imaging of ribosomes and RNA polymerase in live Escherichia coli cells. Mol. Microbiol.85, 21–38. 10.1111/j.1365-2958.2012.08081.x (2012). 10.1111/j.1365-2958.2012.08081.x [DOI] [PMC free article] [PubMed] [Google Scholar]
- 23.Blattner, F. R. et al. The complete genome sequence of Escherichia coli K-12. Science.277, 1453–1462. 10.1126/science.277.5331.1453 (1997). 10.1126/science.277.5331.1453 [DOI] [PubMed] [Google Scholar]
- 24.Giannoukos, G. et al. Efficient and robust RNA-seq process for cultured bacteria and complex community transcriptomes. Genome Biol.13, R23. 10.1186/gb-2012-13-3-r23 (2012). 10.1186/gb-2012-13-3-r23 [DOI] [PMC free article] [PubMed] [Google Scholar]
- 25.Wang, H.-H. et al. Highly Raman-enhancing substrates based on silver nanoparticle arrays with tunable sub-10 nm gaps. Adv. Mater.18, 491–495. 10.1002/adma.200501875 (2006). 10.1002/adma.200501875 [DOI] [Google Scholar]
- 26.Morháč, M. & Matoušek, V. Peak clipping algorithms for background estimation in spectroscopic data. Appl. Spectrosc.62, 91–106. 10.1366/000370208783412762 (2008). 10.1366/000370208783412762 [DOI] [PubMed] [Google Scholar]
- 27.Stead, M. B. et al. RNA snap ™: A rapid, quantitative and inexpensive, method for isolating total RNA from bacteria. Nucleic Acids Res.40, e156. 10.1093/nar/gks680 (2012). 10.1093/nar/gks680 [DOI] [PMC free article] [PubMed] [Google Scholar]
- 28.Liu, R. et al. NIR-SERS studies of DNA and DNA bases attached on polyvinyl alcohol (PVA) protected silver grass-like nanostructures. Vib. Spectrosc.67, 71–79. 10.1016/j.vibspec.2013.04.002 (2013). 10.1016/j.vibspec.2013.04.002 [DOI] [Google Scholar]
- 29.Kubryk, P., Niessner, R. & Ivleva, N. P. The origin of the band at around 730 cm−1 in the SERS spectra of bacteria: A stable isotope approach. Analyst.141, 2874–2878. 10.1039/c6an00306k (2016). 10.1039/c6an00306k [DOI] [PubMed] [Google Scholar]
- 30.Madzharova, F., Heiner, Z., Gühlke, M. & Kneipp, J. Surface-enhanced hyper-Raman spectra of adenine, guanine, cytosine, thymine, and uracil. J. Phys. Chem. C.120, 15415–15423. 10.1021/acs.jpcc.6b02753 (2016). 10.1021/acs.jpcc.6b02753 [DOI] [PMC free article] [PubMed] [Google Scholar]
- 31.Chisanga, M., Muhamadali, H., Ellis, D. I. & Goodacre, R. Surface-enhanced Raman scattering (SERS) in microbiology: Illumination and enhancement of the microbial world. Appl. Spectrosc.72, 987–1000. 10.1177/0003702818764672 (2018). 10.1177/0003702818764672 [DOI] [PubMed] [Google Scholar]
- 32.Nowicka, A. B., Czaplicka, M., Szymborski, T. & Kamińska, A. Combined negative dielectrophoresis with a flexible SERS platform as a novel strategy for rapid detection and identification of bacteria. Anal. Bioanal. Chem.413, 2007–2020. 10.1007/s00216-021-03169-y (2021). 10.1007/s00216-021-03169-y [DOI] [PubMed] [Google Scholar]
- 33.von Raben, K. U., Chang, R. K., Laube, B. L. & Barber, P. W. Wavelength dependence of surface-enhanced Raman scattering from Ag colloids with adsorbed CN- complexes, SO32-, and pyridine. J. Phys. Chem.88, 5290–5296 (1984). 10.1021/j150666a036 [DOI] [Google Scholar]
- 34.Mandrile, L. et al. Direct quantification of sulfur dioxide in wine by surface enhanced Raman spectroscopy. Food Chem.326, 127009. 10.1016/j.foodchem.2020.127009 (2020). 10.1016/j.foodchem.2020.127009 [DOI] [PubMed] [Google Scholar]
- 35.Valmalette, J.-C., Tan, Z., Abe, H. & Ohara, S. Raman scattering of linear chains of strongly coupled Ag nanoparticles on SWCNTs. Sci. Rep.4, 5238. 10.1038/srep05238 (2014). 10.1038/srep05238 [DOI] [PMC free article] [PubMed] [Google Scholar]
- 36.Chowdhury, J., Mukherjee, K. M. & Misra, T. N. A pH dependent surface-enhanced Raman scattering study of hypoxanthine. J. Raman Spectrosc.31, 427–431. 10.1002/1097-4555(200005)31:5%3c427::AID-JRS553%3e3.0.CO;2-L (2000). [DOI] [Google Scholar]
- 37.Kim, S. K., Joo, T. H., Suh, S. W. & Kim, M. S. Surface-enhanced Raman scattering (SERS) of nucleic acid components in silver sol: Adenine series. J. Raman Spectrosc.17, 381–386. 10.1002/jrs.1250170503 (1986). 10.1002/jrs.1250170503 [DOI] [Google Scholar]
- 38.Hochstadt-Ozer, J. & Stadtman, E. R. The regulation of purine utilization in bacteria. III. The involvement of purine phosphoribosyltransferases in the uptake of adenine and other nucleic acid precursors by intact resting cells. J. Biol. Chem.246, 5312–5320 (1971). 10.1016/S0021-9258(18)61908-8 [DOI] [PubMed] [Google Scholar]
- 39.Smith, J. D. & Markham, R. Chromatographic studies on nucleic acids. 2. The quantitative analysis of ribonucleic acids. Biochem. J.46, 509–513. 10.1042/bj0460509 (1950). 10.1042/bj0460509 [DOI] [PMC free article] [PubMed] [Google Scholar]
- 40.Huang, Q., Kaiser, K. & Benner, R. A simple high performance liquid chromatography method for the measurement of nucleobases and the RNA and DNA content of cellular material. Limnol. Oceanogr-Meth.10, 608–616. 10.4319/lom.2012.10.608 (2012). 10.4319/lom.2012.10.608 [DOI] [Google Scholar]
- 41.Turnbull, K. J., Dzhygyr, I., Lindemose, S., Hauryliuk, V. & Roghanian, M. Intramolecular interactions dominate the autoregulation of Escherichia coli stringent factor RelA. Front. Microbiol.10, 1966. 10.3389/fmicb.2019.01966 (2019). 10.3389/fmicb.2019.01966 [DOI] [PMC free article] [PubMed] [Google Scholar]
- 42.Wang, B., Grant, R. A. & Laub, M. T. ppGpp coordinates nucleotide and amino-acid synthesis in E. coli during starvation. Mol. Cell.80, 29-42.e10. 10.1016/j.molcel.2020.08.005 (2020). 10.1016/j.molcel.2020.08.005 [DOI] [PMC free article] [PubMed] [Google Scholar]
- 43.Llorens, J. M. N., Tormo, A. & Martínez-García, E. Stationary phase in gram-negative bacteria. FEMS Microbiol. Rev.34, 476–495. 10.1111/j.1574-6976.2010.00213.x (2010). 10.1111/j.1574-6976.2010.00213.x [DOI] [PubMed] [Google Scholar]
- 44.Papakostas, K., Botou, M. & Frillingos, S. Functional identification of the hypoxanthine/guanine transporters YjcD and YgfQ and the adenine transporters PurP and YicO of Escherichia coli K-12. J. Biol. Chem.288, 36827–36840. 10.1074/jbc.M113.523340 (2013). 10.1074/jbc.M113.523340 [DOI] [PMC free article] [PubMed] [Google Scholar]
- 45.Nygaard, P. & Saxild, H. H. The purine efflux pump PbuE in Bacillus subtilis modulates expression of the PurR and G-box (XptR) regulons by adjusting the purine base pool size. J. Bacteriol.187, 791–794. 10.1128/JB.187.2.791-794.2005 (2005). 10.1128/JB.187.2.791-794.2005 [DOI] [PMC free article] [PubMed] [Google Scholar]
Associated Data
This section collects any data citations, data availability statements, or supplementary materials included in this article.
Supplementary Materials
Data Availability Statement
All data generated during this study are included in the article and its supplementary files or are available from the corresponding author on reasonable request.


