Abstract
Axial velocity gradient (AVG) in the optical coherence tomography angiography (OCTA) signal affects measurement accuracy when the flow is not perpendicular to the scanning beam. We developed a dual beam OCTA method to decouple the contribution of AVG from the decorrelation signal. Decoupling is first verified by phantom experiments which reduces measurement uncertainty from 1.5 to 0.7% (standard deviation). We also tested the method in human skin in vivo and the results indicate that the contribution of AVG to decorrelation signal is reduced.
Subject terms: Optical techniques, Optical metrology
Introduction
Optical Coherence Tomography (OCT) is a non-invasive, noncontact, label-free, three-dimensional, and real-time imaging technology that has been established as a gold standard in ophthalmology. OCT angiography (OCTA) is a functional extension of OCT that provides high contrast images of microvasculature and blood flow information. Generally, OCTA signal is created by correlating the successive OCT scans at the same sample positions1–3. Attributed to the potential clinical benefits in screening, diagnosis and management of ocular diseases, there has been rapid development in technology and extensive clinical applications of OCT and OCTA in recent years.
Of particular significance for studying various retina pathologies is the measurement of retinal blood flow4. Doppler OCT method has been used for blood flow velocimetry, however, is also limited to such as its inability to directly measure the flow perpendicular to the scanning beam5. Besides, OCTA signals also correlate with blood flow velocity and can be used for blood flow velocimetry according to dynamic light scattering (DLS) theories6. OCTA offers the advantages over Doppler OCT as could measure flow perpendicular to the scanning beam directly3. Nevertheless, the Doppler angle, the angle between the scanning beam and the sample, influences the measurement accuracy7. An analytic model is formulated to attribute the dependence of autocorrelation on the Doppler angle to axial velocity gradient (AVG)8. This work further points out that it is not possible to accurately measure the velocity of particles from a single DLS measurement when AVG is present, but possible to apply repeated measurements to decouple the AVG contributions, like those with different optical resolutions or introducing a scanning bias8.
Repeated measurements with different optical resolutions or introducing a scanning bias increases acquisition time for the same field of view regarding to the standard OCTA. In addition, the accuracy is subject to motion artefacts as both image position and apparent flow velocity might be altered by eye motion during repeated measurements. Few-Mode OCT9 leverages on a novel modally-specific photonic lantern (MSPL) to generate two foci of different transverse point spread functions, which enables simultaneous measurement with different optical resolutions10.
The purpose of this research is to provide a general yet low-cost solution to simultaneously imaging with two different optical resolutions. The requirements for the foci of the two beams for decoupling AVG are deduced following the previously established model8. Dual beam OCT system is then developed according to the requirements. The primary novelty of our study lies in the application of a simpler and more cost-effective solution to eliminate the influence of AVG in OCTA blood flow velocimetry. The system requires only one spectrometer and off-the shelf optics, so that it costs much less than previous dual-beam or multi-beam solutions11–13. In addition, it does not rely on special optics (such as MSPL) and is generally applicable for any centre wavelength and spectral width. It is generally practical method and easy to repeat/reproduce.
Method
Analytical model for decoupling
Generally, without normalization, the first order autocorrelation representing OCTA signal is given by8: , where is the complex back scattering signal at the position , () denotes the position of the voxel of sampling. Assuming a Gaussian PSF, the first order autocorrelation could be further derived8:
| 1 |
where is the diffusive coefficient and denotes the diffusion term, is the centre wave number of the power spectrum and is the refractive index. , and are the velocity components of the mean velocity in a single voxel, is the lateral resolutions in x and y direction and is the axial resolution in z direction, and characterizes the axial velocity change per axial resolution. is the gradient operator, and are factors that arise during an approximation approach in8, and the mean voxel velocity and the magnitude of a modified gradient operator are defined as Eq. (2)8.
| 2 |
By experimental results8, only quadratic terms, and , in contribute much greater than the Doppler term and linear term 8. The dual beam OCT system uses two scanning beams of different beam sizes. Based on the simplified in \* MERGEFORMAT (3), the magnitudes of the autocorrelation signals, and , can be expressed as Eq. (4). The contribution of AVG in the entire autocorrelation signal can be extracted from \* MERGEFORMAT (3) as . This AVG contributed autocorrelation term ranges in (0,1]. Hence, ideally for a horizontal flow containing no AVG, . With defining , the AVG terms of and are equal according to Eq. (5). By setting is a function of blood flow velocity without influence of AVG as Eq. (6).
| 3 |
| 4 |
| 5 |
| 6 |
where the spatial derivatives of are assumed to be constants.
Dual-beam OCT system and experimental setup
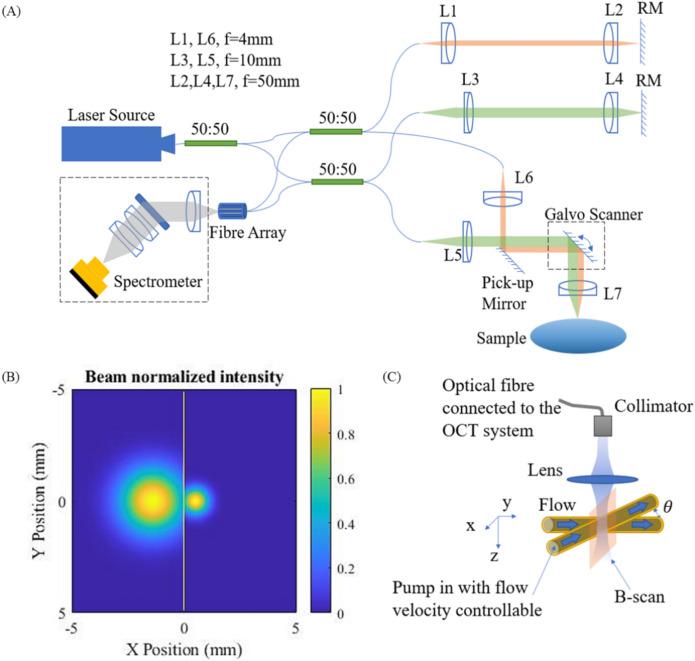
The dual beam OCT system is consisted of two Michelson interferometers sharing the same spectrometer Fig. 1A. The light source (SUPERLUM M-T-850-HP) provides illumination over an 80 nm spectral width (2 of 3 channels switched off) centred at 850 nm. The light is guided by 50:50 fibre couplers. The two sample beams are aligned to be parallel with a 1.83 mm transverse displacement using a reflective mirror (RM). The collimated sample beam diameters are simulated to be 1.05 mm and 2.62 mm measured at 1% power level, respectively (Fig. 1B), and the ratios of the power loss due to the aperture division by the pick-up mirror are simulated to be 9.97% and 8.67% respectively. The single-trip optical pathlength differences between the two sample beams is adjusted to be 1.2 mm. In the spectrometer, two input fibres are mounted with a V-groove with a spacing of 127 μm13. The collimated beams are dispersed by a 1765 lines/mm grating (PING-Sample-025, Ibsen photonics) and focused by a multi-element camera lens (focal length 176.8 mm) onto a line camera (EV71YO1SCL2010-BA3, Octoplus). The total photon-to-electron conversion efficiency of the spectrometer was measured to be 0.32, which includes the diffraction efficiency of the grating and quantum efficiency (∼ 47%) of the camera sensor. The total ranging depth is 5.1 mm in air and the signal intensity roll-off is 2.68 dB/mm from DC to the − 6 dB point. Spectra are digitized at 12-bit resolution and transferred to the computer through camera link cables and an image acquisition board (KBN-PCE-CL4-F, Bitflow).
Figure 1.
(A) The OCT schematic. RM: reflective mirror. f is focal length; (B) Normalized beam profile on the pick-up mirror in sample path with yellow line (x = 0) marking the mirror edge position, (C) Phantom experiment design.
Here in sample arm, we use H (light path: L5 → L7) to represent the channel of the narrower illumination beam and L (light path: L6 → L7) to represent the channel of the wider illumination beam. Then the bright field signals with larger and smaller beam sizes are associated with the OCT channel configurations as LL (light path: L6 → L7 → L6) and HH (light path: L5 → L7 → L5), and the dark field signal is associated with the OCT channel configuration HL (light path: L5 → L7 → L6 or L5 → L7 → L6). A Gaussian window is applied to the spectrum to satisfy . As the object being sampled is 5% intralipid solution and human skin dermal tissues, the axial resolutions are measured with refractive indices of 1.43 (determined by the ratio of optical path lengths of the empty and filled tube) and 1.3814 respectively (Tables 1, 2). Both dark field signals are included into one single OCT channel due to identical resolution.
Table 1.
Spatial resolutions for OCT channels ( and ).
| OCT channel configuration | (µm) | (µm) | |||
|---|---|---|---|---|---|
| Theoretical | Measured | Theoretical | Measured | ||
| HH | 14.71 | 15.02 | 10.40 | 10.39 | – |
| HL | 19.31 | 19.40 | 13.65 | 13.68 | |
| LL | 36.76 | 36.92 | 25.99 | 26.05 | |
Table 2.
Gaussian window widths and respective measured axial resolutions.
| OCT channel configuration | Window Width (nm) | (µm) in air | Window Width (nm) | (µm) n = 1.43 | Window Width (nm) | (µm) n = 1.38 |
|---|---|---|---|---|---|---|
| HH | 16.8 | 10.39 | 11.2 | 10.41 | 11.7 | 10.38 |
| HL | 11.3 | 13.68 | 8.5 | 13.62 | 8.8 | 13.64 |
| LL | 5.9 | 26.05 | 4.5 | 25.98 | 4.6 | 26.10 |
In our method, the spectrometer is equipped with two input fibres instead of the single fibre typically used in standard OCT spectrometers. Each fibre carries interference signals from one of the two reference arms. The tips of the two fibres are separated along the direction of the linear sensor with a spacing of 256 µm, ensuring that the linear sensor captures the full spectral range from both fibre tips. Consequently, there is a lateral shift between the two interferograms on the linear sensor, given by 256 µm , where is the magnification of the camera lens. In our spectrometer, this lateral shift corresponds to 70 pixels. This method is detailed in the study by Wang et al.13, which describes the implementation of multi-channel OCT using a single spectrometer13.
The model is validated through a phantom experiment and a skin vasculature image experiment. In the phantom experiment as shown in Fig. 1C, The blood flow is simulated by pumping (pump model: LSP01-2A) the intralipid solution (5% concentration diluted from 20% Sigma-Aldrich emulsion solution) with a predetermined flow rate in a glass capillary tube with internal diameter of 0.129 mm. is the inclination angle of the flow. The average flow speed is set as 0, 0.5, 1, 1.5, 2, 2.5 and 3 mm/s according to the flow rate and the nominal cross-sectional area of the tube lumen, and is set to be and .
To evaluate the available autocorrelation signal range for velocimetry, the dynamic range (DR) is defined referring to15,16 as the ratio between difference of the measurable average maximum and minimum autocorrelations ( and ) and the standard deviation of the autocorrelation measurement. Based on the measurements on the average saturated autocorrelation , the average autocorrelation value with 0 flow velocity and the standard deviation of the autocorrelation values of the data set , DR is expressed as Eq. (7):
| 7 |
The skin vasculatures at the palm side of the proximal interphalangeal joint of the middle finger in a healthy human subject is imaged. The optical power incident on the skin is below American National Standards Institute exposure limit for skin safety17. In the data processing for the skin vasculature image, only bright-field signals are used for a larger DR of decoupled signal based on the results in phantom experiment.
To evaluate the influence of AVG, the AVG contribution is defined from7 as:
| 8 |
where and represent the original autocorrelation signal obtained for blood flow at non-zero and inclination angle. Since this AVG contribution is calculated based on a single vessel with same flowing speed by in different inclination angles, which is not feasible for real vessel in our case, we modify the AVG contribution as following:
| 9 |
where is the original autocorrelation signal before decoupling. In the modified version the same vessel before and after decoupling is evaluated. Since the difference in autocorrelation caused by inclination is only included in AVG term, is equivalent to the adjusted to inclination angle. The phantom experiment data is firstly used to verify this modification before evaluating on in-vivo images.
is also evaluated to validate the AVG influence. Based on Eqs. (4), (6) and , it is possible to use original autocorrelation signals measured in HH and LL channels, and , to obtain by following equations:
| 10 |
| 11 |
| 12 |
To relates with AVG contribution modified (e.g. HH), we modify the AVG contribution as:
| 13 |
We employed MB scanning mode18 at the A-line rate of 10 kHz for the phantom experiment. With 6 A-scans per image position, interscan time intervals (0.1, 0.2, 0.3, 0.4 and 0.5 ms) are achieved. We acquired 400 B-frames which are averaged to improve signal-to-noise ratio (SNR). There were 128 A-lines per B-frame with a transverse step size 4.36 µm. The MB scanning mode was also employed in the skin experiment with an A-line rate of 5 kHz and 6 A-scans per image position yielding a 0.2 ms interscan time. There were 250 A-lines per B-frame and 250 B-frames per scan volume, so that the total acquisition time is 75 s. With 4.36 µm transverse step size, field of view is 1.125 mm × 1.125 mm. The total optical power on the sample is measured as 0.3 mW. Based on bright field signals detected by the spectrometer, the sensitivities are measured to be 101.29 dB and 101.00 dB for OCT channels of HH and LL respectively at 5 kHz A-scan rate (102.63 dB and 101.69 dB theoretically). The dark field signal sensitivity could be assessed by subtracting the signal difference between the bright field signal and dark field signal from the bright field signal sensitivity. Thereby, the dark field signal sensitivity is estimated to be 102.08 dB and 101.06 dB respectively. The − 6 dB sensitivity roll-off in skin is measured as 1.77 mm.
Ethnical approval
All the methods were carried out in accordance with relevant guidelines and regulations. All experimental protocols included in this study were approved by the Institutional Review Board (IRB) of Nanyang Technological University, Singapore (IRB-2016-10-015).
Informed consent
The informed consent was obtained from the subject.
Language enhancement using generative pre-trained transformer (GPT)
In the development of this manuscript, we utilized the Generative Pre-trained Transformer (GPT) to enhance the linguistic quality of our text. This application of GPT was strictly limited to improving the clarity, coherence, and readability of our narrative, ensuring that our findings and discussions were communicated effectively. It is important to clarify that GPT’s role was auxiliary, focused on language enhancement without influencing the study’s scientific content, data interpretation, or conclusions.
Results
Phantom experiment
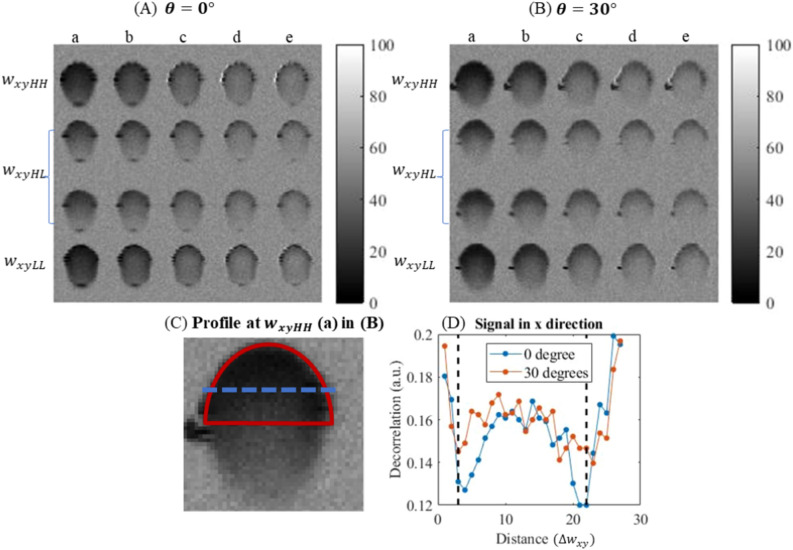
As shown in Fig. 2A,B, the decorrelation OCTA images of flow are obtained by Split-Spectrum Amplitude-Decorrelation Angiography algorithm3 with interscan time () from 0.1 to 0.5 ms (). The intensity of the decorrelation images from 0 to 1 is normalized into 0 to 255 grayscales. The second and third rows in Fig. 2 (A & B) represent dark field signals created through different light paths. Although they have the same spot size and interscan time, the difference lies in the illumination and detection paths (L5 → L7 → L6 and L6 → L7 → L5), resulting in two distinct dark field signals encoded into separate rows. Only the upper half of the tube region (red D-shape region in Fig. 2C) is chosen for decorrelation measurement since the OCTA signal at the lower half of the tube region may not accurately reflect velocity due to multiple scattering artefacts. However, the decorrelation profile in x direction (Fig. 2D) does not match the finding in19 which shows that the decorrelation drops from the lumen edge to the centre.
Figure 2.
OCTA decorrelation images in x–z plane obtained when is in (A) and in (B), with 1 mm/s flow speed. Rows from top to bottom are of the 3 spot sizes , and . Column a–e: 0.1 ms, 0.2 ms, 0.3 ms, 0.4 ms and 0.5 ms. (C) D-shaped upper region for data analysis. (D) Flow profile in the horizontal direction along the blue dashed line in (C). Vertical dash lines in (D) mark the position of capillary tube inner edge. ‘Distance ()’ refers to the lateral distance in the image, measured in units of step size .
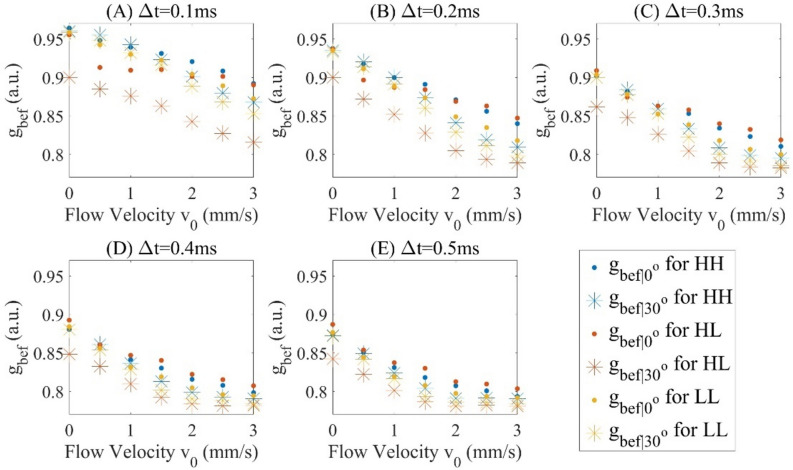
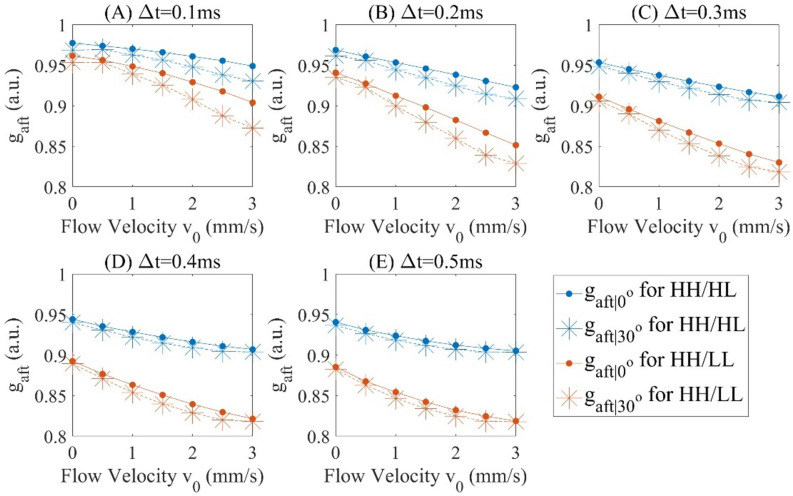
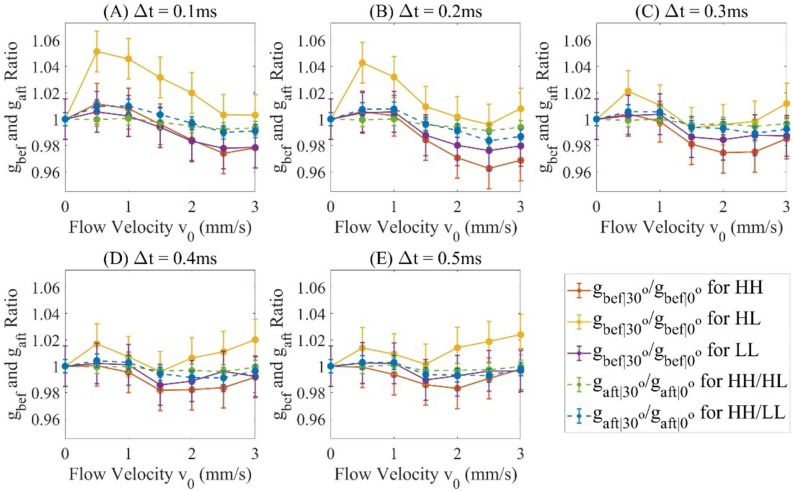
For each of the experimental conditions shown in Fig. 2A, B (angle, interscan time and beam size), the decorrelation signals in the D-shape region of each cross-sectional image are averaged, and this averaged 5 decorrelations is again averaged over 400 cross sectional images. We assume is the original averaged autocorrelation signals acquired and is the averaged decoupled autocorrelation signals, then and are for and and are for respectively, which are measured in Figs. 3, Fig. 4. The comparison between and verifies the effect of decoupling as shown in Fig. 5 with offset decorrelation (when no flow is applied) subtracted. The ratio is averaged over all the interscan time and flow velocities () to be 0.9900, 1.0118 and 0.9935, and standard deviations 0.0123, 0.0147 and 0.0090 for HH, and LL configurations (Tables 1, 2) respectively, which agree with Eq. (2) that AVG magnitude is proportional to spot size. is theoretically to be 1, while is measured with mean values 0.9975 and 0.9977, and standard deviations 0.0027 and 0.0068 for case and for all interscan time and flow velocities, leading to an uncertainty of 0.7% based on the maximum standard deviation. Comparing to , has its mean values averagely closer to 1 with standard deviations at least 2 times lower.
Figure 3.
and at interscan time () (A) 0.1 ms, (B) 0.2 ms, (C) 0.3 ms, (D) 0.4 ms and (E) 0.5 ms.
Figure 4.
and at interscan time () (A) 0.1 ms, (B) 0.2 ms, (C) 0.3 ms, (D) 0.4 ms and (E) 0.5 ms.
Figure 5.
Comparative analysis for decoupling at interscan time () (A) 0.1 ms, (B) 0.2 ms, (C) 0.3 ms, (D) 0.4 ms and (E) 0.5 ms. Error bars indicate standard deviation.
By Eq. (6), and are monotonically decreasing for an increasing flow speed and interscan time (as shown in Fig. 4). Based on Fig. 3, the decorrelation signals are found to reach saturation level when interscan time reaches 0.4 ms and above and flow velocity reaches 3 mm/s. To further assess DR in Fig. 6, the data originally presented in Figs. 3, 4 is reorganized to consider the product of interscan time and flow velocity, termed as the interscan distance. Based on Eq. (7), the DR are measured in Table 3. The DR is measured 1.84 dB higher for the lower value ().
Figure 6.
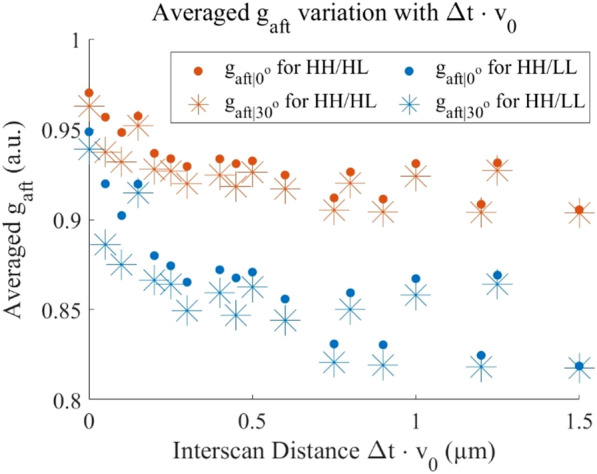
Average and versus interscan distance ().
Table 3.
DR Measurements for (A) , (B) , (C) , (D) .
| Channel configuration used in decoupling | (dB) | |||
|---|---|---|---|---|
| (A) | ||||
| 0.905 | 0.970 | 0.013 | 13.98 | |
| 0.819 | 0.949 | 0.011 | 21.45 | |
| (B) | ||||
| 0.903 | 0.963 | 0.018 | 10.46 | |
| 0.818 | 0.939 | 0.015 | 18.13 | |
| (C) | ||||
| 0.806 | 0.929 | 0.010 | 21.80 | |
| 0.810 | 0.888 | 0.010 | 17.84 | |
| 0.810 | 0.935 | 0.010 | 21.86 | |
| (D) | ||||
| 0.786 | 0.912 | 0.014 | 19.06 | |
| 0.801 | 0.874 | 0.014 | 14.34 | |
| 0.787 | 0.915 | 0.014 | 19.28 | |
Skin vasculature imaging
In the OCTA images of the skin, we identified two blood vessel segments (Fig. 7A–E) aligned along the x axis. The relative flow velocity map is presented in Fig. 7F. One segment is inclined with respect to the x–y plane (Fig. 7B,C), and the other approximately perpendicular to the input beam () (Fig. 7D,E). We measured the inclination angle of blood vessels by outlining the brightest pixels in the vessel (the vessel path included in the red box in Fig. 7 (B)), fitting a straight line in the x–z plane, and measuring the angle between this line and the horizontal direction, with the assumption that the short vessel segment under investigation is straight and the tissue average refractive index is 1.38. Background signal (location marked by the blue line in Fig. 7B) is subtracted before decoupling process. For convenience, only signals acquired by light spots with sizes of and are considered for a greatest DR.
Figure 7.
(A) En-face OCTA images of blood vessel in the skin in-vivo including a vessel with (red box) a vessel with (yellow box). (B) and (C) are images in y–z plane and x–z planes, corresponding to the red box in (A) respectively, and (D) and (E) are images in y–z plane and x–z corresponding to the yellow box respectively. (F) is the relative flow velocity map for , where white arrows point to vessels with high flow speed (red region), and white chevrons point to vessels with slow flow speed (blue-green region). Field of view: 1.125 mm 1.125 mm, and depth of field: 1.1 mm.
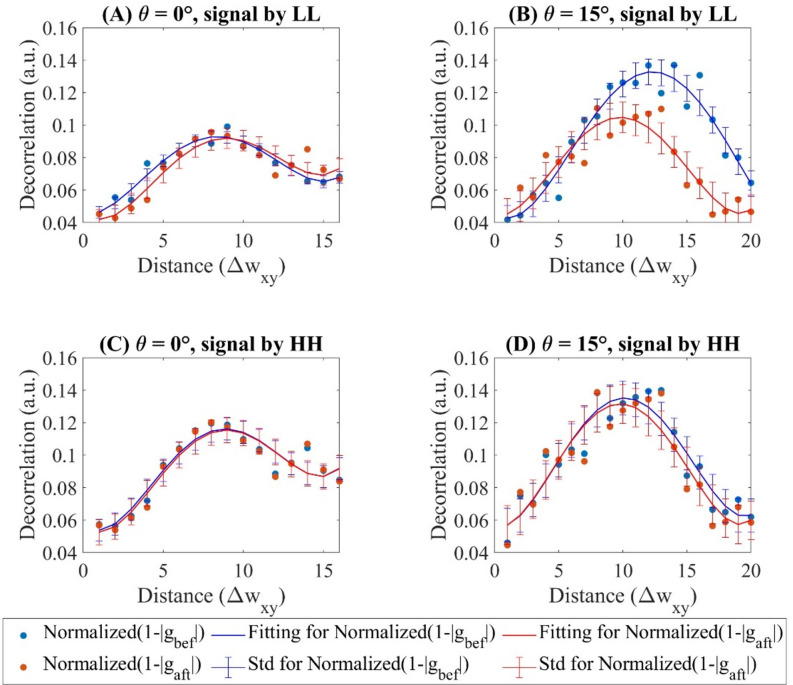
The transverse decorrelation profiles of the above-mentioned two vessel segments are plotted in Fig. 8. The denominator in the decoupling equation (Eq. 6), , is not equal to 1. To address this, we normalized the intensity by aligning the mean values of the images in the LL and HH channels. Specifically, we multiplied the mean values to ensure that the mean image intensity of matches for both LL and HH channels in the case. Table 4 provides a summary of the measurements from Fig. 8 and presents the average change in normalized autocorrelation due to decoupling, denoted as . Given that the AVG is present in the signal when , the value for is expected to be higher than that for after decoupling. The measurement for is 4.17 times higher for than by , with the uncertainty (measured by standard deviation) of being 2.8 times greater. By , is 5 times higher with an uncertainty 4 times greater for compared to . Since for is lower than , the AVG influence on images with higher transverse resolution is smaller, which agrees with Eq. (2).
Figure 8.
The normalized decorrelation profile acquired for the flow in Fig. 7 of both before and after decoupling for (A) for signal acquired by , (B) for signal acquired by , (C) for signal acquired by and (D) for signal acquired by . Distance () refers to the lateral distance in the image, measured in units of transverse scan step size . SD is standard deviation in short.
Table 4.
The normalized autocorrelation before and after decoupling (mean standard deviation), measured AVG contribution (mean) and (mean).
| channel | (%) | ||||
|---|---|---|---|---|---|
| 1.000 | |||||
| 0.918 | |||||
| 1.000 | |||||
| 0.986 |
The phantom experiment data is used to validate our modified AVG contribution model by which results in 0.9967 and 0.9953 for HH and LL with normalized. The evaluation results are presented in 3rd column of Table 4. Comparing to AVG contribution in the study7, where their AVG contribution is approximately 8% for inclination referring to their Fig. 5 and their calculation (9.9% for 30° inclination), ours are 45.6% for LL and 8.8% for HH for inclination. According to , the AVG is greater for a lower resolution, which agrees with our experimental results.
could be calculated for both HH and LL in-vivo images respectively. Our measurements for LL and HH with inclination are 0.918 and 0.986, while the above study has for Doppler angle (obtained by ), which matches the finding of AVG contribution part.
Discussion
It is known that the slope of the autocorrelation signal is inversely proportional to the spot size, which holds true in the decoupled autocorrelation signal. Based on Eq. (6), an equivalent transverse spot size of decoupled decorrelation signal can be derived as Eq. (14):
| 14 |
Accordingly, the equivalent transverse spot sizes for decoupled channel and are 18.06 μm and 14.90 μm. The corresponding difference in slope are well reflective in Fig. 4.
After decoupling, the DR is lower comparing to that before decoupling in general (Table 3). This is expected since the measurement uncertainty, which can be evaluated by the standard deviation , is higher due to error propagation in the decoupling process. One of the other observations is that the offset of dark-field (HL) decorrelation is significantly higher than those of the bright field (HH and LL). This is probably due to the higher random motion between the illumination and detection pin hole. This is one of reason we chose not to use dark-field signals to decouple AVG and measure blood flow.
In the context of imaging the skin vasculature, where both high-resolution () and low-resolution () spots share identical sampling densities (step size < 0.5 ), the same artifacts detected in20 emerge in the images captured by as compared to those obtained by : the vessels, especially small vessels such as capillaries, will appear larger in the angiograms, and this may lead to a higher value when using a metric such as vessel density, the percentage area occupied by flow pixels on the OCT angiogram.
The A-line rate chosen for this study (5 kHz) is for convenience purpose only. Slow scanning system is vulnerable to a SNR drop due to fringe washout21. It also increases the total sampling time and easily saturates the images acquired for fast blood flow. Instead of MB mode scanning, repeated B-scan imaging protocols are normally applied to create OCTA images as less vulnerable to eye motion due to a shorter total sampling time. For artery and vein blood flow velocimetry (fast flow as shown in22), a high A-line rate is preferred, which is challenging to Spectral Domain-OCT system due to significant sensitivity degradation beyond 80 kHz23. Swept Source-OCT is a solution as the A-line rate up to 400 kHz while preserving a good sensitivity2, but higher in cost. Nevertheless, other Spectral Domain-OCT based fast scan method such as21 is also suggested as lower system cost while SNR preserved solutions.
The standard deviation measured for decorrelation values before decoupling is not significantly different from the result in the previous study about high dynamic range (HDR)-OCTA (Fig. 6 in15). Both and the standard deviation (SD) mentioned in above study are normalized values. Hence after restoring from the normalized values, the original SD value of the HDR-OCTA study is not significantly different form our results. Hence, could exclude the influence of normalization where . For HDR-OCTA, , and for our system, . The uncertainty measured for original decorrelation is similar to the HDR-OCTA under the same condition. The uncertainties in in-vivo images are larger than that of the phantom experiment. Firstly, it is due to the limited amount of data for averaging. Secondly, the ground truth value might possibly be varying during the image acquisition due to heterogeneity of the blood scattering behaviour and the hand motion.
A scan-bias method24 employs 8 OCTA scan biases to fit three independent parameters for the curve of decay rate in OCTA signal versus scan-biased velocity. According to the analytical model, the corresponding scan velocity value equals the real flow velocity when the decay rate reaches its minimum. The AVG is included in one of these independent fitting parameters and is bypassed when solving for the flow velocity. In comparison to this scan-bias method, our method exhibits several key differences:
Our method requires only 2 scan sessions at the same sample position to construct 2 OCTA images with different resolutions. This is achieved by utilizing 2 scanning beams with individual resolutions scanning simultaneously. Normally, 2 OCT scans are the minimum required to construct 1 OCTA image. With our dual-beam setup, 4 OCT scans are created within 2 scanning sessions, resulting in the construction of 2 OCTA images. In contrast, the scan-bias method necessitates 9 scans to create 8 different scan-biased OCTA images. Consequently, our method completes the acquisition process much faster, making it less susceptible to subject motion.
The scan-bias method has been validated solely through phantom experiments. However, it may not be suitable for widefield in-vivo imaging due to the excessively long acquisition time required.
The decorrelation is based on the dynamic back scattering (DBS) from the sample. Both DBS and dynamic forward scattering (DFS) are types of DLS, but DFS is immune to AVG, and more sensitive and linearly related to blood flow comparing than DBS19. However, DBS has an advantage over DFS when measuring on the flow in retinal vessels on the retinal pigment epithelium (RPE) layer. When measuring the flow in retinal vessels, DFS signal is acquired from the projection of the flow on the RPE layer, a layer below the retinal vessels highly scattering and avascular. Thus, the DFS is possibly unattainable for a less reflective RPE due to certain diseases, such as early age-related macular degeneration progression25, or general less reflective RPE.
There are limitations of this design. First, the interferograms from HH, LL and HL paths have to be optical pathlength delay (OPD) encoded and separated to avoid overlapping the OPD domain, so that the effective ranging depth of interferograms of each path are much smaller than the total ranging depth. Second limitation is that the setup with double reference arms and single spectrometer introduces higher system shot noise13,25 which is directly proportional to reference power. The number of shot noise electrons is given by:
| 15 |
where is the efficiency of the spectrometer, comprising the diffraction grating efficiency and losses due to optical components, determines the number of pixels of the line array CCD, and and are the reflectivity in the sample and reference arm of a Michelson interferometer, assuming when characterizing the system. and are the part of the input power in each arm. is the total output power of the light source, including the power of all frequencies, and is evenly distributed to the pixels. Since signals are received from 2 channels, they reach the CCD at the same time when guided into the spectrometer by the fibre array. Thus, 2 times the spectral bandwidth is widened on each pixel on the CCD. Then the shot noise is increased by according to13. This limitation could only be solved by adding an extra spectrometer, then higher system cost needs to be considered.
Moreover, recent advancements in deep learning methods for image acquisition and processing, as demonstrated in the study by Liao et al.26, provide promising avenues for enhancing the accuracy and efficiency of OCTA. Integrating such deep learning techniques with our current approach could further optimize the image acquisition process, leading to improved measurement accuracy and more robust validation of the decoupling method. This integration will be a significant basis for future research, potentially opening new possibilities for the application of OCTA in clinical and research settings.
Conclusion
We introduce a method based on a dual beam OCT to decouple the AVG influence in OCTA for blood flow velocimetry. By choosing appropriate spot sizes of the two sample beams. We show the theoretical basis for cancelling the AVG term. Verification is carried out by both phantom and skin vasculature imaging experiments. By applying decoupling on the autocorrelation model, both phantom experiment and in-vivo imaging of skin vasculature demonstrated a reduction in influence attributable to AVG. These advancements offer valuable insights for interpreting blood flow velocities in clinical OCTA applications.
Acknowledgements
This research is supported by the Singapore Ministry of Health's National Medical Research Council under its Open Fund Individual Research Grant (MOH-OFIRG19may-0009), Ministry of Education Singapore under its Academic Research Fund Tier 1 (RG35/22) and its Academic Research Funding Tier 2 (MOE-T2EP30120-0001).
Abbreviations
- OCT
Optical coherence tomography
- OCTA
Optical coherence tomography angiography
- DLS
Dynamic light scattering
- AVG
Axial velocity gradient
- MSPL
Modally-specific photonic lantern
- RM
Reflective mirror
- CCD
Charge-coupled device
- DR
Dynamic range
- SNR
Signal-to-noise ratio
- DBS
Dynamic back scattering
- DFS
Dynamic forward scattering
- RPE
Retinal pigment epithelium
- OPD
Optical path-length delay
- bef
(Quantities) before decoupling
- aft
(Quantities) after decoupling
- H
OCT channel with high resolution
- L
OCT channel with low resolution
- HH
Bright field channel with high resolution
- HL
Dark field channel
- LL
Bright field channel with low resolution
Author contributions
Z.X., Y.W. and L.L. conducted conceptual designed and theoretical calculation for the experimental setup. Z.X. setup and conducted experiments and analysed the results. X.C. setup the software platform essential for executing the experiment. K.L. setup the computer hardware infrastructure for the experiment. Z.X. and L.L. wrote the manuscript.
Data availability
The data that support the findings of this study are available from the corresponding authors upon reasonable request.
Competing interests
The authors declare no competing interests.
Footnotes
Publisher's note
Springer Nature remains neutral with regard to jurisdictional claims in published maps and institutional affiliations.
References
- 1.An, L. & Wang, R. K. In vivo volumetric imaging of vascular perfusion within human retina and choroids with optical micro-angiography. Opt. Express16(15), 11438. 10.1364/OE.16.011438 (2008). 10.1364/OE.16.011438 [DOI] [PubMed] [Google Scholar]
- 2.Spaide, R. F., Fujimoto, J. G., Waheed, N. K., Sadda, S. R. & Staurenghi, G. Optical coherence tomography angiography. Prog. Retin. Eye Res.64, 1–55. 10.1016/j.preteyeres.2017.11.003 (2018). 10.1016/j.preteyeres.2017.11.003 [DOI] [PMC free article] [PubMed] [Google Scholar]
- 3.Jia, Y. et al. Split-spectrum amplitude-decorrelation angiography with optical coherence tomography. Opt. Express20(4), 4710. 10.1364/OE.20.004710 (2012). 10.1364/OE.20.004710 [DOI] [PMC free article] [PubMed] [Google Scholar]
- 4.Drexler, W. & Fujimoto, J. G. Optical coherence tomography: Technology and applications. In Biological and Medical Physics, Biomedical Engineering (Springer, 2008). [Google Scholar]
- 5.Braaf, B. et al. OCT-based velocimetry for blood flow quantification. In High Resolution Imaging in Microscopy and Ophthalmology: New Frontiers in Biomedical Optics (ed. Bille, J. F.) (Springer, 2019). [PubMed] [Google Scholar]
- 6.Lee, J., Wu, W., Jiang, J. Y., Zhu, B. & Boas, D. A. Dynamic light scattering optical coherence tomography. Opt. Express20(20), 22262–22277 (2012). 10.1364/OE.20.022262 [DOI] [PMC free article] [PubMed] [Google Scholar]
- 7.Tokayer, J., Jia, Y., Dhalla, A.-H. & Huang, D. Blood flow velocity quantification using split-spectrum amplitude-decorrelation angiography with optical coherence tomography. Biomed. Opt. Express4(10), 1909. 10.1364/BOE.4.001909 (2013). 10.1364/BOE.4.001909 [DOI] [PMC free article] [PubMed] [Google Scholar]
- 8.Uribe-Patarroyo, N. & Bouma, B. E. Velocity gradients in spatially resolved laser Doppler flowmetry and dynamic light scattering with confocal and coherence gating. Phys. Rev. E94(2), 022604. 10.1103/PhysRevE.94.022604 (2016). 10.1103/PhysRevE.94.022604 [DOI] [PMC free article] [PubMed] [Google Scholar]
- 9.de Sivry-Houle, M. P. et al. All-fiber few-mode optical coherence tomography using a modally-specific photonic lantern. Biomed. Opt. Express12(9), 5704–5719. 10.1364/BOE.428101 (2021). 10.1364/BOE.428101 [DOI] [PMC free article] [PubMed] [Google Scholar]
- 10.Maltais-Tariant, R., Dehaes, M., & Boudoux, C. Exact measurement of transverse flow velocity using few-mode optical coherence tomography, in Optical Coherence Tomography and Coherence Domain Optical Methods in Biomedicine XXVII, PC123670G (2023). 10.1117/12.2652633
- 11.Wan, M. et al. Dual-beam delay-encoded all fiber Doppler optical coherence tomography for in vivo measurement of retinal blood flow. Chin. Opt. Lett.20(1), 1. 10.3788/COL202220.011701 (2022). 10.3788/COL202220.011701 [DOI] [Google Scholar]
- 12.Kim, Y., Lippok, N. & Vakoc, B. J. Multi-beam OCT imaging based on an integrated, free-space interferometer. Biomed. Opt. Express BOE12(1), 100–109. 10.1364/BOE.408703 (2021). 10.1364/BOE.408703 [DOI] [PMC free article] [PubMed] [Google Scholar]
- 13.Wang, Y. et al. Multi-channel spectral-domain optical coherence tomography using single spectrometer. Chin. Opt. Lett.21(5), 051102. 10.3788/COL202321.051102 (2023). 10.3788/COL202321.051102 [DOI] [Google Scholar]
- 14.Lister, T., Wright, P. A. & Chappell, P. H. Optical properties of human skin. JBO17(9), 090901. 10.1117/1.JBO.17.9.090901 (2012). 10.1117/1.JBO.17.9.090901 [DOI] [PubMed] [Google Scholar]
- 15.Wei, X. et al. High dynamic range optical coherence tomography angiography (HDR-OCTA). Biomed. Opt. Express10(7), 3560. 10.1364/BOE.10.003560 (2019). 10.1364/BOE.10.003560 [DOI] [PMC free article] [PubMed] [Google Scholar]
- 16.[PDF] Cmos Image Sensors Dynamic Range and Snr Enhancement via Statistical Signal Processing | Semantic Scholar (accessed 26 February 2024) [Online]. Available: https://www.semanticscholar.org/paper/Cmos-Image-Sensors-Dynamic-Range-and-Snr-via-Signal-Liu-Horowitz/3695505307a0b8fd21f4a8fd6d4384662d25b12b
- 17.“IEC 60825-1:2014 | IEC Webstore” (accessed 17 April 2023) [Online]. Available: https://webstore.iec.ch/publication/3587
- 18.Xu, J., Song, S., Li, Y. & Wang, R. K. Complex-based OCT angiography algorithm recovers microvascular information better than amplitude- or phase-based algorithms in phase-stable systems. Phys. Med. Biol.63(1), 015023. 10.1088/1361-6560/aa94bc (2017). 10.1088/1361-6560/aa94bc [DOI] [PMC free article] [PubMed] [Google Scholar]
- 19.Nam, A. S., Braaf, B. & Vakoc, B. J. Using the dynamic forward scattering signal for optical coherence tomography based blood flow quantification. Opt. Lett.47(12), 3083. 10.1364/OL.455475 (2022). 10.1364/OL.455475 [DOI] [PMC free article] [PubMed] [Google Scholar]
- 20.Su, J. P. et al. Calibration of optical coherence tomography angiography with a microfluidic chip. J. Biomed. Opt.21(08), 1. 10.1117/1.JBO.21.8.086015 (2016). 10.1117/1.JBO.21.8.086015 [DOI] [PMC free article] [PubMed] [Google Scholar]
- 21.Yun, S. H., Tearney, G. J., de Boer, J. F. & Bouma, B. E. Motion artifacts in optical coherence tomography with frequency-domain ranging. Opt. Express12(13), 2977–2998 (2004). 10.1364/OPEX.12.002977 [DOI] [PMC free article] [PubMed] [Google Scholar]
- 22.Dai, C., Liu, X., Zhang, H. F., Puliafito, C. A. & Jiao, S. Absolute retinal blood flow measurement with a dual-beam doppler optical coherence tomography. Invest. Ophthalmol. Vis. Sci.54(13), 7998. 10.1167/iovs.13-12318 (2013). 10.1167/iovs.13-12318 [DOI] [PMC free article] [PubMed] [Google Scholar]
- 23.Chen, S., Lin, K., Liu, L. Spectrally extended line field optical coherence tomography angiography, in Review, preprint (2021). 10.21203/rs.3.rs-1112611/v1
- 24.Huang, B. K. & Choma, M. A. Resolving directional ambiguity in dynamic light scattering-based transverse motion velocimetry in optical coherence tomography. Opt. Lett.39(3), 521. 10.1364/OL.39.000521 (2014). 10.1364/OL.39.000521 [DOI] [PMC free article] [PubMed] [Google Scholar]
- 25.Emamverdi, M., Nittala, M. G. & Sadda, S. R. Reflectivity of the retinal pigment epithelium in aging and early age-related macular degeneration. Investig. Ophthalmol. Vis. Sci.64(8), 2143 (2023). [Google Scholar]
- 26.Liao, J., Yang, S., Zhang, T., Li, C. & Huang, Z. Fast optical coherence tomography angiography image acquisition and reconstruction pipeline for skin application. Biomed. Opt. Express14(8), 3899. 10.1364/BOE.486933 (2023). 10.1364/BOE.486933 [DOI] [PMC free article] [PubMed] [Google Scholar]
Associated Data
This section collects any data citations, data availability statements, or supplementary materials included in this article.
Data Availability Statement
The data that support the findings of this study are available from the corresponding authors upon reasonable request.


